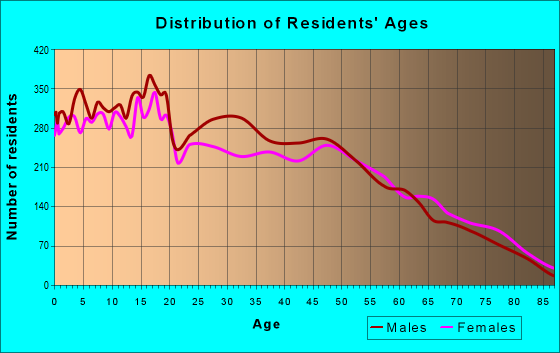
Estimated zip code population in 2022: 41,314 Zip code population in 2010: 37,073 Zip code population in 2000: 27,794
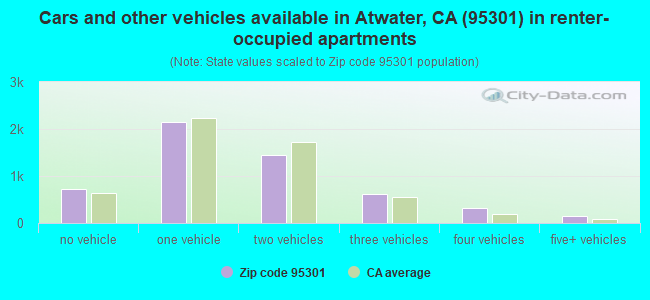
Houses and condos: 13,358 Renter-occupied apartments: 5,405
% of renters here:
41%
State:
44%
March 2022 cost of living index in zip code 95301: 94.0 (less than average, U.S. average is 100)
Land area: 62.3 sq. mi. Water area: 0.0 sq. mi.
Population density: 663 people per square mile
(low).
OSM Map
General Map
Google Map
MSN Map
OSM Map
General Map
Google Map
MSN Map
OSM Map
General Map
Google Map
MSN Map
OSM Map
General Map
Google Map
MSN Map
Please wait while loading the map...
Real estate property taxes paid for housing units in 2022:
This zip code:
0.7% ($2,580)
California:
0.7% ($4,831)
Median real estate property taxes paid for housing units with mortgages in 2022: $2,847 (0.7%) Median real estate property taxes paid for housing units with no mortgage in 2022: $1,771 (0.5%)
Averages for the 2020 tax year for zip code 95301, filed in 2021:
Average Adjusted Gross Income (AGI) in 2020: $58,592 (Individual Income Tax Returns)
Here:
$58,592
State:
$95,910
Salary/wage: $49,158 (reported on 83.5% of returns)
Here:
$49,158
State:
$77,331
(% of AGI for various income ranges: 1287.4% for AGIs below $25k, 3973.7% for AGIs $25k-50k, 7143.4% for AGIs $50k-75k, 10328.9% for AGIs $75k-100k, 19310.0% for AGIs $100k-200k, 75020.9% for AGIs over 200k)
Taxable interest for individuals: $963 (reported on 30.4% of returns)
This zip code:
$963
California:
$2,294
(% of AGI for various income ranges: 8.7% for AGIs below $25k, 8.8% for AGIs $25k-50k, 22.0% for AGIs $50k-75k, 47.7% for AGIs $75k-100k, 105.7% for AGIs $100k-200k, 2208.2% for AGIs over 200k)
Ordinary dividends: $7,341 (reported on 8.3% of returns)
Here:
$7,341
State:
$10,949
(% of AGI for various income ranges: 9.1% for AGIs below $25k, 11.2% for AGIs $25k-50k, 34.8% for AGIs $50k-75k, 70.2% for AGIs $75k-100k, 181.8% for AGIs $100k-200k, 5896.4% for AGIs over 200k)
Net capital gain/loss in AGI: +$25,959 (reported on 8.5% of returns)
Here:
+$25,959
State:
+$49,306
(% of AGI for various income ranges: 2.9% for AGIs below $25k, 9.5% for AGIs $25k-50k, 41.1% for AGIs $50k-75k, 104.5% for AGIs $75k-100k, 428.9% for AGIs $100k-200k, 28523.6% for AGIs over 200k)
Profit/loss from business: +$11,828 (reported on 12.5% of returns)
Here:
+$11,828
State:
+$15,671
(% of AGI for various income ranges: 103.5% for AGIs below $25k, 170.8% for AGIs $25k-50k, 218.7% for AGIs $50k-75k, 311.1% for AGIs $75k-100k, 429.0% for AGIs $100k-200k, 3561.8% for AGIs over 200k)
Taxable individual retirement arrangement distribution: $13,915 (reported on 4.8% of returns)
95301:
$13,915
California:
$23,505
(% of AGI for various income ranges: 26.8% for AGIs below $25k, 38.3% for AGIs $25k-50k, 84.2% for AGIs $50k-75k, 183.8% for AGIs $75k-100k, 424.4% for AGIs $100k-200k, 1288.2% for AGIs over 200k)
Self-employed (Keogh) retirement plans: $16,900 (reported on 0.2% of returns)
95301:
$16,900
California:
$30,163
(% of AGI for various income ranges: 47.8% for AGIs $100k-200k)
Total itemized deductions: $31,304 (reported on 8.1% of returns)
Here:
$31,304
State:
$39,517
(% of AGI for various income ranges: 39.8% for AGIs below $25k, 72.8% for AGIs $25k-50k, 310.6% for AGIs $50k-75k, 680.7% for AGIs $75k-100k, 1461.5% for AGIs $100k-200k, 10697.3% for AGIs over 200k)
Charity contributions: $9,035 (reported on 6.5% of returns)
Here:
$9,035
State:
$12,598
(% of AGI for various income ranges: 2.8% for AGIs below $25k, 7.7% for AGIs $25k-50k, 41.9% for AGIs $50k-75k, 99.3% for AGIs $75k-100k, 287.9% for AGIs $100k-200k, 4489.1% for AGIs over 200k)
Taxes paid: $7,916 (reported on 8.1% of returns)
95301:
$7,916
State:
$8,807
(% of AGI for various income ranges: 7.2% for AGIs below $25k, 16.6% for AGIs $25k-50k, 79.8% for AGIs $50k-75k, 202.2% for AGIs $75k-100k, 443.2% for AGIs $100k-200k, 1864.5% for AGIs over 200k)
Earned income credit: $2,306 (reported on 19.3% of returns)
Here:
$2,306
State:
$2,074
(% of AGI for various income ranges: 108.4% for AGIs below $25k, 96.6% for AGIs $25k-50k, 1.9% for AGIs $50k-75k)
Percentage of individuals using paid preparers for their 2020 taxes: 92.3%
Here:
92%
State:
92%
(% for various income ranges: 91.8% for AGIs below $25k, 93.3% for AGIs $25k-50k, 91.8% for AGIs $50k-75k, 91.7% for AGIs $75k-100k, 92.6% for AGIs $100k-200k, 90.9% for AGIs over 200k)
Averages for the 2012 tax year for zip code 95301, filed in 2013:
Average Adjusted Gross Income (AGI) in 2012: $45,374 (Individual Income Tax Returns)
Here:
$45,374
State:
$72,726
Salary/wage: $39,024 (reported on 83.6% of returns)
Here:
$39,024
State:
$59,079
(% of AGI for various income ranges: 75.3% for AGIs below $25k, 80.1% for AGIs $25k-50k, 74.2% for AGIs $50k-75k, 73.1% for AGIs $75k-100k, 74.4% for AGIs $100k-200k, 42.3% for AGIs over 200k)
Taxable interest for individuals: $950 (reported on 30.6% of returns)
This zip code:
$950
California:
$2,146
(% of AGI for various income ranges: 0.6% for AGIs below $25k, 0.4% for AGIs $25k-50k, 0.7% for AGIs $50k-75k, 0.5% for AGIs $75k-100k, 0.7% for AGIs $100k-200k, 1.3% for AGIs over 200k)
Ordinary dividends: $2,418 (reported on 9.3% of returns)
Here:
$2,418
State:
$9,308
(% of AGI for various income ranges: 0.5% for AGIs below $25k, 0.3% for AGIs $25k-50k, 0.4% for AGIs $50k-75k, 0.5% for AGIs $75k-100k, 0.7% for AGIs $100k-200k, 0.7% for AGIs over 200k)
Net capital gain/loss in AGI: +$10,481 (reported on 7.5% of returns)
Here:
+$10,481
State:
+$30,460
(% of AGI for various income ranges: 0.3% for AGIs below $25k, 0.1% for AGIs $25k-50k, 0.5% for AGIs $50k-75k, 0.2% for AGIs $75k-100k, 1.1% for AGIs $100k-200k, 11.6% for AGIs over 200k)
Profit/loss from business: +$11,864 (reported on 13.0% of returns)
Here:
+$11,864
State:
+$17,064
(% of AGI for various income ranges: 6.8% for AGIs below $25k, 3.5% for AGIs $25k-50k, 2.5% for AGIs $50k-75k, 2.1% for AGIs $75k-100k, 2.2% for AGIs $100k-200k, 4.8% for AGIs over 200k)
Taxable individual retirement arrangement distribution: $12,398 (reported on 6.8% of returns)
95301:
$12,398
California:
$19,557
(% of AGI for various income ranges: 1.4% for AGIs below $25k, 1.3% for AGIs $25k-50k, 1.9% for AGIs $50k-75k, 2.4% for AGIs $75k-100k, 1.9% for AGIs $100k-200k, 2.5% for AGIs over 200k)
Self-employment retirement plans: $19,040 (reported on 0.4% of returns)
95301:
$19,040
California:
$24,530
(% of AGI for various income ranges: 0.2% for AGIs $25k-50k, 0.5% for AGIs $100k-200k)
Total itemized deductions: $22,161 (24% of AGI, reported on 26.1% of returns)
Here:
$22,161
State:
$34,004
Here:
24.1% of AGI
State:
22.7% of AGI
(% of AGI for various income ranges: 5.8% for AGIs below $25k, 8.3% for AGIs $25k-50k, 13.1% for AGIs $50k-75k, 15.7% for AGIs $75k-100k, 17.4% for AGIs $100k-200k, 15.1% for AGIs over 200k)
Charity contributions: $3,114 (reported on 21.6% of returns)
Here:
$3,114
State:
$4,659
(% of AGI for various income ranges: 0.5% for AGIs below $25k, 0.8% for AGIs $25k-50k, 1.4% for AGIs $50k-75k, 1.9% for AGIs $75k-100k, 2.2% for AGIs $100k-200k, 1.9% for AGIs over 200k)
Taxes paid: $6,950 (reported on 26.1% of returns)
95301:
$6,950
State:
$14,448
(% of AGI for various income ranges: 1.1% for AGIs below $25k, 1.9% for AGIs $25k-50k, 3.2% for AGIs $50k-75k, 4.5% for AGIs $75k-100k, 6.1% for AGIs $100k-200k, 7.6% for AGIs over 200k)
Earned income credit: $2,521 (reported on 26.6% of returns)
Here:
$2,521
State:
$2,286
(% of AGI for various income ranges: 8.5% for AGIs below $25k, 1.9% for AGIs $25k-50k)
Percentage of individuals using paid preparers for their 2012 taxes: 61.2%
Here:
61%
State:
64%
(% for various income ranges: 56.8% for AGIs below $25k, 64.1% for AGIs $25k-50k, 61.6% for AGIs $50k-75k, 63.1% for AGIs $75k-100k, 69.0% for AGIs $100k-200k, 83.3% for AGIs over 200k)
Averages for the 2004 tax year for zip code 95301, filed in 2005:
Average Adjusted Gross Income (AGI) in 2004: $39,594 (Individual Income Tax Returns)
Here:
$39,594
State:
$58,600
Salary/wage: $34,496 (reported on 85.2% of returns)
Here:
$34,496
State:
$49,455
(% of AGI for various income ranges: 126.7% for AGIs below $10k, 76.3% for AGIs $10k-25k, 82.0% for AGIs $25k-50k, 80.3% for AGIs $50k-75k, 78.8% for AGIs $75k-100k, 54.1% for AGIs over 100k)
Taxable interest for individuals: $1,127 (reported on 43.0% of returns)
This zip code:
$1,127
California:
$2,365
(% of AGI for various income ranges: 5.1% for AGIs below $10k, 1.6% for AGIs $10k-25k, 0.8% for AGIs $25k-50k, 0.9% for AGIs $50k-75k, 1.2% for AGIs $75k-100k, 1.6% for AGIs over 100k)
Taxable dividends: $1,445 (reported on 12.9% of returns)
Here:
$1,445
State:
$4,746
(% of AGI for various income ranges: 2.4% for AGIs below $10k, 0.5% for AGIs $10k-25k, 0.3% for AGIs $25k-50k, 0.4% for AGIs $50k-75k, 0.4% for AGIs $75k-100k, 0.6% for AGIs over 100k)
Net capital gain/loss: +$13,852 (reported on 10.5% of returns)
Here:
+$13,852
State:
+$23,418
(% of AGI for various income ranges: 2.8% for AGIs below $10k, 0.4% for AGIs $10k-25k, 0.4% for AGIs $25k-50k, 0.9% for AGIs $50k-75k, 1.9% for AGIs $75k-100k, 12.1% for AGIs over 100k)
Profit/loss from business: +$12,051 (reported on 12.9% of returns)
Here:
+$12,051
State:
+$16,826
(% of AGI for various income ranges: 6.2% for AGIs below $10k, 4.4% for AGIs $10k-25k, 3.0% for AGIs $25k-50k, 3.3% for AGIs $50k-75k, 2.9% for AGIs $75k-100k, 5.6% for AGIs over 100k)
IRA payment deduction: $3,053 (reported on 1.9% of returns)
95301:
$3,053
California:
$3,192
(% of AGI for various income ranges: 0.1% for AGIs $10k-25k, 0.2% for AGIs $25k-50k, 0.2% for AGIs $50k-75k, 0.1% for AGIs $75k-100k, 0.1% for AGIs over 100k)
Self-employed pension: $14,750 (reported on 0.5% of returns)
Here:
$14,750
California:
$17,688
(% of AGI for various income ranges: 0.1% for AGIs $10k-25k, 0.2% for AGIs $50k-75k, 0.5% for AGIs over 100k)
Total itemized deductions: $18,786 (27% of AGI, reported on 32.8% of returns)
Here:
$18,786
State:
$28,113
Here:
27.2% of AGI
State:
25.3% of AGI
(% of AGI for various income ranges: 13.4% for AGIs below $10k, 8.2% for AGIs $10k-25k, 13.6% for AGIs $25k-50k, 18.9% for AGIs $50k-75k, 19.7% for AGIs $75k-100k, 15.9% for AGIs over 100k)
Charity contributions deductions: $2,328 (3% of AGI, reported on 28.8% of returns)
Here:
$2,328
State:
$3,923
Here:
3.3% of AGI
State:
3.3% of AGI
(% of AGI for various income ranges: 0.7% for AGIs below $10k, 0.7% for AGIs $10k-25k, 1.4% for AGIs $25k-50k, 2.1% for AGIs $50k-75k, 2.3% for AGIs $75k-100k, 1.8% for AGIs over 100k)
Total tax: $5,170 (reported on 67.6% of returns)
95301:
$5,170
State:
$10,761
(% of AGI for various income ranges: 3.6% for AGIs below $10k, 3.2% for AGIs $10k-25k, 5.0% for AGIs $25k-50k, 7.7% for AGIs $50k-75k, 9.5% for AGIs $75k-100k, 16.3% for AGIs over 100k)
Earned income credit: $1,910 (reported on 22.6% of returns)
Here:
$1,910
State:
$1,763
Percentage of individuals using paid preparers for their 2004 taxes: 63.1%
Here:
63%
State:
66%
(% for various income ranges: 55.7% for AGIs below $10k, 62.8% for AGIs $10k-25k, 64.9% for AGIs $25k-50k, 64.2% for AGIs $50k-75k, 65.1% for AGIs $75k-100k, 73.7% for AGIs over 100k)
Household received Food Stamps/SNAP in the past 12 months: 2,576 Household did not receive Food Stamps/SNAP in the past 12 months: 10,672
Women who had a birth in the past 12 months: 490 (337 now married, 153 unmarried) Women who did not have a birth in the past 12 months: 8,769 (3,939 now married, 4,810 unmarried)
Housing units in zip code 95301 with a mortgage: 5,199 (325 second mortgage, 1 home equity loan, 237 both second mortgage and home equity loan) Houses without a mortgage: 54
Median monthly owner costs for units with a mortgage: $1,784 Median monthly owner costs for units without a mortgage: $567
Residents with income below the poverty level in 2022:
This zip code:
16.1%
Whole state:
12.2%
Residents with income below 50% of the poverty level in 2022:
This zip code:
10.6%
Whole state:
6.2%
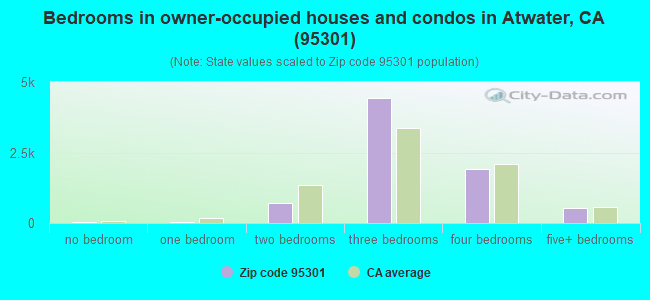
Median number of rooms in houses and condos:
Here:
6.2
State:
6.0
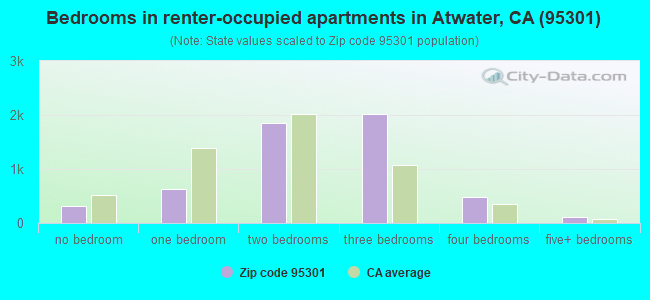
Median number of rooms in apartments:
Here:
4.8
State:
3.9
Notable locations in this zip code not listed on our city pages
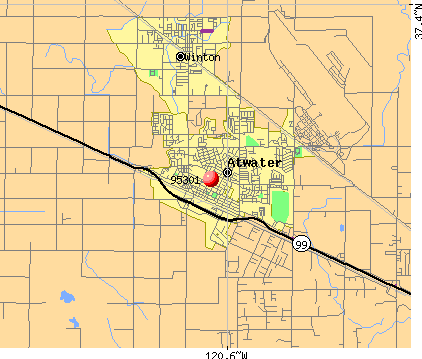
Notable locations in zip code 95301: Atwater Business Park (A), Gallo Colombard Dairy (B), Gallo Cottonwood Dairy (C), Vieira Dairy Farm (D), Rancho Del Rey Golf Course (E), Castle Air Museum (F), Baker Library (G), Atwater City Hall (H), Atwater Branch Merced County Library (I), Merced County Fire Department Station 62 Castle (J), Atwater Fire Department Station 1 (K), Atwater Fire Department Station 2 (L), Veterans Memorial Building (M), Bloss House Museum (N). Display/hide their locations on the map
Shopping Centers: Lucky Shopping Center (1), Atwater Town Center Shopping Center (2), Model Market Shopping Center (3), Atwater Plaza Shopping Center (4). Display/hide their locations on the map
Churches in zip code 95301 include: First Church of God (A), Ariel Dear Found Family Church (B), Atwater Baptist Church (C), Atwater Christian Life Church (D), Bear Creek Community Church (E), Bethany Church of God in Christ (F), Calvario Centro Cristiano (G), Church of Christ (H), First Baptist Church (I). Display/hide their locations on the map
Parks in zip code 95301 include: Andy Albiani Park (1), Atwater Memorial Ballpark (2), Heller Park (3), Manuel Bairos Park (4), Tower Park (5), Bloss Park (6), Veterans Park (7), Osborn Park (8), Ralston Park (9). Display/hide their locations on the map
5,840 married couples with children.
3,581 single-parent households (1,019 men, 2,562 women).
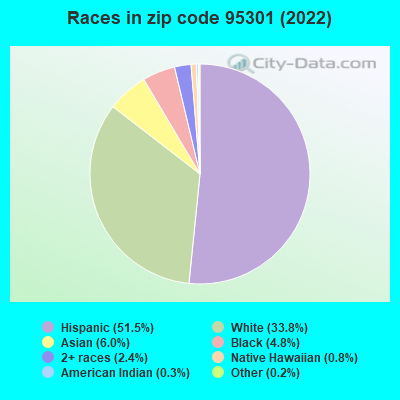
56.6% of residents of 95301 zip code speak English at home.
36.1% of residents speak Spanish at home (60% very well, 11% well, 14% not well, 14% not at all).
4.5% of residents speak other Indo-European language at home (71% very well, 10% well, 8% not well, 11% not at all).
2.7% of residents speak Asian or Pacific Island language at home (59% very well, 19% well, 13% not well, 10% not at all).
0.1% of residents speak other language at home (100% very well).
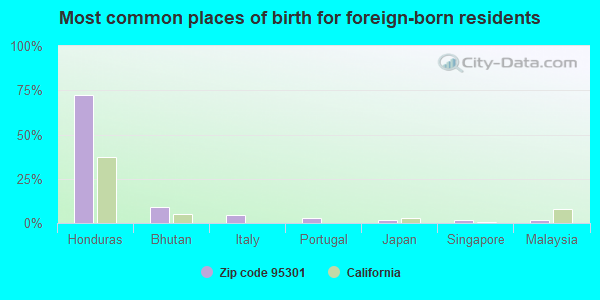
Foreign born population: 8,505 (20.6%) (43.3% of them are naturalized citizens)
This zip code:
20.6%
Whole state:
26.7%
72%Honduras
9%Bhutan
5%Italy
3%Portugal
2%Japan
2%Singapore
2%Malaysia
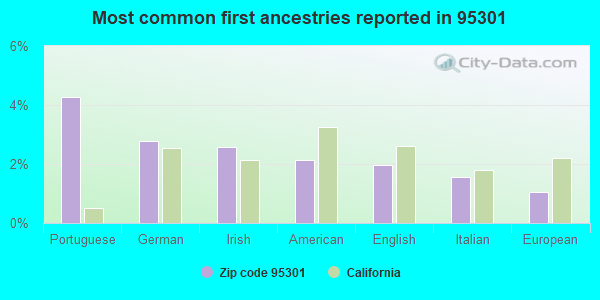
4%Portuguese
3%German
3%Irish
2%American
2%English
2%Italian
1%European
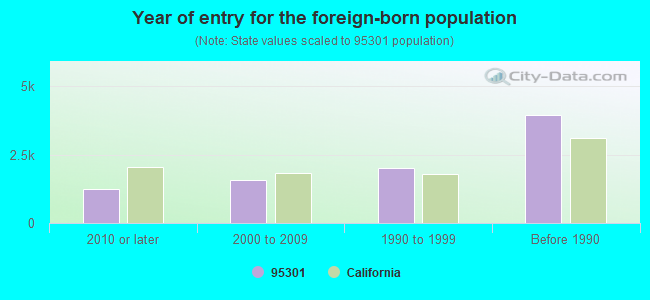
Year of entry for the foreign-born population
1,2332010 or later
1,5872000 to 2009
2,0161990 to 1999
3,953Before 1990
Major facilities with environmental interests located in this zip code:
GALLO CATTLE COMPANY (10561 HIGHWAY 140 in ATWATER, CA)
AIR MINOR (AIRS/AFS) (Integrated Compliance Information System) - ICIS-09-2002-0155, FORMAL ENFORCEMENT ACTION, ICIS-09-2003-0178, COMPLIANCE ACTIVITY (Tracking inspections of insecticide, fungicide, and rodenticide, and toxic substances) National Pollutant Discharge Elimination System NON-MAJOR (Tracking pollutant discharge elimination systems) - permit TRI REPORTER (Tracking of toxic chemicals releasing facilities) Business SIC classification: DAIRY FARMS; GENERAL FARMS, PRIMARILY LIVESTOCK AND ANIMAL SPECIALTIES; NATURAL, PROCESSED, AND IMITATION CHEESE Alternative names: GALLO CATTLE COMPANY/JOSEPH GALLO FARMS, GALLO CHEESE PLANT, GALLO COTTONWOOD DAIRY, GALLO COTTONWOOD DIARY
APPLEGATE CHEVRON (1500 SYCAMORE AVE in ATWATER, CA)
STATE MASTER (California - Hazardous Waste Tracking) - HAZARDOU WASTE PROGRAM CRITERIA AND HAZARDOUS AIR POLLUTANT INVENTORY (Inventory of air pollution sources) Small Quantity Generators, between 100 kg and 1000 kg of hazardous waste/month (Resource Conservation and Recovery Act (tracking hazardous waste)) Business SIC classification: GASOLINE SERVICE STATIONS
HELLER (PEGGY) ELEMENTARY (201 LAKE VIEW in ATWATER, CA)
(National Center for Education Statistics) - STATE ID-6113161 Organizations: ATWATER ELEMENTARY (SCHOOL DISTRICT)
MITCHELL ELEMENTARY (1761 GROVE AVE. in ATWATER, CA)
(National Center for Education Statistics) - STATE ID-6025340 Organizations: ATWATER ELEMENTARY (SCHOOL DISTRICT)
MITCHELL INTERMEDIATE (1753 FIFTH ST. in ATWATER, CA)
(National Center for Education Statistics) - STATE ID-6025357 Organizations: ATWATER ELEMENTARY (SCHOOL DISTRICT)
EMANUEL & SONIA BELO (511 S APPLEGATE in ATWATER, CA)
National Pollutant Discharge Elimination System NON-MAJOR (Tracking pollutant discharge elimination systems) - permit Business SIC classification: DAIRY FARMS Alternative names: MOSS, DUANE (OWNER)
GALLO FRENCH COLUMBARD DAIRY (BERT CRANE ROAD in ATWATER, CA)
National Pollutant Discharge Elimination System NON-MAJOR (Tracking pollutant discharge elimination systems) - permit Business SIC classification: DAIRY FARMS Alternative names: GALLO CATTLE CO, GALLO FRENCH COLOMBARD DAIRY
LA ATWATER SUB BRANCH LIBRARY (3229 GLENDALE BLVD in ATWATER, CA)
Small Quantity Generators, between 100 kg and 1000 kg of hazardous waste/month (Resource Conservation and Recovery Act (tracking hazardous waste)) - notification Organizations: CITY OF LOS ANGELES (CONTACT/OWNER)
CENTRAL VALLEY SKYWAYS (485 AVIATOR DR in ATWATER, CA)
Small Quantity Generators, between 100 kg and 1000 kg of hazardous waste/month (Resource Conservation and Recovery Act (tracking hazardous waste)) Organizations: DAVE PULSIPHER (CONTACT/OWNER)
J R WOOD INCORPORATED (7916 WEST BELLEVUE ROAD in ATWATER, CA)
CRITERIA AND HAZARDOUS AIR POLLUTANT INVENTORY (Inventory of air pollution sources) TRI REPORTER (Tracking of toxic chemicals releasing facilities) Business SIC classification: FROZEN FRUITS, FRUIT JUICES, AND VEGETABLES
KISTNER TRUCKING INC (760 PACIFIC AVE in ATWATER, CA)
Small Quantity Generators, between 100 kg and 1000 kg of hazardous waste/month (Resource Conservation and Recovery Act (tracking hazardous waste))
BANKS SAFETY (625 ATWATER BLVD in ATWATER, CA)
Small Quantity Generators, between 100 kg and 1000 kg of hazardous waste/month (Resource Conservation and Recovery Act (tracking hazardous waste)) Business NAICS classification: OTHER AUTOMOTIVE MECHANICAL AND ELECTRICAL REPAIR AND MAINTENANCE.
NCI BUILDING SYSTEMS L.P. (550 INDUSTRY WAY in ATWATER, CA)
CRITERIA AND HAZARDOUS AIR POLLUTANT INVENTORY (Inventory of air pollution sources) TRI REPORTER (Tracking of toxic chemicals releasing facilities) Business SIC classification: FABRICATED STRUCTURAL METAL; PREFABRICATED METAL BUILDINGS AND COMPONENTS Business NAICS classification: PREFABRICATED METAL BUILDING AND COMPONENT MANUFACTURING.
Housing units lacking complete plumbing facilities: 0.4% Housing units lacking complete kitchen facilities: 1.1%
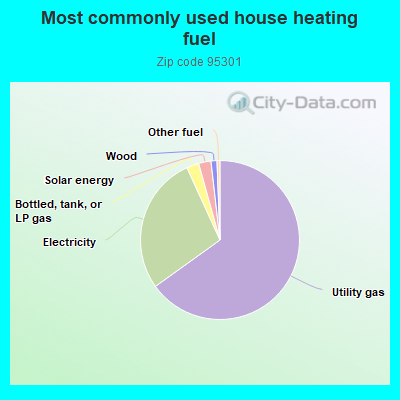
64.9%Utility gas
28.0%Electricity
2.5%Bottled, tank, or LP gas
2.5%Solar energy
1.2%Wood
0.6%Other fuel
Population in 1990: 24,928. Population change in the 1990s: +2,866 (+11.5%).
Place of birth for U.S.-born residents:
This state: 27,312
Northeast: 556
Midwest: 1,316
South: 1,935
West: 1,247
50% of the 95301 zip code residents lived in the same house 5 years ago. Out of people who lived in different houses, 71% lived in this county. Out of people who lived in different counties, 50% lived in California.
91% of the 95301 zip code residents lived in the same house 1 year ago. Out of people who lived in different houses, 49% moved from this county. Out of people who lived in different houses, 44% moved from different county within same state. Out of people who lived in different houses, 5% moved from different state. Out of people who lived in different houses, 3% moved from abroad.
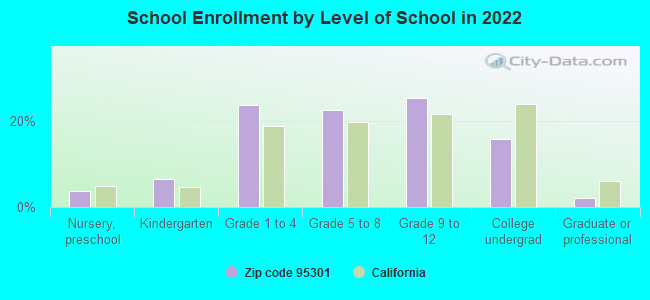
Private vs. public school enrollment:
Students in private schools in grades 1 to 8 (elementary and middle school): 382
Here:
7.1%
California:
10.5%
Students in private schools in grades 9 to 12 (high school): 243
Here:
8.2%
California:
8.5%
Students in private undergraduate colleges: 183
Here:
10.0%
California:
15.9%
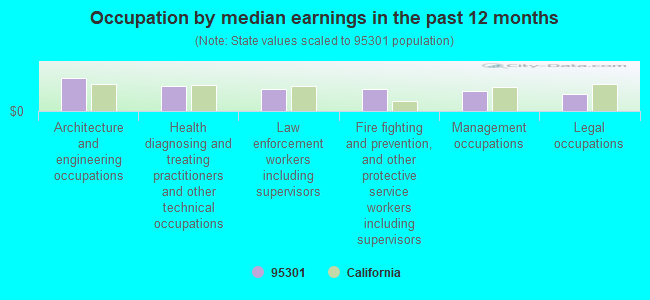
Occupation by median earnings in the past 12 months ($)
132,709Architecture and engineering occupations
98,358Health diagnosing and treating practitioners and other technical occupations
89,319Law enforcement workers including supervisors
87,159Fire fighting and prevention, and other protective service workers including supervisors
80,389Management occupations
68,435Legal occupations
Companies with federal contracts located in this zip code:
CASTLE KNIGHTS AVIATION INC (3515 HARDSTAND AVE STE D in ATWATER, CA; small business) : $44,682 in 2 contractsin 2005
$23,170 with Defense Logistics Agency for Fuel Oils. Signed on 2005-08-12. Completion date: 2005-08-12.
$21,512, same as above.Signed on 2005-03-30. Completion date: 2005-03-30.
GAMUT ENTERPRISES (2787 PEERLESS AVE in ATWATER, CA; small business)
$38,265 with Department of Defense for Miscellaneous Prefabricated Structures. Signed on 2000-07-05. Completion date: 2000-09-15.
ADAMY ENGINEERING (1420 NORFOLK AVE in ATWATER, CA; small business)
$25,025 with Navy for Lectures For Training. Signed on 2002-09-30. Completion date: 2003-03-30.
Top industries in this zip code by the number of employees in 2005:
Information: Cellular and Other Wireless Telecommunications (over 1000 employees: 1 establishment, 1-4 employees: 1 establishment)
Health Care and Social Assistance: General Medical and Surgical Hospitals (over 1000: 1)
Construction: Poured Concrete Foundation and Structure Contractors (250-499: 1, 50-99: 2, 1-4: 2)
2005 - 2018 National Fire Incident Reporting System (NFIRS) incidents
According to the data from the years 2005 - 2018 the average number of fires per year is 91. The highest number of reported fires - 144 took place in 2017, and the least - 5 in 2005. The data has a growing trend.
When looking into fire subcategories, the most reports belonged to: Outside Fires (55.2%), and Structure Fires (22.8%).
Fire incident types reported to NFIRS in Zip Code 95301


 Nearest zip codes: 95312, 95388, 95334, 95303, 95348, 95341.


 According to the data from the years 2005 - 2018 the average number of fires per year is 91. The highest number of reported fires - 144 took place in 2017, and the least - 5 in 2005. The data has a growing trend.
 When looking into fire subcategories, the most reports belonged to: Outside Fires (55.2%), and Structure Fires (22.8%).