Estimated zip code population in 2022: 35,555 Zip code population in 2010: 30,805 Zip code population in 2000: 23,093
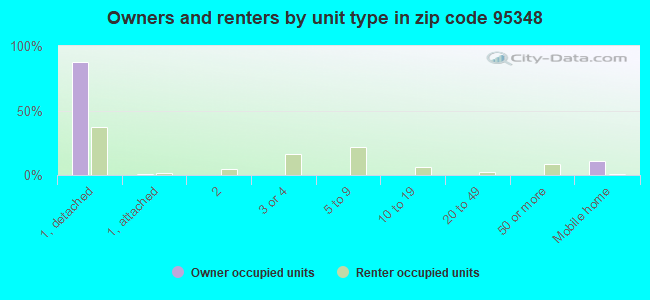
Houses and condos: 12,147 Renter-occupied apartments: 6,165
% of renters here:
55%
State:
44%
March 2022 cost of living index in zip code 95348: 94.8 (less than average, U.S. average is 100)
Land area: 47.5 sq. mi. Water area: 0.1 sq. mi.
Population density: 748 people per square mile
(low).
OSM Map
General Map
Google Map
MSN Map
OSM Map
General Map
Google Map
MSN Map
OSM Map
General Map
Google Map
MSN Map
OSM Map
General Map
Google Map
MSN Map
Please wait while loading the map...
Real estate property taxes paid for housing units in 2022:
This zip code:
0.7% ($2,651)
California:
0.7% ($4,831)
Median real estate property taxes paid for housing units with mortgages in 2022: $2,941 (0.8%) Median real estate property taxes paid for housing units with no mortgage in 2022: $2,066 (0.7%)
Estimated median house/condo value in 2022: $360,176
95348:
$360,176
California:
$715,900
According to our research of California and other state lists, there were 39 registered sex offenders living in 95348 zip code as of April 27, 2024. The ratio of all residents to sex offenders in zip code 95348 is 873 to 1. The ratio of registered sex offenders to all residents in this zip code is near the state average.
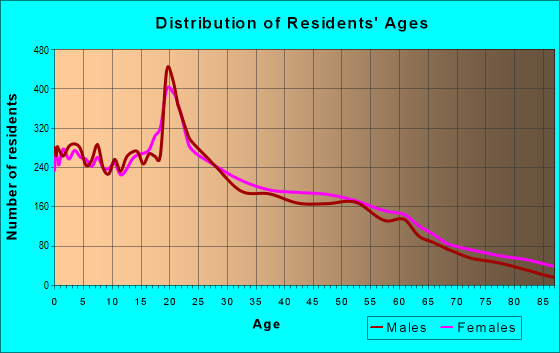
Median resident age:
This zip code:
31.1 years
California median age:
37.9 years
Average household size:
This zip code:
3.2 people
California:
2.8 people
Averages for the 2020 tax year for zip code 95348, filed in 2021:
Average Adjusted Gross Income (AGI) in 2020: $49,484 (Individual Income Tax Returns)
Here:
$49,484
State:
$95,910
Salary/wage: $44,311 (reported on 85.7% of returns)
Here:
$44,311
State:
$77,331
(% of AGI for various income ranges: 1195.9% for AGIs below $25k, 3829.4% for AGIs $25k-50k, 7107.8% for AGIs $50k-75k, 10428.9% for AGIs $75k-100k, 18881.3% for AGIs $100k-200k, 76645.0% for AGIs over 200k)
Taxable interest for individuals: $672 (reported on 24.1% of returns)
This zip code:
$672
California:
$2,294
(% of AGI for various income ranges: 6.4% for AGIs below $25k, 7.3% for AGIs $25k-50k, 23.8% for AGIs $50k-75k, 35.8% for AGIs $75k-100k, 89.5% for AGIs $100k-200k, 920.0% for AGIs over 200k)
Ordinary dividends: $3,222 (reported on 7.0% of returns)
Here:
$3,222
State:
$10,949
(% of AGI for various income ranges: 5.9% for AGIs below $25k, 12.5% for AGIs $25k-50k, 20.1% for AGIs $50k-75k, 30.4% for AGIs $75k-100k, 161.6% for AGIs $100k-200k, 1495.0% for AGIs over 200k)
Net capital gain/loss in AGI: +$13,447 (reported on 8.3% of returns)
Here:
+$13,447
State:
+$49,306
(% of AGI for various income ranges: 0.6% for AGIs below $25k, 6.2% for AGIs $25k-50k, 39.4% for AGIs $50k-75k, 101.6% for AGIs $75k-100k, 315.8% for AGIs $100k-200k, 20991.7% for AGIs over 200k)
Profit/loss from business: +$9,120 (reported on 12.5% of returns)
Here:
+$9,120
State:
+$15,671
(% of AGI for various income ranges: 90.6% for AGIs below $25k, 108.6% for AGIs $25k-50k, 175.2% for AGIs $50k-75k, 192.0% for AGIs $75k-100k, 430.3% for AGIs $100k-200k, 3295.0% for AGIs over 200k)
Taxable individual retirement arrangement distribution: $13,487 (reported on 3.7% of returns)
95348:
$13,487
California:
$23,505
(% of AGI for various income ranges: 19.9% for AGIs below $25k, 32.3% for AGIs $25k-50k, 70.9% for AGIs $50k-75k, 152.0% for AGIs $75k-100k, 285.1% for AGIs $100k-200k, 1658.3% for AGIs over 200k)
Total itemized deductions: $28,763 (reported on 6.9% of returns)
Here:
$28,763
State:
$39,517
(% of AGI for various income ranges: 31.9% for AGIs below $25k, 78.2% for AGIs $25k-50k, 289.4% for AGIs $50k-75k, 695.2% for AGIs $75k-100k, 1333.8% for AGIs $100k-200k, 8423.3% for AGIs over 200k)
Charity contributions: $6,503 (reported on 5.3% of returns)
Here:
$6,503
State:
$12,598
(% of AGI for various income ranges: 1.4% for AGIs below $25k, 9.8% for AGIs $25k-50k, 33.0% for AGIs $50k-75k, 111.2% for AGIs $75k-100k, 298.6% for AGIs $100k-200k, 1771.7% for AGIs over 200k)
Taxes paid: $7,385 (reported on 6.9% of returns)
95348:
$7,385
State:
$8,807
(% of AGI for various income ranges: 4.1% for AGIs below $25k, 15.3% for AGIs $25k-50k, 81.0% for AGIs $50k-75k, 200.7% for AGIs $75k-100k, 404.7% for AGIs $100k-200k, 1443.3% for AGIs over 200k)
Earned income credit: $2,331 (reported on 23.0% of returns)
Here:
$2,331
State:
$2,074
(% of AGI for various income ranges: 114.9% for AGIs below $25k, 95.5% for AGIs $25k-50k, 2.9% for AGIs $50k-75k)
Percentage of individuals using paid preparers for their 2020 taxes: 93.5%
Here:
94%
State:
92%
(% for various income ranges: 93.6% for AGIs below $25k, 94.0% for AGIs $25k-50k, 93.8% for AGIs $50k-75k, 94.2% for AGIs $75k-100k, 91.3% for AGIs $100k-200k, 90.9% for AGIs over 200k)
Averages for the 2012 tax year for zip code 95348, filed in 2013:
Average Adjusted Gross Income (AGI) in 2012: $41,347 (Individual Income Tax Returns)
Here:
$41,347
State:
$72,726
Salary/wage: $37,082 (reported on 86.2% of returns)
Here:
$37,082
State:
$59,079
(% of AGI for various income ranges: 79.0% for AGIs below $25k, 82.9% for AGIs $25k-50k, 81.0% for AGIs $50k-75k, 80.7% for AGIs $75k-100k, 75.0% for AGIs $100k-200k, 48.5% for AGIs over 200k)
Taxable interest for individuals: $811 (reported on 25.5% of returns)
This zip code:
$811
California:
$2,146
(% of AGI for various income ranges: 0.6% for AGIs below $25k, 0.4% for AGIs $25k-50k, 0.5% for AGIs $50k-75k, 0.4% for AGIs $75k-100k, 0.4% for AGIs $100k-200k, 1.4% for AGIs over 200k)
Ordinary dividends: $3,416 (reported on 7.7% of returns)
Here:
$3,416
State:
$9,308
(% of AGI for various income ranges: 0.6% for AGIs below $25k, 0.8% for AGIs $25k-50k, 0.6% for AGIs $50k-75k, 0.3% for AGIs $75k-100k, 0.7% for AGIs $100k-200k, 0.7% for AGIs over 200k)
Net capital gain/loss in AGI: +$6,438 (reported on 6.5% of returns)
Here:
+$6,438
State:
+$30,460
(% of AGI for various income ranges: 0.9% for AGIs $100k-200k, 10.7% for AGIs over 200k)
Profit/loss from business: +$10,244 (reported on 12.5% of returns)
Here:
+$10,244
State:
+$17,064
(% of AGI for various income ranges: 6.7% for AGIs below $25k, 2.4% for AGIs $25k-50k, 1.2% for AGIs $50k-75k, 1.0% for AGIs $75k-100k, 3.1% for AGIs $100k-200k, 7.1% for AGIs over 200k)
Taxable individual retirement arrangement distribution: $13,695 (reported on 5.5% of returns)
95348:
$13,695
California:
$19,557
(% of AGI for various income ranges: 1.4% for AGIs below $25k, 1.2% for AGIs $25k-50k, 1.2% for AGIs $50k-75k, 2.4% for AGIs $75k-100k, 2.5% for AGIs $100k-200k, 3.0% for AGIs over 200k)
Self-employment retirement plans: $17,000 (reported on 0.2% of returns)
95348:
$17,000
California:
$24,530
Total itemized deductions: $20,544 (24% of AGI, reported on 22.9% of returns)
Here:
$20,544
State:
$34,004
Here:
24.0% of AGI
State:
22.7% of AGI
(% of AGI for various income ranges: 5.0% for AGIs below $25k, 8.0% for AGIs $25k-50k, 11.9% for AGIs $50k-75k, 13.9% for AGIs $75k-100k, 16.4% for AGIs $100k-200k, 12.9% for AGIs over 200k)
Charity contributions: $3,041 (reported on 18.3% of returns)
Here:
$3,041
State:
$4,659
(% of AGI for various income ranges: 0.4% for AGIs below $25k, 0.7% for AGIs $25k-50k, 1.3% for AGIs $50k-75k, 1.9% for AGIs $75k-100k, 2.3% for AGIs $100k-200k, 1.8% for AGIs over 200k)
Taxes paid: $6,364 (reported on 22.9% of returns)
95348:
$6,364
State:
$14,448
(% of AGI for various income ranges: 0.9% for AGIs below $25k, 1.6% for AGIs $25k-50k, 3.1% for AGIs $50k-75k, 4.1% for AGIs $75k-100k, 6.0% for AGIs $100k-200k, 7.2% for AGIs over 200k)
Earned income credit: $2,535 (reported on 31.4% of returns)
Here:
$2,535
State:
$2,286
(% of AGI for various income ranges: 10.4% for AGIs below $25k, 2.0% for AGIs $25k-50k)
Percentage of individuals using paid preparers for their 2012 taxes: 54.0%
Here:
54%
State:
64%
(% for various income ranges: 48.0% for AGIs below $25k, 55.6% for AGIs $25k-50k, 59.7% for AGIs $50k-75k, 61.4% for AGIs $75k-100k, 64.9% for AGIs $100k-200k, 88.9% for AGIs over 200k)
Averages for the 2004 tax year for zip code 95348, filed in 2005:
Average Adjusted Gross Income (AGI) in 2004: $37,487 (Individual Income Tax Returns)
Here:
$37,487
State:
$58,600
Salary/wage: $33,284 (reported on 86.6% of returns)
Here:
$33,284
State:
$49,455
(% of AGI for various income ranges: 91.3% for AGIs below $10k, 79.8% for AGIs $10k-25k, 84.7% for AGIs $25k-50k, 81.2% for AGIs $50k-75k, 80.6% for AGIs $75k-100k, 58.2% for AGIs over 100k)
Taxable interest for individuals: $1,453 (reported on 38.2% of returns)
This zip code:
$1,453
California:
$2,365
(% of AGI for various income ranges: 2.7% for AGIs below $10k, 1.3% for AGIs $10k-25k, 1.2% for AGIs $25k-50k, 1.3% for AGIs $50k-75k, 1.3% for AGIs $75k-100k, 2.0% for AGIs over 100k)
Taxable dividends: $2,590 (reported on 12.8% of returns)
Here:
$2,590
State:
$4,746
(% of AGI for various income ranges: 1.1% for AGIs below $10k, 0.7% for AGIs $10k-25k, 0.7% for AGIs $25k-50k, 0.7% for AGIs $50k-75k, 0.9% for AGIs $75k-100k, 1.4% for AGIs over 100k)
Net capital gain/loss: +$9,866 (reported on 10.2% of returns)
Here:
+$9,866
State:
+$23,418
(% of AGI for various income ranges: -1.3% for AGIs below $10k, 0.1% for AGIs $10k-25k, 0.2% for AGIs $25k-50k, 1.1% for AGIs $50k-75k, 1.7% for AGIs $75k-100k, 9.7% for AGIs over 100k)
Profit/loss from business: +$13,182 (reported on 12.5% of returns)
Here:
+$13,182
State:
+$16,826
(% of AGI for various income ranges: 4.3% for AGIs below $10k, 4.7% for AGIs $10k-25k, 2.9% for AGIs $25k-50k, 2.8% for AGIs $50k-75k, 2.8% for AGIs $75k-100k, 8.5% for AGIs over 100k)
Profit/loss from farming: +$1,677 (reported on 0.7% of returns)
Here:
+$1,677
State:
-$7,562
(% of AGI for various income ranges: -1.5% for AGIs below $10k, 0.1% for AGIs $25k-50k, 0.1% for AGIs $50k-75k, 0.2% for AGIs over 100k)
IRA payment deduction: $2,821 (reported on 1.5% of returns)
95348:
$2,821
California:
$3,192
(% of AGI for various income ranges: 0.1% for AGIs $10k-25k, 0.1% for AGIs $25k-50k, 0.1% for AGIs $50k-75k, 0.1% for AGIs $75k-100k, 0.1% for AGIs over 100k)
Self-employed pension: $17,800 (reported on 0.5% of returns)
Here:
$17,800
California:
$17,688
Total itemized deductions: $18,508 (26% of AGI, reported on 29.9% of returns)
Here:
$18,508
State:
$28,113
Here:
26.3% of AGI
State:
25.3% of AGI
(% of AGI for various income ranges: 9.9% for AGIs below $10k, 8.1% for AGIs $10k-25k, 13.2% for AGIs $25k-50k, 16.8% for AGIs $50k-75k, 19.6% for AGIs $75k-100k, 16.0% for AGIs over 100k)
Charity contributions deductions: $2,514 (3% of AGI, reported on 26.1% of returns)
Here:
$2,514
State:
$3,923
Here:
3.4% of AGI
State:
3.3% of AGI
(% of AGI for various income ranges: 0.5% for AGIs below $10k, 0.6% for AGIs $10k-25k, 1.2% for AGIs $25k-50k, 2.0% for AGIs $50k-75k, 2.4% for AGIs $75k-100k, 2.5% for AGIs over 100k)
Total tax: $5,101 (reported on 66.3% of returns)
95348:
$5,101
State:
$10,761
(% of AGI for various income ranges: 1.9% for AGIs below $10k, 3.3% for AGIs $10k-25k, 5.6% for AGIs $25k-50k, 8.0% for AGIs $50k-75k, 9.4% for AGIs $75k-100k, 17.7% for AGIs over 100k)
Earned income credit: $1,919 (reported on 26.3% of returns)
Here:
$1,919
State:
$1,763
Percentage of individuals using paid preparers for their 2004 taxes: 60.1%
Here:
60%
State:
66%
(% for various income ranges: 53.3% for AGIs below $10k, 60.7% for AGIs $10k-25k, 58.7% for AGIs $25k-50k, 63.3% for AGIs $50k-75k, 67.2% for AGIs $75k-100k, 72.2% for AGIs over 100k)
Likely homosexual households (counted as self-reported same-sex unmarried-partner households)
Lesbian couples: 0.0% of all households
Gay men: 0.3% of all households
Household received Food Stamps/SNAP in the past 12 months: 3,376 Household did not receive Food Stamps/SNAP in the past 12 months: 8,230
Women who had a birth in the past 12 months: 476 (241 now married, 236 unmarried) Women who did not have a birth in the past 12 months: 8,550 (3,047 now married, 5,516 unmarried)
Housing units in zip code 95348 with a mortgage: 3,209 (93 second mortgage, 55 both second mortgage and home equity loan) Houses without a mortgage: 15
Median monthly owner costs for units with a mortgage: $1,715 Median monthly owner costs for units without a mortgage: $591
Residents with income below the poverty level in 2022:
This zip code:
22.0%
Whole state:
12.2%
Residents with income below 50% of the poverty level in 2022:
This zip code:
8.5%
Whole state:
6.2%
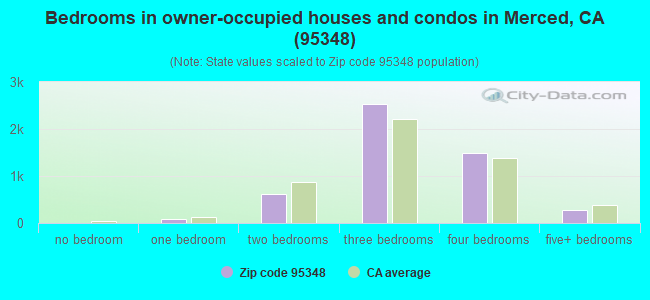
Median number of rooms in houses and condos:
Here:
5.9
State:
6.0
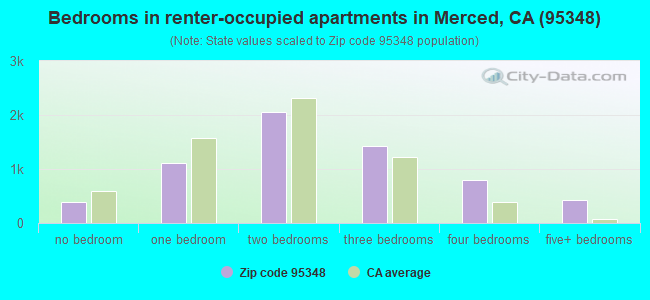
Median number of rooms in apartments:
Here:
4.6
State:
3.9
Notable locations in this zip code not listed on our city pages
Notable locations in zip code 95348: Bellevue Ranch (A), Highway 59 Landfill (B), Merced County Honor Farm (C), Lesher Library (D), Merced City Fire Department Station 53 (E). Display/hide their locations on the map
Churches in zip code 95348 include: Islamic Center of Merced (A), Saint Lukes Episcopal Church (B), Saint Patricks Roman Catholic Church (C), Sierra Presbyterian Church (D). Display/hide their locations on the map
4,287 married couples with children.
3,024 single-parent households (828 men, 2,196 women).
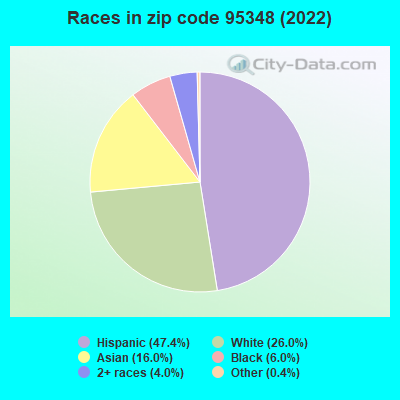
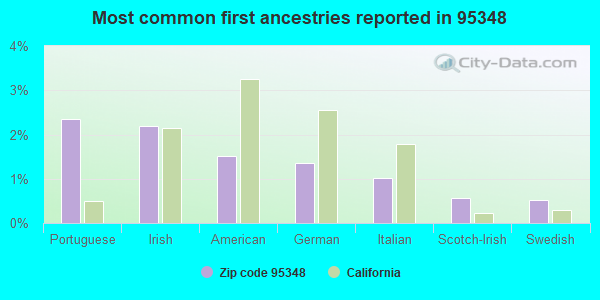
52.2% of residents of 95348 zip code speak English at home.
32.4% of residents speak Spanish at home (73% very well, 12% well, 11% not well, 5% not at all).
4.7% of residents speak other Indo-European language at home (76% very well, 18% well, 5% not well, 1% not at all).
9.5% of residents speak Asian or Pacific Island language at home (64% very well, 17% well, 12% not well, 7% not at all).
1.0% of residents speak other language at home (77% very well, 23% not well).
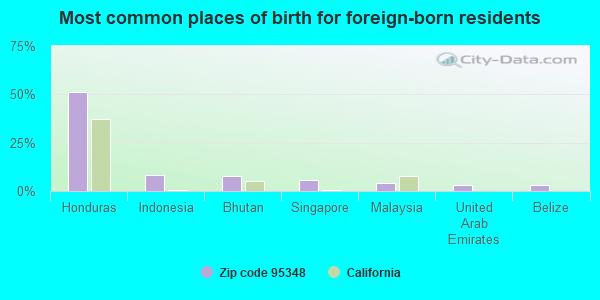
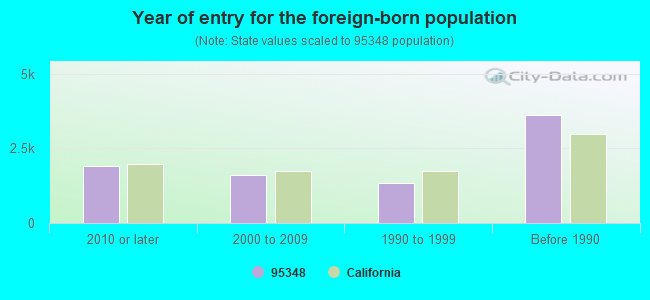
Foreign born population: 8,248 (23.2%) (60.3% of them are naturalized citizens)
Facilities with environmental interests located in this zip code:
FRANKLIN ELEMENTARY (2936 FRANKLIN ROAD in MERCED, CA)
(National Center for Education Statistics) - STATE ID-6025621 Organizations: MERCED CITY ELEMENTARY (SCHOOL DISTRICT)
BALTIMORE AIRCOIL COMPANY INCORPORATED (3058 BEACHWOOD DRIVE in MERCED, CA)
CRITERIA AND HAZARDOUS AIR POLLUTANT INVENTORY (Inventory of air pollution sources) HAZARDOUS WASTE BIENNIAL REPORTER (Resource Conservation and Recovery Act (tracking hazardous waste)) Large Quantity Generators, more that 1000 kg of hazardous waste/month (Resource Conservation and Recovery Act (tracking hazardous waste)) TRI REPORTER (Tracking of toxic chemicals releasing facilities) Business SIC classification: WOOD PRODUCTS Business NAICS classification: ENGINEERED WOOD MEMBER (EXCEPT TRUSS) MANUFACTURING. Organizations: TRACK FOUR INC (CONTACT/OPERATOR)
, SANTE FE AERO VISTA (CONTACT/OWNER)
Alternative names: BAC PRITCHARD INCORPORATED, BALTIMORE AIRCOIL COMPANY - PRITCHARD INCORPORATED
HIGHWAY 59 DISPOSAL SITE LANDFILL (640 NORTH HIGHWAY 59 6 MILES NORTH MERCED in MERCED, CA)
CRITERIA AND HAZARDOUS AIR POLLUTANT INVENTORY (Inventory of air pollution sources) REFUSE DISPOSAL (Solid waste facilities tracking) Business SIC classification: REFUSE SYSTEMS Business NAICS classification: SOLID WASTE LANDFILL. Organizations: COUNTY OF MERCED (CONTACT/OPERATOR)
MERCED SURGICAL AND DIAGNOSTIC CTR (3303 NORTH M ST in MERCED, CA)
(Resource Conservation and Recovery Act (tracking hazardous waste)) Business NAICS classification: MEDICAL LABORATORIES.
FRANKS AUTO (1290 W CARDELLA RD in MERCED, CA)
Small Quantity Generators, between 100 kg and 1000 kg of hazardous waste/month (Resource Conservation and Recovery Act (tracking hazardous waste)) Organizations: LEVI ROBERTS (CONTACT/OWNER)
FRANK MESA TRANSPORTATION (3322 DENVER WAY in MERCED, CA)
TRANSPORTER (Resource Conservation and Recovery Act (tracking hazardous waste)) - notification Organizations: FRANK E MESA (CONTACT/OWNER)
KITS CAMERAS 1 HOUR NO 42 (244 MERCED MALL in MERCED, CA)
Small Quantity Generators, between 100 kg and 1000 kg of hazardous waste/month (Resource Conservation and Recovery Act (tracking hazardous waste)) - notification Organizations: RITZ CAMERA CENTERS INC (CONTACT/OWNER)
MERCED MALL CHEVRON (1050 WEST OLIVE AVENUE in MERCED, CA)
CRITERIA AND HAZARDOUS AIR POLLUTANT INVENTORY (Inventory of air pollution sources) Business SIC classification: GASOLINE SERVICE STATIONS Alternative names: CHEVRON, MERCED MALL
J BLASINGAME & SONS INCORPORATED (15324 NORTH HIGHWAY 59 in MERCED, CA)
CRITERIA AND HAZARDOUS AIR POLLUTANT INVENTORY (Inventory of air pollution sources) Business SIC classification: CONSTRUCTION SAND AND GRAVEL
MERCED GAS & FOOD MART (190 W OLIVE AVE in MERCED, CA)
CRITERIA AND HAZARDOUS AIR POLLUTANT INVENTORY (Inventory of air pollution sources) Business SIC classification: GASOLINE SERVICE STATIONS
MERCED LAUNDRY (160 WEST MAIN STREET in MERCED, CA)
CRITERIA AND HAZARDOUS AIR POLLUTANT INVENTORY (Inventory of air pollution sources) Business SIC classification: DRYCLEANING PLANTS, EXCEPT RUG CLEANING
CENTRAL VALLEY CONCRETE (3823 NORTH HIGHWAY 59 in MERCED, CA)
CRITERIA AND HAZARDOUS AIR POLLUTANT INVENTORY (Inventory of air pollution sources) Business SIC classification: READY-MIXED CONCRETE
Housing units lacking complete plumbing facilities: 0.1% Housing units lacking complete kitchen facilities: 2.1%
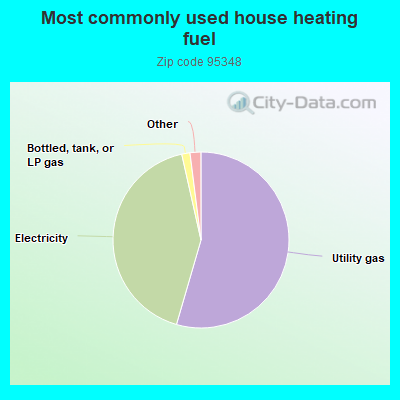
54.5%Utility gas
42.0%Electricity
1.5%Bottled, tank, or LP gas
0.7%Solar energy
0.6%Wood
Population in 1990: 19,719. Population change in the 1990s: +3,374 (+17.1%).
Place of birth for U.S.-born residents:
This state: 24,331
Northeast: 501
Midwest: 793
South: 872
West: 670
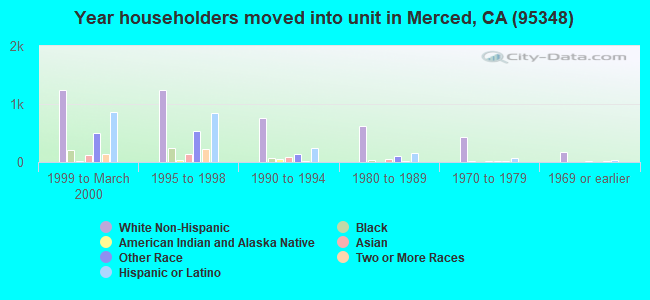
42% of the 95348 zip code residents lived in the same house 5 years ago. Out of people who lived in different houses, 70% lived in this county. Out of people who lived in different counties, 50% lived in California.
85% of the 95348 zip code residents lived in the same house 1 year ago. Out of people who lived in different houses, 46% moved from this county. Out of people who lived in different houses, 33% moved from different county within same state. Out of people who lived in different houses, 15% moved from different state. Out of people who lived in different houses, 5% moved from abroad.
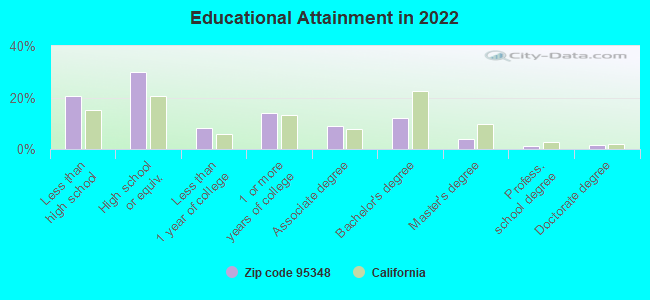
Private vs. public school enrollment:
Students in private schools in grades 1 to 8 (elementary and middle school): 99
Here:
2.5%
California:
10.5%
Students in private schools in grades 9 to 12 (high school): 79
Here:
3.9%
California:
8.5%
Students in private undergraduate colleges: 110
Here:
2.9%
California:
15.9%
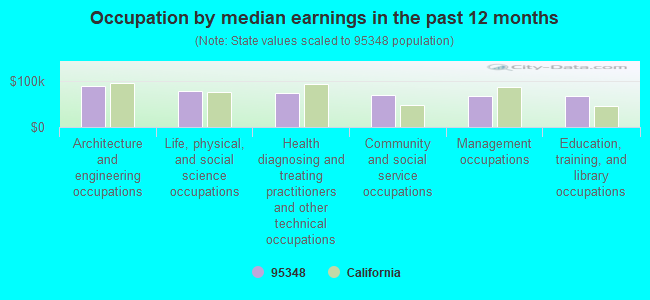
Occupation by median earnings in the past 12 months ($)
89,642Architecture and engineering occupations
78,205Life, physical, and social science occupations
75,195Health diagnosing and treating practitioners and other technical occupations
70,417Community and social service occupations
67,492Management occupations
67,417Education, training, and library occupations
Companies with federal contracts located in this zip code:
COOLING SHEDD, THE (2885 BUSINESS PKWY in MERCED, CA; small business) : $187,060 in 2 contractsin 2005
$187,060 with Defense Logistics Agency for Fueling and Other Petroleum Services - Excluding Storage. Signed on 2005-10-25. Completion date: 2006-09-30.
$0, same as above.Signed on 2005-10-25. Completion date: 2006-09-30.
Top industries in this zip code by the number of employees in 2005:
Administrative and Support and Waste Management and Remediation Services: Temporary Help Services (250-499 employees: 1 establishment, 100-249 employees: 1 establishment, 50-99 employees: 1 establishment, 20-49 employees: 1 establishment)
2005 - 2018 National Fire Incident Reporting System (NFIRS) incidents
Based on the data from the years 2005 - 2018 the average number of fire incidents per year is 55. The highest number of fires - 144 took place in 2018, and the least - 2 in 2006. The data has a rising trend.
When looking into fire subcategories, the most incidents belonged to: Outside Fires (62.8%), and Structure Fires (25.6%).
Fire incident types reported to NFIRS in Zip Code 95348


+$1,677
-$7,562
(% of AGI for various income ranges: -1.5% for AGIs below $10k, 0.1% for AGIs $25k-50k, 0.1% for AGIs $50k-75k, 0.2% for AGIs over 100k) Nearest zip codes: 95340, 95388, 95369, 95301, 95312, 95341.


 Based on the data from the years 2005 - 2018 the average number of fire incidents per year is 55. The highest number of fires - 144 took place in 2018, and the least - 2 in 2006. The data has a rising trend.
 When looking into fire subcategories, the most incidents belonged to: Outside Fires (62.8%), and Structure Fires (25.6%).