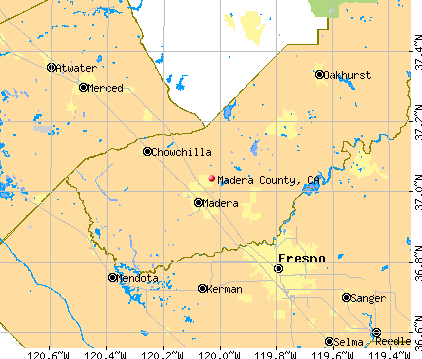
Madera County, California (CA)
County owner-occupied free and clear houses and condos in 2010: 7,765
County owner-occupied houses and condos in 2000: 23,949
Renter-occupied apartments: 15,591 (it was 12,206 in 2000)
| % of renters here: | 34% |
| State: | 44% |
Land area: 2136 sq. mi.
Water area: 17.5 sq. mi.
Population density: 75 people per square mile (average).
Industries providing employment: Educational, health and social services (22.3%), Agriculture,forestry,fishing and hunting, and mining (13.3%).
Type of workers:
- Private wage or salary: 74%
- Government: 18%
- Self-employed, not incorporated: 8%
- Unpaid family work: 0%
- OSM Map
- General Map
- Google Map
- MSN Map

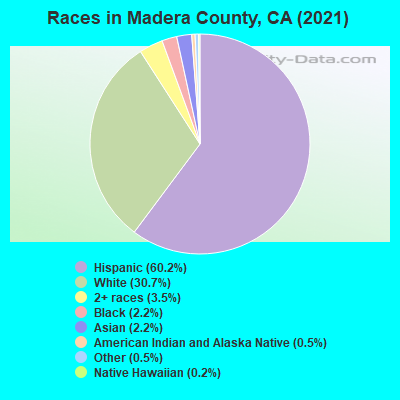
- 97,49960.8%Hispanic or Latino
- 48,18130.1%White Non-Hispanic Alone
- 4,3262.7%Two or more races
- 4,1842.6%Asian alone
- 3,7082.3%Black Non-Hispanic Alone
- 1,0250.6%Some other race alone
- 7980.5%Native Hawaiian and Other
Pacific Islander alone - 5350.3%American Indian and Alaska Native alone
| Median resident age: | 35.2 years |
| California median age: | 37.9 years |
| Males: 79,198 | |
| Females: 81,058 |

 | April 2021: CA Median Home Price Soars to $813,980; Sales Climb 65.1% Year-Over-Year (81 replies) |
| California's Linguistic Diversity (73 replies) |
| San Diego Back Country (31 replies) |
| Who Will Newsom Appoint Senator? (68 replies) |
| Measure of America 2021: 9 Million Californians Live in 62 Elite Enclaves (20 replies) |
| What are the San Joaquin valley and other inland cities like? (47 replies) |
| Madera County: | 3.0 people |
| California: | 3 people |
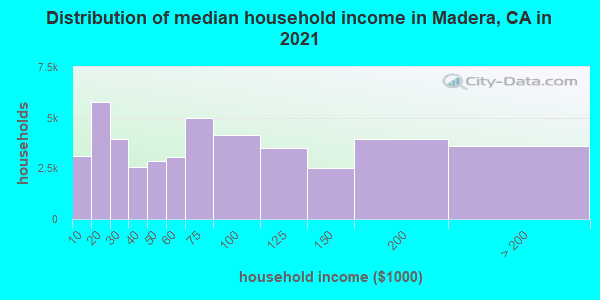
Estimated median household income in 2022: $76,920 ($36,286 in 1999)
| This county: | $76,920 |
| California: | $91,551 |
Median contract rent in 2022 for apartments: $993 (lower quartile is $767, upper quartile is $1,247)
| This county: | $993 |
| State: | $1719 |
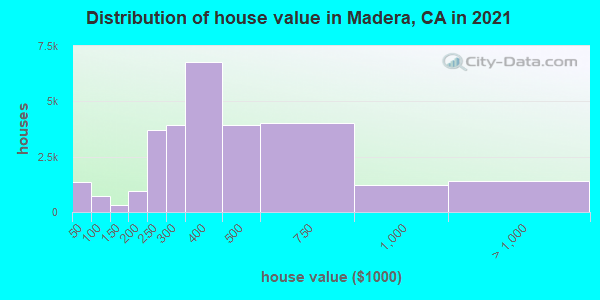
Estimated median house or condo value in 2022: $396,100 (it was $118,300 in 2000)
| Madera: | $396,100 |
| California: | $715,900 |
Mean price in 2022:
Median monthly housing costs for homes and condos with a mortgage: $1,889Detached houses: $442,742
Here: $442,742 State: $988,808 Townhouses or other attached units: $483,099
Here: $483,099 State: $838,546 In 5-or-more-unit structures: $367,091
Here: $367,091 State: $730,996 Mobile homes: $216,256
Here: $216,256 State: $184,506 Occupied boats, RVs, vans, etc.: $31,674
Here: $31,674 State: $204,957
Median monthly housing costs for units without a mortgage: $582
Institutionalized population: 8,135
Crime in 2020 (reported by the sheriff's office or county police, not the county total):
- Murders: 4
- Rapes: 22
- Robberies: 30
- Assaults: 175
- Burglaries: 118
- Thefts: 528
- Auto thefts: 27
Crime in 2019 (reported by the sheriff's office or county police, not the county total):
- Murders: 1
- Rapes: 34
- Robberies: 14
- Assaults: 408
- Burglaries: 375
- Thefts: 621
- Auto thefts: 21
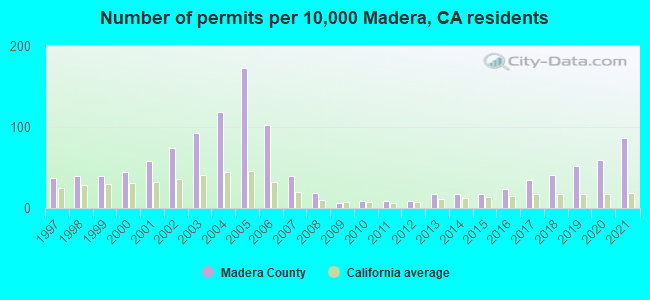
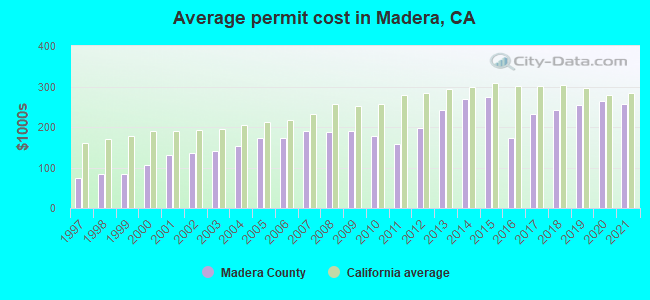
Single-family new house construction building permits:
- 2022: 880 buildings, average cost: $252,500
- 2021: 1066 buildings, average cost: $257,400
- 2020: 732 buildings, average cost: $264,400
- 2019: 644 buildings, average cost: $254,900
- 2018: 503 buildings, average cost: $242,800
- 2017: 415 buildings, average cost: $231,500
- 2016: 300 buildings, average cost: $173,400
- 2015: 211 buildings, average cost: $272,800
- 2014: 210 buildings, average cost: $268,800
- 2013: 215 buildings, average cost: $241,200
- 2012: 115 buildings, average cost: $197,400
- 2011: 112 buildings, average cost: $158,200
- 2010: 112 buildings, average cost: $178,500
- 2009: 68 buildings, average cost: $189,600
- 2008: 233 buildings, average cost: $187,400
- 2007: 486 buildings, average cost: $188,900
- 2006: 1269 buildings, average cost: $173,400
- 2005: 2135 buildings, average cost: $172,300
- 2004: 1463 buildings, average cost: $152,700
- 2003: 1139 buildings, average cost: $139,700
- 2002: 909 buildings, average cost: $136,900
- 2001: 713 buildings, average cost: $130,700
- 2000: 549 buildings, average cost: $105,600
- 1999: 481 buildings, average cost: $85,400
- 1998: 474 buildings, average cost: $83,100
- 1997: 457 buildings, average cost: $73,500
Median real estate property taxes paid for housing units with mortgages in 2022: $2,803 (0.7%)
Median real estate property taxes paid for housing units with no mortgage in 2022: $2,225 (0.6%)

| Madera County: | 24.3% |
| California: | 12.2% |
Median age of residents in 2022: 35.2 years old
(Males: 33.8 years old, Females: 36.4 years old)
(Median age for: White residents: 50.1 years old, Black residents: 46.1 years old, American Indian residents: 30.8 years old, Asian residents: 43.7 years old, Hispanic or Latino residents: 28.5 years old, Other race residents: 26.8 years old)
Area name: Madera, CA MSA
Fair market rent in 2006 for a 1-bedroom apartment in Madera County is $521 a month.
Fair market rent for a 2-bedroom apartment is $664 a month.
Fair market rent for a 3-bedroom apartment is $965 a month.
Cities in this county include: Madera, Oakhurst-North Fork, Chowchilla, Madera Acres, Bonadelle Ranchos-Madera Ranchos, Yosemite Lakes, Oakhurst, Parksdale, Ahwahnee, Parkwood.
| Zip code | City | Number of tests | Number of tests >= 4 pCi/L |
|---|---|---|---|
| 93601 | Ahwahnee | 28 | 0 |
| 93604 | Bass Lake | 16 | 5 |
| 93610 | Chowchilla | 4 | 0 |
| 93614 | Coarsegold | 24 | 1 |
| 93637 | Madera | 13 | 0 |
| 93638 | Madera | 22 | 2 |
| 93643 | North Fork | 50 | 16 |
| 93644 | Oakhurst | 144 | 25 |
| 93645 | O Neals | 1 | 0 |
| 93653 | Raymond | 6 | 0 |
| 93669 | Wishon | 3 | 1 |
Neighboring counties: Buchanan County, Virginia  , Mingo County, West Virginia , Meade County, Kentucky , Reynolds County, Missouri .
| Here: | 7.9% |
| California: | 5.1% |
Current college students: 5,995
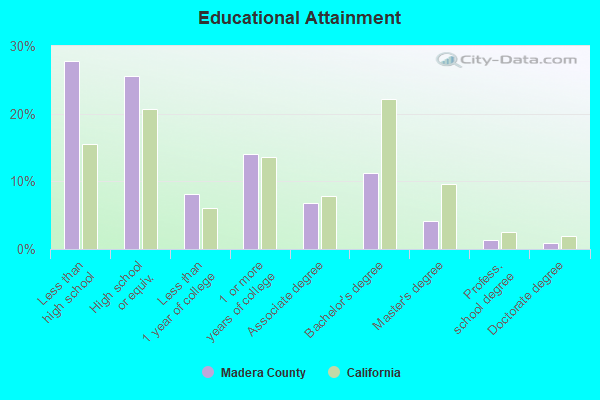
People 25 years of age or older with a high school degree or higher: 73.6%
People 25 years of age or older with a bachelor's degree or higher: 21.4%
Number of foreign born residents: 35,788 (30.4% naturalized citizens)
| Madera County: | 22.3% |
| Whole state: | 26.7% |
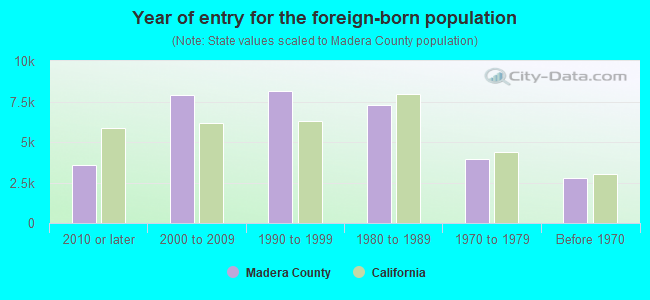
- Year of entry for the foreign-born population
- 4,6972010 or later
- 7,4742000 to 2009
- 8,0831990 to 1999
- 7,2921980 to 1989
- 3,9701970 to 1979
- 2,763Before 1970
Mean travel time to work (commute): minutes
Percentage of county residents living and working in this county: 99.3%
Housing units in structures:
- One, detached: 40,413
- One, attached: 1,168
- Two: 505
- 3 or 4: 1,657
- 5 to 9: 901
- 10 to 19: 879
- 20 to 49: 538
- 50 or more: 886
- Mobile homes: 3,865
- Boats, RVs, vans, etc.: 222
Housing units in Madera County with a mortgage: 20,862 (1,086 second mortgage, 0 home equity loan, 835 both second mortgage and home equity loan)
Houses without a mortgage: 319
| Here: | 5.9% with mortgage |
| State: | 98.6% with mortgage |
Religion statistics for Madera County

| Religion | Adherents | Congregations |
|---|---|---|
| Catholic | 56,566 | 3 |
| Evangelical Protestant | 15,077 | 89 |
| Other | 4,817 | 15 |
| Mainline Protestant | 2,808 | 14 |
| Black Protestant | 685 | 5 |
| None | 70,912 | - |
Source: Clifford Grammich, Kirk Hadaway, Richard Houseal, Dale E.Jones, Alexei Krindatch, Richie Stanley and Richard H.Taylor. 2012. 2010 U.S.Religion Census: Religious Congregations & Membership Study. Association of Statisticians of American Religious Bodies. Jones, Dale E., et al. 2002. Congregations and Membership in the United States 2000. Nashville, TN: Glenmary Research Center.
Food Environment Statistics:
| Madera County: | 2.06 / 10,000 pop. |
| State: | 2.14 / 10,000 pop. |
| This county: | 0.55 / 10,000 pop. |
| California: | 0.62 / 10,000 pop. |
| Madera County: | 3.23 / 10,000 pop. |
| California: | 1.49 / 10,000 pop. |
| This county: | 4.05 / 10,000 pop. |
| State: | 7.42 / 10,000 pop. |
| Madera County: | 7.6% |
| California: | 7.3% |
| Madera County: | 23.6% |
| State: | 21.3% |
| Here: | 15.5% |
| State: | 17.9% |
Agriculture in Madera County:
Average size of farms: 383 acresAverage value of agricultural products sold per farm: $399,120
Average value of crops sold per acre for harvested cropland: $1604.85
The value of nursery, greenhouse, floriculture, and sod as a percentage of the total market value of agricultural products sold: 1.26%
The value of livestock, poultry, and their products as a percentage of the total market value of agricultural products sold: 28.91%
Average total farm production expenses per farm: $306,429
Harvested cropland as a percentage of land in farms: 46.11%
Irrigated harvested cropland as a percentage of land in farms: 94.73%
Average market value of all machinery and equipment per farm: $92,867
The percentage of farms operated by a family or individual: 77.87%
Average age of principal farm operators: 57 years
Average number of cattle and calves per 100 acres of all land in farms: 21.51
Milk cows as a percentage of all cattle and calves: 32.76%
Corn for grain: 5657 harvested acres
All wheat for grain: 14069 harvested acres
Vegetables: 6,549 harvested acres
Land in orchards: 189,976 acres
Earthquake activity:
Madera County-area historical earthquake activity is significantly above California state average. It is 8475% greater than the overall U.S. average.On 4/18/1906 at 13:12:21, a magnitude 7.9 (7.9 UK, Class: Major, Intensity: VIII - XII) earthquake occurred 175.9 miles away from Madera County center, causing $524,000,000 total damage
On 7/21/1952 at 11:52:14, a magnitude 7.7 (7.7 UK) earthquake occurred 152.1 miles away from the county center, causing $50,000,000 total damage
On 11/4/1927 at 13:51:53, a magnitude 7.5 (7.5 UK) earthquake occurred 156.9 miles away from the county center
On 10/18/1989 at 00:04:15, a magnitude 7.1 (6.5 MB, 7.1 MS, 6.9 MW, 7.0 ML) earthquake occurred 96.0 miles away from the county center, causing 62 deaths (62 shaking deaths) and 3757 injuries, causing $1,305,032,704 total damage
On 12/21/1932 at 06:10:09, a magnitude 7.2 (7.2 UK) earthquake occurred 147.5 miles away from Madera County center
On 5/2/1983 at 23:42:37, a magnitude 6.7 (6.2 MB, 6.5 MS, 6.5 MW, 6.7 ML, Class: Strong, Intensity: VII - IX) earthquake occurred 58.5 miles away from the county center, causing $31,000,000 total damage
Magnitude types: body-wave magnitude (MB), local magnitude (ML), surface-wave magnitude (MS), moment magnitude (MW)
Most recent natural disasters:
- California Wildfires, Incident Period: September 4, 2020 - November 17, 2020, FEMA Id: 4569, Natural disaster type: Fire
- California Covid-19 Pandemic, Incident Period: January 20, 2020, FEMA Id: 4482, Natural disaster type: Other
- California Severe Storms, Flooding, Landslides, and Mudslides, Incident Period: March 29, 2006 to April 16, 2006, Major Disaster (Presidential) Declared DR-1646: June 05, 2006, FEMA Id: 1646, Natural disaster type: Storm, Mudslide, Landslide, Flood
- California Hurricane Katrina Evacuation, Incident Period: August 29, 2005 to October 01, 2005, Emergency Declared EM-3248: September 13, 2005, FEMA Id: 3248, Natural disaster type: Hurricane
- California Quartz Fire, Incident Period: July 25, 2005 to July 29, 2005, Fire Management Assistance Declared: July 25, 2005, FEMA Id: 2571, Natural disaster type: Fire
- California Severe Freeze, Incident Period: December 20, 1998 to December 28, 1998, Major Disaster (Presidential) Declared DR-1267: February 09, 1999, FEMA Id: 1267, Natural disaster type: Freeze
- California Severe Storms/Flooding, Incident Period: December 28, 1996 to April 01, 1997, Major Disaster (Presidential) Declared DR-1155: January 04, 1997, FEMA Id: 1155, Natural disaster type: Storm, Flood
- California Severe Winter Storms, Flooding, Landslides, Mud Flows, Incident Period: February 13, 1995 to April 19, 1995, Major Disaster (Presidential) Declared DR-1046: March 12, 1995, FEMA Id: 1046, Natural disaster type: Winter Storm, Landslide, Flood
- California Severe Winter Storms, Flooding, Landslides, Mud Flows, Incident Period: January 03, 1995 to February 10, 1995, Major Disaster (Presidential) Declared DR-1044: January 10, 1995, FEMA Id: 1044, Natural disaster type: Winter Storm, Landslide, Flood
- California Severe Storm, Winter Storm, Mud & Landslides, Flooding, Incident Period: January 05, 1993 to March 20, 1993, Major Disaster (Presidential) Declared DR-979: February 03, 1993, FEMA Id: 979, Natural disaster type: Winter Storm, Storm, Landslide, Flood
- 4 other natural disasters have been reported since 1953.
The number of natural disasters in Madera County (14) is near the US average (15).
Major Disasters (Presidential) Declared: 9
Emergencies Declared: 2
Causes of natural disasters: Floods: 7, Storms: 5, Landslides: 4, Winter Storms: 3, Fires: 2, Freezes: 2, Drought: 1, Hurricane: 1, Mudslide: 1, Other: 1 (Note: some incidents may be assigned to more than one category).
Means of transportation to work:
- Drove a car alone: 36,887 (70.0%)
- Carpooled: 6,800 (12.9%)
- Bus: 58 (0.1%)
- Subway or elevated rail: 9 (0.0%)
- Ferryboat: 34 (0.1%)
- Taxicab, motorcycle, or other means: 1,979 (3.8%)
- Bicycle: 139 (0.3%)
- Walked: 975 (1.9%)
- Worked at home: 5,513 (10.5%)
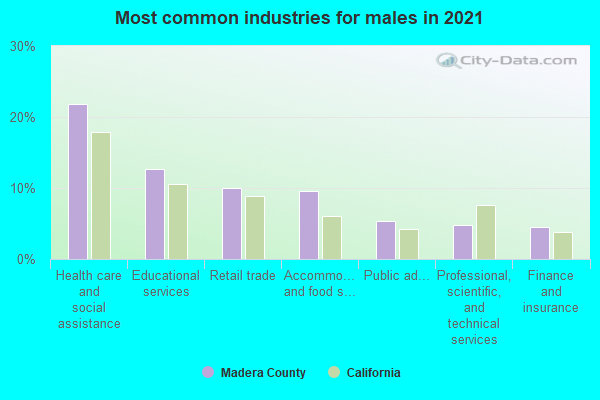
- Health care and social assistance (21%)
- Educational services (11%)
- Retail trade (11%)
- Accommodation and food services (6%)
- Agriculture, forestry, fishing and hunting (6%)
- Public administration (6%)
- Manufacturing (5%)
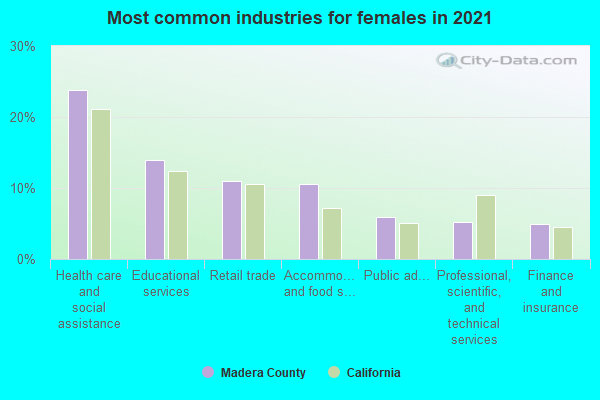
- Health care and social assistance (24%)
- Educational services (13%)
- Retail trade (12%)
- Accommodation and food services (7%)
- Agriculture, forestry, fishing and hunting (6%)
- Public administration (6%)
- Manufacturing (6%)
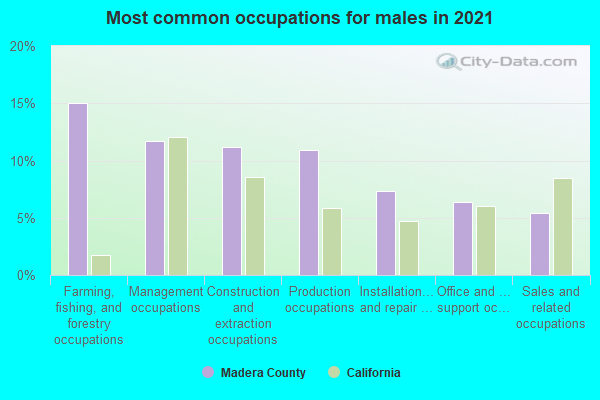
- Farming, fishing, and forestry occupations (16%)
- Management occupations (10%)
- Transportation occupations (9%)
- Production occupations (8%)
- Material moving occupations (8%)
- Construction and extraction occupations (7%)
- Installation, maintenance, and repair occupations (7%)
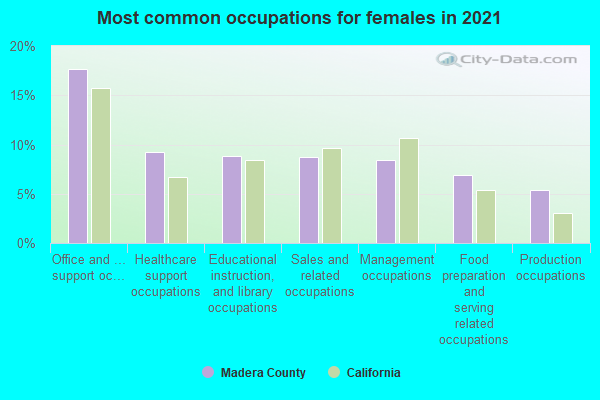
- Office and administrative support occupations (15%)
- Healthcare support occupations (13%)
- Management occupations (11%)
- Educational instruction, and library occupations (9%)
- Sales and related occupations (9%)
- Food preparation and serving related occupations (7%)
- Health diagnosing and treating practitioners and other technical occupations (6%)
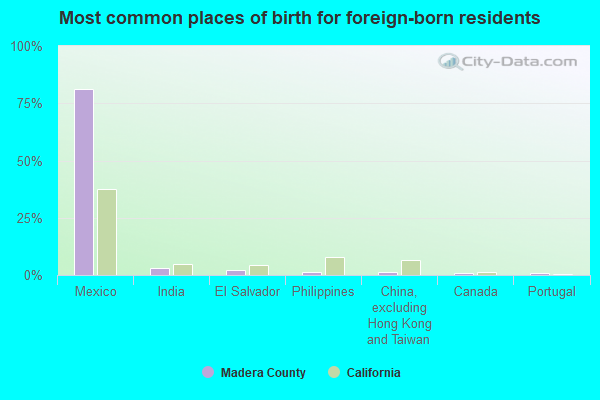
- Mexico (81%)
- India (4%)
- El Salvador (2%)
- China, excluding Hong Kong and Taiwan (1%)
- Guatemala (1%)
- Canada (1%)
- Colombia (1%)
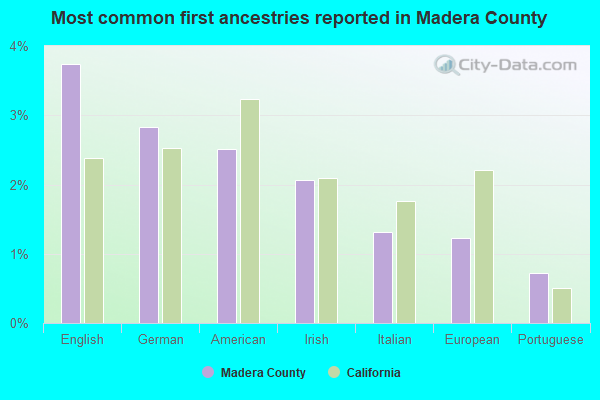
- English (3%)
- German (3%)
- American (2%)
- European (2%)
- Irish (2%)
- Italian (1%)
- Portuguese (1%)
People in group quarters in Madera County, California in 2010:
- 7,316 people in state prisons
- 414 people in local jails and other municipal confinement facilities
- 346 people in nursing facilities/skilled-nursing facilities
- 281 people in other noninstitutional facilities
- 132 people in emergency and transitional shelters (with sleeping facilities) for people experiencing homelessness
- 47 people in group homes intended for adults
- 34 people in group homes for juveniles (non-correctional)
- 29 people in workers' group living quarters and job corps centers
- 17 people in correctional facilities intended for juveniles
- 8 people in correctional residential facilities
People in group quarters in Madera County, California in 2000:
- 6,788 people in state prisons
- 320 people in nursing homes
- 296 people in local jails and other confinement facilities (including police lockups)
- 210 people in other noninstitutional group quarters
- 172 people in homes for the mentally retarded
- 80 people in agriculture workers' dormitories on farms
- 50 people in training schools for juvenile delinquents
- 36 people in short-term care, detention or diagnostic centers for delinquent children
- 30 people in wards in general hospitals for patients who have no usual home elsewhere
- 29 people in homes for abused, dependent, and neglected children
- 25 people in unknown juvenile institutions
- 17 people in homes or halfway houses for drug/alcohol abuse
- 14 people in other group homes
- 11 people in homes for the mentally ill
- 11 people in religious group quarters
- 11 people in other nonhousehold living situations
6.93% of this county's 2021 resident taxpayers lived in other counties in 2020 ($58,232 average adjusted gross income)
| Here: | 6.93% |
| California average: | 5.19% |
10 or fewer of this county's residents moved from foreign countries.
6.11% relocated from other counties in California ($52,828 average AGI)
0.82% relocated from other states ($5,404 average AGI)
Madera County: 0.82% California average: 1.56%
Top counties from which taxpayers relocated into this county between 2020 and 2021:
| from Fresno County, CA | |
| from Merced County, CA | |
| from Los Angeles County, CA | |
| from Santa Clara County, CA | |
| from Stanislaus County, CA | |
| from Sacramento County, CA | |
| from San Diego County, CA |
5.99% of this county's 2020 resident taxpayers moved to other counties in 2021 ($52,226 average adjusted gross income)
| Here: | 5.99% |
| California average: | 6.14% |
10 or fewer of this county's residents moved to foreign countries.
4.33% relocated to other counties in California ($33,252 average AGI)
1.67% relocated to other states ($18,974 average AGI)
Madera County: 1.67% California average: 2.55%
Top counties to which taxpayers relocated from this county between 2020 and 2021:
| to Fresno County, CA | |
| to Merced County, CA | |
| to Los Angeles County, CA | |
| to San Diego County, CA | |
| to Sacramento County, CA | |
| to Stanislaus County, CA | |
| to Santa Clara County, CA |
Births per 1000 population from 1990 to 1999: 18.6
Births per 1000 population from 2000 to 2009: 17.1
Births per 1000 population from 2010 to 2022: 12.3
Deaths per 1000 population from 1990 to 1999: 7.2
Deaths per 1000 population from 2000 to 2009: 6.8
Deaths per 1000 population from 2010 to 2020: 7.0
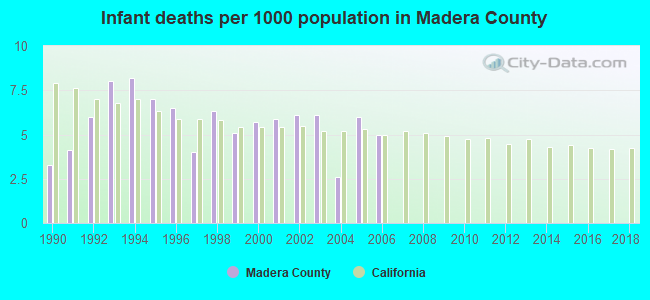
Infant deaths per 1000 live births from 1990 to 1999: 5.8
Infant deaths per 1000 live births from 2000 to 2006: 5.3
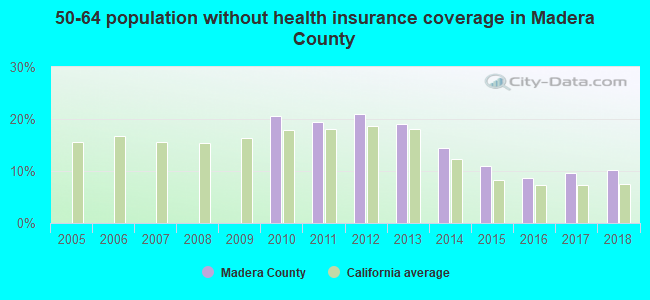
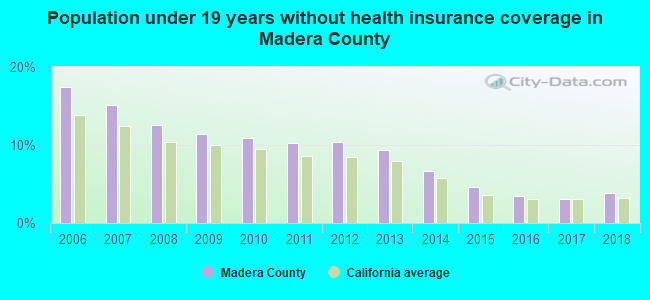
Persons under 19 years old without health insurance coverage in 2018: 3.9%
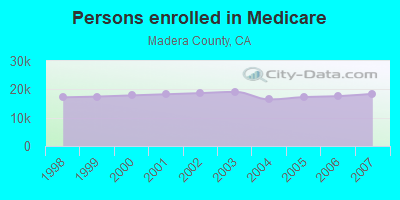
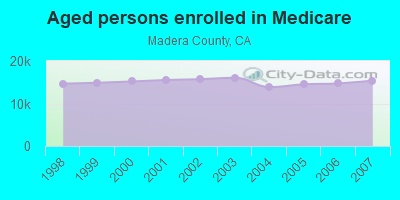
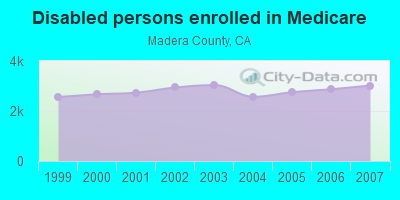
Persons enrolled in hospital insurance and/or supplemental medical insurance (Medicare) in July 1, 2007: 18,414 (15,396 aged, 3,018 disabled)
Children under 18 without health insurance coverage in 2007: 5,679 (14%)
Most common underlying causes of death in Madera County, California in 1999 - 2019:
- Atherosclerotic heart disease (1,536)
- Bronchus or lung, unspecified - Malignant neoplasms (1,048)
- Acute myocardial infarction, unspecified (1,012)
- Alzheimer disease, unspecified (961)
- Atherosclerotic cardiovascular disease, so described (957)
- Chronic obstructive pulmonary disease, unspecified (800)
- Stroke, not specified as haemorrhage or infarction (586)
- Pneumonia, unspecified (389)
- Congestive heart failure (322)
- Colon, unspecified - Malignant neoplasms (280)
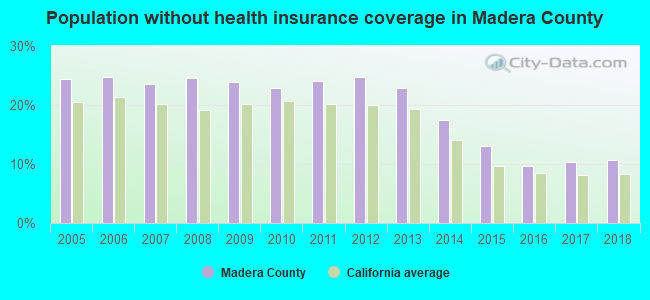
Population without health insurance coverage in 2000: 25%
Children under 18 without health insurance coverage in 2000: 21%
Homicides per 1,000,000 population from 2000 to 2006: 62.5. This is less than state average.
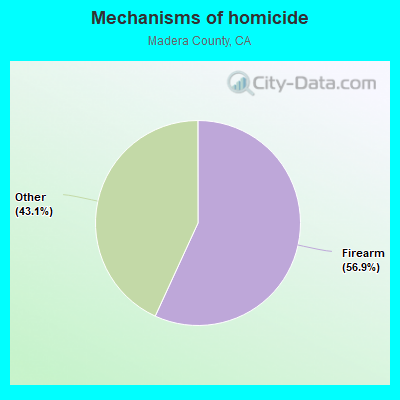
- Firearm - 35.6
- Other - 27.0
Suicides per 1,000,000 population from 2000 to 2006: 94.9. This is less than state average.
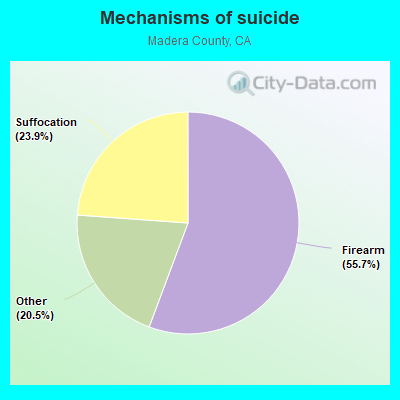
- Firearm - 52.8
- Suffocation - 22.6
- Other - 19.4
Household type by relationship:
Households: 160,256- Male householders: 22,266 (3,167 living alone), Female householders: 23,273 (5,243 living alone)
23,696 spouses (22,951 opposite-sex spouses), 5,252 unmarried partners, (5,252 opposite-sex unmarried partners), 53,831 children (48,869 natural, 1,195 adopted, 3,767 stepchildren), 5,014 grandchildren, 5,034 brothers or sisters, 2,985 parents, 0 foster children, 5,487 other relatives, 7,521 non-relatives
- In group quarters: 5,897
Size of family households: 13,153 2-persons, 5,554 3-persons, 5,817 4-persons, 4,891 5-persons, 2,692 6-persons, 2,683 7-or-more-persons.
Size of nonfamily households: 8,410 1-person, 1,815 2-persons, 117 3-persons, 211 4-persons, 196 5-persons.
19,636 married couples with children.
14,775 single-parent households (7,307 men, 7,468 women).
54.0% of residents of Madera speak English at home.
42.8% of residents speak Spanish at home (57% speak English very well, 14% speak English well, 11% speak English not well, 17% don't speak English at all).
2.0% of residents speak other Indo-European language at home (76% speak English very well, 9% speak English well, 8% speak English not well, 7% don't speak English at all).
1.0% of residents speak Asian or Pacific Island language at home (67% speak English very well, 17% speak English well, 11% speak English not well, 5% don't speak English at all).
0.3% of residents speak other language at home (65% speak English very well, 13% speak English well, 16% speak English not well, 7% don't speak English at all).
In fiscal year 2004:
Federal Government expenditure: $580,665,000 ($4,179 per capita)
Department of Defense expenditure: $11,595,000
Federal direct payments to individuals for retirement and disability: $247,604,000
Federal other direct payments to individuals: $123,881,000
Federal direct payments not to individuals: $15,616,000
Federal grants: $151,734,000
Federal procurement contracts: $25,857,000 ($493,000 Department of Defense)
Federal salaries and wages: $15,974,000 ($1,683,000 Department of Defense)
Federal Government direct loans: $7,926,000
Federal guaranteed/insured loans: $59,331,000
Federal Government insurance: $231,029,000
Population change from April 1, 2000 to July 1, 2005:
Births: 11,599| Here: | 81 per 1000 residents |
| State: | 77 per 1000 residents |
Deaths: 4,827
| Here: | 34 per 1000 residents |
| State: | 34 per 1000 residents |
Net international migration: +4,743
| Here: | +33 per 1000 residents |
| State: | +39 per 1000 residents |
Net internal migration: +8,343
| Here: | |
| State: |
Total withdrawal of fresh water for public supply: 19.21 millions of gallons per day (99% from ground, 1% from surface)
| Here: | 6.0 |
| State: | 6.0 |
| Here: | 4.5 |
| State: | 3.9 |
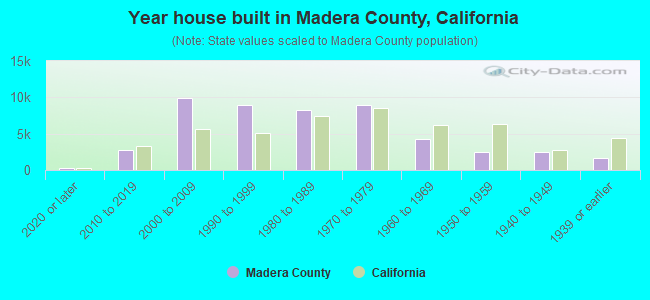
- Year house built in Madera County, California
- 9522020 or later
- 4,2772010 to 2019
- 12,2592000 to 2009
- 7,9021990 to 1999
- 6,6941980 to 1989
- 9,3531970 to 1979
- 2,7321960 to 1969
- 2,7631950 to 1959
- 1,8571940 to 1949
- 2,2451939 or earlier
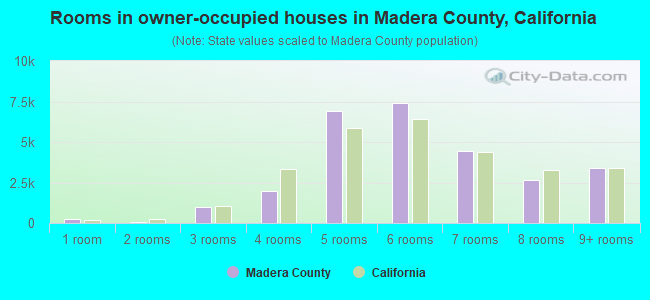
- Rooms in owner-occupied houses in Madera County, California
- 01 room
- 2222 rooms
- 1,2263 rooms
- 3,6074 rooms
- 6,4855 rooms
- 8,0346 rooms
- 4,6737 rooms
- 4,0988 rooms
- 3,0559+ rooms
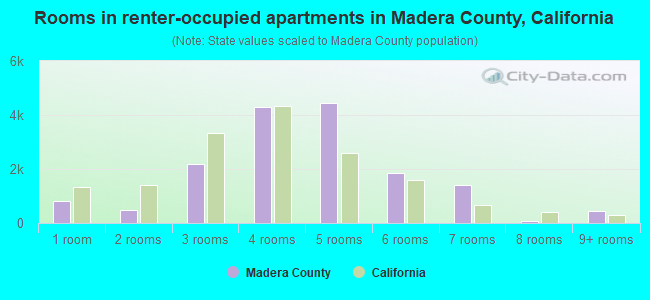
- Rooms in renter-occupied apartments in Madera County, California
- 1,1271 room
- 4092 rooms
- 1,6373 rooms
- 4,0354 rooms
- 3,9695 rooms
- 1,8076 rooms
- 6617 rooms
- 3928 rooms
- 1029+ rooms
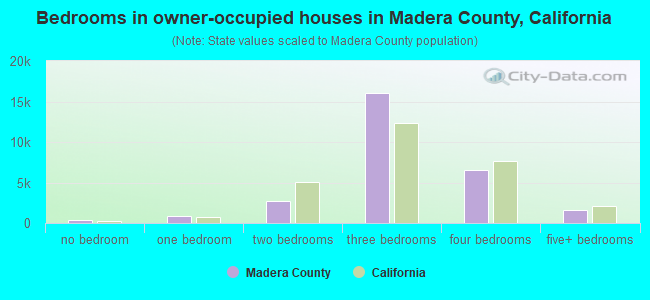
- Bedrooms in owner-occupied houses in Madera County, California
- 0no bedroom
- 5121 bedroom
- 3,5392 bedrooms
- 17,6883 bedrooms
- 8,2384 bedrooms
- 1,4235+ bedrooms
- Bedrooms in renter-occupied apartments in Madera County, California
- 1,127no bedroom
- 1,4201 bedroom
- 5,0952 bedrooms
- 4,5563 bedrooms
- 1,9414 bedrooms
- 05+ bedrooms
- Cars and other vehicles available in Madera County in owner-occupied houses/condos
- 482no vehicle
- 6,9981 vehicle
- 10,6212 vehicles
- 6,5503 vehicles
- 4,0824 vehicles
- 2,6675+ vehicles
- Cars and other vehicles available in Madera County in renter-occupied apartments
- 1,187no vehicle
- 5,0691 vehicle
- 5,1442 vehicles
- 1,6033 vehicles
- 6844 vehicles
- 4525+ vehicles
89.8% of Madera County residents lived in the same house 1 years ago.
Out of people who lived in different houses, 31% lived in this county.
Out of people who lived in different counties, 88% lived in California.
| Madera County: | 89.8% |
| State average: | 88.9% |
Place of birth for U.S.-born residents:
- This state: 107,429
- Other state: 14,670
- Northeast: 1,984
- Midwest: 4,655
- South: 4,286
- West: 3,745
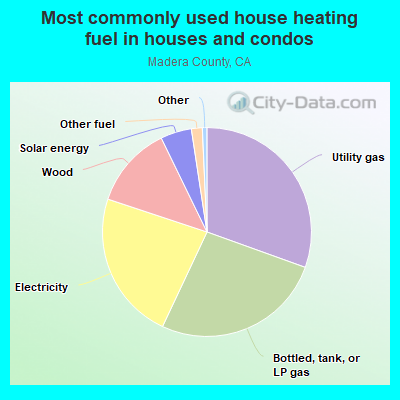
- 36.6%Utility gas
- 25.0%Electricity
- 24.7%Bottled, tank, or LP gas
- 8.3%Wood
- 2.9%Solar energy
- 1.5%Other fuel
- 1.0%No fuel used
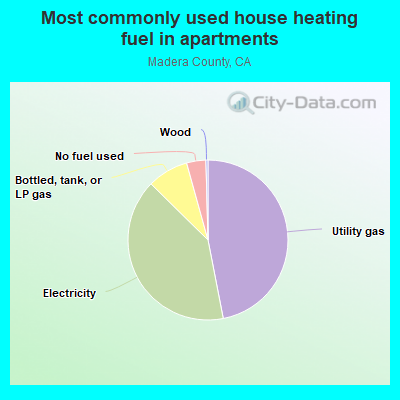
- 41.5%Utility gas
- 39.3%Electricity
- 11.1%Bottled, tank, or LP gas
- 3.3%Other fuel
- 1.9%Fuel oil, kerosene, etc.
- 1.4%Solar energy
- 1.0%Wood
- 0.6%No fuel used
Private vs. public school enrollment:
| Here: | 6.3% |
| California: | 10.5% |
| Here: | 2.2% |
| California: | 8.5% |
| Here: | 7.8% |
| California: | 15.9% |
Madera County government finances - Expenditure in 2020:
- Assistance and Subsidies - Public Welfare, Cash Assistance Programs - Other: $38,577,000
Public Welfare, Cash Assistance Programs - Other: $34,097,000
- Charges - Other: $38,140,000
Other: $23,746,000
Solid Waste Management: $8,377,000
Solid Waste Management: $7,818,000
Regular Highways: $4,692,000
Regular Highways: $3,545,000
Sewerage: $3,287,000
Sewerage: $3,100,000
Elementary and Secondary Education - Other: $1,094,000
Elementary and Secondary Education - Other: $1,004,000
Natural Resources - Other: $590,000
Natural Resources - Other: $389,000
- Construction - Water Utilities: $5,785,000
Water Utilities: $5,543,000
Elementary and Secondary Education: $4,540,000
Elementary and Secondary Education: $1,311,000
Sewerage: $30,000
Sewerage: $29,000
- Current Operations - Elementary and Secondary Education: $43,845,000
Health - Other: $41,802,000
Elementary and Secondary Education: $39,350,000
Public Welfare - Other: $37,542,000
Public Welfare - Other: $35,383,000
Health - Other: $35,222,000
General - Other: $28,039,000
Police Protection: $26,747,000
Correctional Institutions: $25,287,000
Correctional Institutions: $23,127,000
Police Protection: $18,515,000
Judicial and Legal Services: $15,564,000
Judicial and Legal Services: $14,927,000
Regular Highways: $14,570,000
General Public Buildings: $12,071,000
Water Utilities: $11,981,000
Regular Highways: $11,540,000
Local Fire Protection: $9,648,000
General - Other: $9,346,000
Solid Waste Management: $7,133,000
Local Fire Protection: $7,098,000
Financial Administration: $6,738,000
Central Staff Services: $6,722,000
Central Staff Services: $6,482,000
Financial Administration: $5,881,000
Natural Resources - Other: $5,688,000
Solid Waste Management: $5,168,000
Corrections - Other: $5,134,000
Corrections - Other: $5,044,000
Water Utilities: $4,131,000
Sewerage: $3,174,000
Sewerage: $2,865,000
Protective Inspection and Regulation - Other: $2,581,000
Natural Resources - Other: $2,324,000
Protective Inspection and Regulation - Other: $2,047,000
Libraries: $1,771,000
Libraries: $1,434,000
Parks and Recreation: $847,000
Parks and Recreation: $847,000
Public Welfare, Vendor Payments for Other Purposes: $44,000
- Federal Intergovernmental - Other: $5,983,000
Other: $2,356,000
Highways: $1,918,000
Water Utilities: $1,915,000
General Local Government Support: $1,265,000
General Local Government Support: $1,246,000
Highways: $1,078,000
Housing and Community Development: $982,000
Transit Utilities: $827,000
Transit Utilities: $639,000
Housing and Community Development: $291,000
Natural Resources: $266,000
Natural Resources: $203,000
Education: $67,000
Water Utilities: $35,000
Education: $28,000
- General - Interest on Debt: $2,372,000
Interest on Debt: $1,510,000
- Intergovernmental to Local - Other - Elementary and Secondary Education: $14,340,000
Other - Elementary and Secondary Education: $9,118,000
Other - General - Other: $240,000
- Intergovernmental to State - Judicial and Legal Services: $1,026,000
Judicial and Legal Services: $1,026,000
- Local Intergovernmental - Education: $10,574,000
Education: $7,559,000
Housing and Community Development: $1,940,000
Housing and Community Development: $1,668,000
Health and Hospitals: $1,549,000
Transit Utilities: $1,074,000
Other: $551,000
Other: $340,000
- Long Term Debt - Outstanding Unspecified Public Purpose: $163,473,000
Beginning Outstanding - Unspecified Public Purpose: $99,925,000
Outstanding Unspecified Public Purpose: $73,224,000
Issue, Unspecified Public Purpose: $70,901,000
Beginning Outstanding - Unspecified Public Purpose: $60,521,000
Issue, Unspecified Public Purpose: $16,216,000
Retired Unspecified Public Purpose: $7,352,000
Retired Unspecified Public Purpose: $3,513,000
- Miscellaneous - Special Assessments: $8,622,000
Special Assessments: $4,501,000
Fines and Forfeits: $3,276,000
Interest Earnings: $3,028,000
General Revenue - Other: $2,544,000
General Revenue - Other: $2,297,000
Fines and Forfeits: $1,782,000
Sale of Property: $933,000
Sale of Property: $708,000
Interest Earnings: $317,000
Rents: $99,000
Rents: $20,000
Royalties: $1,000
Royalties: $1,000
- Other Capital Outlay - Water Utilities: $66,651,000
Water Utilities: $61,307,000
Public Welfare - Other: $56,409,000
Sewerage: $50,461,000
Sewerage: $30,806,000
Regular Highways: $18,994,000
Health - Other: $17,706,000
Correctional Institutions: $7,609,000
Regular Highways: $6,322,000
Police Protection: $5,127,000
Elementary and Secondary Education: $1,266,000
Local Fire Protection: $1,095,000
Public Welfare - Other: $410,000
Police Protection: $395,000
General - Other: $332,000
General - Other: $329,000
Corrections - Other: $324,000
General Public Building: $170,000
Parks and Recreation: $120,000
Health - Other: $104,000
Judicial and Legal Services: $103,000
Elementary and Secondary Education: $85,000
Libraries: $69,000
Parks and Recreation: $69,000
Correctional Institutions: $16,000
Financial Administration: $3,000
- Other Funds - Cash and Securities: $159,884,000
Cash and Securities: $71,035,000
- Revenue - Water Utilities: $11,490,000
Water Utilities: $3,178,000
- State Intergovernmental - Public Welfare: $83,377,000
Public Welfare: $75,977,000
Education: $38,653,000
Other: $35,933,000
Education: $35,730,000
Health and Hospitals: $28,014,000
Health and Hospitals: $26,512,000
Other: $23,419,000
Highways: $14,267,000
Highways: $7,977,000
Water Utilities: $2,070,000
Transit Utilities: $1,421,000
Water Utilities: $1,079,000
General Local Government Support: $332,000
General Local Government Support: $283,000
Sewerage: $22,000
Sewerage: $2,000
- Tax - Property: $52,232,000
Property: $52,222,000
General Sales and Gross Receipts: $7,197,000
General Sales and Gross Receipts: $6,891,000
Other Selective Sales: $4,715,000
Other Selective Sales: $3,629,000
Occupation and Business License - Other: $2,587,000
Other License: $2,455,000
Public Utilities Sales: $2,382,000
Other License: $2,293,000
Public Utilities Sales: $2,144,000
Occupation and Business License - Other: $2,027,000
Other: $1,871,000
Other: $1,673,000
Documentary and Stock Transfer: $1,064,000
Documentary and Stock Transfer: $1,021,000
- Total Salaries and Wages: $23,852,000
: $22,438,000
- Water Utilities - Interest on Debt: $940,000
Interest on Debt: $204,000
Madera County government finances - Revenue in 2020:
- Assistance and Subsidies - Public Welfare, Cash Assistance Programs - Other: $38,577,000
Public Welfare, Cash Assistance Programs - Other: $34,097,000
- Charges - Other: $38,140,000
Other: $23,746,000
Solid Waste Management: $8,377,000
Solid Waste Management: $7,818,000
Regular Highways: $4,692,000
Regular Highways: $3,545,000
Sewerage: $3,287,000
Sewerage: $3,100,000
Elementary and Secondary Education - Other: $1,094,000
Elementary and Secondary Education - Other: $1,004,000
Natural Resources - Other: $590,000
Natural Resources - Other: $389,000
- Construction - Water Utilities: $5,785,000
Water Utilities: $5,543,000
Elementary and Secondary Education: $4,540,000
Elementary and Secondary Education: $1,311,000
Sewerage: $30,000
Sewerage: $29,000
- Current Operations - Elementary and Secondary Education: $43,845,000
Health - Other: $41,802,000
Elementary and Secondary Education: $39,350,000
Public Welfare - Other: $37,542,000
Public Welfare - Other: $35,383,000
Health - Other: $35,222,000
General - Other: $28,039,000
Police Protection: $26,747,000
Correctional Institutions: $25,287,000
Correctional Institutions: $23,127,000
Police Protection: $18,515,000
Judicial and Legal Services: $15,564,000
Judicial and Legal Services: $14,927,000
Regular Highways: $14,570,000
General Public Buildings: $12,071,000
Water Utilities: $11,981,000
Regular Highways: $11,540,000
Local Fire Protection: $9,648,000
General - Other: $9,346,000
Solid Waste Management: $7,133,000
Local Fire Protection: $7,098,000
Financial Administration: $6,738,000
Central Staff Services: $6,722,000
Central Staff Services: $6,482,000
Financial Administration: $5,881,000
Natural Resources - Other: $5,688,000
Solid Waste Management: $5,168,000
Corrections - Other: $5,134,000
Corrections - Other: $5,044,000
Water Utilities: $4,131,000
Sewerage: $3,174,000
Sewerage: $2,865,000
Protective Inspection and Regulation - Other: $2,581,000
Natural Resources - Other: $2,324,000
Protective Inspection and Regulation - Other: $2,047,000
Libraries: $1,771,000
Libraries: $1,434,000
Parks and Recreation: $847,000
Parks and Recreation: $847,000
Public Welfare, Vendor Payments for Other Purposes: $44,000
- Federal Intergovernmental - Other: $5,983,000
Other: $2,356,000
Highways: $1,918,000
Water Utilities: $1,915,000
General Local Government Support: $1,265,000
General Local Government Support: $1,246,000
Highways: $1,078,000
Housing and Community Development: $982,000
Transit Utilities: $827,000
Transit Utilities: $639,000
Housing and Community Development: $291,000
Natural Resources: $266,000
Natural Resources: $203,000
Education: $67,000
Water Utilities: $35,000
Education: $28,000
- General - Interest on Debt: $2,372,000
Interest on Debt: $1,510,000
- Intergovernmental to Local - Other - Elementary and Secondary Education: $14,340,000
Other - Elementary and Secondary Education: $9,118,000
Other - General - Other: $240,000
- Intergovernmental to State - Judicial and Legal Services: $1,026,000
Judicial and Legal Services: $1,026,000
- Local Intergovernmental - Education: $10,574,000
Education: $7,559,000
Housing and Community Development: $1,940,000
Housing and Community Development: $1,668,000
Health and Hospitals: $1,549,000
Transit Utilities: $1,074,000
Other: $551,000
Other: $340,000
- Long Term Debt - Outstanding Unspecified Public Purpose: $163,473,000
Beginning Outstanding - Unspecified Public Purpose: $99,925,000
Outstanding Unspecified Public Purpose: $73,224,000
Issue, Unspecified Public Purpose: $70,901,000
Beginning Outstanding - Unspecified Public Purpose: $60,521,000
Issue, Unspecified Public Purpose: $16,216,000
Retired Unspecified Public Purpose: $7,352,000
Retired Unspecified Public Purpose: $3,513,000
- Miscellaneous - Special Assessments: $8,622,000
Special Assessments: $4,501,000
Fines and Forfeits: $3,276,000
Interest Earnings: $3,028,000
General Revenue - Other: $2,544,000
General Revenue - Other: $2,297,000
Fines and Forfeits: $1,782,000
Sale of Property: $933,000
Sale of Property: $708,000
Interest Earnings: $317,000
Rents: $99,000
Rents: $20,000
Royalties: $1,000
Royalties: $1,000
- Other Capital Outlay - Water Utilities: $66,651,000
Water Utilities: $61,307,000
Public Welfare - Other: $56,409,000
Sewerage: $50,461,000
Sewerage: $30,806,000
Regular Highways: $18,994,000
Health - Other: $17,706,000
Correctional Institutions: $7,609,000
Regular Highways: $6,322,000
Police Protection: $5,127,000
Elementary and Secondary Education: $1,266,000
Local Fire Protection: $1,095,000
Public Welfare - Other: $410,000
Police Protection: $395,000
General - Other: $332,000
General - Other: $329,000
Corrections - Other: $324,000
General Public Building: $170,000
Parks and Recreation: $120,000
Health - Other: $104,000
Judicial and Legal Services: $103,000
Elementary and Secondary Education: $85,000
Libraries: $69,000
Parks and Recreation: $69,000
Correctional Institutions: $16,000
Financial Administration: $3,000
- Other Funds - Cash and Securities: $159,884,000
Cash and Securities: $71,035,000
- Revenue - Water Utilities: $11,490,000
Water Utilities: $3,178,000
- State Intergovernmental - Public Welfare: $83,377,000
Public Welfare: $75,977,000
Education: $38,653,000
Other: $35,933,000
Education: $35,730,000
Health and Hospitals: $28,014,000
Health and Hospitals: $26,512,000
Other: $23,419,000
Highways: $14,267,000
Highways: $7,977,000
Water Utilities: $2,070,000
Transit Utilities: $1,421,000
Water Utilities: $1,079,000
General Local Government Support: $332,000
General Local Government Support: $283,000
Sewerage: $22,000
Sewerage: $2,000
- Tax - Property: $52,232,000
Property: $52,222,000
General Sales and Gross Receipts: $7,197,000
General Sales and Gross Receipts: $6,891,000
Other Selective Sales: $4,715,000
Other Selective Sales: $3,629,000
Occupation and Business License - Other: $2,587,000
Other License: $2,455,000
Public Utilities Sales: $2,382,000
Other License: $2,293,000
Public Utilities Sales: $2,144,000
Occupation and Business License - Other: $2,027,000
Other: $1,871,000
Other: $1,673,000
Documentary and Stock Transfer: $1,064,000
Documentary and Stock Transfer: $1,021,000
- Total Salaries and Wages: $23,852,000
: $22,438,000
- Water Utilities - Interest on Debt: $940,000
Interest on Debt: $204,000
Madera County government finances - Debt in 2020:
- Assistance and Subsidies - Public Welfare, Cash Assistance Programs - Other: $38,577,000
Public Welfare, Cash Assistance Programs - Other: $34,097,000
- Charges - Other: $38,140,000
Other: $23,746,000
Solid Waste Management: $8,377,000
Solid Waste Management: $7,818,000
Regular Highways: $4,692,000
Regular Highways: $3,545,000
Sewerage: $3,287,000
Sewerage: $3,100,000
Elementary and Secondary Education - Other: $1,094,000
Elementary and Secondary Education - Other: $1,004,000
Natural Resources - Other: $590,000
Natural Resources - Other: $389,000
- Construction - Water Utilities: $5,785,000
Water Utilities: $5,543,000
Elementary and Secondary Education: $4,540,000
Elementary and Secondary Education: $1,311,000
Sewerage: $30,000
Sewerage: $29,000
- Current Operations - Elementary and Secondary Education: $43,845,000
Health - Other: $41,802,000
Elementary and Secondary Education: $39,350,000
Public Welfare - Other: $37,542,000
Public Welfare - Other: $35,383,000
Health - Other: $35,222,000
General - Other: $28,039,000
Police Protection: $26,747,000
Correctional Institutions: $25,287,000
Correctional Institutions: $23,127,000
Police Protection: $18,515,000
Judicial and Legal Services: $15,564,000
Judicial and Legal Services: $14,927,000
Regular Highways: $14,570,000
General Public Buildings: $12,071,000
Water Utilities: $11,981,000
Regular Highways: $11,540,000
Local Fire Protection: $9,648,000
General - Other: $9,346,000
Solid Waste Management: $7,133,000
Local Fire Protection: $7,098,000
Financial Administration: $6,738,000
Central Staff Services: $6,722,000
Central Staff Services: $6,482,000
Financial Administration: $5,881,000
Natural Resources - Other: $5,688,000
Solid Waste Management: $5,168,000
Corrections - Other: $5,134,000
Corrections - Other: $5,044,000
Water Utilities: $4,131,000
Sewerage: $3,174,000
Sewerage: $2,865,000
Protective Inspection and Regulation - Other: $2,581,000
Natural Resources - Other: $2,324,000
Protective Inspection and Regulation - Other: $2,047,000
Libraries: $1,771,000
Libraries: $1,434,000
Parks and Recreation: $847,000
Parks and Recreation: $847,000
Public Welfare, Vendor Payments for Other Purposes: $44,000
- Federal Intergovernmental - Other: $5,983,000
Other: $2,356,000
Highways: $1,918,000
Water Utilities: $1,915,000
General Local Government Support: $1,265,000
General Local Government Support: $1,246,000
Highways: $1,078,000
Housing and Community Development: $982,000
Transit Utilities: $827,000
Transit Utilities: $639,000
Housing and Community Development: $291,000
Natural Resources: $266,000
Natural Resources: $203,000
Education: $67,000
Water Utilities: $35,000
Education: $28,000
- General - Interest on Debt: $2,372,000
Interest on Debt: $1,510,000
- Intergovernmental to Local - Other - Elementary and Secondary Education: $14,340,000
Other - Elementary and Secondary Education: $9,118,000
Other - General - Other: $240,000
- Intergovernmental to State - Judicial and Legal Services: $1,026,000
Judicial and Legal Services: $1,026,000
- Local Intergovernmental - Education: $10,574,000
Education: $7,559,000
Housing and Community Development: $1,940,000
Housing and Community Development: $1,668,000
Health and Hospitals: $1,549,000
Transit Utilities: $1,074,000
Other: $551,000
Other: $340,000
- Long Term Debt - Outstanding Unspecified Public Purpose: $163,473,000
Beginning Outstanding - Unspecified Public Purpose: $99,925,000
Outstanding Unspecified Public Purpose: $73,224,000
Issue, Unspecified Public Purpose: $70,901,000
Beginning Outstanding - Unspecified Public Purpose: $60,521,000
Issue, Unspecified Public Purpose: $16,216,000
Retired Unspecified Public Purpose: $7,352,000
Retired Unspecified Public Purpose: $3,513,000
- Miscellaneous - Special Assessments: $8,622,000
Special Assessments: $4,501,000
Fines and Forfeits: $3,276,000
Interest Earnings: $3,028,000
General Revenue - Other: $2,544,000
General Revenue - Other: $2,297,000
Fines and Forfeits: $1,782,000
Sale of Property: $933,000
Sale of Property: $708,000
Interest Earnings: $317,000
Rents: $99,000
Rents: $20,000
Royalties: $1,000
Royalties: $1,000
- Other Capital Outlay - Water Utilities: $66,651,000
Water Utilities: $61,307,000
Public Welfare - Other: $56,409,000
Sewerage: $50,461,000
Sewerage: $30,806,000
Regular Highways: $18,994,000
Health - Other: $17,706,000
Correctional Institutions: $7,609,000
Regular Highways: $6,322,000
Police Protection: $5,127,000
Elementary and Secondary Education: $1,266,000
Local Fire Protection: $1,095,000
Public Welfare - Other: $410,000
Police Protection: $395,000
General - Other: $332,000
General - Other: $329,000
Corrections - Other: $324,000
General Public Building: $170,000
Parks and Recreation: $120,000
Health - Other: $104,000
Judicial and Legal Services: $103,000
Elementary and Secondary Education: $85,000
Libraries: $69,000
Parks and Recreation: $69,000
Correctional Institutions: $16,000
Financial Administration: $3,000
- Other Funds - Cash and Securities: $159,884,000
Cash and Securities: $71,035,000
- Revenue - Water Utilities: $11,490,000
Water Utilities: $3,178,000
- State Intergovernmental - Public Welfare: $83,377,000
Public Welfare: $75,977,000
Education: $38,653,000
Other: $35,933,000
Education: $35,730,000
Health and Hospitals: $28,014,000
Health and Hospitals: $26,512,000
Other: $23,419,000
Highways: $14,267,000
Highways: $7,977,000
Water Utilities: $2,070,000
Transit Utilities: $1,421,000
Water Utilities: $1,079,000
General Local Government Support: $332,000
General Local Government Support: $283,000
Sewerage: $22,000
Sewerage: $2,000
- Tax - Property: $52,232,000
Property: $52,222,000
General Sales and Gross Receipts: $7,197,000
General Sales and Gross Receipts: $6,891,000
Other Selective Sales: $4,715,000
Other Selective Sales: $3,629,000
Occupation and Business License - Other: $2,587,000
Other License: $2,455,000
Public Utilities Sales: $2,382,000
Other License: $2,293,000
Public Utilities Sales: $2,144,000
Occupation and Business License - Other: $2,027,000
Other: $1,871,000
Other: $1,673,000
Documentary and Stock Transfer: $1,064,000
Documentary and Stock Transfer: $1,021,000
- Total Salaries and Wages: $23,852,000
: $22,438,000
- Water Utilities - Interest on Debt: $940,000
Interest on Debt: $204,000
Madera County government finances - Cash and Securities in 2020:
- Assistance and Subsidies - Public Welfare, Cash Assistance Programs - Other: $38,577,000
Public Welfare, Cash Assistance Programs - Other: $34,097,000
- Charges - Other: $38,140,000
Other: $23,746,000
Solid Waste Management: $8,377,000
Solid Waste Management: $7,818,000
Regular Highways: $4,692,000
Regular Highways: $3,545,000
Sewerage: $3,287,000
Sewerage: $3,100,000
Elementary and Secondary Education - Other: $1,094,000
Elementary and Secondary Education - Other: $1,004,000
Natural Resources - Other: $590,000
Natural Resources - Other: $389,000
- Construction - Water Utilities: $5,785,000
Water Utilities: $5,543,000
Elementary and Secondary Education: $4,540,000
Elementary and Secondary Education: $1,311,000
Sewerage: $30,000
Sewerage: $29,000
- Current Operations - Elementary and Secondary Education: $43,845,000
Health - Other: $41,802,000
Elementary and Secondary Education: $39,350,000
Public Welfare - Other: $37,542,000
Public Welfare - Other: $35,383,000
Health - Other: $35,222,000
General - Other: $28,039,000
Police Protection: $26,747,000
Correctional Institutions: $25,287,000
Correctional Institutions: $23,127,000
Police Protection: $18,515,000
Judicial and Legal Services: $15,564,000
Judicial and Legal Services: $14,927,000
Regular Highways: $14,570,000
General Public Buildings: $12,071,000
Water Utilities: $11,981,000
Regular Highways: $11,540,000
Local Fire Protection: $9,648,000
General - Other: $9,346,000
Solid Waste Management: $7,133,000
Local Fire Protection: $7,098,000
Financial Administration: $6,738,000
Central Staff Services: $6,722,000
Central Staff Services: $6,482,000
Financial Administration: $5,881,000
Natural Resources - Other: $5,688,000
Solid Waste Management: $5,168,000
Corrections - Other: $5,134,000
Corrections - Other: $5,044,000
Water Utilities: $4,131,000
Sewerage: $3,174,000
Sewerage: $2,865,000
Protective Inspection and Regulation - Other: $2,581,000
Natural Resources - Other: $2,324,000
Protective Inspection and Regulation - Other: $2,047,000
Libraries: $1,771,000
Libraries: $1,434,000
Parks and Recreation: $847,000
Parks and Recreation: $847,000
Public Welfare, Vendor Payments for Other Purposes: $44,000
- Federal Intergovernmental - Other: $5,983,000
Other: $2,356,000
Highways: $1,918,000
Water Utilities: $1,915,000
General Local Government Support: $1,265,000
General Local Government Support: $1,246,000
Highways: $1,078,000
Housing and Community Development: $982,000
Transit Utilities: $827,000
Transit Utilities: $639,000
Housing and Community Development: $291,000
Natural Resources: $266,000
Natural Resources: $203,000
Education: $67,000
Water Utilities: $35,000
Education: $28,000
- General - Interest on Debt: $2,372,000
Interest on Debt: $1,510,000
- Intergovernmental to Local - Other - Elementary and Secondary Education: $14,340,000
Other - Elementary and Secondary Education: $9,118,000
Other - General - Other: $240,000
- Intergovernmental to State - Judicial and Legal Services: $1,026,000
Judicial and Legal Services: $1,026,000
- Local Intergovernmental - Education: $10,574,000
Education: $7,559,000
Housing and Community Development: $1,940,000
Housing and Community Development: $1,668,000
Health and Hospitals: $1,549,000
Transit Utilities: $1,074,000
Other: $551,000
Other: $340,000
- Long Term Debt - Outstanding Unspecified Public Purpose: $163,473,000
Beginning Outstanding - Unspecified Public Purpose: $99,925,000
Outstanding Unspecified Public Purpose: $73,224,000
Issue, Unspecified Public Purpose: $70,901,000
Beginning Outstanding - Unspecified Public Purpose: $60,521,000
Issue, Unspecified Public Purpose: $16,216,000
Retired Unspecified Public Purpose: $7,352,000
Retired Unspecified Public Purpose: $3,513,000
- Miscellaneous - Special Assessments: $8,622,000
Special Assessments: $4,501,000
Fines and Forfeits: $3,276,000
Interest Earnings: $3,028,000
General Revenue - Other: $2,544,000
General Revenue - Other: $2,297,000
Fines and Forfeits: $1,782,000
Sale of Property: $933,000
Sale of Property: $708,000
Interest Earnings: $317,000
Rents: $99,000
Rents: $20,000
Royalties: $1,000
Royalties: $1,000
- Other Capital Outlay - Water Utilities: $66,651,000
Water Utilities: $61,307,000
Public Welfare - Other: $56,409,000
Sewerage: $50,461,000
Sewerage: $30,806,000
Regular Highways: $18,994,000
Health - Other: $17,706,000
Correctional Institutions: $7,609,000
Regular Highways: $6,322,000
Police Protection: $5,127,000
Elementary and Secondary Education: $1,266,000
Local Fire Protection: $1,095,000
Public Welfare - Other: $410,000
Police Protection: $395,000
General - Other: $332,000
General - Other: $329,000
Corrections - Other: $324,000
General Public Building: $170,000
Parks and Recreation: $120,000
Health - Other: $104,000
Judicial and Legal Services: $103,000
Elementary and Secondary Education: $85,000
Libraries: $69,000
Parks and Recreation: $69,000
Correctional Institutions: $16,000
Financial Administration: $3,000
- Other Funds - Cash and Securities: $159,884,000
Cash and Securities: $71,035,000
- Revenue - Water Utilities: $11,490,000
Water Utilities: $3,178,000
- State Intergovernmental - Public Welfare: $83,377,000
Public Welfare: $75,977,000
Education: $38,653,000
Other: $35,933,000
Education: $35,730,000
Health and Hospitals: $28,014,000
Health and Hospitals: $26,512,000
Other: $23,419,000
Highways: $14,267,000
Highways: $7,977,000
Water Utilities: $2,070,000
Transit Utilities: $1,421,000
Water Utilities: $1,079,000
General Local Government Support: $332,000
General Local Government Support: $283,000
Sewerage: $22,000
Sewerage: $2,000
- Tax - Property: $52,232,000
Property: $52,222,000
General Sales and Gross Receipts: $7,197,000
General Sales and Gross Receipts: $6,891,000
Other Selective Sales: $4,715,000
Other Selective Sales: $3,629,000
Occupation and Business License - Other: $2,587,000
Other License: $2,455,000
Public Utilities Sales: $2,382,000
Other License: $2,293,000
Public Utilities Sales: $2,144,000
Occupation and Business License - Other: $2,027,000
Other: $1,871,000
Other: $1,673,000
Documentary and Stock Transfer: $1,064,000
Documentary and Stock Transfer: $1,021,000
- Total Salaries and Wages: $23,852,000
: $22,438,000
- Water Utilities - Interest on Debt: $940,000
Interest on Debt: $204,000
Supplemental Security Income (SSI) in 2006:
- Total number of recipients: 4,792
- Number of aged recipients: 1,094
- Number of blind and disabled recipients: 3,698
- Number of recipients under 18: 545
- Number of recipients between 18 and 64: 2,430
- Number of recipients older than 64: 1,817
- Number of recipients also receiving OASDI: 2,542
- Amount of payments (thousands of dollars): 2,520
| Home Mortgage Disclosure Act Aggregated Statistics For Year 2009 (Based on 19 full tracts) | ||||||||||||
| A) FHA, FSA/RHS & VA Home Purchase Loans | B) Conventional Home Purchase Loans | C) Refinancings | D) Home Improvement Loans | F) Non-occupant Loans on < 5 Family Dwellings (A B C & D) | G) Loans On Manufactured Home Dwelling (A B C & D) | |||||||
|---|---|---|---|---|---|---|---|---|---|---|---|---|
| Number | Average Value | Number | Average Value | Number | Average Value | Number | Average Value | Number | Average Value | Number | Average Value | |
| LOANS ORIGINATED | 1,059 | $145,953 | 561 | $142,734 | 1,109 | $192,923 | 67 | $113,940 | 372 | $155,054 | 19 | $126,158 |
| APPLICATIONS APPROVED, NOT ACCEPTED | 88 | $158,443 | 78 | $170,167 | 191 | $185,476 | 14 | $102,071 | 44 | $161,068 | 5 | $84,400 |
| APPLICATIONS DENIED | 187 | $155,877 | 166 | $153,289 | 818 | $214,678 | 97 | $74,485 | 177 | $171,458 | 20 | $78,850 |
| APPLICATIONS WITHDRAWN | 105 | $140,352 | 81 | $116,852 | 384 | $195,242 | 36 | $85,083 | 82 | $128,866 | 11 | $138,182 |
| FILES CLOSED FOR INCOMPLETENESS | 30 | $175,567 | 29 | $163,655 | 140 | $205,300 | 7 | $88,714 | 21 | $144,905 | 0 | $0 |
| Private Mortgage Insurance Companies Aggregated Statistics For Year 2009 (Based on 18 full tracts) | ||||||
| A) Conventional Home Purchase Loans | B) Refinancings | C) Non-occupant Loans on < 5 Family Dwellings (A & B) | ||||
|---|---|---|---|---|---|---|
| Number | Average Value | Number | Average Value | Number | Average Value | |
| LOANS ORIGINATED | 74 | $174,973 | 5 | $265,000 | 3 | $191,000 |
| APPLICATIONS APPROVED, NOT ACCEPTED | 33 | $203,333 | 10 | $213,400 | 0 | $0 |
| APPLICATIONS DENIED | 9 | $156,222 | 3 | $169,667 | 0 | $0 |
| APPLICATIONS WITHDRAWN | 3 | $140,333 | 5 | $219,600 | 0 | $0 |
| FILES CLOSED FOR INCOMPLETENESS | 4 | $256,500 | 1 | $106,000 | 0 | $0 |
| Most common first names in Madera County, CA among deceased individuals | ||
| Name | Count | Lived (average) |
|---|---|---|
| John | 392 | 75.4 years |
| Mary | 353 | 78.7 years |
| William | 352 | 75.8 years |
| James | 332 | 74.1 years |
| Robert | 319 | 70.9 years |
| George | 201 | 75.8 years |
| Charles | 197 | 73.5 years |
| Frank | 188 | 75.6 years |
| Joseph | 133 | 72.9 years |
| Dorothy | 132 | 78.6 years |
| Most common last names in Madera County, CA among deceased individuals | ||
| Last name | Count | Lived (average) |
|---|---|---|
| Smith | 207 | 74.8 years |
| Johnson | 132 | 73.3 years |
| Brown | 121 | 77.1 years |
| Jones | 104 | 73.6 years |
| Williams | 98 | 74.2 years |
| Davis | 88 | 76.5 years |
| Garcia | 88 | 69.2 years |
| Miller | 80 | 77.0 years |
| Martinez | 76 | 68.8 years |
| Rodriguez | 76 | 70.4 years |
| Businesses in Madera County, CA | ||||
| Name | Count | Name | Count | |
|---|---|---|---|---|
| 7-Eleven | 2 | Little Caesars Pizza | 4 | |
| 99 Cents Only Stores | 1 | Long John Silver's | 1 | |
| AT&T | 1 | Lowe's | 1 | |
| AutoZone | 3 | MasterBrand Cabinets | 3 | |
| Baskin-Robbins | 1 | McDonald's | 6 | |
| Best Western | 1 | Motel 6 | 1 | |
| Big O Tires | 1 | Nike | 4 | |
| Blockbuster | 2 | Office Depot | 1 | |
| Burger King | 3 | Panda Express | 1 | |
| CVS | 4 | Payless | 3 | |
| Carl\s Jr. | 4 | Penske | 2 | |
| Chevrolet | 2 | Pizza Hut | 1 | |
| Comfort Inn | 1 | Quiznos | 2 | |
| Cricket Wireless | 6 | RadioShack | 2 | |
| Curves | 1 | Rite Aid | 3 | |
| DHL | 1 | SAS Shoes | 1 | |
| Dairy Queen | 1 | SONIC Drive-In | 1 | |
| Days Inn | 3 | Safeway | 1 | |
| Dennys | 1 | Sears | 2 | |
| Domino's Pizza | 1 | Starbucks | 5 | |
| FedEx | 10 | Subway | 10 | |
| Ford | 1 | Super 8 | 1 | |
| GNC | 4 | T-Mobile | 4 | |
| GameStop | 1 | Taco Bell | 4 | |
| H&R Block | 6 | Toyota | 1 | |
| Holiday Inn | 2 | True Value | 3 | |
| Home Depot | 1 | U-Haul | 7 | |
| IHOP | 1 | UPS | 10 | |
| Jack In The Box | 4 | Vans | 3 | |
| Jamba Juice | 1 | Verizon Wireless | 1 | |
| Jones New York | 3 | Vons | 2 | |
| KFC | 2 | Walgreens | 3 | |
| La-Z-Boy | 2 | Walmart | 1 | |
| Lane Furniture | 2 | Wendy's | 1 | |
Madera County on our top lists:
- #14 on the list of "Top 101 counties with the highest Particulate Matter (PM10) Annual air pollution readings in 2012 (µg/m3)"
- #27 on the list of "Top 101 counties with the lowest surface withdrawal of fresh water for public supply (pop. 50,000+)"
- #29 on the list of "Top 101 counties with the highest Particulate Matter (PM2.5) Annual air pollution readings in 2012 (µg/m3)"
- #46 on the list of "Top 101 counties with the highest number of births per 1000 residents 2007-2013"
- #46 on the list of "Top 101 counties with the highest number of births per 1000 residents 2007-2013 (pop 50,000+)"
- #49 on the list of "Top 101 counties with the highest Nitrogen Dioxide air pollution readings in 2012 (ppm)"