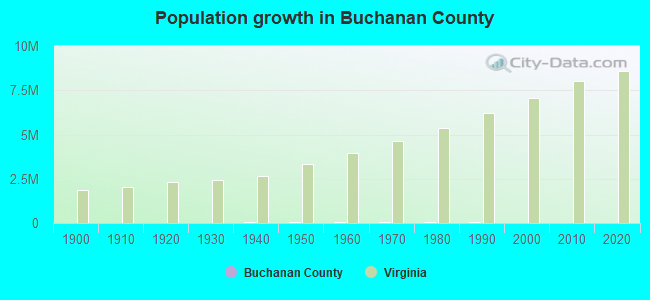
Buchanan County, Virginia (VA)
County owner-occupied free and clear houses and condos in 2010: 5,425
County owner-occupied houses and condos in 2000: 8,674
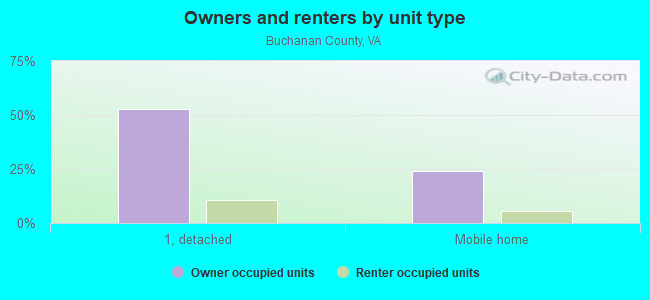
Renter-occupied apartments: 1,977 (it was 1,790 in 2000)
| % of renters here: | 17% |
| State: | 33% |
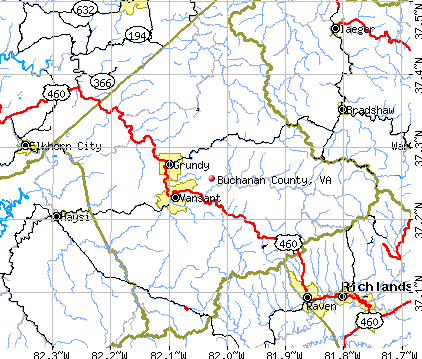
Land area: 504 sq. mi.
Water area: 0.0 sq. mi.
Population density: 40 people per square mile (average).
Industries providing employment: Educational, health and social services (23.0%), Retail trade (15.4%), Agriculture,forestry,fishing and hunting, and mining (14.1%).
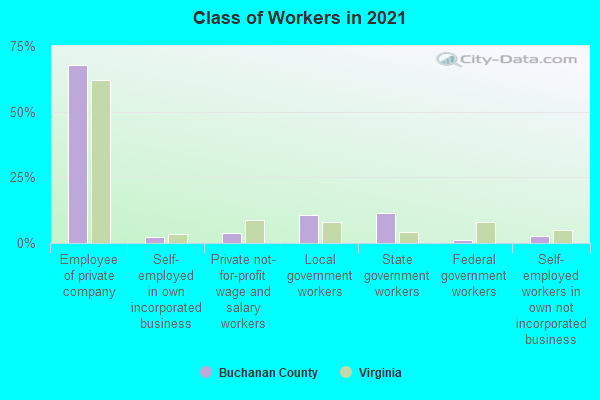
Type of workers:
- Private wage or salary: 72%
- Government: 26%
- Self-employed, not incorporated: 2%
- Unpaid family work: 0%
- OSM Map
- General Map
- Google Map
- MSN Map

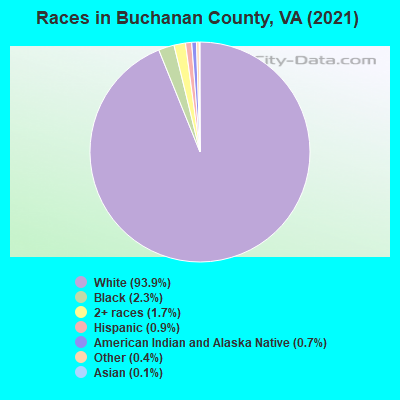
- 19,18695.9%White Non-Hispanic Alone
- 3671.8%Black Non-Hispanic Alone
- 2021.0%Hispanic or Latino
- 1900.9%Two or more races
- 540.3%Some other race alone
- 100.05%Asian alone
| Median resident age: | 48.0 years |
| Virginia median age: | 39.0 years |
| Males: 10,578 | |
| Females: 9,806 |

 | Grundy Virginia 911 emergency system (9 replies) |
| Virginia voted for Biden by dougle digits. Virginia's political future. (99 replies) |
| Census Releases New CDPs for Virginia, 2020-2030 (5 replies) |
| Democrats energized to dominate Virginia (96 replies) |
| Is This An Accurate Map of Virginia's Regions? (53 replies) |
| Drill Virginia (1 reply) |
| Buchanan County: | 2.0 people |
| Virginia: | 3 people |
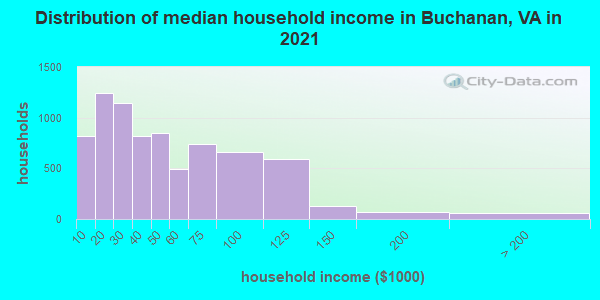
Estimated median household income in 2022: $38,966 ($22,213 in 1999)
| This county: | $38,966 |
| Virginia: | $85,873 |
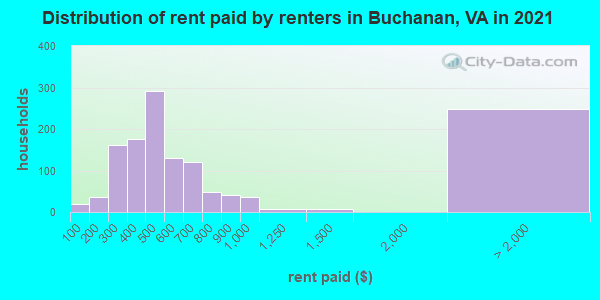
Median contract rent in 2022 for apartments: $478 (lower quartile is $356, upper quartile is $595)
| This county: | $478 |
| State: | $1270 |
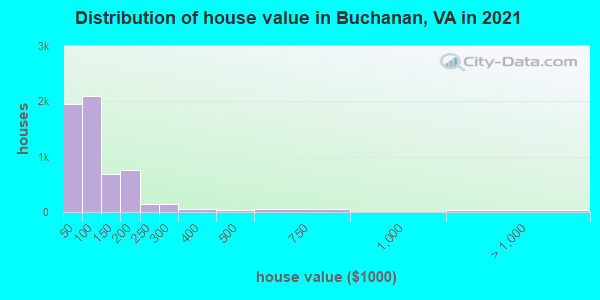
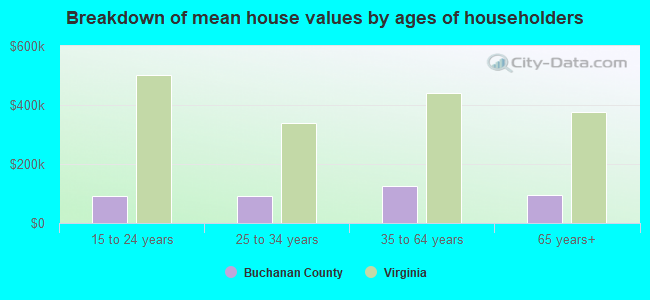
Estimated median house or condo value in 2022: $91,371 (it was $42,800 in 2000)
| Buchanan: | $91,371 |
| Virginia: | $365,700 |
Mean price in 2022:
Median monthly housing costs for homes and condos with a mortgage: $1,031Detached houses: $150,814
Here: $150,814 State: $472,865 Townhouses or other attached units: $289,997
Here: $289,997 State: $457,437 In 2-unit structures: $91,150
Here: $91,150 State: $396,289 Mobile homes: $50,081
Here: $50,081 State: $100,736
Median monthly housing costs for units without a mortgage: $317
Institutionalized population: 1,128
Crime in 2021 (reported by the sheriff's office or county police, not the county total):
- Murders: 2
- Rapes: 16
- Robberies: 0
- Assaults: 21
- Burglaries: 21
- Thefts: 167
- Auto thefts: 30
Crime in 2020 (reported by the sheriff's office or county police, not the county total):
- Murders: 1
- Rapes: 12
- Robberies: 1
- Assaults: 23
- Burglaries: 34
- Thefts: 189
- Auto thefts: 37
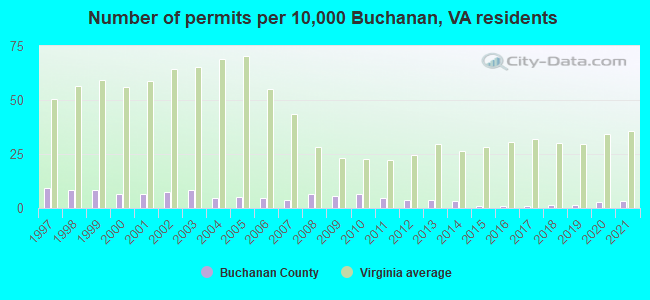
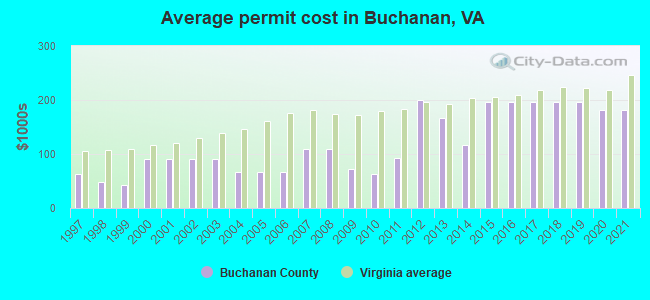
Single-family new house construction building permits:
- 2022: 10 buildings, average cost: $180,600
- 2021: 9 buildings, average cost: $180,600
- 2020: 7 buildings, average cost: $180,600
- 2019: 4 buildings, average cost: $197,000
- 2018: 4 buildings, average cost: $197,000
- 2017: 3 buildings, average cost: $197,000
- 2016: 2 buildings, average cost: $197,000
- 2015: 2 buildings, average cost: $197,000
- 2014: 9 buildings, average cost: $116,700
- 2013: 10 buildings, average cost: $166,000
- 2012: 10 buildings, average cost: $200,400
- 2011: 12 buildings, average cost: $93,300
- 2010: 18 buildings, average cost: $63,400
- 2009: 15 buildings, average cost: $71,900
- 2008: 18 buildings, average cost: $110,100
- 2007: 10 buildings, average cost: $110,300
- 2006: 13 buildings, average cost: $66,500
- 2005: 14 buildings, average cost: $66,500
- 2004: 12 buildings, average cost: $66,500
- 2003: 22 buildings, average cost: $90,500
- 2002: 20 buildings, average cost: $90,500
- 2001: 18 buildings, average cost: $90,500
- 2000: 17 buildings, average cost: $90,500
- 1999: 23 buildings, average cost: $42,200
- 1998: 22 buildings, average cost: $48,700
- 1997: 25 buildings, average cost: $63,400
Median real estate property taxes paid for housing units with mortgages in 2022: $541 (0.4%)
Median real estate property taxes paid for housing units with no mortgage in 2022: $416 (0.5%)
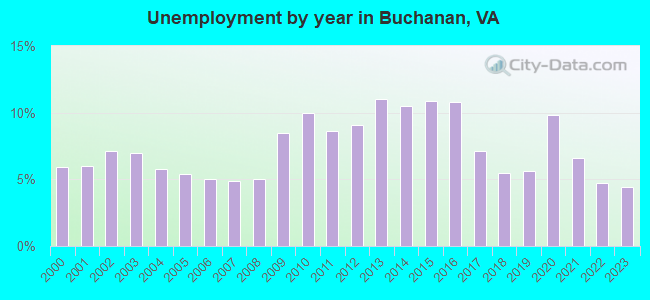
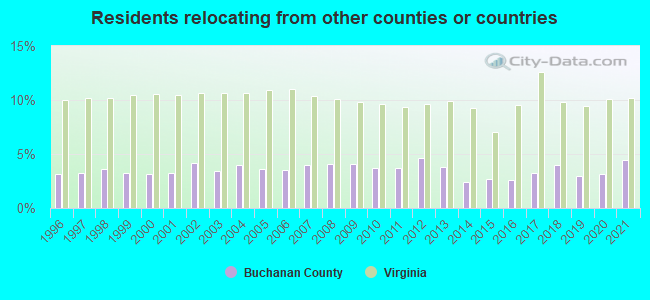
| Buchanan County: | 26.7% |
| Virginia: | 10.6% |
Median age of residents in 2022: 48.0 years old
(Males: 45.0 years old, Females: 50.4 years old)
(Median age for: White residents: 48.5 years old, Black residents: 30.7 years old, Hispanic or Latino residents: 33.5 years old, Other race residents: 68.7 years old)
Fair market rent in 2006 for a 1-bedroom apartment in Buchanan County is $416 a month.
Fair market rent for a 2-bedroom apartment is $483 a month.
Fair market rent for a 3-bedroom apartment is $616 a month.
Notable locations in this county outside city limits:
Notable locations in Buchanan County: Auburn Wharf (A), Winter Harbor Landing Boat Ramp (B), Winter Harbor Haven Boat Ramp (C), Whites Creek Landing Boat Ramp (D), Town Point Landing Boat Ramp (E), Roses Creek Landing Boat Ramp (F), Potato Neck Landing Boat Ramp (G), Piankatank Landing Boat Ramp (H), Doctors Creek Landing Boat Ramp (I), Davis Creek Landing Boat Ramp (J), Miles Store (K), Williams Wharf (L), Town Point Landing (M), Mathews Raceway (N), Cradle Point Light (O), North (P), Hicks Wharf (Q), Pine Hall (R), Auburn Wharf Landing (S), Cedar Lane Landing (T). Display/hide their locations on the map
Churches in Buchanan County include: Antioch Church (A), Bethel Church (B), Beulah Church (C), Saint Matthews Church (D), Saint Pauls Church (E), Salem Church (F), Zion Church (G), Christ Church (H), Spring Hill Church (I). Display/hide their locations on the map
Cemeteries: Horn Harbor Cemetery (1), Providence Cemetery (2), Smither Memorial Cemetery (3), Williams Cemetery (4), White Cemetery (5), West Burial Ground (6), White Cemetery (7). Display/hide their locations on the map
Streams, rivers, and creeks: Woodas Creek (A), Winder Creek (B), Whites Creek (C), Weston Creek (D), West Landing Creek (E), Wadinger Creek (F), Thomas Creek (G), Tabbs Creek (H), Stoakes Creek (I). Display/hide their locations on the map
Neighboring counties: Madera County, California  , Reynolds County, Missouri .
| Here: | 4.0% |
| Virginia: | 2.7% |
Current college students: 905
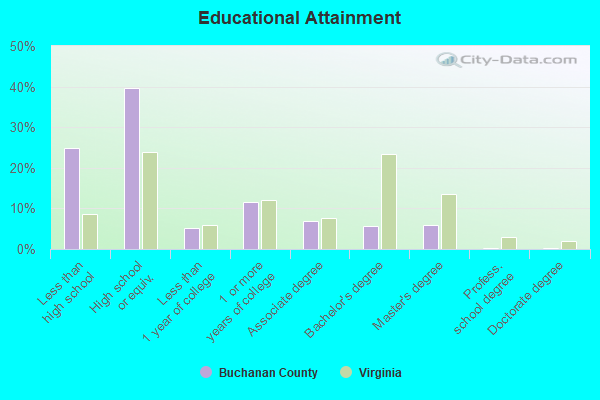
People 25 years of age or older with a high school degree or higher: 74.2%
People 25 years of age or older with a bachelor's degree or higher: 10.9%
Number of foreign born residents: 156 (53.1% naturalized citizens)
| Buchanan County: | 0.8% |
| Whole state: | 12.7% |
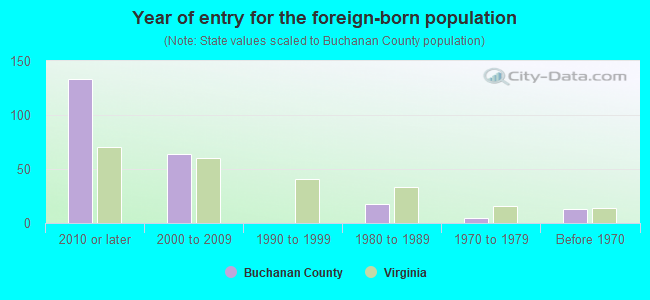
- Year of entry for the foreign-born population
- 632010 or later
- 322000 to 2009
- 01990 to 1999
- 181980 to 1989
- 51970 to 1979
- 13Before 1970
Mean travel time to work (commute): minutes
Percentage of county residents living and working in this county: 90.4%
Housing units in structures:
- One, detached: 6,736
- One, attached: 100
- Two: 92
- 3 or 4: 126
- 5 to 9: 64
- 10 to 19: 74
- 20 or more: 15
- Mobile homes: 3,223
Housing units in Buchanan County with a mortgage: 1,426 (19 second mortgage, 0 home equity loan, 9 both second mortgage and home equity loan)
Houses without a mortgage: 35
| Here: | 2.8% with mortgage |
| State: | 97.2% with mortgage |
Religion statistics for Buchanan County
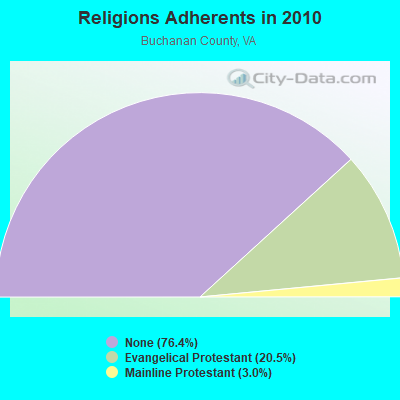
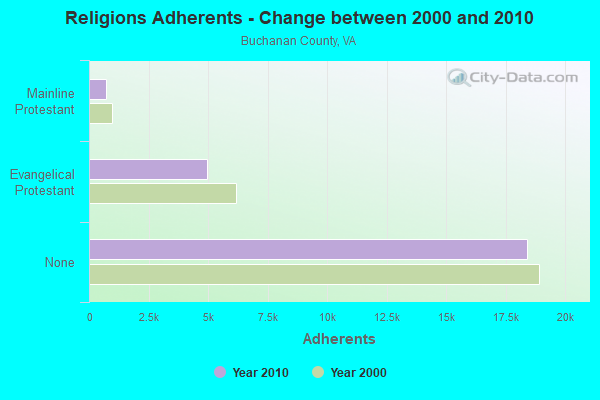
| Religion | Adherents | Congregations |
|---|---|---|
| Evangelical Protestant | 4,949 | 30 |
| Mainline Protestant | 724 | 11 |
| Catholic | 21 | 1 |
| None | 18,404 | - |
Source: Clifford Grammich, Kirk Hadaway, Richard Houseal, Dale E.Jones, Alexei Krindatch, Richie Stanley and Richard H.Taylor. 2012. 2010 U.S.Religion Census: Religious Congregations & Membership Study. Association of Statisticians of American Religious Bodies. Jones, Dale E., et al. 2002. Congregations and Membership in the United States 2000. Nashville, TN: Glenmary Research Center.
Food Environment Statistics:
| Buchanan County: | 2.52 / 10,000 pop. |
| State: | 2.03 / 10,000 pop. |
| This county: | 2.10 / 10,000 pop. |
| Virginia: | 1.43 / 10,000 pop. |
| Buchanan County: | 4.61 / 10,000 pop. |
| Virginia: | 4.03 / 10,000 pop. |
| This county: | 2.10 / 10,000 pop. |
| State: | 7.65 / 10,000 pop. |
| Buchanan County: | 12.3% |
| Virginia: | 9.3% |
| Buchanan County: | 31.7% |
| State: | 26.7% |
| Here: | 20.8% |
| State: | 18.6% |
Agriculture in Buchanan County:
Average size of farms: 97 acresHarvested cropland as a percentage of land in farms: 8.60%
Average market value of all machinery and equipment per farm: $26,643
The percentage of farms operated by a family or individual: 100.00%
Average age of principal farm operators: 52 years
Average number of cattle and calves per 100 acres of all land in farms: 10.33
Milk cows as a percentage of all cattle and calves: 2.11%
Tornado activity:
Buchanan County historical area-adjusted tornado activity is significantly below Virginia state average. It is 24951437.6 times below overall U.S. average.Tornadoes in this county have caused 4 injuries recorded between 1950 and 2004.
On 4/25/1975, a category 1 (max. wind speeds 73-112 mph) tornado injured 4 people and caused between $50,000 and $500,000 in damages.
Earthquake activity:
Buchanan County-area historical earthquake activity is significantly above Virginia state average. It is 11% greater than the overall U.S. average.On 8/9/2020 at 12:07:37, a magnitude 5.1 (5.1 MW, Depth: 4.7 mi, Class: Moderate, Intensity: VI - VII) earthquake occurred 74.8 miles away from Buchanan County center
On 8/23/2011 at 17:51:04, a magnitude 5.8 (5.8 MW, Depth: 3.7 mi) earthquake occurred 228.8 miles away from the county center
On 7/27/1980 at 18:52:21, a magnitude 5.2 (5.1 MB, 4.7 MS, 5.0 UK, 5.2 UK) earthquake occurred 123.6 miles away from the county center
On 11/2/2006 at 17:53:02, a magnitude 4.3 (4.3 MB, Depth: 0.6 mi, Class: Light, Intensity: IV - V) earthquake occurred 7.1 miles away from the county center
On 11/23/2006 at 10:42:57, a magnitude 4.3 (4.3 MB) earthquake occurred 7.4 miles away from Buchanan County center
On 6/29/1996 at 19:30:42, a magnitude 4.1 (4.1 MB, 3.9 LG, Depth: 0.6 mi) earthquake occurred 6.4 miles away from the county center
Magnitude types: regional Lg-wave magnitude (LG), body-wave magnitude (MB), surface-wave magnitude (MS), moment magnitude (MW)
Most recent natural disasters:
- Virginia Covid-19 Pandemic, Incident Period: January 20, 2020, Major Disaster (Presidential) Declared DR-4512-VA: April 2, 2020, FEMA Id: 4512, Natural disaster type: Other
- Virginia Hurricane Sandy, Incident Period: October 26, 2012 to November 01, 2012, Emergency Declared EM-3359: October 29, 2012, FEMA Id: 3359, Natural disaster type: Hurricane
- Virginia Severe Winter Storm and Snowstorm, Incident Period: December 18, 2009 to December 20, 2009, Major Disaster (Presidential) Declared DR-1874: February 16, 2010, FEMA Id: 1874, Natural disaster type: Snowstorm, Winter Storm
- Virginia Hurricane Katrina Evacuation, Incident Period: August 29, 2005 to October 01, 2005, Emergency Declared EM-3240: September 12, 2005, FEMA Id: 3240, Natural disaster type: Hurricane
- Virginia Severe Storms, Tornadoes, and Flooding, Incident Period: May 24, 2004 to June 26, 2004, Major Disaster (Presidential) Declared DR-1525: June 15, 2004, FEMA Id: 1525, Natural disaster type: Storm, Tornado, Flood
- Virginia Severe Storms And Flooding, Incident Period: November 18, 2003 to November 19, 2003, Major Disaster (Presidential) Declared DR-1502: December 09, 2003, FEMA Id: 1502, Natural disaster type: Storm, Flood
- Virginia Severe Winter Storm, Snowfall, Heavy Rain, Flooding, and Mudslides, Incident Period: February 15, 2003 to February 28, 2003, Major Disaster (Presidential) Declared DR-1458: March 27, 2003, FEMA Id: 1458, Natural disaster type: Winter Storm, Mudslide, Flood, Heavy Rain, Snowfall
- Virginia Severe Storms and Tornado, Incident Period: April 28, 2002 to May 03, 2002, Major Disaster (Presidential) Declared DR-1411: May 05, 2002, FEMA Id: 1411, Natural disaster type: Storm, Tornado
- Virginia Far Southwest Fire Complex, Incident Period: November 14, 2001 to December 09, 2001, Fire Management Assistance Declared: November 16, 2001, FEMA Id: 2390, Natural disaster type: Fire
- Virginia Severe Storms and Flooding, Incident Period: July 08, 2001 to August 27, 2001, Major Disaster (Presidential) Declared DR-1386: July 12, 2001, FEMA Id: 1386, Natural disaster type: Storm, Flood
- 9 other natural disasters have been reported since 1953.
The number of natural disasters in Buchanan County (19) is greater than the US average (15).
Major Disasters (Presidential) Declared: 15
Emergencies Declared: 3
Causes of natural disasters: Storms: 10, Floods: 9, Winter Storms: 4, Hurricanes: 2, Mudslides: 2, Tornadoes: 2, Blizzard: 1, Fire: 1, Flash Flood: 1, Heavy Rain: 1, Ice Storm: 1, Snowfall: 1, Snowstorm: 1, Other: 1 (Note: some incidents may be assigned to more than one category).
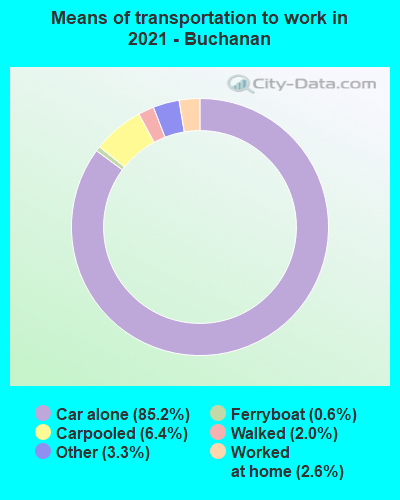
Means of transportation to work:
- Drove a car alone: 5,116 (83.5%)
- Carpooled: 358 (5.8%)
- Bus: 11 (0.2%)
- Ferryboat: 31 (0.5%)
- Taxicab, motorcycle, or other means: 142 (2.3%)
- Walked: 61 (1.0%)
- Worked at home: 196 (3.2%)
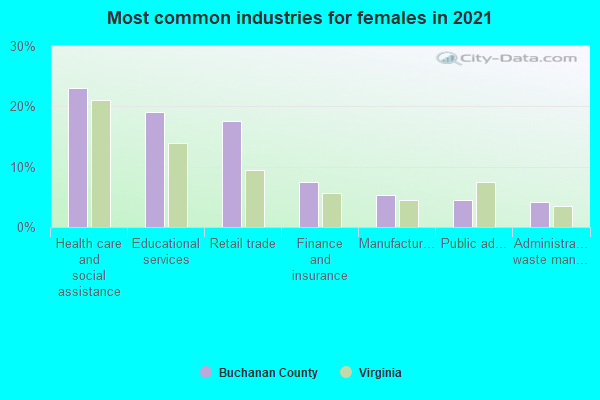
- Health care and social assistance (18%)
- Educational services (18%)
- Retail trade (14%)
- Finance and insurance (7%)
- Public administration (6%)
- Professional, scientific, and technical services (3%)
- Manufacturing (3%)
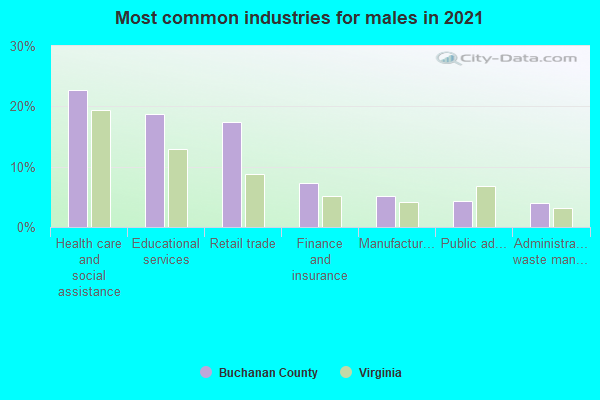
- Health care and social assistance (22%)
- Educational services (22%)
- Retail trade (17%)
- Finance and insurance (9%)
- Public administration (7%)
- Professional, scientific, and technical services (4%)
- Manufacturing (4%)
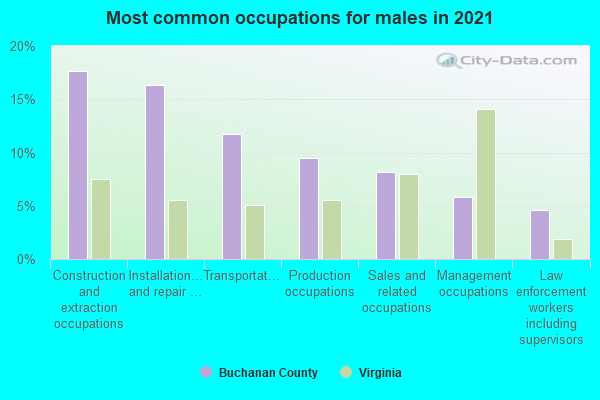
- Construction and extraction occupations (22%)
- Installation, maintenance, and repair occupations (15%)
- Transportation occupations (10%)
- Sales and related occupations (10%)
- Production occupations (8%)
- Law enforcement workers including supervisors (6%)
- Management occupations (4%)
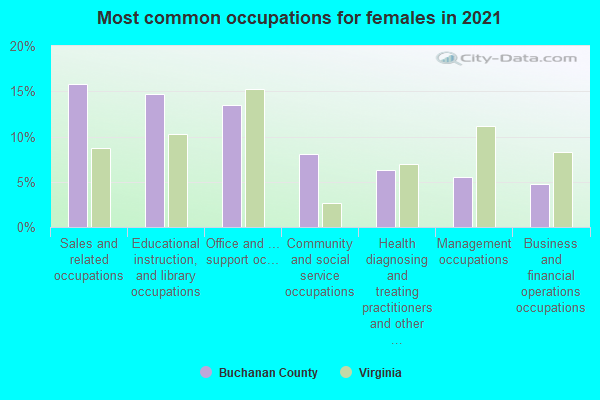
- Sales and related occupations (16%)
- Educational instruction, and library occupations (13%)
- Office and administrative support occupations (10%)
- Management occupations (7%)
- Business and financial operations occupations (7%)
- Health diagnosing and treating practitioners and other technical occupations (7%)
- Community and social service occupations (6%)
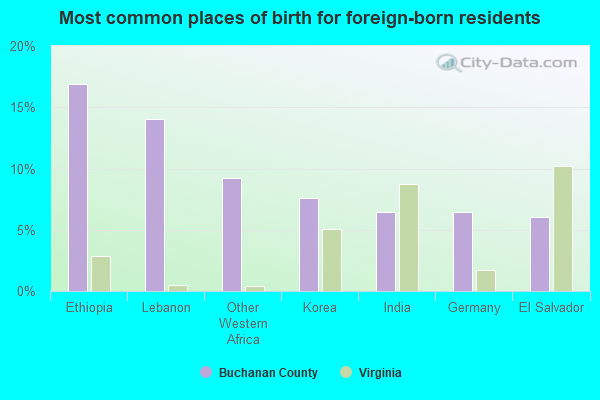
- Lebanon (13%)
- Ethiopia (11%)
- Australia (11%)
- India (10%)
- Mexico (7%)
- Tanzania (6%)
- Ghana (6%)
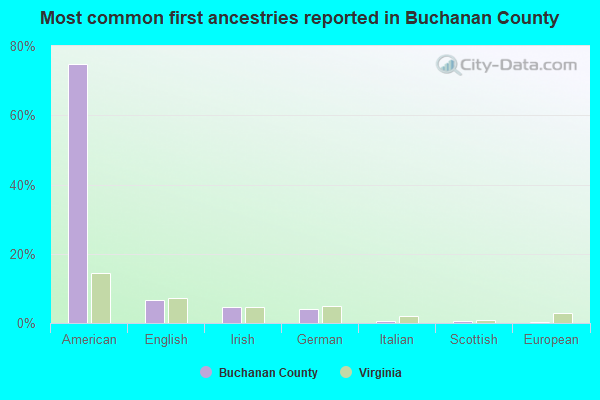
- American (71%)
- English (6%)
- Irish (3%)
- German (3%)
- Scottish (1%)
- Italian (1%)
- European (0%)
People in group quarters in Buchanan County, Virginia in 2010:
- 839 people in state prisons
- 207 people in group homes for juveniles (non-correctional)
- 82 people in nursing facilities/skilled-nursing facilities
- 28 people in workers' group living quarters and job corps centers
- 15 people in group homes intended for adults
- 2 people in other noninstitutional facilities
People in group quarters in Buchanan County, Virginia in 2000:
- 878 people in state prisons
- 167 people in other group homes
- 104 people in nursing homes
- 31 people in short-term care, detention or diagnostic centers for delinquent children
- 25 people in local jails and other confinement facilities (including police lockups)
4.42% of this county's 2021 resident taxpayers lived in other counties in 2020 ($31,015 average adjusted gross income)
| Here: | 4.42% |
| Virginia average: | 10.16% |
10 or fewer of this county's residents moved from foreign countries.
2.94% relocated from other counties in Virginia ($20,027 average AGI)
1.47% relocated from other states ($10,989 average AGI)
Buchanan County: 1.47% Virginia average: 3.91%
Top counties from which taxpayers relocated into this county between 2020 and 2021:
| from Tazewell County, VA | |
| from Russell County, VA |
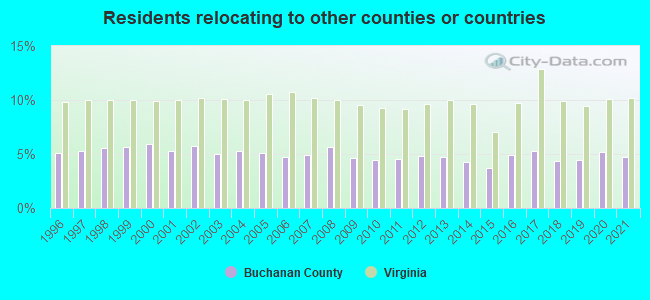
4.71% of this county's 2020 resident taxpayers moved to other counties in 2021 ($35,545 average adjusted gross income)
| Here: | 4.71% |
| Virginia average: | 10.20% |
10 or fewer of this county's residents moved to foreign countries.
3.17% relocated to other counties in Virginia ($23,014 average AGI)
1.54% relocated to other states ($12,527 average AGI)
Buchanan County: 1.54% Virginia average: 3.98%
Top counties to which taxpayers relocated from this county between 2020 and 2021:
| to Tazewell County, VA | |
| to Russell County, VA |
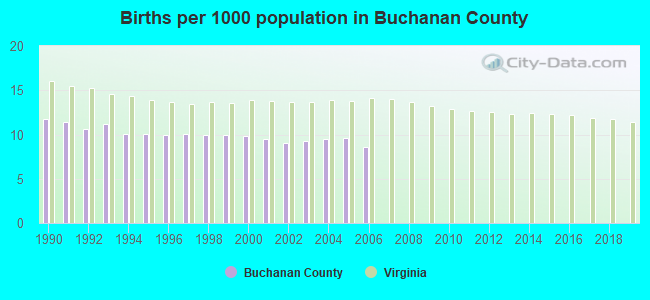
Births per 1000 population from 1990 to 1999: 10.5
Births per 1000 population from 2000 to 2006: 9.3
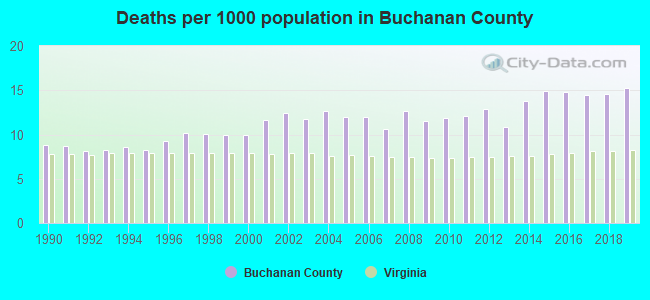
Deaths per 1000 population from 1990 to 1999: 9.0
Deaths per 1000 population from 2000 to 2009: 11.7
Deaths per 1000 population from 2010 to 2020: 14.0
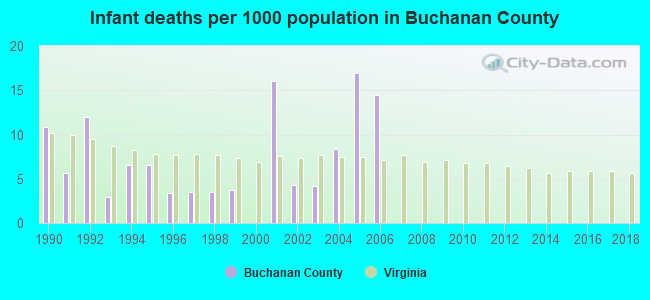
Infant deaths per 1000 live births from 1990 to 1999: 5.9
Infant deaths per 1000 live births from 2000 to 2006: 9.2
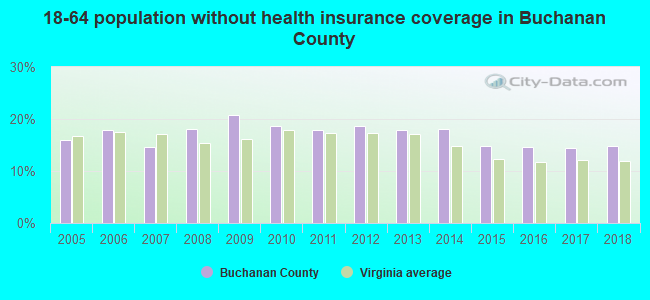
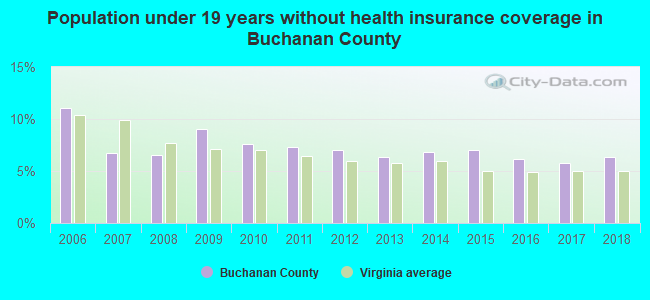
Persons under 19 years old without health insurance coverage in 2018: 6.3%
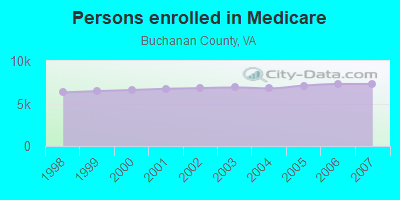
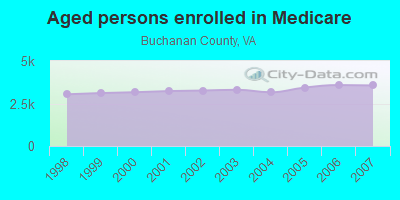
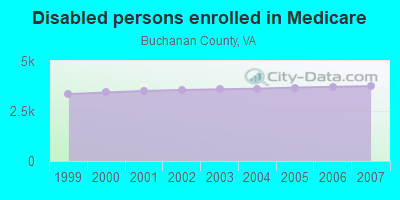
Persons enrolled in hospital insurance and/or supplemental medical insurance (Medicare) in July 1, 2007: 7,302 (3,562 aged, 3,740 disabled)
Children under 18 without health insurance coverage in 2007: 273 (6%)
Most common underlying causes of death in Buchanan County, Virginia in 1999 - 2019:
- Atherosclerotic heart disease (458)
- Chronic obstructive pulmonary disease, unspecified (429)
- Bronchus or lung, unspecified - Malignant neoplasms (409)
- Acute myocardial infarction, unspecified (406)
- Coalworker pneumoconiosis (136)
- Pneumonia, unspecified (66)
- Alzheimer disease, unspecified (31)
- Atherosclerotic cardiovascular disease, so described (14)
- Congestive heart failure (13)
- Accidental poisoning by and exposure to other and unspecified drugs, medicaments and biological substances (11)
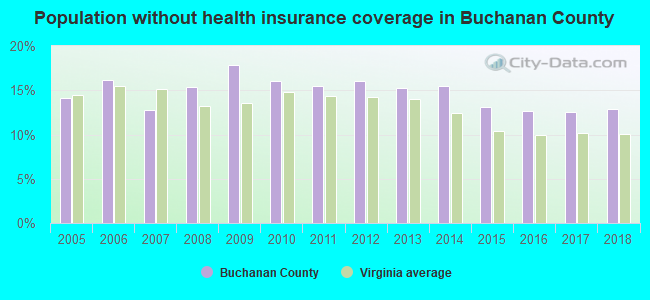
Population without health insurance coverage in 2000: 16%
Children under 18 without health insurance coverage in 2000: 10%
Short term general hospital admissions per 100,000 population in 2004: 13,409
Short term general hospital beds per 100,000 population in 2004: 532
Emergency room visits per 100,000 population in 2004: 53,714
General practice office based MDs per 100,000 population in 2005: 998
Medical specialist MDs per 100,000 population in 2005: 1,244
Dentists per 100,000 population in 1998: 4
Total births per 100,000 population, July 2005 - July 2006 : 14
Total deaths per 100,000 population, July 2005 - July 2006: 36
Limited-service eating places per 100,000 population in 2005 : 4
Crimes per 100,000 population in 1996: 1
Suicides per 1,000,000 population from 2000 to 2006: 258.4. This is more than state average.
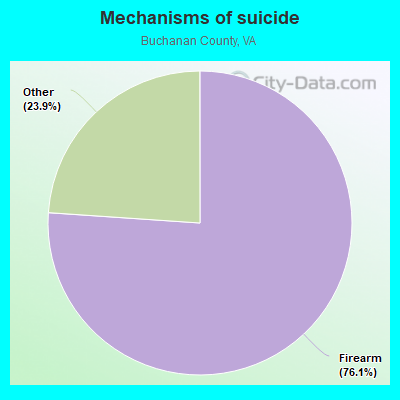
- Firearm - 196.6
- Other - 61.8
Household type by relationship:
Households: 20,384- Male householders: 3,816 (820 living alone), Female householders: 3,884 (1,212 living alone)
3,901 spouses (3,897 opposite-sex spouses), 494 unmarried partners, (494 opposite-sex unmarried partners), 5,767 children (5,065 natural, 342 adopted, 328 stepchildren), 535 grandchildren, 223 brothers or sisters, 282 parents, 3 foster children, 309 other relatives, 221 non-relatives
- In group quarters: 947
Size of family households: 2,839 2-persons, 1,301 3-persons, 765 4-persons, 265 5-persons, 109 6-persons, 16 7-or-more-persons.
Size of nonfamily households: 2,033 1-person, 357 2-persons, 9 3-persons.
1,857 married couples with children.
1,064 single-parent households (226 men, 838 women).
97.8% of residents of Buchanan speak English at home.
1.3% of residents speak Spanish at home (82% speak English very well, 12% speak English well, 5% speak English not well, 1% don't speak English at all).
0.3% of residents speak other Indo-European language at home (97% speak English very well, 3% speak English well).
0.1% of residents speak Asian or Pacific Island language at home (100% speak English very well).
0.5% of residents speak other language at home (94% speak English very well, 6% speak English well).
In fiscal year 2004:
Federal Government expenditure: $205,945,000 ($8,172 per capita)
Department of Defense expenditure: $12,852,000
Federal direct payments to individuals for retirement and disability: $112,780,000
Federal other direct payments to individuals: $44,813,000
Federal direct payments not to individuals: $178,000
Federal grants: $31,998,000
Federal procurement contracts: $12,694,000 ($11,941,000 Department of Defense)
Federal salaries and wages: $3,482,000 ($215,000 Department of Defense)
Federal Government direct loans: $287,000
Federal guaranteed/insured loans: $179,000
Federal Government insurance: $37,959,000
Population change from April 1, 2000 to July 1, 2005:
Births: 1,288| Here: | 52 per 1000 residents |
| State: | 70 per 1000 residents |
Deaths: 1,572
| Here: | 64 per 1000 residents |
| State: | 40 per 1000 residents |
Net international migration: +27
| Here: | +1 per 1000 residents |
| State: | +18 per 1000 residents |
Net internal migration: -1,919
| Here: | |
| State: |
Total withdrawal of fresh water for public supply: 0.00 millions of gallons per day (all from surface)
| Here: | 6.3 |
| State: | 7.0 |
| Here: | 5.1 |
| State: | 4.3 |
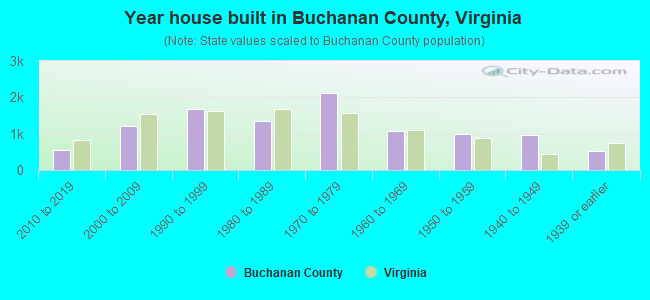
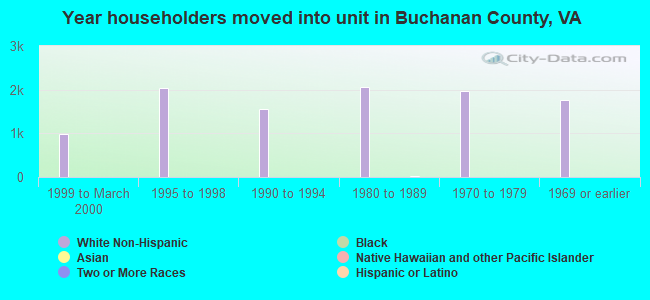
- Year house built in Buchanan County, Virginia
- 22020 or later
- 4392010 to 2019
- 1,4462000 to 2009
- 1,5881990 to 1999
- 1,4021980 to 1989
- 2,0331970 to 1979
- 1,1821960 to 1969
- 8831950 to 1959
- 8121940 to 1949
- 5071939 or earlier
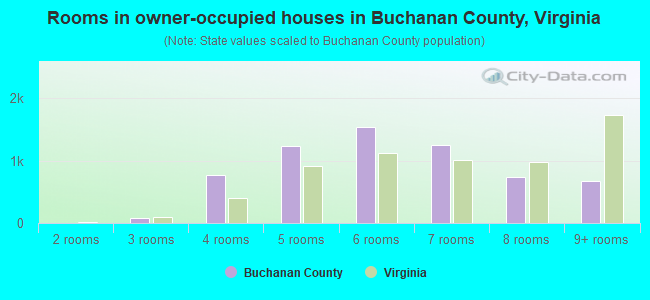
- Rooms in owner-occupied houses in Buchanan County, Virginia
- 01 room
- 52 rooms
- 793 rooms
- 7804 rooms
- 1,0695 rooms
- 1,5206 rooms
- 1,2277 rooms
- 8798 rooms
- 7839+ rooms
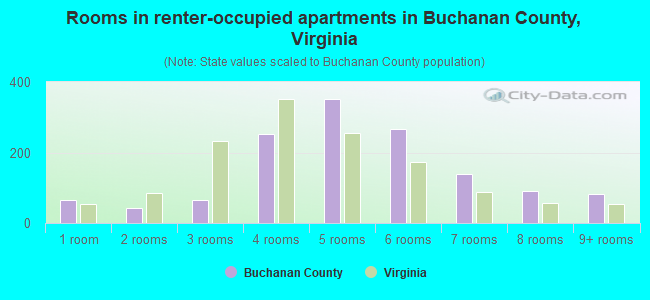
- Rooms in renter-occupied apartments in Buchanan County, Virginia
- 331 room
- 382 rooms
- 853 rooms
- 2454 rooms
- 4005 rooms
- 2346 rooms
- 1707 rooms
- 638 rooms
- 1089+ rooms
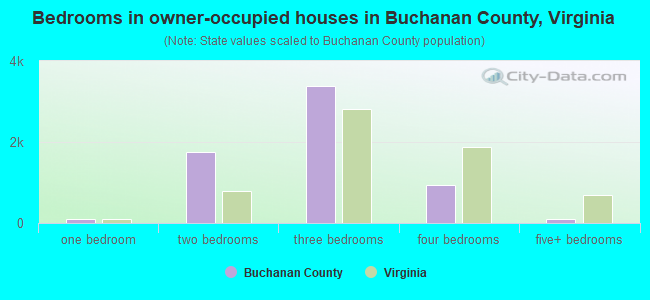
- Bedrooms in owner-occupied houses in Buchanan County, Virginia
- 0no bedroom
- 621 bedroom
- 1,6912 bedrooms
- 3,3863 bedrooms
- 1,0084 bedrooms
- 1385+ bedrooms
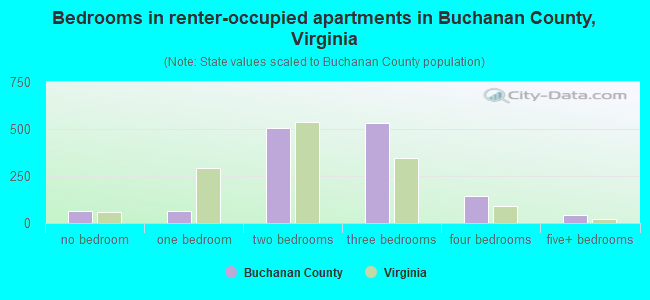
- Bedrooms in renter-occupied apartments in Buchanan County, Virginia
- 33no bedroom
- 601 bedroom
- 5352 bedrooms
- 5733 bedrooms
- 1334 bedrooms
- 445+ bedrooms
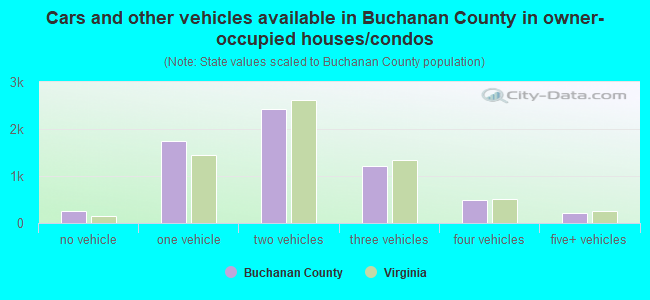
- Cars and other vehicles available in Buchanan County in owner-occupied houses/condos
- 254no vehicle
- 1,5511 vehicle
- 2,5582 vehicles
- 1,2773 vehicles
- 4574 vehicles
- 2475+ vehicles
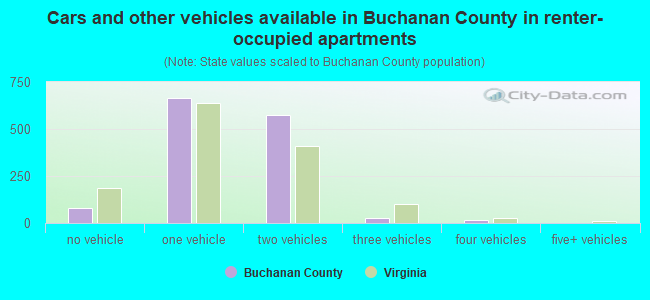
- Cars and other vehicles available in Buchanan County in renter-occupied apartments
- 134no vehicle
- 7001 vehicle
- 5392 vehicles
- 193 vehicles
- 04 vehicles
- 05+ vehicles
96.0% of Buchanan County residents lived in the same house 1 years ago.
Out of people who lived in different houses, 27% lived in this county.
Out of people who lived in different counties, 63% lived in Virginia.
| Buchanan County: | 96.0% |
| State average: | 86.6% |
Place of birth for U.S.-born residents:
- This state: 15,591
- Other state: 4,406
- Northeast: 260
- Midwest: 589
- South: 3,254
- West: 285
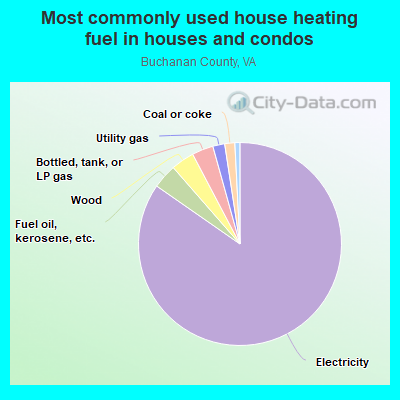
- 86.8%Electricity
- 3.3%Wood
- 3.2%Bottled, tank, or LP gas
- 2.7%Utility gas
- 2.3%Fuel oil, kerosene, etc.
- 1.2%Coal or coke
- 0.4%Other fuel
- 0.1%No fuel used
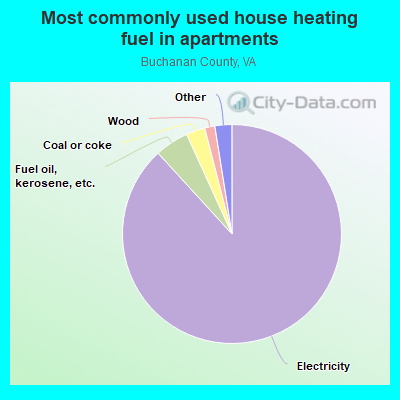
- 89.8%Electricity
- 3.3%Bottled, tank, or LP gas
- 3.0%Coal or coke
- 1.7%Fuel oil, kerosene, etc.
- 1.3%Wood
- 0.6%Utility gas
- 0.3%No fuel used
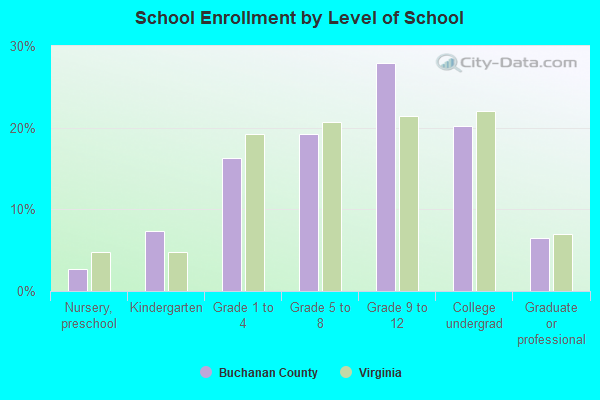
Private vs. public school enrollment:
| Here: | 5.9% |
| Virginia: | 13.2% |
| Here: | 10.8% |
| Virginia: | 10.2% |
| Here: | 9.5% |
| Virginia: | 18.7% |
Buchanan County government finances - Expenditure in 2018:
- Charges - Sewerage: $3,959,000
Elementary and Secondary Education School Lunch: $964,000
Solid Waste Management: $851,000
Other: $616,000
Parks and Recreation: $106,000
Elementary and Secondary Education - Other: $17,000
Elementary and Secondary Education School Tuition and Transportation: $9,000
- Construction - Parks and Recreation: $1,008,000
Elementary and Secondary Education: $705,000
- Current Operations - Elementary and Secondary Education: $40,127,000
Public Welfare - Other: $10,597,000
Regular Highways: $6,821,000
Sewerage: $5,097,000
Water Utilities: $4,656,000
Police Protection: $4,273,000
Solid Waste Management: $3,783,000
Housing and Community Development: $2,550,000
Judicial and Legal Services: $2,382,000
General Public Buildings: $1,864,000
General - Other: $1,772,000
Correctional Institutions: $1,664,000
Financial Administration: $1,036,000
Central Staff Services: $933,000
Parks and Recreation: $859,000
Health - Other: $758,000
Libraries: $645,000
Parking Facilities: $528,000
Local Fire Protection: $488,000
Protective Inspection and Regulation - Other: $163,000
Natural Resources - Other: $91,000
- Federal Intergovernmental - Other: $5,299,000
Education: $3,803,000
Public Welfare: $3,333,000
Highways: $1,235,000
Housing and Community Development: $921,000
- General - Interest on Debt: $338,000
- Intergovernmental to Local - Other - Elementary and Secondary Education: $79,000
- Local Intergovernmental - Education: $243,000
- Long Term Debt - Beginning Outstanding - Unspecified Public Purpose: $4,654,000
Outstanding Unspecified Public Purpose: $3,791,000
Retired Unspecified Public Purpose: $863,000
- Miscellaneous - General Revenue - Other: $7,020,000
Interest Earnings: $4,269,000
Donations From Private Sources: $80,000
Fines and Forfeits: $64,000
Sale of Property: $26,000
Rents: $22,000
- Other Capital Outlay - Elementary and Secondary Education: $1,669,000
- Other Funds - Cash and Securities: $78,567,000
- Revenue - Water Utilities: $2,751,000
- State Intergovernmental - Education: $25,238,000
Other: $6,005,000
General Local Government Support: $3,107,000
Public Welfare: $2,134,000
Sewerage: $1,965,000
Water Utilities: $1,965,000
- Tax - Property: $24,189,000
General Sales and Gross Receipts: $2,245,000
Public Utilities Sales: $462,000
Documentary and Stock Transfer: $270,000
Public Utility License: $69,000
Other License: $68,000
Other Selective Sales: $40,000
- Total Salaries and Wages: $20,465,000
Buchanan County government finances - Revenue in 2018:
- Charges - Sewerage: $3,959,000
Elementary and Secondary Education School Lunch: $964,000
Solid Waste Management: $851,000
Other: $616,000
Parks and Recreation: $106,000
Elementary and Secondary Education - Other: $17,000
Elementary and Secondary Education School Tuition and Transportation: $9,000
- Construction - Parks and Recreation: $1,008,000
Elementary and Secondary Education: $705,000
- Current Operations - Elementary and Secondary Education: $40,127,000
Public Welfare - Other: $10,597,000
Regular Highways: $6,821,000
Sewerage: $5,097,000
Water Utilities: $4,656,000
Police Protection: $4,273,000
Solid Waste Management: $3,783,000
Housing and Community Development: $2,550,000
Judicial and Legal Services: $2,382,000
General Public Buildings: $1,864,000
General - Other: $1,772,000
Correctional Institutions: $1,664,000
Financial Administration: $1,036,000
Central Staff Services: $933,000
Parks and Recreation: $859,000
Health - Other: $758,000
Libraries: $645,000
Parking Facilities: $528,000
Local Fire Protection: $488,000
Protective Inspection and Regulation - Other: $163,000
Natural Resources - Other: $91,000
- Federal Intergovernmental - Other: $5,299,000
Education: $3,803,000
Public Welfare: $3,333,000
Highways: $1,235,000
Housing and Community Development: $921,000
- General - Interest on Debt: $338,000
- Intergovernmental to Local - Other - Elementary and Secondary Education: $79,000
- Local Intergovernmental - Education: $243,000
- Long Term Debt - Beginning Outstanding - Unspecified Public Purpose: $4,654,000
Outstanding Unspecified Public Purpose: $3,791,000
Retired Unspecified Public Purpose: $863,000
- Miscellaneous - General Revenue - Other: $7,020,000
Interest Earnings: $4,269,000
Donations From Private Sources: $80,000
Fines and Forfeits: $64,000
Sale of Property: $26,000
Rents: $22,000
- Other Capital Outlay - Elementary and Secondary Education: $1,669,000
- Other Funds - Cash and Securities: $78,567,000
- Revenue - Water Utilities: $2,751,000
- State Intergovernmental - Education: $25,238,000
Other: $6,005,000
General Local Government Support: $3,107,000
Public Welfare: $2,134,000
Sewerage: $1,965,000
Water Utilities: $1,965,000
- Tax - Property: $24,189,000
General Sales and Gross Receipts: $2,245,000
Public Utilities Sales: $462,000
Documentary and Stock Transfer: $270,000
Public Utility License: $69,000
Other License: $68,000
Other Selective Sales: $40,000
- Total Salaries and Wages: $20,465,000
Buchanan County government finances - Debt in 2018:
- Charges - Sewerage: $3,959,000
Elementary and Secondary Education School Lunch: $964,000
Solid Waste Management: $851,000
Other: $616,000
Parks and Recreation: $106,000
Elementary and Secondary Education - Other: $17,000
Elementary and Secondary Education School Tuition and Transportation: $9,000
- Construction - Parks and Recreation: $1,008,000
Elementary and Secondary Education: $705,000
- Current Operations - Elementary and Secondary Education: $40,127,000
Public Welfare - Other: $10,597,000
Regular Highways: $6,821,000
Sewerage: $5,097,000
Water Utilities: $4,656,000
Police Protection: $4,273,000
Solid Waste Management: $3,783,000
Housing and Community Development: $2,550,000
Judicial and Legal Services: $2,382,000
General Public Buildings: $1,864,000
General - Other: $1,772,000
Correctional Institutions: $1,664,000
Financial Administration: $1,036,000
Central Staff Services: $933,000
Parks and Recreation: $859,000
Health - Other: $758,000
Libraries: $645,000
Parking Facilities: $528,000
Local Fire Protection: $488,000
Protective Inspection and Regulation - Other: $163,000
Natural Resources - Other: $91,000
- Federal Intergovernmental - Other: $5,299,000
Education: $3,803,000
Public Welfare: $3,333,000
Highways: $1,235,000
Housing and Community Development: $921,000
- General - Interest on Debt: $338,000
- Intergovernmental to Local - Other - Elementary and Secondary Education: $79,000
- Local Intergovernmental - Education: $243,000
- Long Term Debt - Beginning Outstanding - Unspecified Public Purpose: $4,654,000
Outstanding Unspecified Public Purpose: $3,791,000
Retired Unspecified Public Purpose: $863,000
- Miscellaneous - General Revenue - Other: $7,020,000
Interest Earnings: $4,269,000
Donations From Private Sources: $80,000
Fines and Forfeits: $64,000
Sale of Property: $26,000
Rents: $22,000
- Other Capital Outlay - Elementary and Secondary Education: $1,669,000
- Other Funds - Cash and Securities: $78,567,000
- Revenue - Water Utilities: $2,751,000
- State Intergovernmental - Education: $25,238,000
Other: $6,005,000
General Local Government Support: $3,107,000
Public Welfare: $2,134,000
Sewerage: $1,965,000
Water Utilities: $1,965,000
- Tax - Property: $24,189,000
General Sales and Gross Receipts: $2,245,000
Public Utilities Sales: $462,000
Documentary and Stock Transfer: $270,000
Public Utility License: $69,000
Other License: $68,000
Other Selective Sales: $40,000
- Total Salaries and Wages: $20,465,000
Buchanan County government finances - Cash and Securities in 2018:
- Charges - Sewerage: $3,959,000
Elementary and Secondary Education School Lunch: $964,000
Solid Waste Management: $851,000
Other: $616,000
Parks and Recreation: $106,000
Elementary and Secondary Education - Other: $17,000
Elementary and Secondary Education School Tuition and Transportation: $9,000
- Construction - Parks and Recreation: $1,008,000
Elementary and Secondary Education: $705,000
- Current Operations - Elementary and Secondary Education: $40,127,000
Public Welfare - Other: $10,597,000
Regular Highways: $6,821,000
Sewerage: $5,097,000
Water Utilities: $4,656,000
Police Protection: $4,273,000
Solid Waste Management: $3,783,000
Housing and Community Development: $2,550,000
Judicial and Legal Services: $2,382,000
General Public Buildings: $1,864,000
General - Other: $1,772,000
Correctional Institutions: $1,664,000
Financial Administration: $1,036,000
Central Staff Services: $933,000
Parks and Recreation: $859,000
Health - Other: $758,000
Libraries: $645,000
Parking Facilities: $528,000
Local Fire Protection: $488,000
Protective Inspection and Regulation - Other: $163,000
Natural Resources - Other: $91,000
- Federal Intergovernmental - Other: $5,299,000
Education: $3,803,000
Public Welfare: $3,333,000
Highways: $1,235,000
Housing and Community Development: $921,000
- General - Interest on Debt: $338,000
- Intergovernmental to Local - Other - Elementary and Secondary Education: $79,000
- Local Intergovernmental - Education: $243,000
- Long Term Debt - Beginning Outstanding - Unspecified Public Purpose: $4,654,000
Outstanding Unspecified Public Purpose: $3,791,000
Retired Unspecified Public Purpose: $863,000
- Miscellaneous - General Revenue - Other: $7,020,000
Interest Earnings: $4,269,000
Donations From Private Sources: $80,000
Fines and Forfeits: $64,000
Sale of Property: $26,000
Rents: $22,000
- Other Capital Outlay - Elementary and Secondary Education: $1,669,000
- Other Funds - Cash and Securities: $78,567,000
- Revenue - Water Utilities: $2,751,000
- State Intergovernmental - Education: $25,238,000
Other: $6,005,000
General Local Government Support: $3,107,000
Public Welfare: $2,134,000
Sewerage: $1,965,000
Water Utilities: $1,965,000
- Tax - Property: $24,189,000
General Sales and Gross Receipts: $2,245,000
Public Utilities Sales: $462,000
Documentary and Stock Transfer: $270,000
Public Utility License: $69,000
Other License: $68,000
Other Selective Sales: $40,000
- Total Salaries and Wages: $20,465,000
Supplemental Security Income (SSI) in 2006:
- Total number of recipients: 2,033
- Number of aged recipients: 44
- Number of blind and disabled recipients: 1,989
- Number of recipients under 18: 132
- Number of recipients between 18 and 64: 1,694
- Number of recipients older than 64: 207
- Number of recipients also receiving OASDI: 651
- Amount of payments (thousands of dollars): 921
| Most common first names in Buchanan County, VA among deceased individuals | ||
| Name | Count | Lived (average) |
|---|---|---|
| James | 86 | 67.9 years |
| John | 84 | 73.7 years |
| William | 62 | 71.1 years |
| Mary | 58 | 74.8 years |
| Robert | 39 | 66.8 years |
| George | 36 | 73.9 years |
| Clarence | 36 | 71.3 years |
| Henry | 31 | 72.3 years |
| Charles | 24 | 70.7 years |
| Edna | 24 | 81.8 years |
| Most common last names in Buchanan County, VA among deceased individuals | ||
| Last name | Count | Lived (average) |
|---|---|---|
| Stiltner | 163 | 70.0 years |
| Ratliff | 115 | 71.5 years |
| Deel | 109 | 71.0 years |
| Looney | 105 | 74.2 years |
| Stacy | 93 | 66.1 years |
| Owens | 89 | 70.9 years |
| Smith | 82 | 72.2 years |
| Mcclanahan | 72 | 71.6 years |
| Matney | 67 | 65.0 years |
| Blankenship | 66 | 63.7 years |
| Businesses in Buchanan County, VA | ||||
| Name | Count | Name | Count | |
|---|---|---|---|---|
| Advance Auto Parts | 1 | McDonald's | 1 | |
| Comfort Inn | 1 | Pizza Hut | 1 | |
| Curves | 1 | RadioShack | 1 | |
| Dairy Queen | 1 | Rite Aid | 1 | |
| FedEx | 1 | Subway | 1 | |
| GNC | 1 | True Value | 1 | |
| H&R Block | 1 | U-Haul | 1 | |
| Hardee's | 1 | UPS | 4 | |
| La-Z-Boy | 2 | Vans | 1 | |
| Long John Silver's | 1 | YMCA | 1 | |
Buchanan County on our top lists:
- #1 on the list of "Top 101 counties with the smallest number of children under 18 without health insurance coverage in 2000"
- #27 on the list of "Top 101 counties with the smallest number of people without health insurance coverage in 2000"
- #92 on the list of "Top 101 counties with the lowest percentage of residents relocating from other counties between 2010 and 2011"