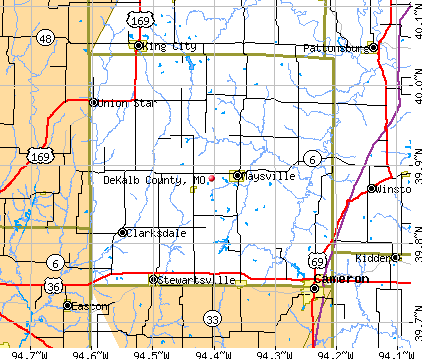
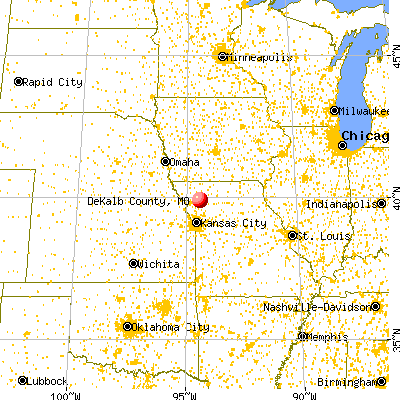
DeKalb County, Missouri (MO)
County owner-occupied free and clear houses and condos in 2010: 1,049
County owner-occupied houses and condos in 2000: 2,591
Renter-occupied apartments: 1,096 (it was 937 in 2000)
| % of renters here: | 27% |
| State: | 31% |
Land area: 424 sq. mi.
Water area: 1.6 sq. mi.
Population density: 28 people per square mile (low).
Industries providing employment: Educational, health and social services (23.5%), Manufacturing (15.3%).
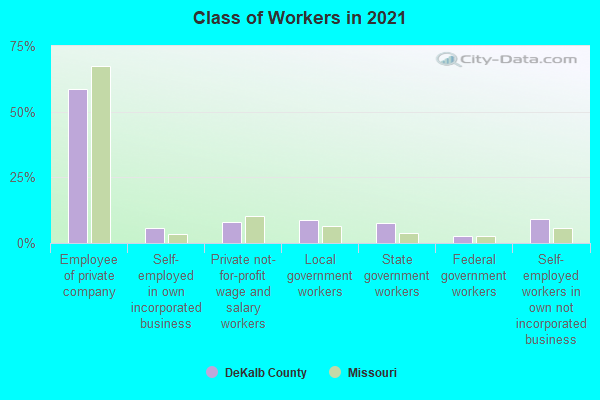
Type of workers:
- Private wage or salary: 70%
- Government: 21%
- Self-employed, not incorporated: 9%
- Unpaid family work: 0%
- OSM Map
- General Map
- Google Map
- MSN Map

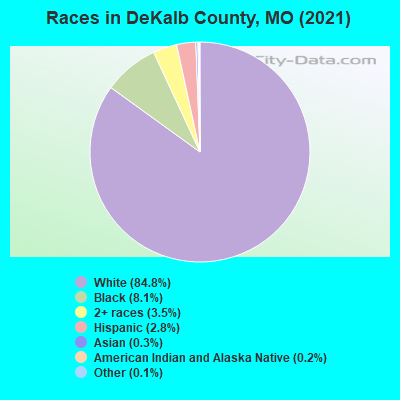
- 9,94484.1%White Non-Hispanic Alone
- 9237.8%Black Non-Hispanic Alone
- 4173.5%Two or more races
- 3543.0%Hispanic or Latino
- 1131.0%Asian alone
- 570.5%American Indian and Alaska Native alone
- 120.1%Some other race alone
| Median resident age: | 42.0 years |
| Missouri median age: | 39.1 years |
| Males: 7,143 | |
| Females: 4,740 |

 | Lawrence should join Kansas City's MSA (19 replies) |
| Chillicothe ...what is it like????? (33 replies) |
| DeKalb County: | 2.0 people |
| Missouri: | 2 people |
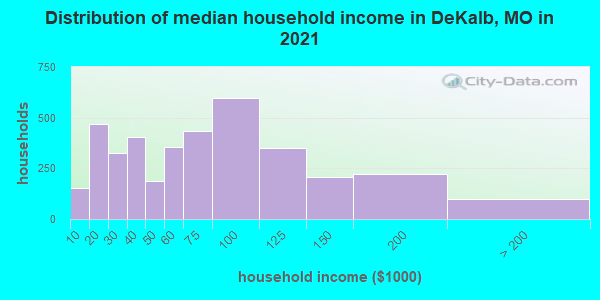
Estimated median household income in 2022: $66,767 ($31,654 in 1999)
| This county: | $66,767 |
| Missouri: | $64,811 |
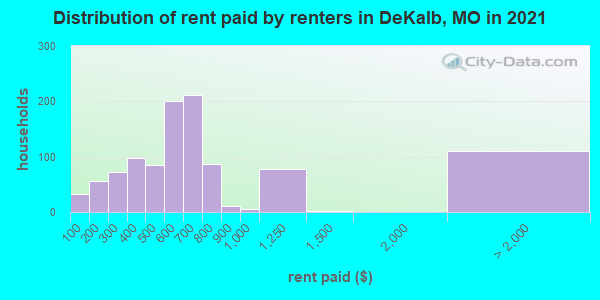
Median contract rent in 2022 for apartments: $553 (lower quartile is $364, upper quartile is $725)
| This county: | $553 |
| State: | $757 |
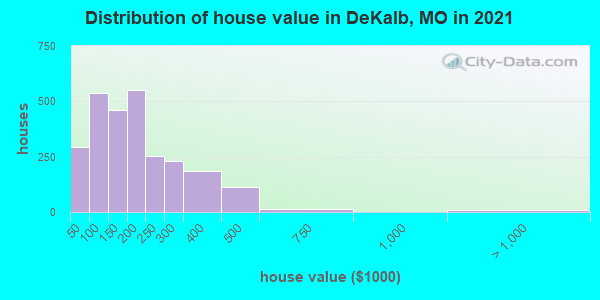
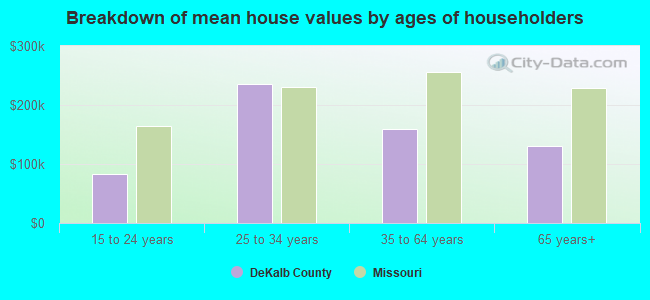
Estimated median house or condo value in 2022: $177,825 (it was $70,400 in 2000)
| DeKalb: | $177,825 |
| Missouri: | $221,200 |
Median monthly housing costs for homes and condos with a mortgage: $1,316
Median monthly housing costs for units without a mortgage: $445
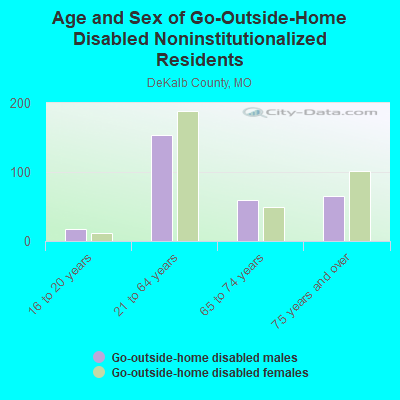
Institutionalized population: 3,533
Crime in 2021 (reported by the sheriff's office or county police, not the county total):
- Murders: 1
- Rapes: 0
- Robberies: 0
- Assaults: 7
- Burglaries: 9
- Thefts: 19
- Auto thefts: 5
Crime in 2020 (reported by the sheriff's office or county police, not the county total):
- Murders: 1
- Rapes: 0
- Robberies: 0
- Assaults: 22
- Burglaries: 23
- Thefts: 32
- Auto thefts: 9
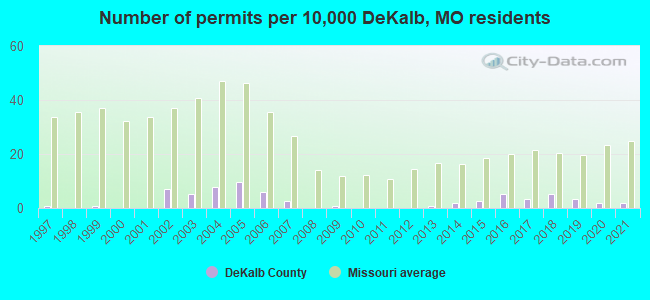
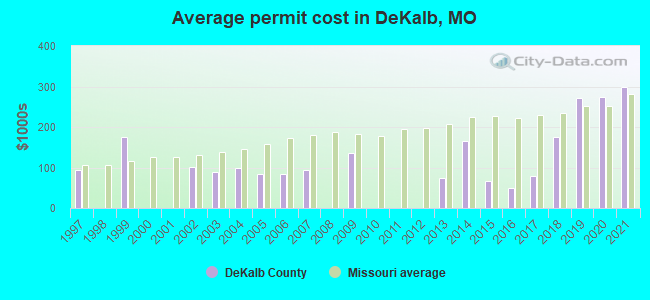
Single-family new house construction building permits:
- 2022: 6 buildings, average cost: $189,900
- 2021: 2 buildings, average cost: $297,900
- 2020: 2 buildings, average cost: $274,600
- 2019: 4 buildings, average cost: $270,700
- 2018: 6 buildings, average cost: $175,100
- 2017: 4 buildings, average cost: $78,900
- 2016: 6 buildings, average cost: $50,000
- 2015: 3 buildings, average cost: $66,700
- 2014: 2 buildings, average cost: $165,700
- 2013: 1 building, cost: $75,000
- 2012: 0 buildings
- 2011: 0 buildings
- 2010: 0 buildings
- 2009: 1 building, cost: $135,000
- 2008: 0 buildings
- 2007: 3 buildings, average cost: $93,300
- 2006: 7 buildings, average cost: $85,000
- 2005: 11 buildings, average cost: $83,400
- 2004: 9 buildings, average cost: $98,100
- 2003: 6 buildings, average cost: $90,000
- 2002: 8 buildings, average cost: $101,900
- 2001: 0 buildings
- 2000: 0 buildings
- 1999: 1 building, cost: $175,000
- 1998: 0 buildings
- 1997: 1 building, cost: $95,000
Median real estate property taxes paid for housing units with mortgages in 2022: $1,418 (0.7%)
Median real estate property taxes paid for housing units with no mortgage in 2022: $1,217 (0.8%)
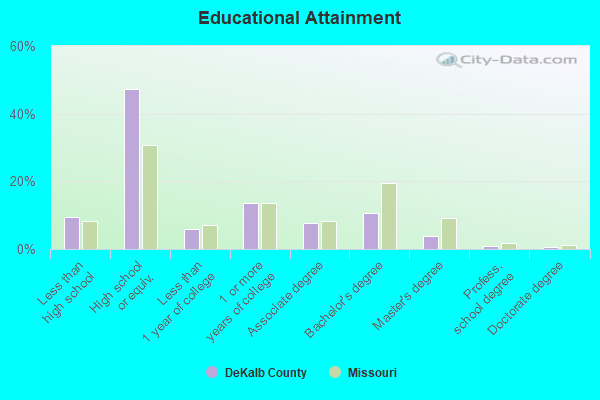
| DeKalb County: | 10.6% |
| Missouri: | 13.2% |
Median age of residents in 2022: 42.0 years old
(Males: 40.3 years old, Females: 45.8 years old)
(Median age for: White residents: 42.7 years old, Black residents: 40.5 years old, American Indian residents: 41.0 years old, Asian residents: 58.8 years old, Hispanic or Latino residents: 26.9 years old, Other race residents: 54.9 years old)
Area name: St. Joseph, MO-KS MSA
Fair market rent in 2006 for a 1-bedroom apartment in DeKalb County is $412 a month.
Fair market rent for a 2-bedroom apartment is $512 a month.
Fair market rent for a 3-bedroom apartment is $645 a month.
Cities in this county include: Maysville, Stewartsville, Union Star, Clarksdale, Weatherby, Amity.
Notable locations in this county outside city limits:
Notable locations in DeKalb County: Star Store (A), Northwestern (B), Dodd (C), Union Hall (D), Macon Rural Fire Department (E), Sue City Community Hall (F). Display/hide their locations on the map
Churches in DeKalb County include: Enon Church (A), Valley Chapel (B), Chariton Church (C), White Oak Church (D), Friendship Church (E), Plainview Church (F), Graves Chapel (G), Hebron Church (H), Helton Church (I). Display/hide their locations on the map
Cemeteries: Dodson Cemetery (1), Dowell Cemetery (2), Hopewell Cemetery (3), Hardgrove Cemetery (4), Ewing Cemetery (5), Hull Cemetery (6), Hayner Cemetery (7). Display/hide their locations on the map
Lakes and reservoirs: Taylor Hole (A), Agee Lake (B), Duck Hunters Lake (C), Fish Lake (D), Round Lake (E), Bone Yard Lake (F), Swan Lake (G), Speno Lake (H). Display/hide their locations on the map
Streams, rivers, and creeks: Elam Creek (A), Dutch Creek (B), Duck Creek (C), Sweezer Creek (D), Ward Branch (E), Cottonwood Creek (F), Clear Creek (G), Claybank Creek (H), Long Branch (I). Display/hide their locations on the map
Parks in DeKalb County include: Redman State Wildlife Area (1), Griffith State Wildlife Area (2), Atlanta State Wildlife Area (3). Display/hide their locations on the map
Neighboring counties: Arapahoe County, Colorado  , Arapahoe County, Colorado , Carroll County
  , Jefferson County, Nebraska , Livingston County
  , Macon County , Randolph County, Indiana .
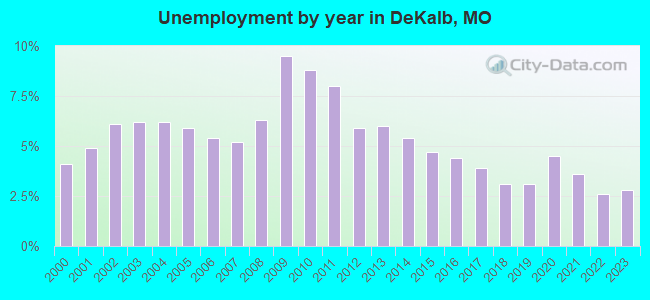
| Here: | 2.5% |
| Missouri: | 2.8% |
Current college students: 280
People 25 years of age or older with a high school degree or higher: 89.2%
People 25 years of age or older with a bachelor's degree or higher: 14.6%
Number of foreign born residents: 182 (34.4% naturalized citizens)
| DeKalb County: | 1.5% |
| Whole state: | 4.1% |
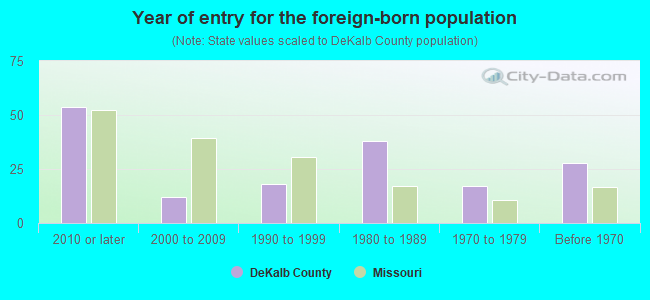
- Year of entry for the foreign-born population
- 382010 or later
- 402000 to 2009
- 201990 to 1999
- 381980 to 1989
- 171970 to 1979
- 28Before 1970
Mean travel time to work (commute): minutes
Percentage of county residents living and working in this county: 96.4%
Housing units in structures:
- One, detached: 3,230
- One, attached: 85
- Two: 226
- 3 or 4: 229
- 5 to 9: 142
- 10 to 19: 10
- 20 or more: 92
- Mobile homes: 258
- Boats, RVs, vans, etc.: 1
Housing units in DeKalb County with a mortgage: 1,300 (31 second mortgage, 0 home equity loan, 32 both second mortgage and home equity loan)
Houses without a mortgage: 14
| Here: | 6.7% with mortgage |
| State: | 98.0% with mortgage |
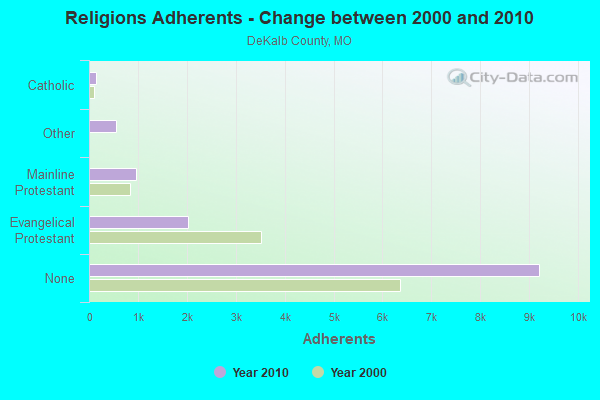
Religion statistics for DeKalb County
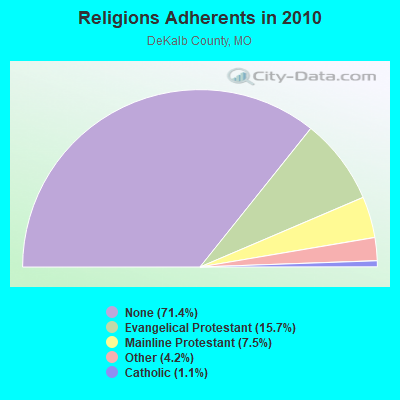
| Religion | Adherents | Congregations |
|---|---|---|
| Evangelical Protestant | 2,027 | 14 |
| Mainline Protestant | 964 | 10 |
| Other | 546 | 3 |
| Catholic | 146 | 1 |
| None | 9,209 | - |
Source: Clifford Grammich, Kirk Hadaway, Richard Houseal, Dale E.Jones, Alexei Krindatch, Richie Stanley and Richard H.Taylor. 2012. 2010 U.S.Religion Census: Religious Congregations & Membership Study. Association of Statisticians of American Religious Bodies. Jones, Dale E., et al. 2002. Congregations and Membership in the United States 2000. Nashville, TN: Glenmary Research Center.
Food Environment Statistics:
| DeKalb County: | 2.46 / 10,000 pop. |
| State: | 1.88 / 10,000 pop. |
| Here: | 0.82 / 10,000 pop. |
| Missouri: | 0.18 / 10,000 pop. |
| DeKalb County: | 4.09 / 10,000 pop. |
| Missouri: | 4.34 / 10,000 pop. |
| This county: | 2.46 / 10,000 pop. |
| State: | 7.37 / 10,000 pop. |
| DeKalb County: | 7.9% |
| Missouri: | 8.8% |
| DeKalb County: | 30.7% |
| State: | 29.6% |
| Here: | 18.0% |
| State: | 13.5% |
Agriculture in DeKalb County:
Average size of farms: 271 acresAverage value of agricultural products sold per farm: $33,062
Average value of crops sold per acre for harvested cropland: $114.91
The value of livestock, poultry, and their products as a percentage of the total market value of agricultural products sold: 60.89%
Average total farm production expenses per farm: $32,373
Harvested cropland as a percentage of land in farms: 41.60%
Average market value of all machinery and equipment per farm: $41,800
The percentage of farms operated by a family or individual: 93.28%
Average age of principal farm operators: 58 years
Average number of cattle and calves per 100 acres of all land in farms: 15.03
Milk cows as a percentage of all cattle and calves: 2.91%
Corn for grain: 22927 harvested acres
All wheat for grain: 1514 harvested acres
Soybeans for beans: 39695 harvested acres
Vegetables: 8 harvested acres
Land in orchards: 4 acres
Tornado activity:
DeKalb County historical area-adjusted tornado activity is significantly below Missouri state average. It is 1139643.2 times below overall U.S. average.Tornadoes in this county have caused 2 fatalities and 12 injuries recorded between 1950 and 2004.
On 4/23/1975, a category 4 (max. wind speeds 207-260 mph) tornado killed one person and injured 4 people and caused between $500,000 and $5,000,000 in damages.
Earthquake activity:
DeKalb County-area historical earthquake activity is significantly above Missouri state average. It is 415% greater than the overall U.S. average.On 9/3/2016 at 12:02:44, a magnitude 5.8 (5.8 MW, Depth: 3.5 mi, Class: Moderate, Intensity: VI - VII) earthquake occurred 275.6 miles away from DeKalb County center
On 11/6/2011 at 03:53:10, a magnitude 5.7 (5.7 MW, Depth: 3.2 mi) earthquake occurred 327.3 miles away from the county center
On 11/12/2014 at 21:40:00, a magnitude 4.9 (4.9 MW, Depth: 2.5 mi, Class: Light, Intensity: IV - V) earthquake occurred 250.6 miles away from the county center
On 4/18/2008 at 09:36:59, a magnitude 5.4 (5.1 MB, 4.8 MS, 5.4 MW, 5.2 MW) earthquake occurred 363.2 miles away from the county center
On 11/7/2016 at 01:44:24, a magnitude 5.0 (5.0 MW, Depth: 2.8 mi) earthquake occurred 299.2 miles away from DeKalb County center
On 2/13/2016 at 17:07:06, a magnitude 5.1 (5.1 MW, Depth: 5.2 mi) earthquake occurred 331.2 miles away from the county center
Magnitude types: body-wave magnitude (MB), surface-wave magnitude (MS), moment magnitude (MW)
Most recent natural disasters:
- Missouri Covid-19 Pandemic, Incident Period: January 20, 2020, FEMA Id: 4490, Natural disaster type: Other
- Missouri Severe Storms, Tornadoes, Straight-line Winds, and Flooding, Incident Period: May 15, 2015 to July 27, 2015, Major Disaster (Presidential) Declared DR-4238: August 07, 2015, FEMA Id: 4238, Natural disaster type: Storm, Tornado, Flood, Wind
- Missouri Severe Winter Storm and Snowstorm, Incident Period: January 31, 2011 to February 05, 2011, Major Disaster (Presidential) Declared DR-1961: March 23, 2011, FEMA Id: 1961, Natural disaster type: Snowstorm, Winter Storm
- Missouri Severe Winter Storm, Incident Period: January 31, 2011 to February 05, 2011, Emergency Declared EM-3317: February 03, 2011, FEMA Id: 3317, Natural disaster type: Winter Storm
- Missouri Severe Storms, Flooding, and Tornadoes, Incident Period: June 12, 2010 to July 31, 2010, Major Disaster (Presidential) Declared DR-1934: August 17, 2010, FEMA Id: 1934, Natural disaster type: Storm, Tornado, Flood
- Missouri Severe Winter Storm, Incident Period: January 26, 2009 to January 28, 2009, Emergency Declared EM-3303: January 30, 2009, FEMA Id: 3303, Natural disaster type: Winter Storm
- Missouri Severe Winter Storms, Incident Period: December 08, 2007 to December 15, 2007, Emergency Declared EM-3281: December 12, 2007, FEMA Id: 3281, Natural disaster type: Winter Storm
- Missouri Severe Winter Storms, Incident Period: December 06, 2007 to December 15, 2007, Major Disaster (Presidential) Declared DR-1736: December 27, 2007, FEMA Id: 1736, Natural disaster type: Winter Storm
- Missouri Severe Storms and Flooding, Incident Period: May 05, 2007 to May 18, 2007, Major Disaster (Presidential) Declared DR-1708: June 11, 2007, FEMA Id: 1708, Natural disaster type: Storm, Flood
- Missouri Hurricane Katrina Evacuation, Incident Period: August 29, 2005 to October 01, 2005, Emergency Declared EM-3232: September 10, 2005, FEMA Id: 3232, Natural disaster type: Hurricane
- 11 other natural disasters have been reported since 1953.
The number of natural disasters in DeKalb County (21) is greater than the US average (15).
Major Disasters (Presidential) Declared: 15
Emergencies Declared: 5
Causes of natural disasters: Floods: 11, Storms: 11, Tornadoes: 6, Winter Storms: 5, Drought: 1, Heavy Rain: 1, Hurricane: 1, Ice Storm: 1, Snowstorm: 1, Wind: 1, Other: 1 (Note: some incidents may be assigned to more than one category).
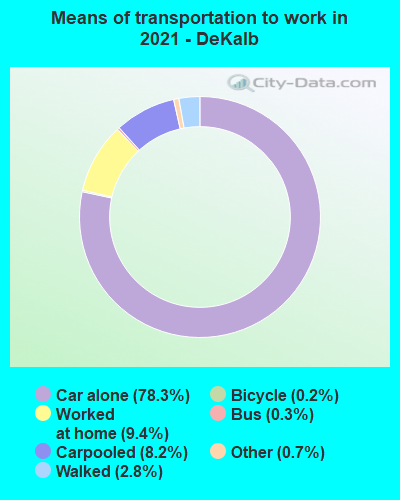
Means of transportation to work:
- Drove a car alone: 2,687 (74.6%)
- Carpooled: 277 (7.7%)
- Bus: 16 (0.4%)
- Taxicab, motorcycle, or other means: 31 (0.9%)
- Walked: 82 (2.3%)
- Worked at home: 522 (14.5%)
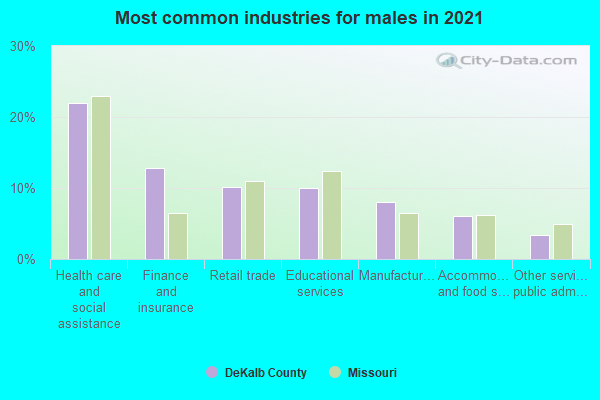
- Health care and social assistance (21%)
- Finance and insurance (12%)
- Retail trade (10%)
- Educational services (9%)
- Manufacturing (6%)
- Other services, except public administration (4%)
- Public administration (4%)
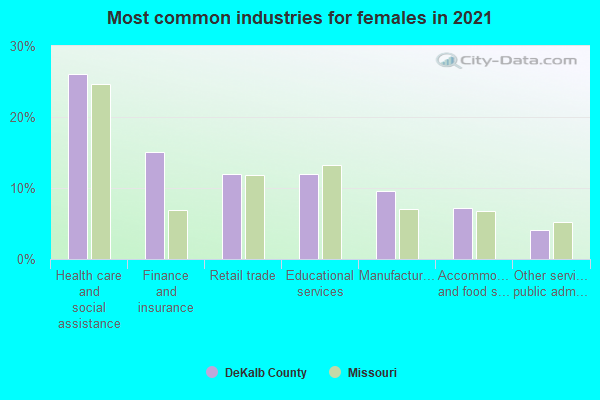
- Health care and social assistance (28%)
- Finance and insurance (16%)
- Retail trade (13%)
- Educational services (12%)
- Manufacturing (8%)
- Other services, except public administration (6%)
- Public administration (5%)
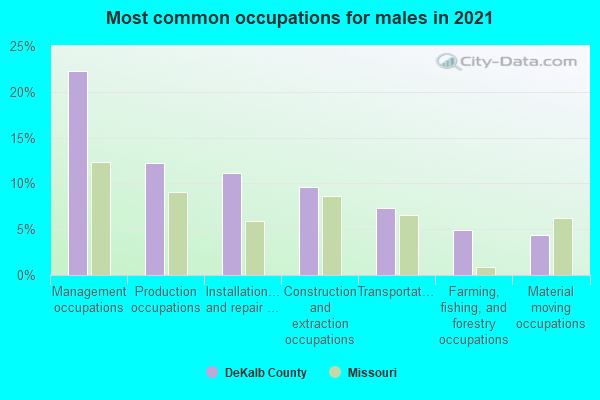
- Management occupations (24%)
- Production occupations (16%)
- Construction and extraction occupations (11%)
- Installation, maintenance, and repair occupations (10%)
- Transportation occupations (5%)
- Sales and related occupations (4%)
- Healthcare support occupations (4%)
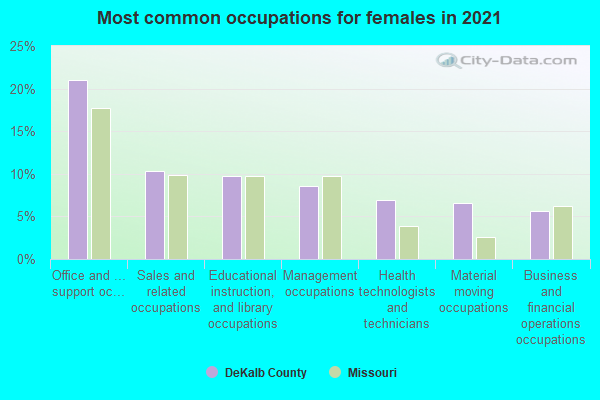
- Office and administrative support occupations (18%)
- Sales and related occupations (11%)
- Educational instruction, and library occupations (9%)
- Management occupations (8%)
- Healthcare support occupations (7%)
- Health technologists and technicians (7%)
- Business and financial operations occupations (7%)
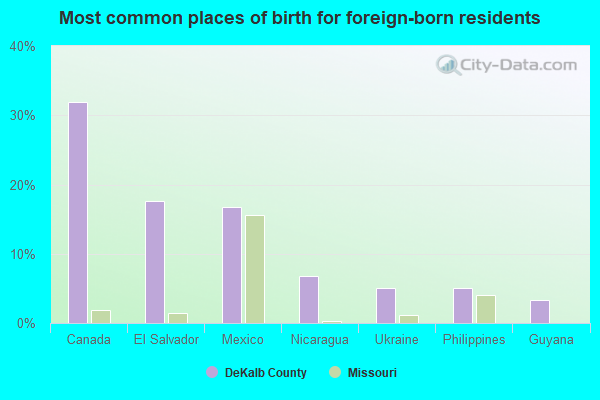
- Philippines (24%)
- Canada (20%)
- England (12%)
- Guyana (12%)
- El Salvador (9%)
- Mexico (8%)
- Nicaragua (5%)
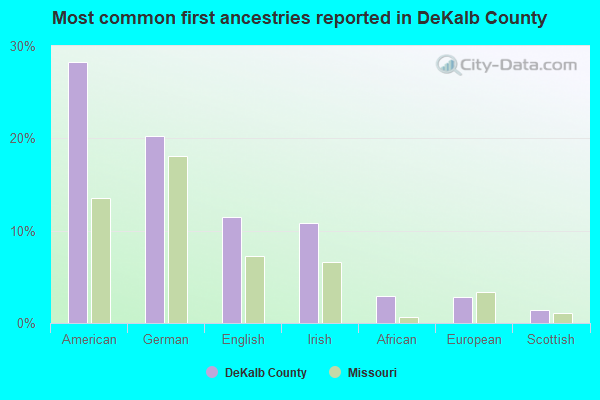
- American (30%)
- German (15%)
- English (13%)
- Irish (7%)
- African (3%)
- European (3%)
- Scottish (2%)
People in group quarters in DeKalb County, Missouri in 2010:
- 3,386 people in state prisons
- 147 people in nursing facilities/skilled-nursing facilities
- 19 people in workers' group living quarters and job corps centers
- 8 people in group homes intended for adults
People in group quarters in DeKalb County, Missouri in 2000:
- 2,626 people in state prisons
- 130 people in nursing homes
- 7 people in homes for the mentally retarded
- 3 people in local jails and other confinement facilities (including police lockups)
- 3 people in other noninstitutional group quarters
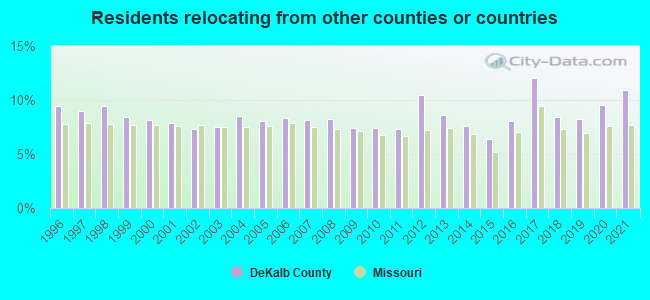
10.92% of this county's 2021 resident taxpayers lived in other counties in 2020 ($41,281 average adjusted gross income)
| Here: | 10.92% |
| Missouri average: | 7.67% |
10 or fewer of this county's residents moved from foreign countries.
9.32% relocated from other counties in Missouri ($34,481 average AGI)
1.60% relocated from other states ($6,800 average AGI)
DeKalb County: 1.60% Missouri average: 3.04%
Top counties from which taxpayers relocated into this county between 2020 and 2021:
| from Buchanan County, MO | |
| from Clinton County, MO | |
| from Jackson County, MO | |
| from Clay County, MO |
8.02% of this county's 2020 resident taxpayers moved to other counties in 2021 ($37,149 average adjusted gross income)
| Here: | 8.02% |
| Missouri average: | 7.51% |
10 or fewer of this county's residents moved to foreign countries.
7.20% relocated to other counties in Missouri ($32,441 average AGI)
0.83% relocated to other states ($4,705 average AGI)
DeKalb County: 0.83% Missouri average: 2.88%

Top counties to which taxpayers relocated from this county between 2020 and 2021:
| to Buchanan County, MO | |
| to Clinton County, MO |
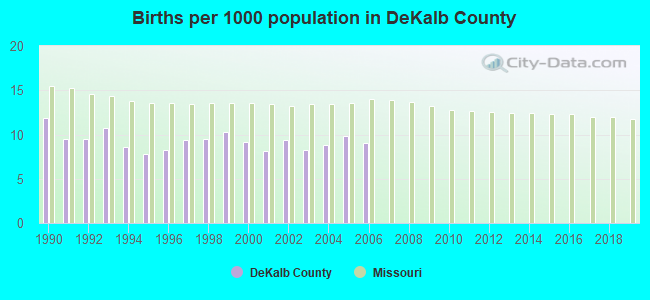
Births per 1000 population from 1990 to 1999: 9.6
Births per 1000 population from 2000 to 2006: 8.9
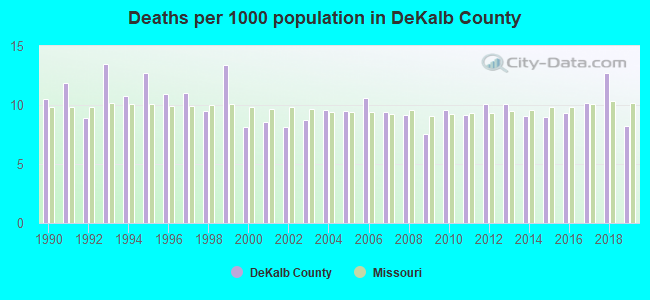
Deaths per 1000 population from 1990 to 1999: 11.3
Deaths per 1000 population from 2000 to 2009: 8.9
Deaths per 1000 population from 2010 to 2020: 10.1
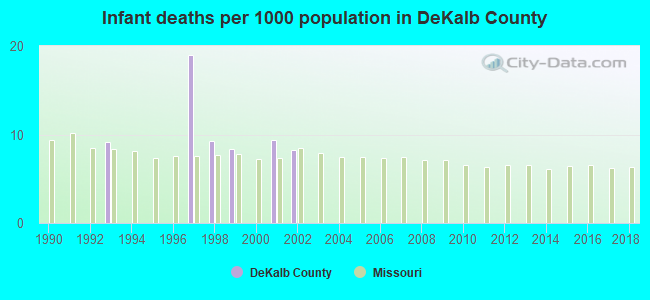
Infant deaths per 1000 live births from 1990 to 1999: 4.6
Infant deaths per 1000 live births from 2000 to 2006: 2.5
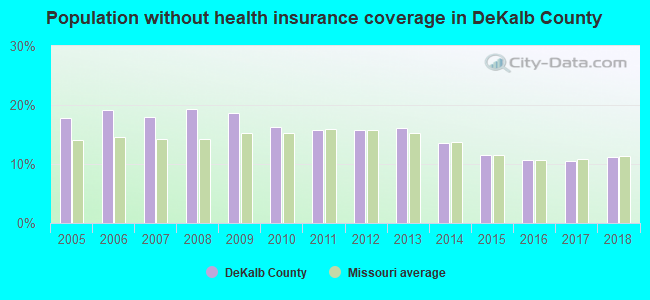
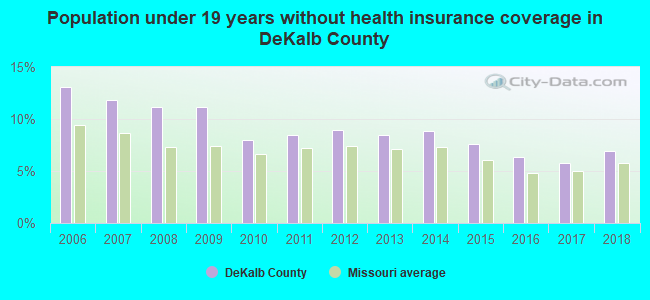
Persons under 19 years old without health insurance coverage in 2018: 6.9%
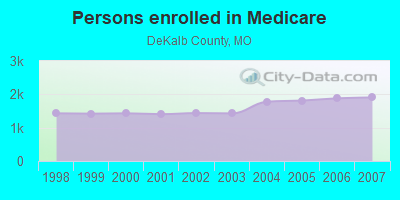
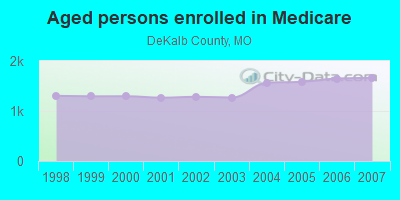
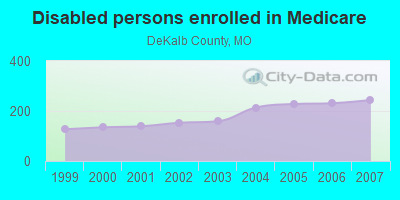
Persons enrolled in hospital insurance and/or supplemental medical insurance (Medicare) in July 1, 2007: 1,906 (1,662 aged, 244 disabled)
Children under 18 without health insurance coverage in 2007: 251 (11%)
Most common underlying causes of death in DeKalb County, Missouri in 1999 - 2019:
- Acute myocardial infarction, unspecified (297)
- Bronchus or lung, unspecified - Malignant neoplasms (73)
- Chronic obstructive pulmonary disease, unspecified (42)
- Unspecified dementia (10)
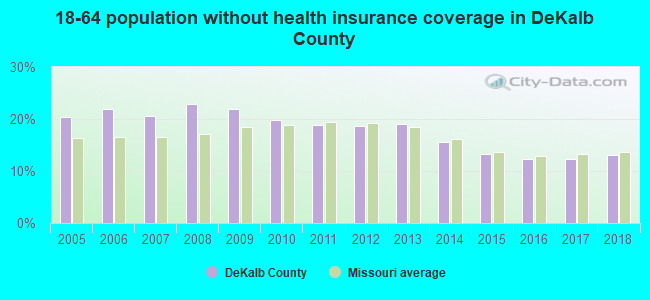
Population without health insurance coverage in 2000: 13%
Children under 18 without health insurance coverage in 2000: 10%
Medical specialist MDs per 100,000 population in 2005: 1,037
Total births per 100,000 population, July 2005 - July 2006 : 9
Total deaths per 100,000 population, July 2005 - July 2006: 32
Limited-service eating places per 100,000 population in 2005 : 8
Household type by relationship:
Households: 11,883- Male householders: 1,912 (579 living alone), Female householders: 1,896 (639 living alone)
1,896 spouses (1,860 opposite-sex spouses), 301 unmarried partners, (258 opposite-sex unmarried partners), 2,742 children (2,509 natural, 17 adopted, 221 stepchildren), 105 grandchildren, 45 brothers or sisters, 84 parents, 21 foster children, 104 other relatives, 232 non-relatives
- In group quarters: 2,486
Size of family households: 1,250 2-persons, 413 3-persons, 321 4-persons, 142 5-persons, 116 6-persons, 41 7-or-more-persons.
Size of nonfamily households: 1,218 1-person, 287 2-persons, 15 3-persons, 11 5-persons.
1,481 married couples with children.
466 single-parent households (96 men, 370 women).
97.0% of residents of DeKalb speak English at home.
0.5% of residents speak Spanish at home (73% speak English very well, 27% speak English not well).
1.8% of residents speak other Indo-European language at home (100% speak English very well).
0.5% of residents speak Asian or Pacific Island language at home (100% speak English very well).
0.1% of residents speak other language at home (100% speak English very well).
In fiscal year 2004:
Federal Government expenditure: $44,529,000 ($3,566 per capita)
Department of Defense expenditure: $918,000
Federal direct payments to individuals for retirement and disability: $19,714,000
Federal other direct payments to individuals: $9,383,000
Federal direct payments not to individuals: $8,131,000
Federal grants: $4,935,000
Federal procurement contracts: $431,000 ($0,000 Department of Defense)
Federal salaries and wages: $1,934,000 ($0,000 Department of Defense)
Federal Government direct loans: $722,000
Federal guaranteed/insured loans: $2,070,000
Federal Government insurance: $9,883,000
Population change from April 1, 2000 to July 1, 2005:
Births: 571| Here: | 46 per 1000 residents |
| State: | 69 per 1000 residents |
Deaths: 577
| Here: | 47 per 1000 residents |
| State: | 49 per 1000 residents |
Net international migration: +26
| Here: | +2 per 1000 residents |
| State: | +7 per 1000 residents |
Net internal migration: -739
| Here: | |
| State: |
Total withdrawal of fresh water for public supply: 0.03 millions of gallons per day (67% from ground, 33% from surface)
| Here: | 6.1 |
| State: | 6.4 |
| Here: | 4.1 |
| State: | 4.4 |
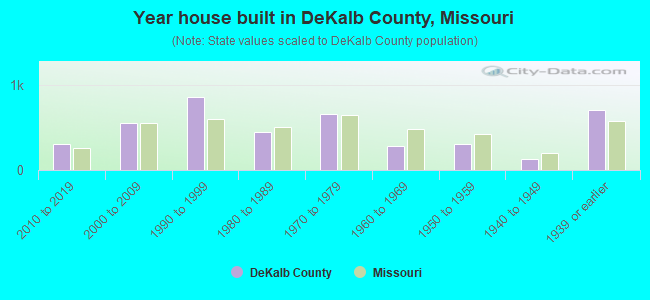
- Year house built in DeKalb County, Missouri
- 152020 or later
- 3672010 to 2019
- 7212000 to 2009
- 7861990 to 1999
- 3241980 to 1989
- 6271970 to 1979
- 2631960 to 1969
- 2811950 to 1959
- 1001940 to 1949
- 7691939 or earlier
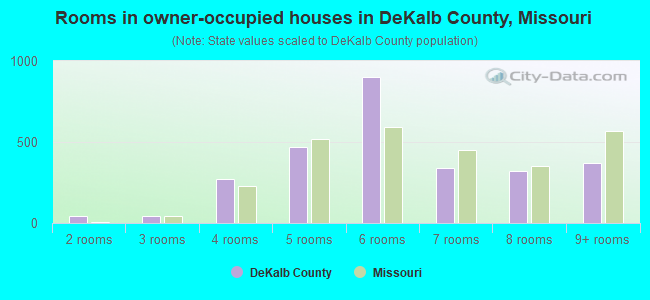
- Rooms in owner-occupied houses in DeKalb County, Missouri
- 01 room
- 512 rooms
- 223 rooms
- 1894 rooms
- 4745 rooms
- 8446 rooms
- 3077 rooms
- 3538 rooms
- 4149+ rooms
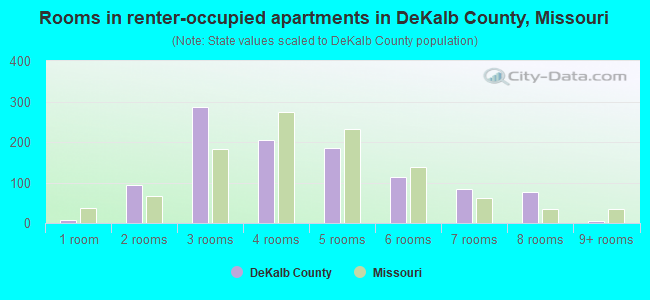
- Rooms in renter-occupied apartments in DeKalb County, Missouri
- 651 room
- 682 rooms
- 3353 rooms
- 1954 rooms
- 1445 rooms
- 1416 rooms
- 1147 rooms
- 678 rooms
- 249+ rooms
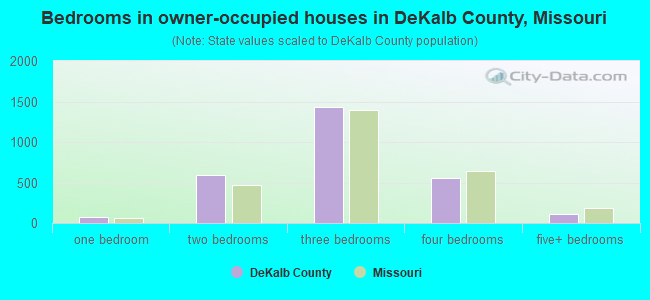
- Bedrooms in owner-occupied houses in DeKalb County, Missouri
- 1no bedroom
- 951 bedroom
- 5552 bedrooms
- 1,3283 bedrooms
- 5454 bedrooms
- 1345+ bedrooms
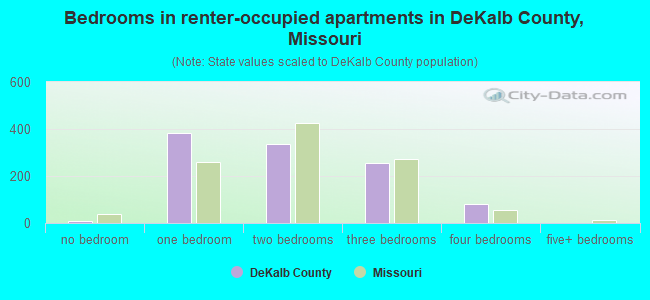
- Bedrooms in renter-occupied apartments in DeKalb County, Missouri
- 64no bedroom
- 3781 bedroom
- 4272 bedrooms
- 1883 bedrooms
- 744 bedrooms
- 155+ bedrooms
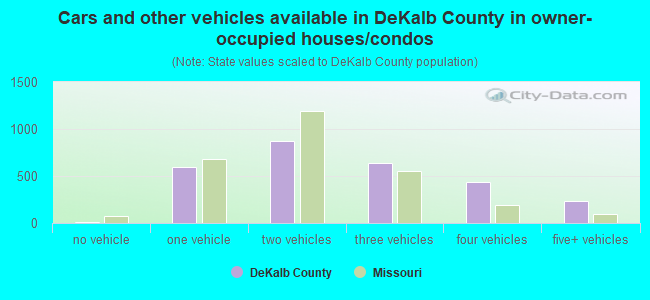
- Cars and other vehicles available in DeKalb County in owner-occupied houses/condos
- 32no vehicle
- 4781 vehicle
- 9172 vehicles
- 5963 vehicles
- 4514 vehicles
- 1915+ vehicles
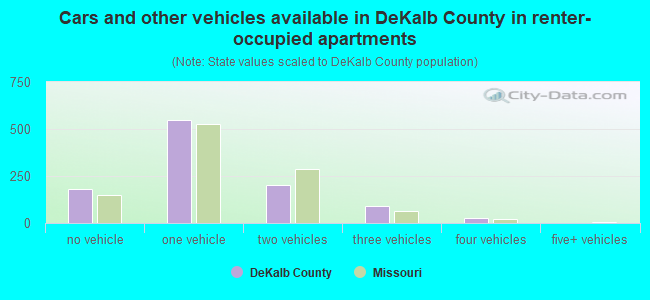
- Cars and other vehicles available in DeKalb County in renter-occupied apartments
- 213no vehicle
- 5951 vehicle
- 2792 vehicles
- 563 vehicles
- 34 vehicles
- 25+ vehicles
85.9% of DeKalb County residents lived in the same house 1 years ago.
Out of people who lived in different houses, 16% lived in this county.
Out of people who lived in different counties, 84% lived in Missouri.
| DeKalb County: | 85.9% |
| State average: | 87.1% |
Place of birth for U.S.-born residents:
- This state: 8,397
- Other state: 3,267
- Northeast: 170
- Midwest: 1,815
- South: 685
- West: 597
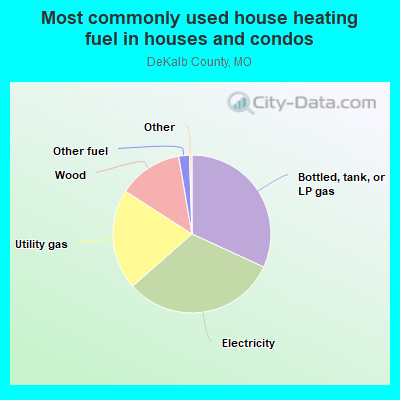
- 31.8%Electricity
- 30.3%Bottled, tank, or LP gas
- 23.1%Utility gas
- 11.8%Wood
- 2.7%Other fuel
- 0.2%No fuel used
- 0.1%Solar energy
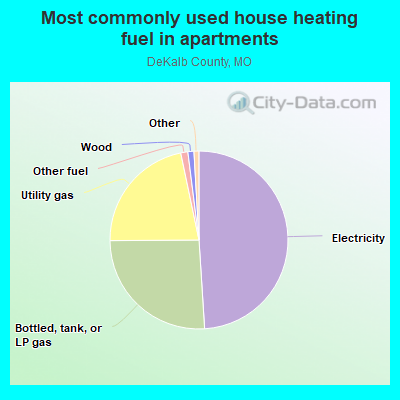
- 53.3%Electricity
- 22.9%Utility gas
- 20.5%Bottled, tank, or LP gas
- 1.7%Other fuel
- 1.1%Wood
- 0.3%No fuel used
- 0.2%Solar energy
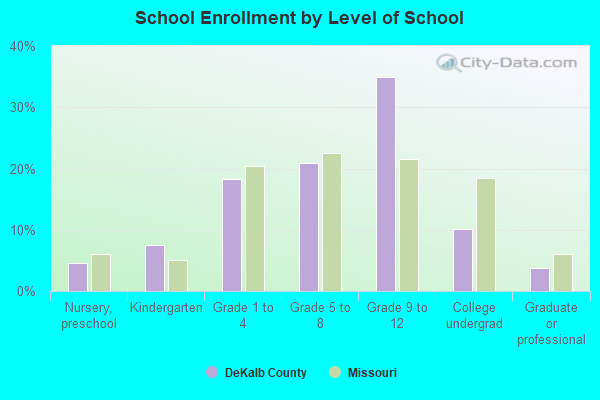
Private vs. public school enrollment:
| Here: | 14.4% |
| Missouri: | 15.4% |
| Here: | 16.5% |
| Missouri: | 13.9% |
| Here: | 14.8% |
| Missouri: | 22.6% |
DeKalb County government finances - Expenditure in 2017:
- Charges - Other: $850,000
- Current Operations - Central Staff Services: $756,000
Judicial and Legal Services: $65,000
Police Protection: $6,000
- General - Interest on Debt: $52,000
- Long Term Debt - Outstanding Unspecified Public Purpose: $1,300,000
Beginning Outstanding - Unspecified Public Purpose: $1,300,000
- Other Funds - Cash and Securities: $435,000
- State Intergovernmental - Highways: $250,000
- Tax - Property: $283,000
- Total Salaries and Wages: $100,000
DeKalb County government finances - Revenue in 2017:
- Charges - Other: $850,000
- Current Operations - Central Staff Services: $756,000
Judicial and Legal Services: $65,000
Police Protection: $6,000
- General - Interest on Debt: $52,000
- Long Term Debt - Outstanding Unspecified Public Purpose: $1,300,000
Beginning Outstanding - Unspecified Public Purpose: $1,300,000
- Other Funds - Cash and Securities: $435,000
- State Intergovernmental - Highways: $250,000
- Tax - Property: $283,000
- Total Salaries and Wages: $100,000
DeKalb County government finances - Debt in 2017:
- Charges - Other: $850,000
- Current Operations - Central Staff Services: $756,000
Judicial and Legal Services: $65,000
Police Protection: $6,000
- General - Interest on Debt: $52,000
- Long Term Debt - Outstanding Unspecified Public Purpose: $1,300,000
Beginning Outstanding - Unspecified Public Purpose: $1,300,000
- Other Funds - Cash and Securities: $435,000
- State Intergovernmental - Highways: $250,000
- Tax - Property: $283,000
- Total Salaries and Wages: $100,000
DeKalb County government finances - Cash and Securities in 2017:
- Charges - Other: $850,000
- Current Operations - Central Staff Services: $756,000
Judicial and Legal Services: $65,000
Police Protection: $6,000
- General - Interest on Debt: $52,000
- Long Term Debt - Outstanding Unspecified Public Purpose: $1,300,000
Beginning Outstanding - Unspecified Public Purpose: $1,300,000
- Other Funds - Cash and Securities: $435,000
- State Intergovernmental - Highways: $250,000
- Tax - Property: $283,000
- Total Salaries and Wages: $100,000
Supplemental Security Income (SSI) in 2006:
- Total number of recipients: 138
- Number of aged recipients: 13
- Number of blind and disabled recipients: 125
- Number of recipients under 18: 15
- Number of recipients between 18 and 64: 96
- Number of recipients older than 64: 27
- Number of recipients also receiving OASDI: 51
- Amount of payments (thousands of dollars): 65
| Most common first names in DeKalb County, MO among deceased individuals | ||
| Name | Count | Lived (average) |
|---|---|---|
| Mary | 67 | 80.4 years |
| John | 62 | 76.7 years |
| William | 45 | 79.0 years |
| James | 43 | 72.9 years |
| Robert | 40 | 76.4 years |
| Charles | 36 | 78.4 years |
| George | 28 | 82.0 years |
| Harold | 25 | 72.6 years |
| Anna | 22 | 84.2 years |
| Helen | 22 | 78.2 years |
| Most common last names in DeKalb County, MO among deceased individuals | ||
| Last name | Count | Lived (average) |
|---|---|---|
| Smith | 26 | 82.8 years |
| Thornton | 25 | 82.7 years |
| Johnson | 24 | 80.4 years |
| Miller | 20 | 75.1 years |
| Owen | 19 | 80.0 years |
| Jones | 18 | 76.4 years |
| White | 16 | 76.8 years |
| Brown | 16 | 82.6 years |
| Kerns | 16 | 81.6 years |
| Gibson | 14 | 80.4 years |
Businesses in DeKalb County, MO
- Chevrolet: 1
- Subway: 1
- True Value: 1
DeKalb County on our top lists:
- #7 on the list of "Top 101 counties with the lowest surface withdrawal of fresh water for public supply"
- #26 on the list of "Top 101 counties with the lowest total withdrawal of fresh water for public supply"
- #61 on the list of "Top 101 counties with the lowest ground withdrawal of fresh water for public supply"