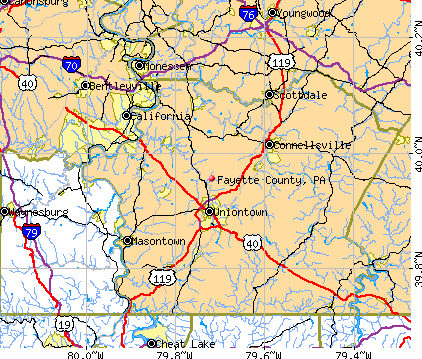
Fayette County, Pennsylvania (PA)
County owner-occupied free and clear houses and condos in 2010: 19,886
County owner-occupied houses and condos in 2000: 43,859
Renter-occupied apartments: 15,750 (it was 16,110 in 2000)
| % of renters here: | 27% |
| State: | 30% |
Land area: 790 sq. mi.
Water area: 7.9 sq. mi.
Population density: 159 people per square mile (high).
Industries providing employment: Educational, health and social services (27.2%), Retail trade (13.9%).
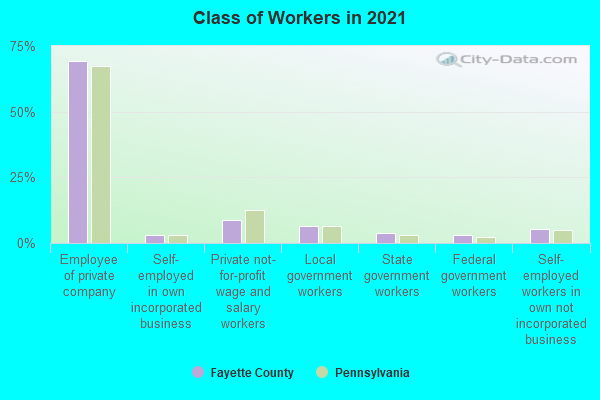
Type of workers:
- Private wage or salary: 83%
- Government: 12%
- Self-employed, not incorporated: 5%
- Unpaid family work: 0%
- OSM Map
- General Map
- Google Map
- MSN Map

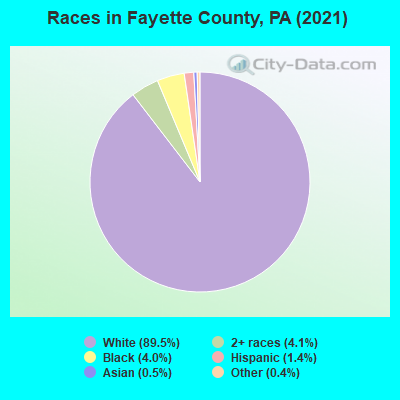
- 109,49387.1%White Non-Hispanic Alone
- 9,7817.8%Two or more races
- 2,8522.3%Black Non-Hispanic Alone
- 1,8661.5%Hispanic or Latino
- 8920.7%Some other race alone
- 5790.5%Asian alone
- 2920.2%American Indian and Alaska Native alone
| Median resident age: | 45.5 years |
| Pennsylvania median age: | 40.9 years |
| Males: 62,928 | |
| Females: 62,827 |

 | Pittsburgh MSA municipal population data (2020) (125 replies) |
| Pittsburgh MSA gains 86,000+ people overnight! (27 replies) |
| Pittsburgh Metro and City keep loosing population (270 replies) |
| Moving to PA... Where would you live (rural areas only) ? (74 replies) |
| Pittsburgh Area Municipal Estimates (17 replies) |
| Is Uniontown a bad area? (21 replies) |
| Fayette County: | 2.0 people |
| Pennsylvania: | 2 people |
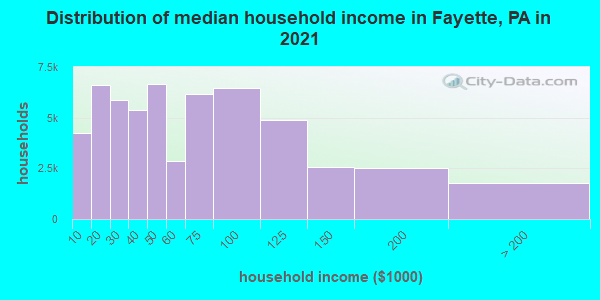
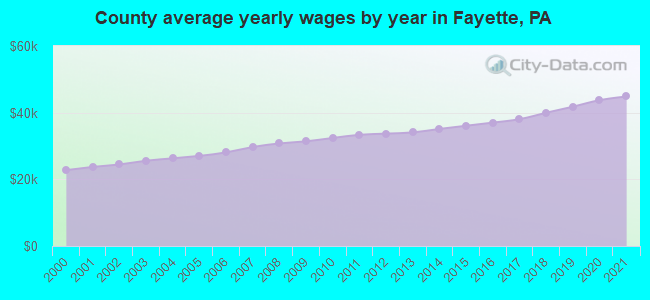
Estimated median household income in 2022: $51,776 ($27,451 in 1999)
| This county: | $51,776 |
| Pennsylvania: | $71,798 |
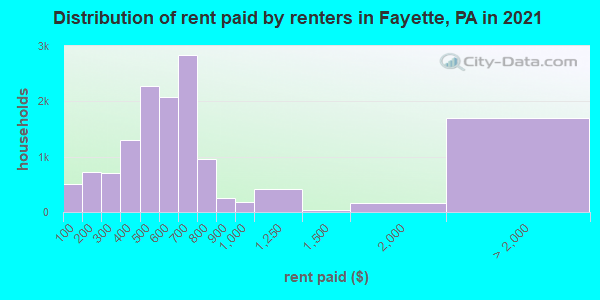
Median contract rent in 2022 for apartments: $526 (lower quartile is $408, upper quartile is $637)
| This county: | $526 |
| State: | $922 |
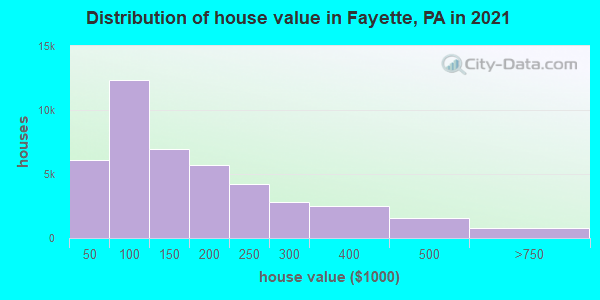
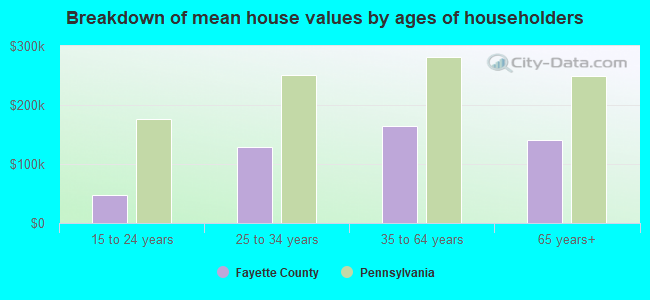
Estimated median house or condo value in 2022: $130,800 (it was $60,600 in 2000)
| Fayette: | $130,800 |
| Pennsylvania: | $245,500 |
Mean price in 2022:
Median monthly housing costs for homes and condos with a mortgage: $1,146Detached houses: $189,978
Here: $189,978 State: $317,202 Townhouses or other attached units: $101,252
Here: $101,252 State: $254,369 In 2-unit structures: $192,052
Here: $192,052 State: $249,182 In 3-to-4-unit structures: $124,825
Here: $124,825 State: $297,446 In 5-or-more-unit structures: $1,143,984
Here: $1,143,984 State: $320,068 Mobile homes: $75,768
Here: $75,768 State: $92,414
Median monthly housing costs for units without a mortgage: $474
Institutionalized population: 3,030
Health of residents in Fayette County based on CDC Behavioral Risk Factor Surveillance System Survey Questionnaires from 2013 to 2021:
General health status score of residents in this county from 1 (poor) to 5 (excellent) is 3.5. This is about average.74.1% of residents exercised in the past month. This is about average.
43.8% of residents smoked 100+ cigarettes in their lives. This is about average.
58.2% of adult residents drank alcohol in the past 30 days. This is less than average.
69.0% of residents visited a dentist within the past year. This is about average.
Average weight of males is 201 pounds. This is more than average.
Average weight of females is 162 pounds. This is about average.
Health of residents in Fayette County based on CDC Behavioral Risk Factor Surveillance System Survey Questionnaires from 2003 to 2012:
General health status score of residents in this county from 1 (poor) to 5 (excellent) is 3.2. This is significantly worse than average.64.0% of residents exercised in the past month. This is less than average.
49.2% of residents smoked 100+ cigarettes in their lives. This is about average.
98.9% of adult residents drank alcohol in the past 30 days. This is more than average.
60.4% of residents visited a dentist within the past year. This is less than average.
Average weight of males is 199 pounds. This is about average.
Average weight of females is 163 pounds. This is about average.
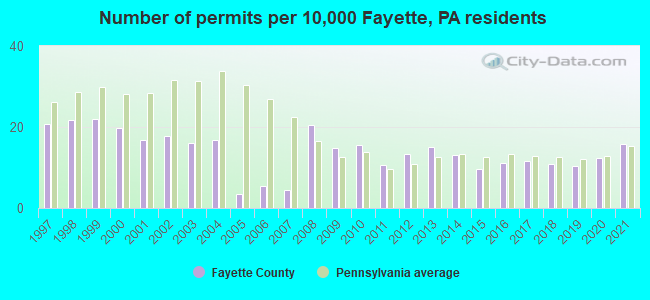
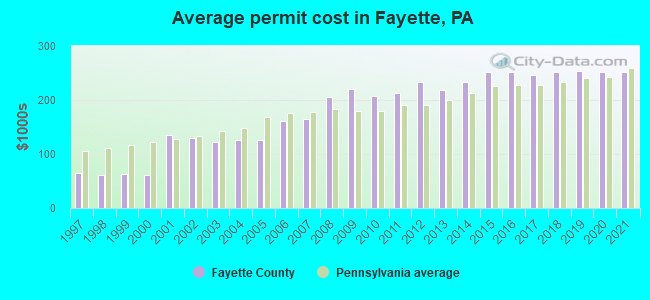
Single-family new house construction building permits:
- 2022: 212 buildings, average cost: $268,300
- 2021: 235 buildings, average cost: $251,100
- 2020: 185 buildings, average cost: $251,500
- 2019: 155 buildings, average cost: $253,600
- 2018: 163 buildings, average cost: $250,800
- 2017: 171 buildings, average cost: $245,800
- 2016: 165 buildings, average cost: $251,500
- 2015: 145 buildings, average cost: $252,300
- 2014: 193 buildings, average cost: $233,700
- 2013: 222 buildings, average cost: $218,800
- 2012: 198 buildings, average cost: $232,500
- 2011: 159 buildings, average cost: $212,700
- 2010: 232 buildings, average cost: $206,900
- 2009: 219 buildings, average cost: $220,600
- 2008: 304 buildings, average cost: $206,000
- 2007: 67 buildings, average cost: $163,600
- 2006: 81 buildings, average cost: $160,700
- 2005: 50 buildings, average cost: $126,300
- 2004: 251 buildings, average cost: $125,900
- 2003: 239 buildings, average cost: $121,500
- 2002: 266 buildings, average cost: $129,800
- 2001: 248 buildings, average cost: $134,600
- 2000: 292 buildings, average cost: $62,400
- 1999: 327 buildings, average cost: $62,700
- 1998: 322 buildings, average cost: $60,900
- 1997: 310 buildings, average cost: $64,300
Median real estate property taxes paid for housing units with mortgages in 2022: $1,638 (1.1%)
Median real estate property taxes paid for housing units with no mortgage in 2022: $1,421 (1.2%)
| Fayette County: | 17.3% |
| Pennsylvania: | 11.8% |
Median age of residents in 2022: 45.5 years old
(Males: 43.6 years old, Females: 47.8 years old)
(Median age for: White residents: 47.6 years old, Black residents: 48.2 years old, American Indian residents: 38.0 years old, Asian residents: 32.4 years old, Hispanic or Latino residents: 35.5 years old, Other race residents: 34.9 years old)
Area name: Pittsburgh, PA HUD Metro FMR Area
Fair market rent in 2006 for a 1-bedroom apartment in Fayette County is $601 a month.
Fair market rent for a 2-bedroom apartment is $719 a month.
Fair market rent for a 3-bedroom apartment is $894 a month.
Cities in this county include: Uniontown, Connellsville, Masontown, Oliver, Leith-Hatfield, Brownsville, East Uniontown, South Connellsville, Fairchance, Hopwood.
2023 air pollution in Fayette County:
Ozone (1-hour): 0.038 ppm (standard limit: 0.12 ppm). Near U.S. average.
Neighboring counties: Carbon County, Utah  , Cass County, Illinois , Hancock County, Indiana , Montgomery County
  , Johnson County, Nebraska , Piatt County, Illinois .
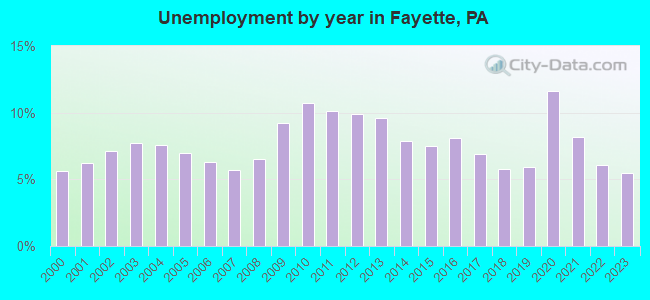
| Here: | 4.0% |
| Pennsylvania: | 2.9% |
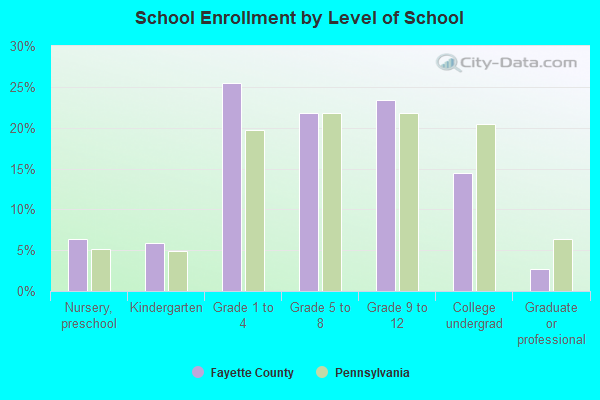
Current college students: 4,864
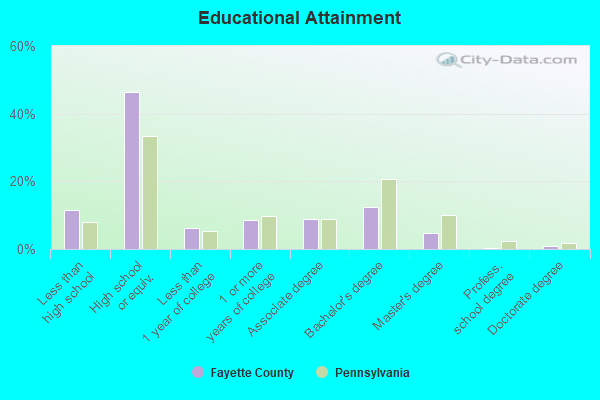
People 25 years of age or older with a high school degree or higher: 91.6%
People 25 years of age or older with a bachelor's degree or higher: 20.7%
Number of foreign born residents: 1,482 (61.6% naturalized citizens)
| Fayette County: | 1.2% |
| Whole state: | 7.5% |
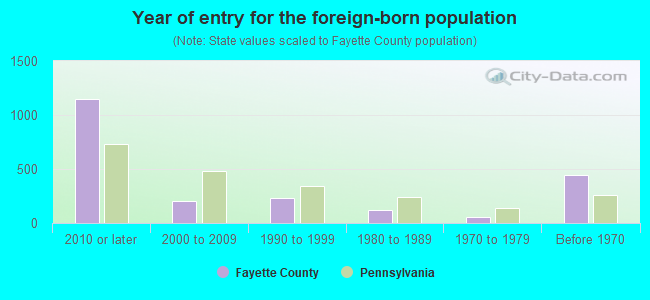
- Year of entry for the foreign-born population
- 1,1852010 or later
- 1362000 to 2009
- 3271990 to 1999
- 1231980 to 1989
- 601970 to 1979
- 440Before 1970
Mean travel time to work (commute): minutes
Percentage of county residents living and working in this county: 91.7%

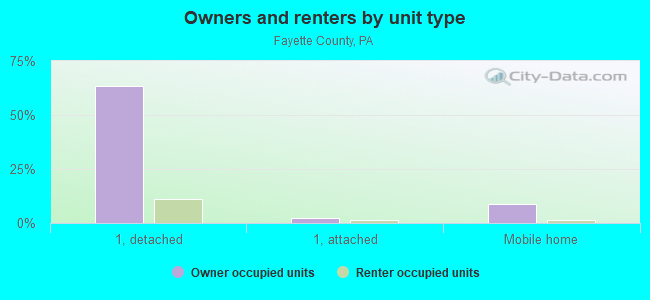
Housing units in structures:
- One, detached: 46,556
- One, attached: 2,031
- Two: 2,313
- 3 or 4: 1,689
- 5 to 9: 1,169
- 10 to 19: 402
- 20 to 49: 917
- 50 or more: 911
- Mobile homes: 6,193
Housing units in Fayette County with a mortgage: 18,527 (2,139 second mortgage, 0 home equity loan, 1,629 both second mortgage and home equity loan)
Houses without a mortgage: 1,567
| Here: | 94.7% with mortgage |
| State: | 93.8% with mortgage |
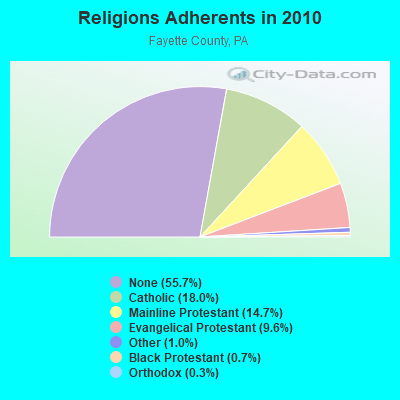
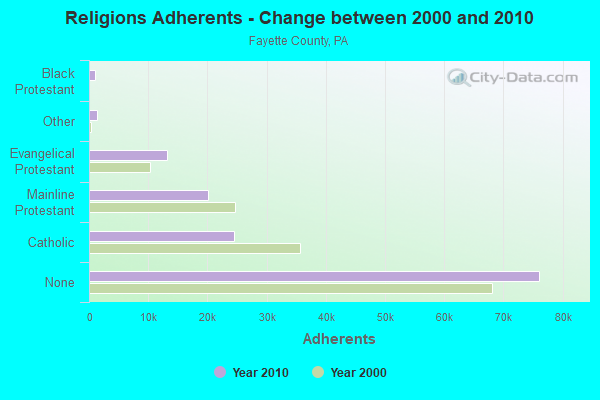
Religion statistics for Fayette County
| Religion | Adherents | Congregations |
|---|---|---|
| Catholic | 24,544 | 29 |
| Mainline Protestant | 20,117 | 103 |
| Evangelical Protestant | 13,148 | 109 |
| Other | 1,434 | 9 |
| Black Protestant | 931 | 8 |
| Orthodox | 344 | 6 |
| None | 76,088 | - |
Source: Clifford Grammich, Kirk Hadaway, Richard Houseal, Dale E.Jones, Alexei Krindatch, Richie Stanley and Richard H.Taylor. 2012. 2010 U.S.Religion Census: Religious Congregations & Membership Study. Association of Statisticians of American Religious Bodies. Jones, Dale E., et al. 2002. Congregations and Membership in the United States 2000. Nashville, TN: Glenmary Research Center.
Food Environment Statistics:
| Fayette County: | 2.49 / 10,000 pop. |
| State: | 2.04 / 10,000 pop. |
| Here: | 0.14 / 10,000 pop. |
| Pennsylvania: | 0.09 / 10,000 pop. |
| This county: | 0.90 / 10,000 pop. |
| Pennsylvania: | 0.88 / 10,000 pop. |
| Fayette County: | 2.29 / 10,000 pop. |
| Pennsylvania: | 2.52 / 10,000 pop. |
| This county: | 6.16 / 10,000 pop. |
| State: | 7.12 / 10,000 pop. |
| Fayette County: | 11.8% |
| Pennsylvania: | 9.1% |
| Fayette County: | 32.0% |
| State: | 27.2% |
| Here: | 16.1% |
| State: | 11.5% |
Agriculture in Fayette County:
Average size of farms: 128 acresAverage value of agricultural products sold per farm: $21,824
Average value of crops sold per acre for harvested cropland: $169.19
The value of livestock, poultry, and their products as a percentage of the total market value of agricultural products sold: 58.80%
Average total farm production expenses per farm: $20,722
Harvested cropland as a percentage of land in farms: 41.57%
Irrigated harvested cropland as a percentage of land in farms: 0.15%
Average market value of all machinery and equipment per farm: $53,543
The percentage of farms operated by a family or individual: 92.74%
Average age of principal farm operators: 56 years
Average number of cattle and calves per 100 acres of all land in farms: 15.70
Milk cows as a percentage of all cattle and calves: 21.02%
Corn for grain: 7588 harvested acres
All wheat for grain: 363 harvested acres
Soybeans for beans: 1134 harvested acres
Vegetables: 656 harvested acres
Land in orchards: 94 acres
Earthquake activity:
Fayette County-area historical earthquake activity is significantly above Pennsylvania state average. It is 47% smaller than the overall U.S. average.On 8/23/2011 at 17:51:04, a magnitude 5.8 (5.8 MW, Depth: 3.7 mi, Class: Moderate, Intensity: VI - VII) earthquake occurred 171.0 miles away from Fayette County center
On 9/25/1998 at 19:52:52, a magnitude 5.2 (4.8 MB, 4.3 MS, 5.2 LG, 4.5 MW, Depth: 3.1 mi) earthquake occurred 112.0 miles away from the county center
On 1/31/1986 at 16:46:43, a magnitude 5.0 (5.0 MB) earthquake occurred 136.6 miles away from the county center
On 7/27/1980 at 18:52:21, a magnitude 5.2 (5.1 MB, 4.7 MS, 5.0 UK, 5.2 UK) earthquake occurred 256.9 miles away from the county center
On 8/9/2020 at 12:07:37, a magnitude 5.1 (5.1 MW, Depth: 4.7 mi) earthquake occurred 252.0 miles away from Fayette County center
On 8/25/2011 at 05:07:52, a magnitude 4.5 (4.5 ML, Depth: 4.2 mi, Class: Light, Intensity: IV - V) earthquake occurred 167.9 miles away from the county center
Magnitude types: regional Lg-wave magnitude (LG), body-wave magnitude (MB), local magnitude (ML), surface-wave magnitude (MS), moment magnitude (MW)
Most recent natural disasters:
- Pennsylvania Covid-19 Pandemic, Incident Period: January 20, 2020, Major Disaster (Presidential) Declared DR-4506-PA: March 30, 2020, FEMA Id: 4506, Natural disaster type: Other
- Pennsylvania Severe Winter Storm and Snowstorm, Incident Period: January 22, 2016 to January 23, 2016, Major Disaster (Presidential) Declared DR-4267: March 23, 2016, FEMA Id: 4267, Natural disaster type: Snowstorm, Winter Storm
- Pennsylvania Severe Storms, Tornadoes, and Flooding, Incident Period: June 26, 2013 to July 12, 2013, Major Disaster (Presidential) Declared DR-4149: October 01, 2013, FEMA Id: 4149, Natural disaster type: Storm, Tornado, Flood
- Pennsylvania Hurricane Sandy, Incident Period: October 26, 2012 to November 08, 2012, Emergency Declared EM-3356: October 29, 2012, FEMA Id: 3356, Natural disaster type: Hurricane
- Pennsylvania Severe Winter Storms and Snowstorms, Incident Period: February 05, 2010 to February 11, 2010, Major Disaster (Presidential) Declared DR-1898: April 16, 2010, FEMA Id: 1898, Natural disaster type: Snowstorm, Winter Storm
- Pennsylvania Hurricane Katrina Evacuation, Incident Period: August 29, 2005 to October 01, 2005, Emergency Declared EM-3235: September 10, 2005, FEMA Id: 3235, Natural disaster type: Hurricane
- Pennsylvania Snowstorm, Incident Period: February 14, 2003 to February 19, 2003, Emergency Declared EM-3180: March 14, 2003, FEMA Id: 3180, Natural disaster type: Snowstorm
- Pennsylvania Flooding, Incident Period: January 19, 1996 to February 01, 1996, Major Disaster (Presidential) Declared DR-1093: January 21, 1996, FEMA Id: 1093, Natural disaster type: Flood
- Pennsylvania Blizzard, Incident Period: January 06, 1996 to January 12, 1996, Major Disaster (Presidential) Declared DR-1085: January 13, 1996, FEMA Id: 1085, Natural disaster type: Blizzard
- Pennsylvania Winter Storm, Severe Storm, Incident Period: January 04, 1994 to February 25, 1994, Major Disaster (Presidential) Declared DR-1015: March 10, 1994, FEMA Id: 1015, Natural disaster type: Winter Storm, Storm
- 5 other natural disasters have been reported since 1953.
The number of natural disasters in Fayette County (15) is near the US average (15).
Major Disasters (Presidential) Declared: 10
Emergencies Declared: 5
Causes of natural disasters: Floods: 4, Snowstorms: 4, Winter Storms: 4, Storms: 3, Hurricanes: 2, Blizzard: 1, Snowfall: 1, Tornado: 1, Tropical Storm: 1, Other: 1 (Note: some incidents may be assigned to more than one category).
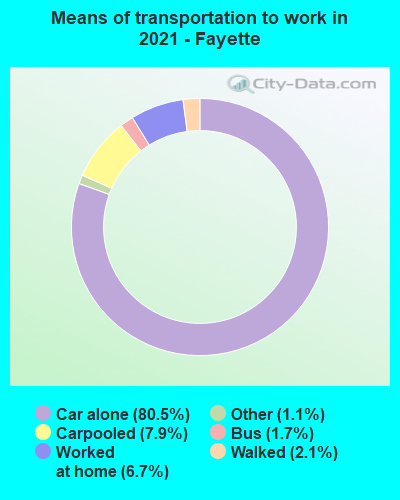
Means of transportation to work:
- Drove a car alone: 30,909 (76.0%)
- Carpooled: 3,256 (8.0%)
- Bus: 556 (1.4%)
- Subway or elevated rail: 8 (0.0%)
- Light rail, streetcar or trolley: 68 (0.2%)
- Taxicab, motorcycle, or other means: 558 (1.4%)
- Bicycle: 36 (0.1%)
- Walked: 786 (1.9%)
- Worked at home: 4,114 (10.1%)
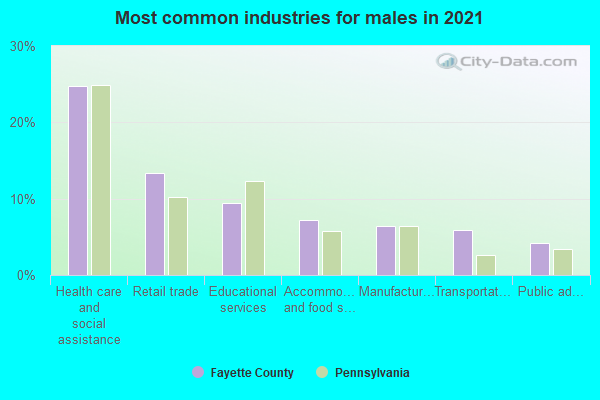
- Health care and social assistance (30%)
- Retail trade (16%)
- Educational services (10%)
- Accommodation and food services (8%)
- Professional, scientific, and technical services (5%)
- Other services, except public administration (4%)
- Transportation and warehousing (4%)
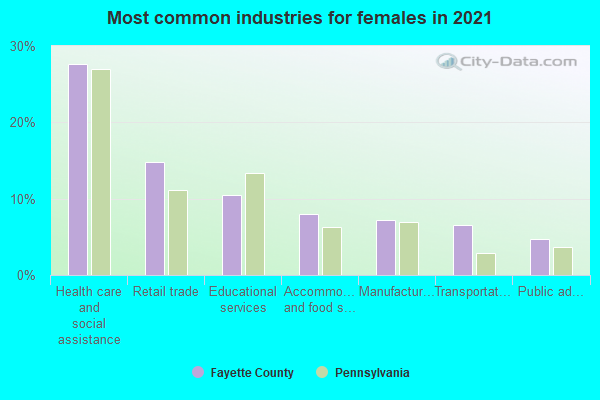
- Health care and social assistance (33%)
- Retail trade (17%)
- Educational services (11%)
- Accommodation and food services (8%)
- Professional, scientific, and technical services (5%)
- Other services, except public administration (5%)
- Transportation and warehousing (4%)
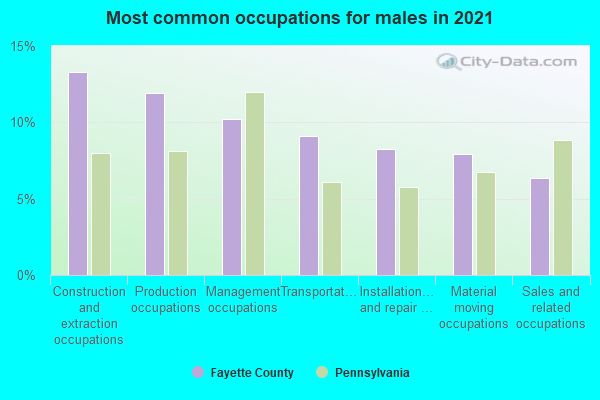
- Construction and extraction occupations (15%)
- Transportation occupations (12%)
- Production occupations (9%)
- Management occupations (9%)
- Sales and related occupations (8%)
- Installation, maintenance, and repair occupations (7%)
- Material moving occupations (7%)
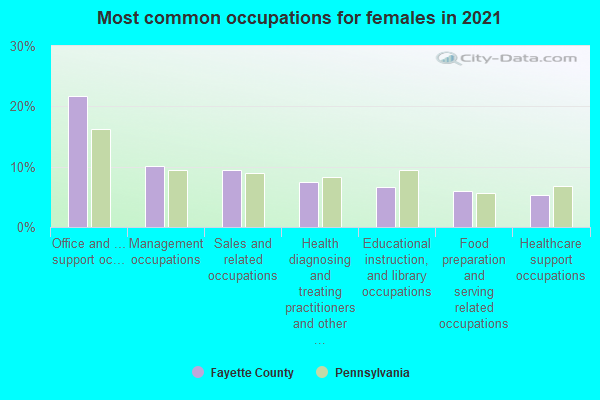
- Office and administrative support occupations (15%)
- Sales and related occupations (13%)
- Health diagnosing and treating practitioners and other technical occupations (11%)
- Educational instruction, and library occupations (9%)
- Healthcare support occupations (6%)
- Food preparation and serving related occupations (6%)
- Management occupations (6%)
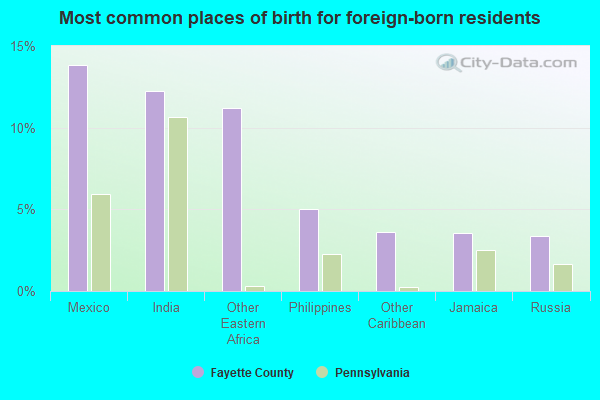
- India (14%)
- Mexico (11%)
- Other Eastern Africa (11%)
- Philippines (6%)
- United Kingdom, excluding England and Scotland (4%)
- Russia (4%)
- Jamaica (4%)
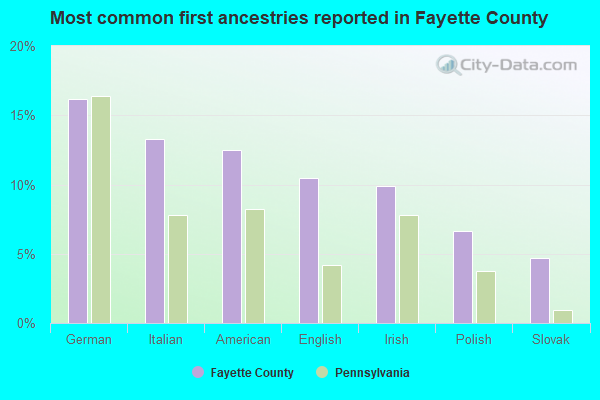
- German (16%)
- Italian (14%)
- American (11%)
- English (11%)
- Irish (9%)
- Polish (7%)
- Slovak (5%)
People in group quarters in Fayette County, Pennsylvania in 2010:
- 1,930 people in state prisons
- 929 people in group homes intended for adults
- 823 people in nursing facilities/skilled-nursing facilities
- 256 people in local jails and other municipal confinement facilities
- 121 people in other noninstitutional facilities
- 103 people in residential treatment centers for adults
- 29 people in emergency and transitional shelters (with sleeping facilities) for people experiencing homelessness
- 11 people in correctional facilities intended for juveniles
- 10 people in group homes for juveniles (non-correctional)
- 4 people in workers' group living quarters and job corps centers
People in group quarters in Fayette County, Pennsylvania in 2000:
- 853 people in nursing homes
- 805 people in other noninstitutional group quarters
- 790 people in religious group quarters
- 198 people in homes for the mentally retarded
- 153 people in local jails and other confinement facilities (including police lockups)
- 113 people in other nonhousehold living situations
- 38 people in other group homes
- 33 people in mental (psychiatric) hospitals or wards
- 18 people in homes for the mentally ill
- 7 people in short-term care, detention or diagnostic centers for delinquent children
- 3 people in college dormitories (includes college quarters off campus)
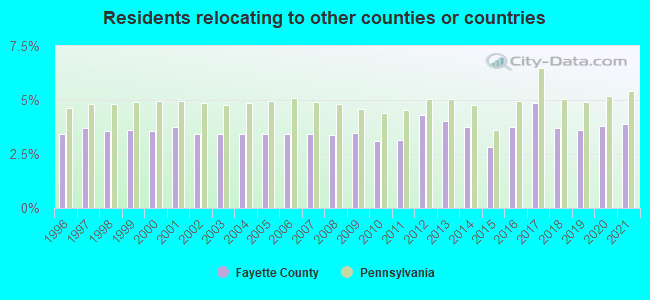
3.50% of this county's 2021 resident taxpayers lived in other counties in 2020 ($45,311 average adjusted gross income)
| Here: | 3.50% |
| Pennsylvania average: | 5.27% |
10 or fewer of this county's residents moved from foreign countries.
2.28% relocated from other counties in Pennsylvania ($29,073 average AGI)
1.22% relocated from other states ($16,238 average AGI)
Fayette County: 1.22% Pennsylvania average: 2.30%

Top counties from which taxpayers relocated into this county between 2020 and 2021:
| from Westmoreland County, PA | |
| from Allegheny County, PA | |
| from Washington County, PA | |
| from Monongalia County, WV | |
| from Greene County, PA | |
| from Somerset County, PA |
3.87% of this county's 2020 resident taxpayers moved to other counties in 2021 ($48,570 average adjusted gross income)
| Here: | 3.87% |
| Pennsylvania average: | 5.44% |
10 or fewer of this county's residents moved to foreign countries.
2.45% relocated to other counties in Pennsylvania ($26,952 average AGI)
1.42% relocated to other states ($21,618 average AGI)
Fayette County: 1.42% Pennsylvania average: 2.47%
Top counties to which taxpayers relocated from this county between 2020 and 2021:
| to Westmoreland County, PA | |
| to Washington County, PA | |
| to Allegheny County, PA | |
| to Monongalia County, WV | |
| to Greene County, PA | |
| to Somerset County, PA |
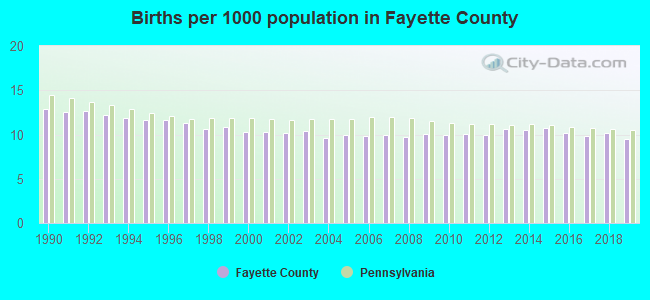
Births per 1000 population from 1990 to 1999: 11.8
Births per 1000 population from 2000 to 2009: 10.0
Births per 1000 population from 2010 to 2022: 8.6
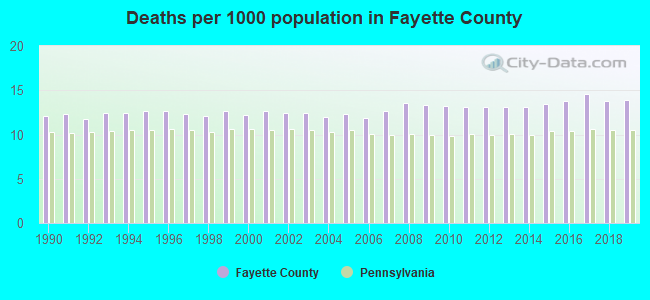
Deaths per 1000 population from 1990 to 1999: 12.3
Deaths per 1000 population from 2000 to 2009: 12.5
Deaths per 1000 population from 2010 to 2020: 13.7
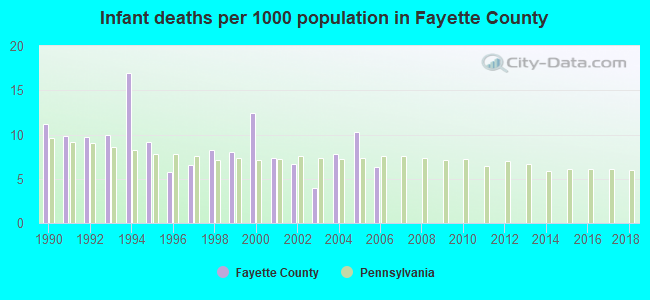
Infant deaths per 1000 live births from 1990 to 1999: 9.5
Infant deaths per 1000 live births from 2000 to 2006: 7.8
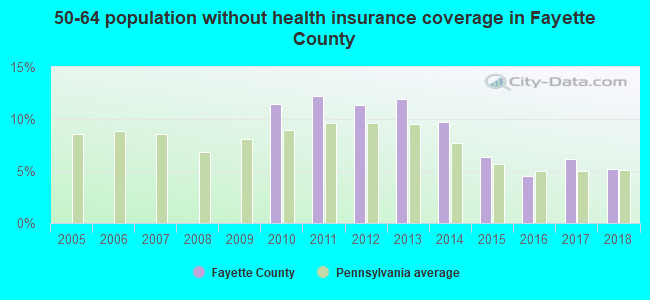
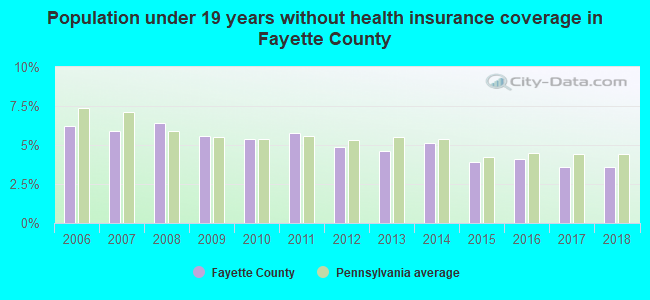
Persons under 19 years old without health insurance coverage in 2018: 3.6%
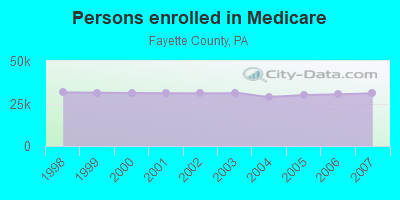
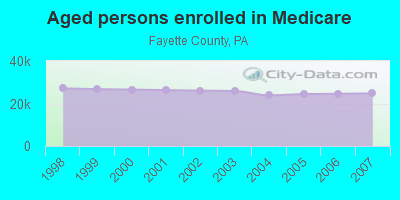
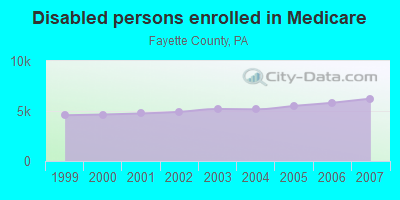
Persons enrolled in hospital insurance and/or supplemental medical insurance (Medicare) in July 1, 2007: 31,000 (24,760 aged, 6,240 disabled)
Children under 18 without health insurance coverage in 2007: 2,613 (9%)
Most common underlying causes of death in Fayette County, Pennsylvania in 1999 - 2019:
- Atherosclerotic heart disease (4,399)
- Bronchus or lung, unspecified - Malignant neoplasms (2,384)
- Acute myocardial infarction, unspecified (1,749)
- Chronic obstructive pulmonary disease, unspecified (1,579)
- Stroke, not specified as haemorrhage or infarction (1,022)
- Unspecified dementia (1,010)
- Alzheimer disease, unspecified (968)
- Congestive heart failure (822)
- Unspecified diabetes mellitus, without complications (701)
- Atherosclerotic cardiovascular disease, so described (658)
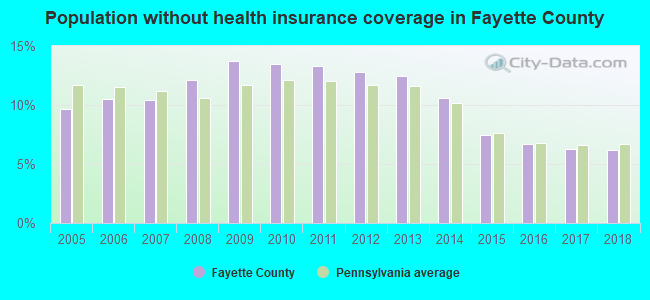
Population without health insurance coverage in 2000: 13%
Children under 18 without health insurance coverage in 2000: 11%
Short term general hospital admissions per 100,000 population in 2004: 10,334
Short term general hospital beds per 100,000 population in 2004: 236
Emergency room visits per 100,000 population in 2004: 54,118
General practice office based MDs per 100,000 population in 2005: 967
Medical specialist MDs per 100,000 population in 2005: 1,106
Dentists per 100,000 population in 1998: 11
Total births per 100,000 population, July 2005 - July 2006 : 42
Total deaths per 100,000 population, July 2005 - July 2006: 64
Limited-service eating places per 100,000 population in 2005 : 5
Beer, wine & liquor stores per 100,000 population in 2005: 1
Homicides per 1,000,000 population from 2000 to 2006: 36.2. This is less than state average.
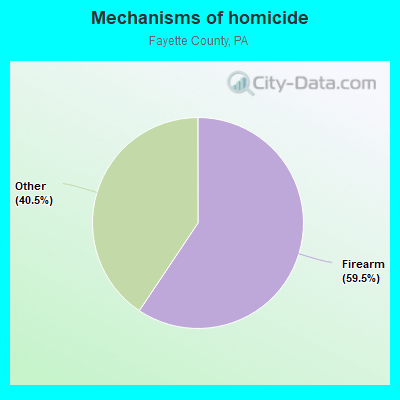
- Firearm - 21.5
- Other - 14.7
Suicides per 1,000,000 population from 2000 to 2006: 121.2. This is more than state average.
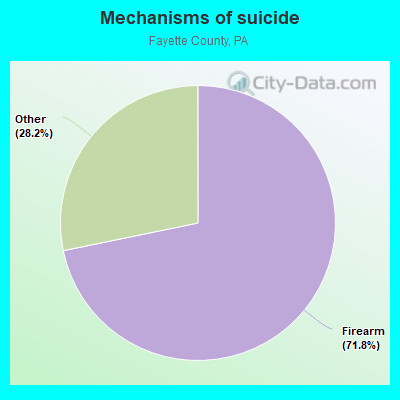
- Firearm - 87.0
- Other - 34.2
Household type by relationship:
Households: 125,755- Male householders: 26,099 (8,946 living alone), Female householders: 29,558 (10,137 living alone)
24,575 spouses (24,228 opposite-sex spouses), 4,340 unmarried partners, (4,163 opposite-sex unmarried partners), 30,425 children (28,302 natural, 721 adopted, 1,402 stepchildren), 2,887 grandchildren, 459 brothers or sisters, 655 parents, 109 foster children, 1,002 other relatives, 1,326 non-relatives
- In group quarters: 4,320
Size of family households: 16,913 2-persons, 7,886 3-persons, 5,003 4-persons, 2,431 5-persons, 457 6-persons, 246 7-or-more-persons.
Size of nonfamily households: 19,083 1-person, 3,576 2-persons, 29 3-persons, 33 4-persons.
13,698 married couples with children.
7,204 single-parent households (2,579 men, 4,625 women).
96.7% of residents of Fayette speak English at home.
1.1% of residents speak Spanish at home (74% speak English very well, 13% speak English well, 9% speak English not well, 4% don't speak English at all).
1.2% of residents speak other Indo-European language at home (87% speak English very well, 8% speak English well, 5% speak English not well, 1% don't speak English at all).
0.3% of residents speak Asian or Pacific Island language at home (63% speak English very well, 23% speak English well, 14% speak English not well).
0.3% of residents speak other language at home (86% speak English very well, 14% speak English well).
In fiscal year 2004:
Federal Government expenditure: $1,178,195,000 ($8,089 per capita)
Department of Defense expenditure: $22,383,000
Federal direct payments to individuals for retirement and disability: $490,778,000
Federal other direct payments to individuals: $338,962,000
Federal direct payments not to individuals: $6,361,000
Federal grants: $293,141,000
Federal procurement contracts: $17,539,000 ($8,162,000 Department of Defense)
Federal salaries and wages: $31,414,000 ($3,803,000 Department of Defense)
Federal Government direct loans: $2,429,000
Federal guaranteed/insured loans: $14,899,000
Federal Government insurance: $60,980,000
Population change from April 1, 2000 to July 1, 2005:
Births: 7,823| Here: | 54 per 1000 residents |
| State: | 61 per 1000 residents |
Deaths: 9,565
| Here: | 65 per 1000 residents |
| State: | 54 per 1000 residents |
Net international migration: +102
| Here: | +1 per 1000 residents |
| State: | +8 per 1000 residents |
Net internal migration: -686
| Here: | |
| State: |
Total withdrawal of fresh water for public supply: 39.51 millions of gallons per day (1% from ground, 99% from surface)
| Here: | 6.3 |
| State: | 6.8 |
| Here: | 4.9 |
| State: | 4.3 |
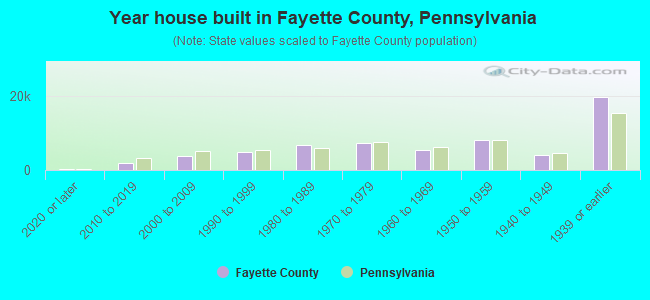
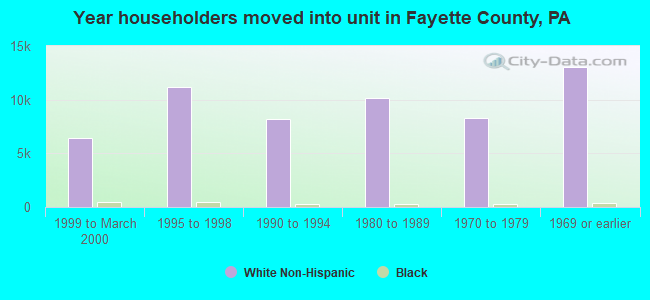
- Year house built in Fayette County, Pennsylvania
- 1632020 or later
- 2,2682010 to 2019
- 4,2352000 to 2009
- 4,7831990 to 1999
- 5,4991980 to 1989
- 8,3011970 to 1979
- 5,3281960 to 1969
- 8,6641950 to 1959
- 5,1201940 to 1949
- 17,8201939 or earlier
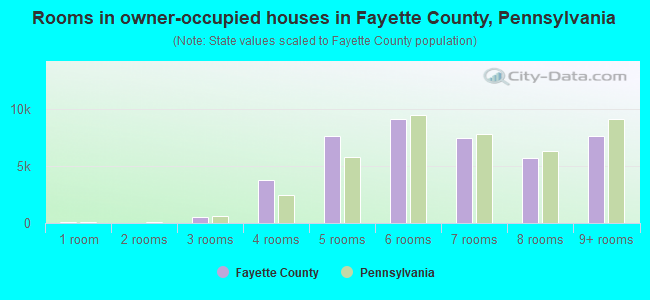
- Rooms in owner-occupied houses in Fayette County, Pennsylvania
- 211 room
- 1382 rooms
- 9813 rooms
- 3,9134 rooms
- 7,9485 rooms
- 9,0726 rooms
- 7,5927 rooms
- 5,0308 rooms
- 6,2959+ rooms
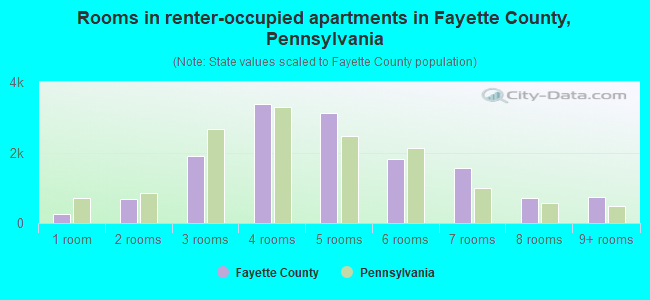
- Rooms in renter-occupied apartments in Fayette County, Pennsylvania
- 5781 room
- 2092 rooms
- 2,2553 rooms
- 3,0904 rooms
- 2,9115 rooms
- 2,5376 rooms
- 1,5377 rooms
- 7098 rooms
- 8419+ rooms
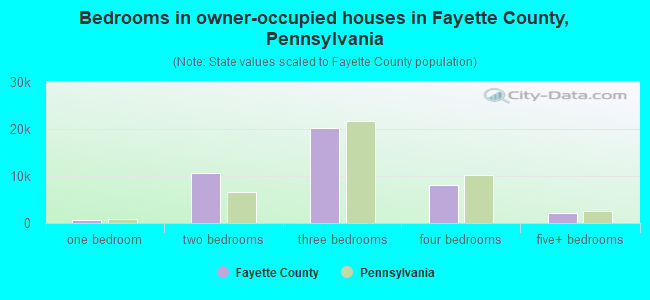
- Bedrooms in owner-occupied houses in Fayette County, Pennsylvania
- 159no bedroom
- 9041 bedroom
- 10,7172 bedrooms
- 21,2623 bedrooms
- 6,4744 bedrooms
- 1,4745+ bedrooms
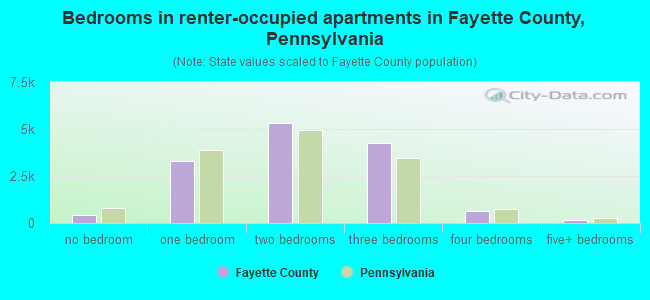
- Bedrooms in renter-occupied apartments in Fayette County, Pennsylvania
- 578no bedroom
- 3,2331 bedroom
- 4,8702 bedrooms
- 4,7583 bedrooms
- 1,1074 bedrooms
- 1215+ bedrooms
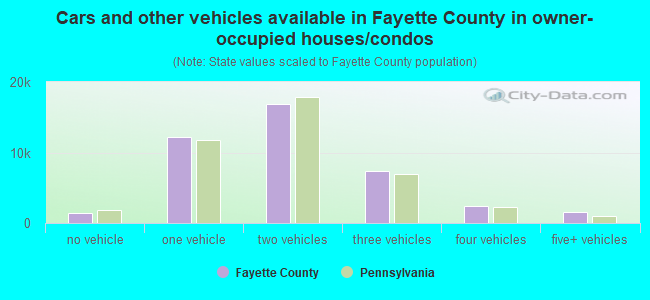
- Cars and other vehicles available in Fayette County in owner-occupied houses/condos
- 2,064no vehicle
- 12,0371 vehicle
- 15,8572 vehicles
- 6,5003 vehicles
- 2,9174 vehicles
- 1,6155+ vehicles
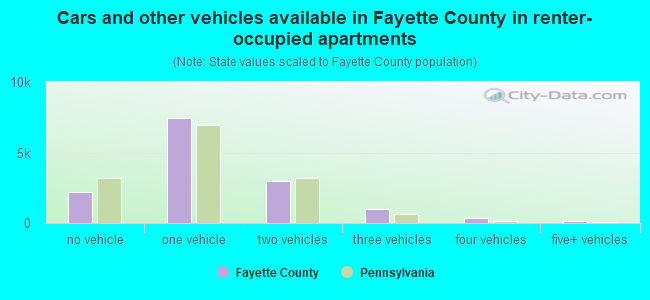
- Cars and other vehicles available in Fayette County in renter-occupied apartments
- 3,489no vehicle
- 6,0881 vehicle
- 4,2672 vehicles
- 7133 vehicles
- 74 vehicles
- 1035+ vehicles
92.2% of Fayette County residents lived in the same house 1 years ago.
Out of people who lived in different houses, 39% lived in this county.
Out of people who lived in different counties, 62% lived in Pennsylvania.
| Fayette County: | 92.2% |
| State average: | 89.3% |
Place of birth for U.S.-born residents:
- This state: 101,908
- Other state: 21,931
- Northeast: 3,737
- Midwest: 5,051
- South: 11,240
- West: 1,903
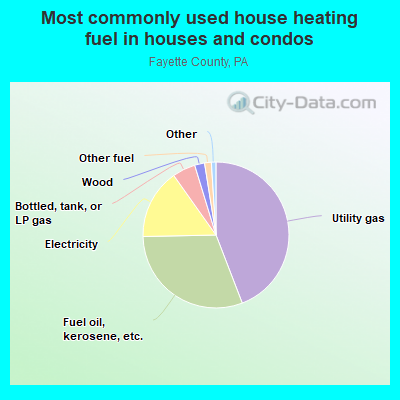
- 44.8%Utility gas
- 27.3%Fuel oil, kerosene, etc.
- 16.7%Electricity
- 6.1%Bottled, tank, or LP gas
- 4.0%Wood
- 0.6%Other fuel
- 0.3%No fuel used
- 0.2%Coal or coke
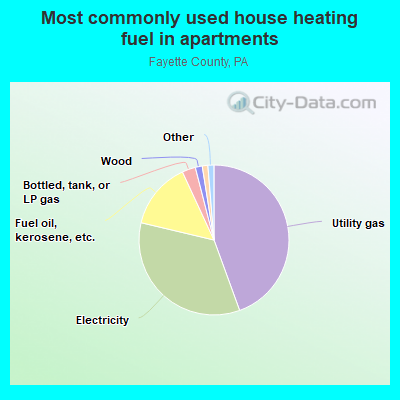
- 47.6%Utility gas
- 30.6%Electricity
- 14.9%Fuel oil, kerosene, etc.
- 4.6%Bottled, tank, or LP gas
- 1.3%No fuel used
- 0.5%Other fuel
- 0.4%Wood
Private vs. public school enrollment:
| Here: | 13.0% |
| Pennsylvania: | 15.7% |
| Here: | 2.4% |
| Pennsylvania: | 13.4% |
| Here: | 22.4% |
| Pennsylvania: | 39.8% |
Fayette County government finances - Expenditure in 2018:
- Charges - Other: $9,271,000
Other: $8,766,000
- Construction - Housing and Community Development: $5,076,000
- Current Operations - Public Welfare, Vendor Payments for Medical Care: $44,166,000
Public Welfare, Vendor Payments for Medical Care: $35,098,000
Health - Other: $19,745,000
Health - Other: $14,045,000
Public Welfare - Other: $13,215,000
Public Welfare - Other: $12,385,000
Judicial and Legal Services: $10,656,000
Judicial and Legal Services: $9,595,000
Correctional Institutions: $8,421,000
Correctional Institutions: $7,760,000
Transit Utilities: $6,676,000
Transit Utilities: $5,779,000
Natural Resources - Other: $5,729,000
Corrections - Other: $5,251,000
Central Staff Services: $5,236,000
Central Staff Services: $4,362,000
Financial Administration: $2,796,000
Financial Administration: $2,447,000
General - Other: $1,917,000
Housing and Community Development: $1,516,000
Corrections - Other: $1,296,000
General Public Buildings: $951,000
General Public Buildings: $930,000
Police Protection: $927,000
Police Protection: $911,000
General - Other: $548,000
Parks and Recreation: $468,000
Regular Highways: $128,000
Parks and Recreation: $88,000
Regular Highways: $63,000
- Federal Intergovernmental - Other: $5,554,000
Other: $4,413,000
Housing and Community Development: $3,868,000
Public Welfare: $3,696,000
Public Welfare: $3,656,000
Transit Utilities: $3,139,000
Transit Utilities: $2,733,000
General Local Government Support: $894,000
Health and Hospitals: $818,000
Health and Hospitals: $783,000
General Local Government Support: $190,000
- General - Interest on Debt: $1,387,000
Interest on Debt: $690,000
- Local Intergovernmental - Housing and Community Development: $1,736,000
Other: $404,000
Other: $65,000
- Long Term Debt - Beginning Outstanding - Unspecified Public Purpose: $20,140,000
Outstanding Unspecified Public Purpose: $19,053,000
Beginning Outstanding - Unspecified Public Purpose: $15,725,000
Outstanding Unspecified Public Purpose: $15,141,000
Retired Unspecified Public Purpose: $2,235,000
Issue, Unspecified Public Purpose: $1,148,000
Retired Unspecified Public Purpose: $584,000
- Miscellaneous - Special Assessments: $920,000
Interest Earnings: $697,000
Interest Earnings: $491,000
Fines and Forfeits: $433,000
Sale of Property: $357,000
General Revenue - Other: $93,000
- Other Capital Outlay - Health - Other: $1,137,000
Central Staff Services: $746,000
General - Other: $730,000
Regular Highways: $428,000
Central Staff Services: $366,000
General - Other: $166,000
Judicial and Legal Services: $105,000
Health - Other: $17,000
Judicial and Legal Services: $17,000
- Other Funds - Cash and Securities: $24,244,000
Cash and Securities: $11,845,000
- Revenue - Transit Utilities: $474,000
Transit Utilities: $298,000
- Sinking Funds - Cash and Securities: $14,748,000
Cash and Securities: $12,569,000
- State Intergovernmental - Public Welfare: $49,715,000
Public Welfare: $41,581,000
Health and Hospitals: $18,485,000
Health and Hospitals: $12,203,000
Other: $4,854,000
Other: $3,517,000
Transit Utilities: $3,393,000
Transit Utilities: $2,969,000
General Local Government Support: $2,968,000
General Local Government Support: $1,374,000
- Tax - Property: $26,715,000
Property: $21,946,000
Other Selective Sales: $2,227,000
Other Selective Sales: $1,023,000
Other License: $30,000
Other License: $26,000
- Total Salaries and Wages: $30,589,000
: $22,455,000
Fayette County government finances - Revenue in 2018:
- Charges - Other: $9,271,000
Other: $8,766,000
- Construction - Housing and Community Development: $5,076,000
- Current Operations - Public Welfare, Vendor Payments for Medical Care: $44,166,000
Public Welfare, Vendor Payments for Medical Care: $35,098,000
Health - Other: $19,745,000
Health - Other: $14,045,000
Public Welfare - Other: $13,215,000
Public Welfare - Other: $12,385,000
Judicial and Legal Services: $10,656,000
Judicial and Legal Services: $9,595,000
Correctional Institutions: $8,421,000
Correctional Institutions: $7,760,000
Transit Utilities: $6,676,000
Transit Utilities: $5,779,000
Natural Resources - Other: $5,729,000
Corrections - Other: $5,251,000
Central Staff Services: $5,236,000
Central Staff Services: $4,362,000
Financial Administration: $2,796,000
Financial Administration: $2,447,000
General - Other: $1,917,000
Housing and Community Development: $1,516,000
Corrections - Other: $1,296,000
General Public Buildings: $951,000
General Public Buildings: $930,000
Police Protection: $927,000
Police Protection: $911,000
General - Other: $548,000
Parks and Recreation: $468,000
Regular Highways: $128,000
Parks and Recreation: $88,000
Regular Highways: $63,000
- Federal Intergovernmental - Other: $5,554,000
Other: $4,413,000
Housing and Community Development: $3,868,000
Public Welfare: $3,696,000
Public Welfare: $3,656,000
Transit Utilities: $3,139,000
Transit Utilities: $2,733,000
General Local Government Support: $894,000
Health and Hospitals: $818,000
Health and Hospitals: $783,000
General Local Government Support: $190,000
- General - Interest on Debt: $1,387,000
Interest on Debt: $690,000
- Local Intergovernmental - Housing and Community Development: $1,736,000
Other: $404,000
Other: $65,000
- Long Term Debt - Beginning Outstanding - Unspecified Public Purpose: $20,140,000
Outstanding Unspecified Public Purpose: $19,053,000
Beginning Outstanding - Unspecified Public Purpose: $15,725,000
Outstanding Unspecified Public Purpose: $15,141,000
Retired Unspecified Public Purpose: $2,235,000
Issue, Unspecified Public Purpose: $1,148,000
Retired Unspecified Public Purpose: $584,000
- Miscellaneous - Special Assessments: $920,000
Interest Earnings: $697,000
Interest Earnings: $491,000
Fines and Forfeits: $433,000
Sale of Property: $357,000
General Revenue - Other: $93,000
- Other Capital Outlay - Health - Other: $1,137,000
Central Staff Services: $746,000
General - Other: $730,000
Regular Highways: $428,000
Central Staff Services: $366,000
General - Other: $166,000
Judicial and Legal Services: $105,000
Health - Other: $17,000
Judicial and Legal Services: $17,000
- Other Funds - Cash and Securities: $24,244,000
Cash and Securities: $11,845,000
- Revenue - Transit Utilities: $474,000
Transit Utilities: $298,000
- Sinking Funds - Cash and Securities: $14,748,000
Cash and Securities: $12,569,000
- State Intergovernmental - Public Welfare: $49,715,000
Public Welfare: $41,581,000
Health and Hospitals: $18,485,000
Health and Hospitals: $12,203,000
Other: $4,854,000
Other: $3,517,000
Transit Utilities: $3,393,000
Transit Utilities: $2,969,000
General Local Government Support: $2,968,000
General Local Government Support: $1,374,000
- Tax - Property: $26,715,000
Property: $21,946,000
Other Selective Sales: $2,227,000
Other Selective Sales: $1,023,000
Other License: $30,000
Other License: $26,000
- Total Salaries and Wages: $30,589,000
: $22,455,000
Fayette County government finances - Debt in 2018:
- Charges - Other: $9,271,000
Other: $8,766,000
- Construction - Housing and Community Development: $5,076,000
- Current Operations - Public Welfare, Vendor Payments for Medical Care: $44,166,000
Public Welfare, Vendor Payments for Medical Care: $35,098,000
Health - Other: $19,745,000
Health - Other: $14,045,000
Public Welfare - Other: $13,215,000
Public Welfare - Other: $12,385,000
Judicial and Legal Services: $10,656,000
Judicial and Legal Services: $9,595,000
Correctional Institutions: $8,421,000
Correctional Institutions: $7,760,000
Transit Utilities: $6,676,000
Transit Utilities: $5,779,000
Natural Resources - Other: $5,729,000
Corrections - Other: $5,251,000
Central Staff Services: $5,236,000
Central Staff Services: $4,362,000
Financial Administration: $2,796,000
Financial Administration: $2,447,000
General - Other: $1,917,000
Housing and Community Development: $1,516,000
Corrections - Other: $1,296,000
General Public Buildings: $951,000
General Public Buildings: $930,000
Police Protection: $927,000
Police Protection: $911,000
General - Other: $548,000
Parks and Recreation: $468,000
Regular Highways: $128,000
Parks and Recreation: $88,000
Regular Highways: $63,000
- Federal Intergovernmental - Other: $5,554,000
Other: $4,413,000
Housing and Community Development: $3,868,000
Public Welfare: $3,696,000
Public Welfare: $3,656,000
Transit Utilities: $3,139,000
Transit Utilities: $2,733,000
General Local Government Support: $894,000
Health and Hospitals: $818,000
Health and Hospitals: $783,000
General Local Government Support: $190,000
- General - Interest on Debt: $1,387,000
Interest on Debt: $690,000
- Local Intergovernmental - Housing and Community Development: $1,736,000
Other: $404,000
Other: $65,000
- Long Term Debt - Beginning Outstanding - Unspecified Public Purpose: $20,140,000
Outstanding Unspecified Public Purpose: $19,053,000
Beginning Outstanding - Unspecified Public Purpose: $15,725,000
Outstanding Unspecified Public Purpose: $15,141,000
Retired Unspecified Public Purpose: $2,235,000
Issue, Unspecified Public Purpose: $1,148,000
Retired Unspecified Public Purpose: $584,000
- Miscellaneous - Special Assessments: $920,000
Interest Earnings: $697,000
Interest Earnings: $491,000
Fines and Forfeits: $433,000
Sale of Property: $357,000
General Revenue - Other: $93,000
- Other Capital Outlay - Health - Other: $1,137,000
Central Staff Services: $746,000
General - Other: $730,000
Regular Highways: $428,000
Central Staff Services: $366,000
General - Other: $166,000
Judicial and Legal Services: $105,000
Health - Other: $17,000
Judicial and Legal Services: $17,000
- Other Funds - Cash and Securities: $24,244,000
Cash and Securities: $11,845,000
- Revenue - Transit Utilities: $474,000
Transit Utilities: $298,000
- Sinking Funds - Cash and Securities: $14,748,000
Cash and Securities: $12,569,000
- State Intergovernmental - Public Welfare: $49,715,000
Public Welfare: $41,581,000
Health and Hospitals: $18,485,000
Health and Hospitals: $12,203,000
Other: $4,854,000
Other: $3,517,000
Transit Utilities: $3,393,000
Transit Utilities: $2,969,000
General Local Government Support: $2,968,000
General Local Government Support: $1,374,000
- Tax - Property: $26,715,000
Property: $21,946,000
Other Selective Sales: $2,227,000
Other Selective Sales: $1,023,000
Other License: $30,000
Other License: $26,000
- Total Salaries and Wages: $30,589,000
: $22,455,000
Fayette County government finances - Cash and Securities in 2018:
- Charges - Other: $9,271,000
Other: $8,766,000
- Construction - Housing and Community Development: $5,076,000
- Current Operations - Public Welfare, Vendor Payments for Medical Care: $44,166,000
Public Welfare, Vendor Payments for Medical Care: $35,098,000
Health - Other: $19,745,000
Health - Other: $14,045,000
Public Welfare - Other: $13,215,000
Public Welfare - Other: $12,385,000
Judicial and Legal Services: $10,656,000
Judicial and Legal Services: $9,595,000
Correctional Institutions: $8,421,000
Correctional Institutions: $7,760,000
Transit Utilities: $6,676,000
Transit Utilities: $5,779,000
Natural Resources - Other: $5,729,000
Corrections - Other: $5,251,000
Central Staff Services: $5,236,000
Central Staff Services: $4,362,000
Financial Administration: $2,796,000
Financial Administration: $2,447,000
General - Other: $1,917,000
Housing and Community Development: $1,516,000
Corrections - Other: $1,296,000
General Public Buildings: $951,000
General Public Buildings: $930,000
Police Protection: $927,000
Police Protection: $911,000
General - Other: $548,000
Parks and Recreation: $468,000
Regular Highways: $128,000
Parks and Recreation: $88,000
Regular Highways: $63,000
- Federal Intergovernmental - Other: $5,554,000
Other: $4,413,000
Housing and Community Development: $3,868,000
Public Welfare: $3,696,000
Public Welfare: $3,656,000
Transit Utilities: $3,139,000
Transit Utilities: $2,733,000
General Local Government Support: $894,000
Health and Hospitals: $818,000
Health and Hospitals: $783,000
General Local Government Support: $190,000
- General - Interest on Debt: $1,387,000
Interest on Debt: $690,000
- Local Intergovernmental - Housing and Community Development: $1,736,000
Other: $404,000
Other: $65,000
- Long Term Debt - Beginning Outstanding - Unspecified Public Purpose: $20,140,000
Outstanding Unspecified Public Purpose: $19,053,000
Beginning Outstanding - Unspecified Public Purpose: $15,725,000
Outstanding Unspecified Public Purpose: $15,141,000
Retired Unspecified Public Purpose: $2,235,000
Issue, Unspecified Public Purpose: $1,148,000
Retired Unspecified Public Purpose: $584,000
- Miscellaneous - Special Assessments: $920,000
Interest Earnings: $697,000
Interest Earnings: $491,000
Fines and Forfeits: $433,000
Sale of Property: $357,000
General Revenue - Other: $93,000
- Other Capital Outlay - Health - Other: $1,137,000
Central Staff Services: $746,000
General - Other: $730,000
Regular Highways: $428,000
Central Staff Services: $366,000
General - Other: $166,000
Judicial and Legal Services: $105,000
Health - Other: $17,000
Judicial and Legal Services: $17,000
- Other Funds - Cash and Securities: $24,244,000
Cash and Securities: $11,845,000
- Revenue - Transit Utilities: $474,000
Transit Utilities: $298,000
- Sinking Funds - Cash and Securities: $14,748,000
Cash and Securities: $12,569,000
- State Intergovernmental - Public Welfare: $49,715,000
Public Welfare: $41,581,000
Health and Hospitals: $18,485,000
Health and Hospitals: $12,203,000
Other: $4,854,000
Other: $3,517,000
Transit Utilities: $3,393,000
Transit Utilities: $2,969,000
General Local Government Support: $2,968,000
General Local Government Support: $1,374,000
- Tax - Property: $26,715,000
Property: $21,946,000
Other Selective Sales: $2,227,000
Other Selective Sales: $1,023,000
Other License: $30,000
Other License: $26,000
- Total Salaries and Wages: $30,589,000
: $22,455,000
Supplemental Security Income (SSI) in 2006:
- Total number of recipients: 8,694
- Number of aged recipients: 528
- Number of blind and disabled recipients: 8,166
- Number of recipients under 18: 1,386
- Number of recipients between 18 and 64: 5,894
- Number of recipients older than 64: 1,414
- Number of recipients also receiving OASDI: 2,489
- Amount of payments (thousands of dollars): 4,296
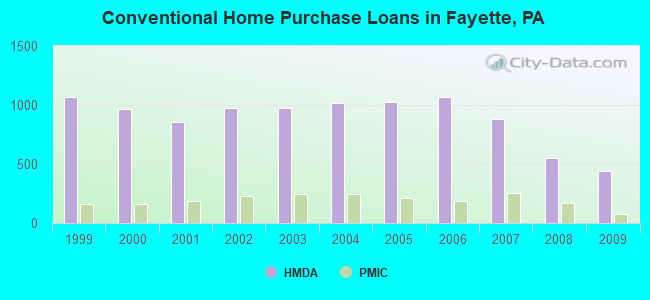
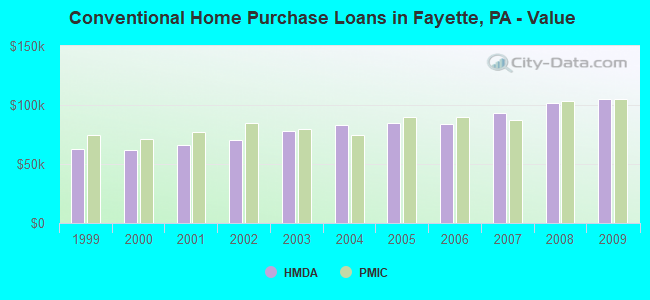
| Home Mortgage Disclosure Act Aggregated Statistics For Year 2009 (Based on 34 full tracts) | ||||||||||||||
| A) FHA, FSA/RHS & VA Home Purchase Loans | B) Conventional Home Purchase Loans | C) Refinancings | D) Home Improvement Loans | E) Loans on Dwellings For 5+ Families | F) Non-occupant Loans on < 5 Family Dwellings (A B C & D) | G) Loans On Manufactured Home Dwelling (A B C & D) | ||||||||
|---|---|---|---|---|---|---|---|---|---|---|---|---|---|---|
| Number | Average Value | Number | Average Value | Number | Average Value | Number | Average Value | Number | Average Value | Number | Average Value | Number | Average Value | |
| LOANS ORIGINATED | 299 | $91,585 | 443 | $105,251 | 1,117 | $114,086 | 413 | $32,540 | 5 | $782,800 | 157 | $106,153 | 91 | $66,341 |
| APPLICATIONS APPROVED, NOT ACCEPTED | 14 | $109,429 | 26 | $124,846 | 151 | $95,272 | 32 | $50,031 | 0 | $0 | 7 | $168,571 | 15 | $64,533 |
| APPLICATIONS DENIED | 55 | $97,691 | 119 | $68,983 | 776 | $105,655 | 305 | $27,351 | 1 | $135,000 | 81 | $86,296 | 78 | $51,051 |
| APPLICATIONS WITHDRAWN | 21 | $60,619 | 54 | $104,037 | 354 | $114,229 | 41 | $38,220 | 0 | $0 | 19 | $127,316 | 19 | $85,526 |
| FILES CLOSED FOR INCOMPLETENESS | 6 | $119,500 | 7 | $82,714 | 73 | $118,562 | 8 | $59,750 | 0 | $0 | 6 | $87,833 | 2 | $69,500 |
| Private Mortgage Insurance Companies Aggregated Statistics For Year 2009 (Based on 33 full tracts) | ||||||||
| A) Conventional Home Purchase Loans | B) Refinancings | C) Non-occupant Loans on < 5 Family Dwellings (A & B) | D) Loans On Manufactured Home Dwelling (A & B) | |||||
|---|---|---|---|---|---|---|---|---|
| Number | Average Value | Number | Average Value | Number | Average Value | Number | Average Value | |
| LOANS ORIGINATED | 80 | $105,150 | 21 | $176,714 | 0 | $0 | 0 | $0 |
| APPLICATIONS APPROVED, NOT ACCEPTED | 8 | $109,000 | 12 | $133,833 | 0 | $0 | 0 | $0 |
| APPLICATIONS DENIED | 19 | $148,421 | 6 | $140,667 | 3 | $43,000 | 1 | $180,000 |
| APPLICATIONS WITHDRAWN | 5 | $145,200 | 2 | $122,000 | 0 | $0 | 0 | $0 |
| FILES CLOSED FOR INCOMPLETENESS | 0 | $0 | 0 | $0 | 0 | $0 | 0 | $0 |
| Most common first names in Fayette County, PA among deceased individuals | ||
| Name | Count | Lived (average) |
|---|---|---|
| John | 2,463 | 74.9 years |
| Mary | 2,048 | 80.2 years |
| William | 1,313 | 73.7 years |
| Joseph | 1,264 | 74.5 years |
| James | 1,126 | 72.6 years |
| Anna | 1,059 | 81.9 years |
| George | 1,053 | 75.3 years |
| Charles | 1,046 | 74.3 years |
| Margaret | 863 | 79.1 years |
| Robert | 863 | 70.0 years |
| Most common last names in Fayette County, PA among deceased individuals | ||
| Last name | Count | Lived (average) |
|---|---|---|
| Miller | 411 | 75.9 years |
| Smith | 388 | 75.3 years |
| Wilson | 245 | 76.5 years |
| Martin | 219 | 76.4 years |
| Johnson | 200 | 74.6 years |
| Davis | 192 | 75.5 years |
| Thomas | 188 | 73.5 years |
| King | 174 | 75.2 years |
| Brown | 168 | 75.5 years |
| Williams | 157 | 76.0 years |
| Businesses in Fayette County, PA | ||||
| Name | Count | Name | Count | |
|---|---|---|---|---|
| ALDI | 1 | Little Caesars Pizza | 2 | |
| AT&T | 2 | Long John Silver's | 2 | |
| Ace Hardware | 1 | Lowe's | 1 | |
| Advance Auto Parts | 3 | Marriott | 1 | |
| Aeropostale | 1 | Martin's | 1 | |
| American Eagle Outfitters | 1 | MasterBrand Cabinets | 8 | |
| Applebee's | 1 | McDonald's | 7 | |
| Arby's | 2 | New York & Co | 1 | |
| AutoZone | 2 | Nike | 5 | |
| Bath & Body Works | 1 | Nissan | 1 | |
| Burger King | 2 | Pac Sun | 1 | |
| CVS | 2 | Panera Bread | 1 | |
| Carson Pirie Scott | 1 | Papa John's Pizza | 1 | |
| Chevrolet | 2 | Payless | 1 | |
| Circle K | 4 | PetSmart | 1 | |
| Cricket Wireless | 4 | Pizza Hut | 5 | |
| Curves | 3 | RadioShack | 3 | |
| Dairy Queen | 6 | Red Lobster | 1 | |
| Decora Cabinetry | 2 | Rite Aid | 4 | |
| Dennys | 1 | Ruby Tuesday | 1 | |
| Domino's Pizza | 2 | Rue21 | 1 | |
| FedEx | 8 | SONIC Drive-In | 1 | |
| Finish Line | 1 | Sears | 2 | |
| Foot Locker | 1 | Shoe Carnival | 1 | |
| Ford | 1 | Spencer Gifts | 1 | |
| GNC | 2 | Sprint Nextel | 1 | |
| GameStop | 2 | Staples | 1 | |
| Goodwill | 2 | Starbucks | 1 | |
| H&R Block | 6 | Subway | 12 | |
| Hilton | 1 | Super 8 | 1 | |
| Holiday Inn | 1 | T-Mobile | 4 | |
| Home Depot | 1 | Taco Bell | 1 | |
| Honda | 1 | Target | 1 | |
| Hot Topic | 1 | Toyota | 1 | |
| Hyundai | 1 | Toys"R"Us | 1 | |
| IHOP | 1 | True Value | 3 | |
| JCPenney | 1 | U-Haul | 8 | |
| Jones New York | 2 | UPS | 7 | |
| Justice | 1 | Verizon Wireless | 2 | |
| KFC | 2 | Walgreens | 1 | |
| Kmart | 1 | Walmart | 2 | |
| La-Z-Boy | 3 | Wendy's | 3 | |
| Lane Furniture | 3 | YMCA | 1 | |
Fayette County on our top lists:
- #5 on the list of "Top 101 counties with the lowest percentage of residents relocating to other counties in 2011 (pop. 50,000+)"
- #8 on the list of "Top 101 counties with the lowest percentage of residents relocating to other counties in 2011"
- #10 on the list of "Top 101 counties with the lowest percentage of residents relocating from other counties between 2010 and 2011 (pop. 50,000+)"
- #11 on the list of "Top 101 counties with the lowest percentage of residents that visited a dentist within the past year"
- #11 on the list of "Top 101 counties with the lowest percentage of residents that exercised in the past month"
- #13 on the list of "Top 101 counties with the lowest percentage of residents relocating from other counties between 2010 and 2011"
- #14 on the list of "Top 101 counties with the highest number of deaths per 1000 residents 2007-2013 (pop. 50,000+)"
- #17 on the list of "Top 101 counties with the worst general health status score of residents (1-5), 3 years of data"
- #45 on the list of "Top 101 counties with the lowest number of births per 1000 residents 2007-2013"
- #45 on the list of "Top 101 counties with the lowest number of births per 1000 residents 2007-2013 (pop 50,000+)"
- #58 on the list of "Top 101 counties with the largest increase in the number of births per 1000 residents 2000-2006 to 2007-2013 (pop 50,000+)"
- #75 on the list of "Top 101 counties with the largest increase in the number of deaths per 1000 residents 2000-2006 to 2007-2013 (pop. 50,000+)"
- #77 on the list of "Top 101 counties with the lowest ground withdrawal of fresh water for public supply (pop. 50,000+)"
- #88 on the list of "Top 101 counties with the highest percentage of residents that drank alcohol in the past 30 days"