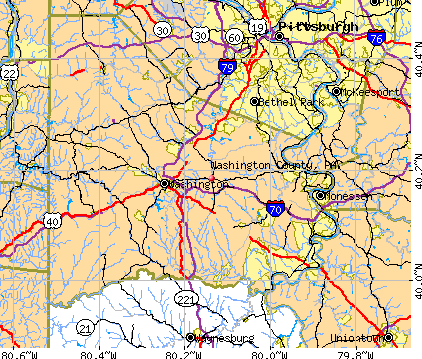
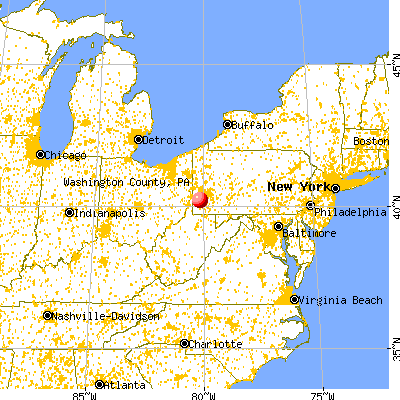
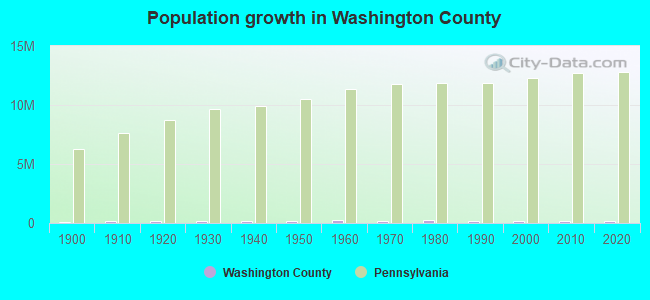
Washington County, Pennsylvania (PA)
County owner-occupied free and clear houses and condos in 2010: 25,499
County owner-occupied houses and condos in 2000: 62,570
Renter-occupied apartments: 20,548 (it was 18,560 in 2000)
| % of renters here: | 23% |
| State: | 30% |
Land area: 857 sq. mi.
Water area: 3.9 sq. mi.
Population density: 245 people per square mile (high).
Industries providing employment: Educational, health and social services (23.7%), Retail trade (12.4%), Professional, scientific, management, administrative, and waste management services (10.5%), Manufacturing (10.3%).
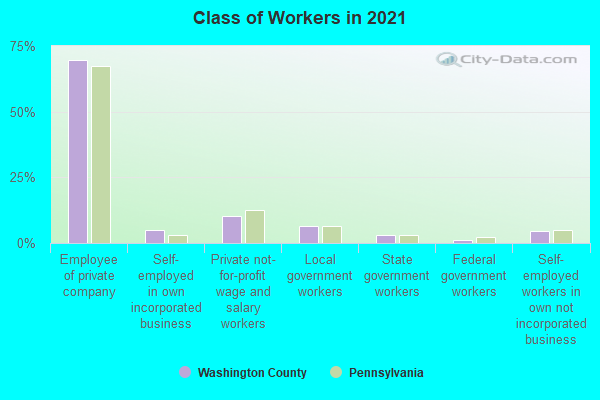
Type of workers:
- Private wage or salary: 82%
- Government: 12%
- Self-employed, not incorporated: 6%
- Unpaid family work: 0%
- OSM Map
- General Map
- Google Map
- MSN Map

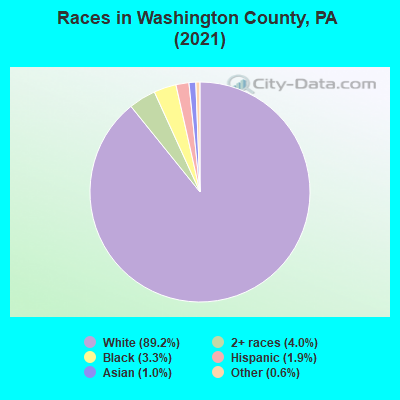
- 186,21489.5%White Non-Hispanic Alone
- 7,9473.8%Two or more races
- 6,4123.1%Black Non-Hispanic Alone
- 4,1432.0%Hispanic or Latino
- 2,5141.2%Asian alone
- 7790.4%Some other race alone
- 600.03%Native Hawaiian and Other
Pacific Islander alone
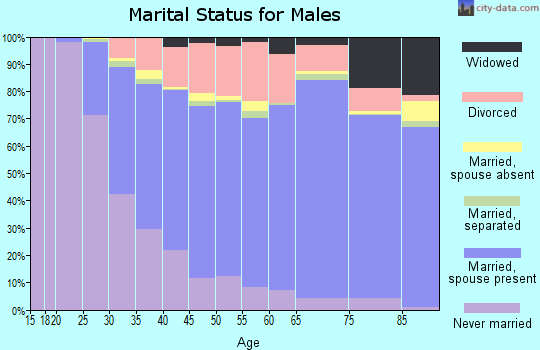
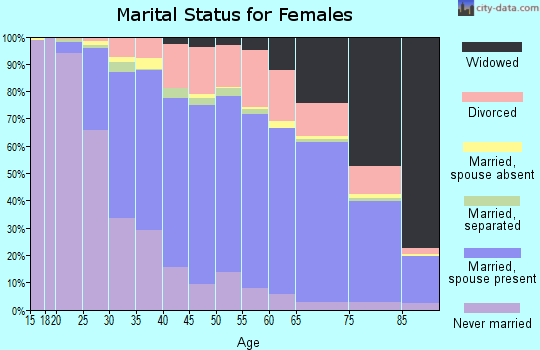
| Median resident age: | 44.4 years |
| Pennsylvania median age: | 40.9 years |
| Males: 103,921 | |
| Females: 106,462 |


| Washington County: | 2.0 people |
| Pennsylvania: | 2 people |
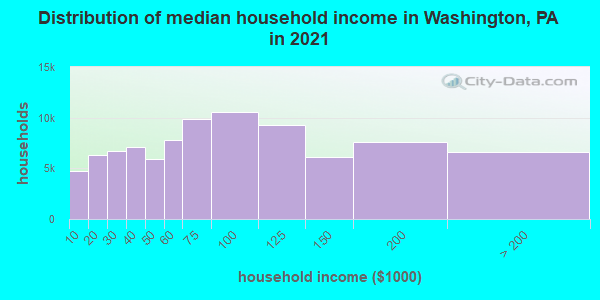
Estimated median household income in 2022: $70,303 ($37,607 in 1999)
| This county: | $70,303 |
| Pennsylvania: | $71,798 |
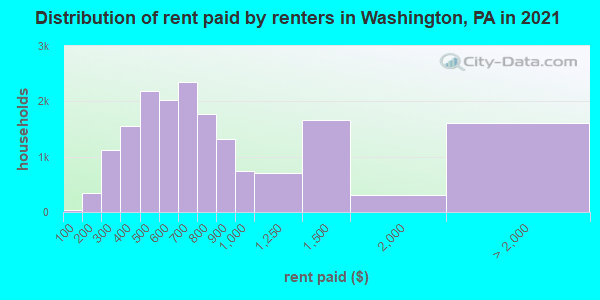
Median contract rent in 2022 for apartments: $675 (lower quartile is $505, upper quartile is $887)
| This county: | $675 |
| State: | $922 |
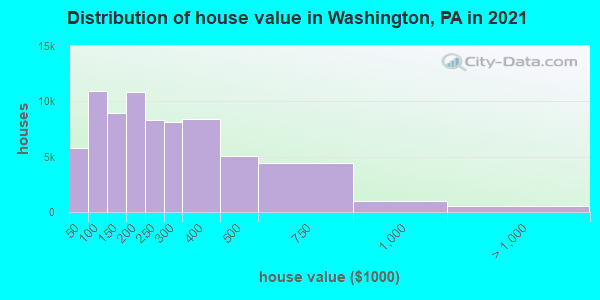
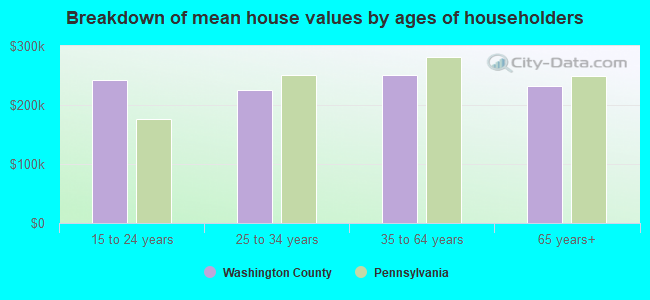
Estimated median house or condo value in 2022: $224,300 (it was $85,400 in 2000)
| Washington: | $224,300 |
| Pennsylvania: | $245,500 |
Mean price in 2022:
Median monthly housing costs for homes and condos with a mortgage: $1,544Detached houses: $274,064
Here: $274,064 State: $317,202 Townhouses or other attached units: $231,672
Here: $231,672 State: $254,369 In 2-unit structures: $130,309
Here: $130,309 State: $249,182 In 5-or-more-unit structures: $156,032
Here: $156,032 State: $320,068 Mobile homes: $67,133
Here: $67,133 State: $92,414
Median monthly housing costs for units without a mortgage: $545
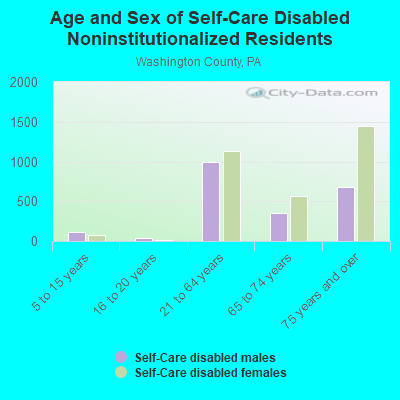
Institutionalized population: 1,558
Crime in 2020 (reported by the sheriff's office or county police, not the county total):
- Murders: 0
- Rapes: 0
- Robberies: 0
- Assaults: 2
- Burglaries: 0
- Thefts: 3
- Auto thefts: 0
Crime in 2019 (reported by the sheriff's office or county police, not the county total):
- Murders: 0
- Rapes: 0
- Robberies: 0
- Assaults: 0
- Burglaries: 0
- Thefts: 1
- Auto thefts: 0
Health of residents in Washington County based on CDC Behavioral Risk Factor Surveillance System Survey Questionnaires from 2013 to 2021:
General health status score of residents in this county from 1 (poor) to 5 (excellent) is 3.5. This is about average.74.1% of residents exercised in the past month. This is about average.
43.8% of residents smoked 100+ cigarettes in their lives. This is about average.
58.2% of adult residents drank alcohol in the past 30 days. This is less than average.
69.0% of residents visited a dentist within the past year. This is about average.
Average weight of males is 201 pounds. This is more than average.
Average weight of females is 162 pounds. This is about average.
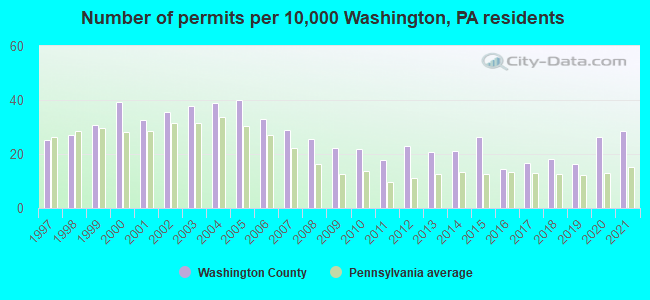
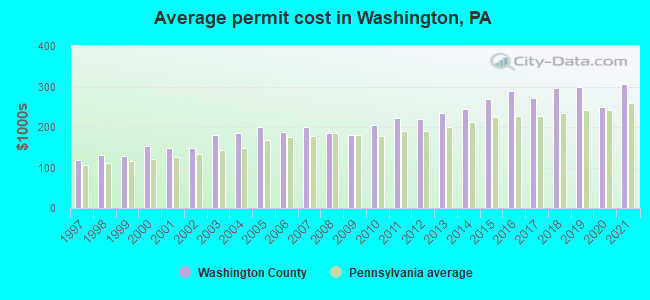
Single-family new house construction building permits:
- 2022: 432 buildings, average cost: $333,100
- 2021: 578 buildings, average cost: $306,200
- 2020: 534 buildings, average cost: $249,000
- 2019: 330 buildings, average cost: $299,400
- 2018: 371 buildings, average cost: $296,000
- 2017: 337 buildings, average cost: $271,600
- 2016: 292 buildings, average cost: $290,100
- 2015: 537 buildings, average cost: $269,000
- 2014: 426 buildings, average cost: $244,100
- 2013: 418 buildings, average cost: $235,400
- 2012: 468 buildings, average cost: $219,800
- 2011: 359 buildings, average cost: $220,900
- 2010: 442 buildings, average cost: $204,500
- 2009: 451 buildings, average cost: $180,100
- 2008: 517 buildings, average cost: $185,800
- 2007: 586 buildings, average cost: $198,900
- 2006: 672 buildings, average cost: $188,100
- 2005: 808 buildings, average cost: $199,500
- 2004: 792 buildings, average cost: $184,400
- 2003: 769 buildings, average cost: $179,700
- 2002: 723 buildings, average cost: $149,400
- 2001: 664 buildings, average cost: $147,600
- 2000: 794 buildings, average cost: $153,500
- 1999: 622 buildings, average cost: $128,500
- 1998: 545 buildings, average cost: $130,700
- 1997: 513 buildings, average cost: $118,600
Median real estate property taxes paid for housing units with mortgages in 2022: $2,679 (1.1%)
Median real estate property taxes paid for housing units with no mortgage in 2022: $1,833 (1.0%)
| Washington County: | 12.1% |
| Pennsylvania: | 11.8% |
Median age of residents in 2022: 44.4 years old
(Males: 42.9 years old, Females: 45.7 years old)
(Median age for: White residents: 45.9 years old, Black residents: 44.4 years old, American Indian residents: 22.6 years old, Asian residents: 34.7 years old, Hispanic or Latino residents: 28.0 years old, Other race residents: 35.2 years old)
Area name: Pittsburgh, PA HUD Metro FMR Area
Fair market rent in 2006 for a 1-bedroom apartment in Washington County is $601 a month.
Fair market rent for a 2-bedroom apartment is $719 a month.
Fair market rent for a 3-bedroom apartment is $894 a month.
Cities in this county include: Washington, Canonsburg, Donora, California, Charleroi, Monongahela, McMurray, Thompsonville, Centerville, Gastonville.
2023 air pollution in Washington County:
Nitrogen Dioxide: 0.01 ppm (standard limit: 0.053 ppm). Above U.S. average.
Ozone (1-hour): 0.034 ppm (standard limit: 0.12 ppm). Near U.S. average.
Particulate Matter (PM2.5) Annual: 13.8 µg/m3(standard limit: 15.0 µg/m3). Above U.S. average.
Sulfur Oxides Annual: 0.001 ppm (standard limit: 0.03 ppm). Near U.S. average.
Neighboring counties: Butte County, California  , Carroll County, Indiana , Delaware County, Indiana , Howard County, Indiana , Union County, Ohio .
| Here: | 2.9% |
| Pennsylvania: | 2.9% |
Current college students: 8,902
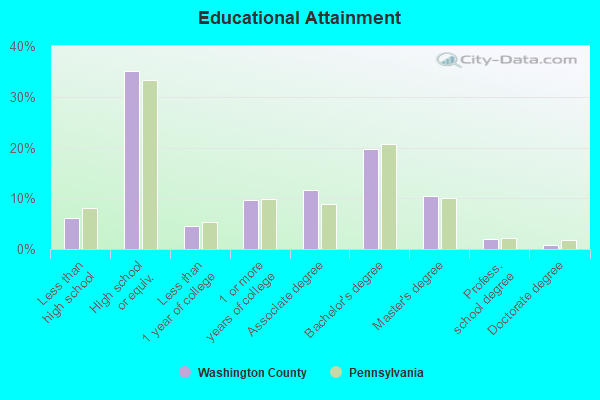
People 25 years of age or older with a high school degree or higher: 94.9%
People 25 years of age or older with a bachelor's degree or higher: 33.5%
Number of foreign born residents: 4,408 (63.8% naturalized citizens)
| Washington County: | 2.1% |
| Whole state: | 7.5% |
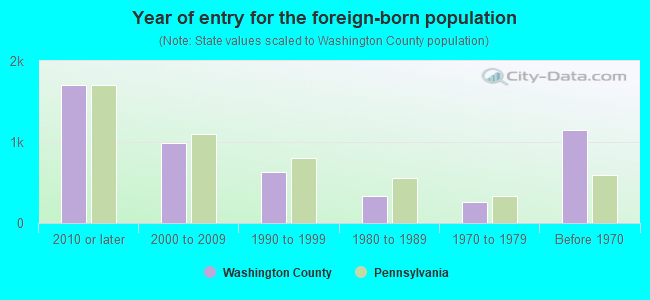
- Year of entry for the foreign-born population
- 2,0322010 or later
- 9082000 to 2009
- 6211990 to 1999
- 3391980 to 1989
- 2641970 to 1979
- 1,154Before 1970
Mean travel time to work (commute): minutes
Percentage of county residents living and working in this county: 96.2%
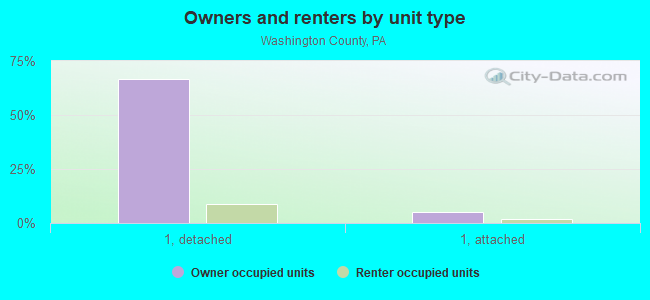
Housing units in structures:
- One, detached: 73,498
- One, attached: 7,420
- Two: 2,311
- 3 or 4: 2,407
- 5 to 9: 2,188
- 10 to 19: 1,420
- 20 to 49: 1,464
- 50 or more: 3,013
- Mobile homes: 4,325
Housing units in Washington County with a mortgage: 37,411 (4,522 second mortgage, 61 home equity loan, 3,933 both second mortgage and home equity loan)
Houses without a mortgage: 3,183
| Here: | 92.5% with mortgage |
| State: | 93.8% with mortgage |
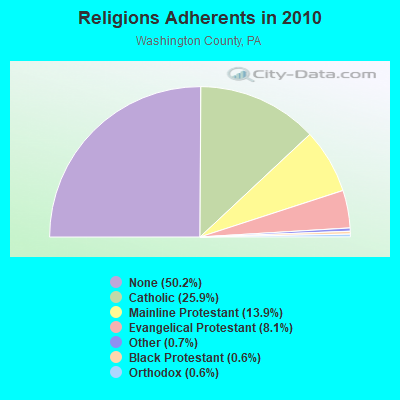
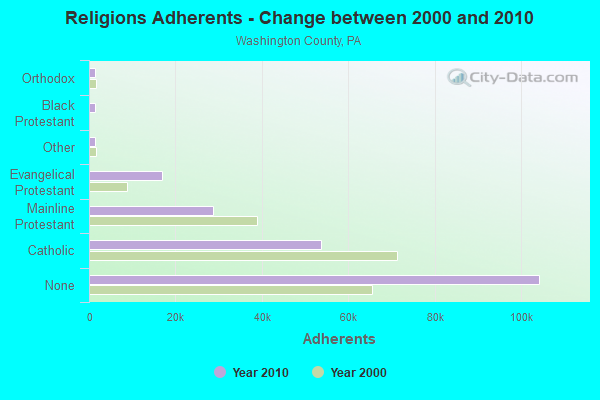
Religion statistics for Washington County
| Religion | Adherents | Congregations |
|---|---|---|
| Catholic | 53,777 | 28 |
| Mainline Protestant | 28,797 | 129 |
| Evangelical Protestant | 16,871 | 97 |
| Other | 1,459 | 8 |
| Black Protestant | 1,340 | 11 |
| Orthodox | 1,275 | 7 |
| None | 104,301 | - |
Source: Clifford Grammich, Kirk Hadaway, Richard Houseal, Dale E.Jones, Alexei Krindatch, Richie Stanley and Richard H.Taylor. 2012. 2010 U.S.Religion Census: Religious Congregations & Membership Study. Association of Statisticians of American Religious Bodies. Jones, Dale E., et al. 2002. Congregations and Membership in the United States 2000. Nashville, TN: Glenmary Research Center.
Food Environment Statistics:
| Washington County: | 1.66 / 10,000 pop. |
| State: | 2.04 / 10,000 pop. |
| Here: | 0.10 / 10,000 pop. |
| Pennsylvania: | 0.09 / 10,000 pop. |
| This county: | 0.78 / 10,000 pop. |
| Pennsylvania: | 0.88 / 10,000 pop. |
| Washington County: | 2.82 / 10,000 pop. |
| Pennsylvania: | 2.52 / 10,000 pop. |
| This county: | 5.79 / 10,000 pop. |
| State: | 7.12 / 10,000 pop. |
| Washington County: | 10.1% |
| Pennsylvania: | 9.1% |
| Washington County: | 30.9% |
| State: | 27.2% |
| Here: | 12.3% |
| State: | 11.5% |
Agriculture in Washington County:
Average size of farms: 104 acresAverage value of agricultural products sold per farm: $12,037
Average value of crops sold per acre for harvested cropland: $147.17
The value of nursery, greenhouse, floriculture, and sod as a percentage of the total market value of agricultural products sold: 18.24%
The value of livestock, poultry, and their products as a percentage of the total market value of agricultural products sold: 54.34%
Average total farm production expenses per farm: $13,205
Harvested cropland as a percentage of land in farms: 35.84%
Irrigated harvested cropland as a percentage of land in farms: 0.68%
Average market value of all machinery and equipment per farm: $35,303
The percentage of farms operated by a family or individual: 95.53%
Average age of principal farm operators: 56 years
Average number of cattle and calves per 100 acres of all land in farms: 13.49
Milk cows as a percentage of all cattle and calves: 12.34%
Corn for grain: 5004 harvested acres
All wheat for grain: 609 harvested acres
Soybeans for beans: 1278 harvested acres
Vegetables: 595 harvested acres
Land in orchards: 483 acres
Earthquake activity:
Washington County-area historical earthquake activity is significantly above Pennsylvania state average. It is 53% smaller than the overall U.S. average.On 8/23/2011 at 17:51:04, a magnitude 5.8 (5.8 MW, Depth: 3.7 mi, Class: Moderate, Intensity: VI - VII) earthquake occurred 196.7 miles away from Washington County center
On 9/25/1998 at 19:52:52, a magnitude 5.2 (4.8 MB, 4.3 MS, 5.2 LG, 4.5 MW, Depth: 3.1 mi) earthquake occurred 91.5 miles away from the county center
On 1/31/1986 at 16:46:43, a magnitude 5.0 (5.0 MB) earthquake occurred 111.8 miles away from the county center
On 7/27/1980 at 18:52:21, a magnitude 5.2 (5.1 MB, 4.7 MS, 5.0 UK, 5.2 UK) earthquake occurred 245.5 miles away from the county center
On 8/9/2020 at 12:07:37, a magnitude 5.1 (5.1 MW, Depth: 4.7 mi) earthquake occurred 261.6 miles away from Washington County center
On 12/31/2011 at 20:05:01, a magnitude 4.0 (4.0 ML, Depth: 3.1 mi, Class: Light, Intensity: IV - V) earthquake occurred 71.0 miles away from the county center
Magnitude types: regional Lg-wave magnitude (LG), body-wave magnitude (MB), local magnitude (ML), surface-wave magnitude (MS), moment magnitude (MW)
Most recent natural disasters:
- Pennsylvania Covid-19 Pandemic, Incident Period: January 20, 2020, Major Disaster (Presidential) Declared DR-4506-PA: March 30, 2020, FEMA Id: 4506, Natural disaster type: Other
- Pennsylvania Hurricane Sandy, Incident Period: October 26, 2012 to November 08, 2012, Emergency Declared EM-3356: October 29, 2012, FEMA Id: 3356, Natural disaster type: Hurricane
- Pennsylvania Hurricane Katrina Evacuation, Incident Period: August 29, 2005 to October 01, 2005, Emergency Declared EM-3235: September 10, 2005, FEMA Id: 3235, Natural disaster type: Hurricane
- Pennsylvania Tropical Depression Ivan, Incident Period: September 17, 2004 to October 01, 2004, Major Disaster (Presidential) Declared DR-1557: September 19, 2004, FEMA Id: 1557, Natural disaster type: Tropical Depression
- Pennsylvania Severe Storms and Flooding associated with Tropical Depression Frances, Incident Period: September 08, 2004 to September 09, 2004, Major Disaster (Presidential) Declared DR-1555: September 19, 2004, FEMA Id: 1555, Natural disaster type: Storm, Flood, Tropical Depression
- Pennsylvania Snowstorm, Incident Period: February 14, 2003 to February 19, 2003, Emergency Declared EM-3180: March 14, 2003, FEMA Id: 3180, Natural disaster type: Snowstorm
- Pennsylvania Flooding, Incident Period: January 19, 1996 to February 01, 1996, Major Disaster (Presidential) Declared DR-1093: January 21, 1996, FEMA Id: 1093, Natural disaster type: Flood
- Pennsylvania Blizzard, Incident Period: January 06, 1996 to January 12, 1996, Major Disaster (Presidential) Declared DR-1085: January 13, 1996, FEMA Id: 1085, Natural disaster type: Blizzard
- Pennsylvania Winter Storm, Severe Storm, Incident Period: January 04, 1994 to February 25, 1994, Major Disaster (Presidential) Declared DR-1015: March 10, 1994, FEMA Id: 1015, Natural disaster type: Winter Storm, Storm
- Pennsylvania Severe Snowfall and Winter Storm, Incident Period: March 13, 1993 to March 17, 1993, Emergency Declared EM-3105: March 16, 1993, FEMA Id: 3105, Natural disaster type: Winter Storm, Snowfall
- 3 other natural disasters have been reported since 1953.
The number of natural disasters in Washington County (13) is near the US average (15).
Major Disasters (Presidential) Declared: 8
Emergencies Declared: 5
Causes of natural disasters: Floods: 3, Storms: 3, Hurricanes: 2, Snowstorms: 2, Tropical Depressions: 2, Winter Storms: 2, Blizzard: 1, Snowfall: 1, Tropical Storm: 1, Other: 1 (Note: some incidents may be assigned to more than one category).
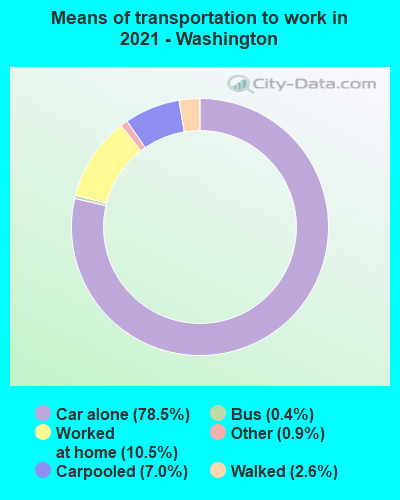
Means of transportation to work:
- Drove a car alone: 68,831 (73.5%)
- Carpooled: 5,965 (6.4%)
- Bus: 660 (0.7%)
- Ferryboat: 26 (0.0%)
- Taxicab, motorcycle, or other means: 1,356 (1.4%)
- Walked: 2,270 (2.4%)
- Worked at home: 14,542 (15.5%)
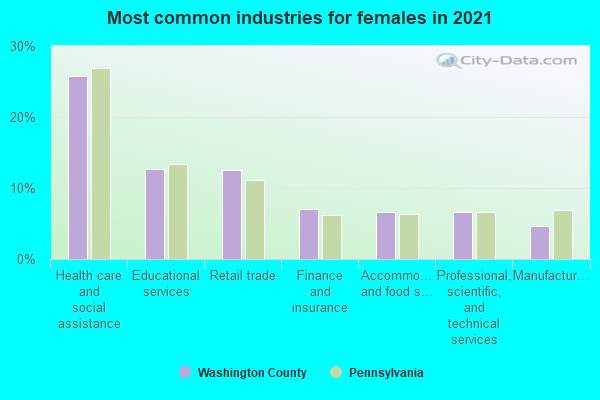
- Health care and social assistance (25%)
- Retail trade (10%)
- Educational services (10%)
- Professional, scientific, and technical services (7%)
- Accommodation and food services (7%)
- Other services, except public administration (6%)
- Finance and insurance (5%)
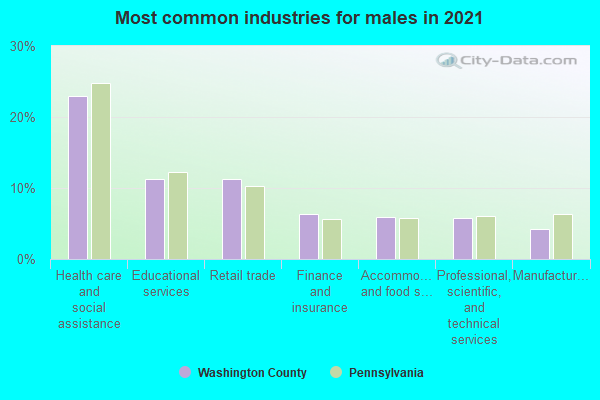
- Health care and social assistance (27%)
- Retail trade (12%)
- Educational services (11%)
- Professional, scientific, and technical services (7%)
- Accommodation and food services (7%)
- Other services, except public administration (7%)
- Finance and insurance (5%)
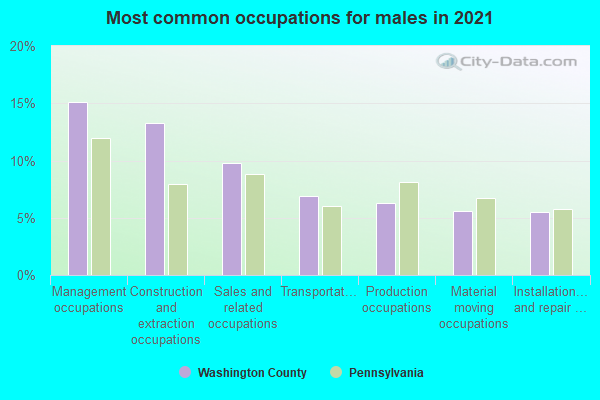
- Management occupations (18%)
- Construction and extraction occupations (11%)
- Sales and related occupations (10%)
- Production occupations (7%)
- Transportation occupations (6%)
- Installation, maintenance, and repair occupations (5%)
- Computer and mathematical occupations (5%)
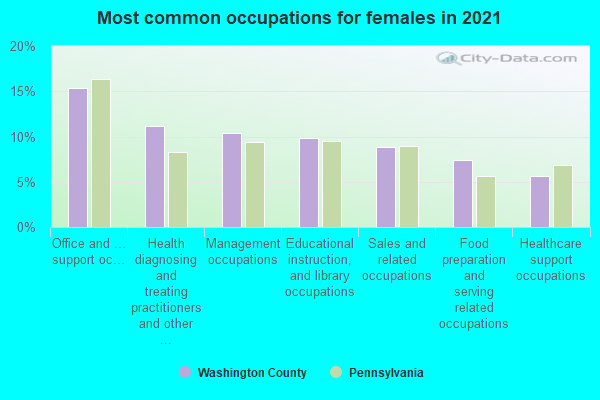
- Office and administrative support occupations (15%)
- Management occupations (11%)
- Health diagnosing and treating practitioners and other technical occupations (9%)
- Educational instruction, and library occupations (9%)
- Sales and related occupations (8%)
- Food preparation and serving related occupations (7%)
- Healthcare support occupations (6%)
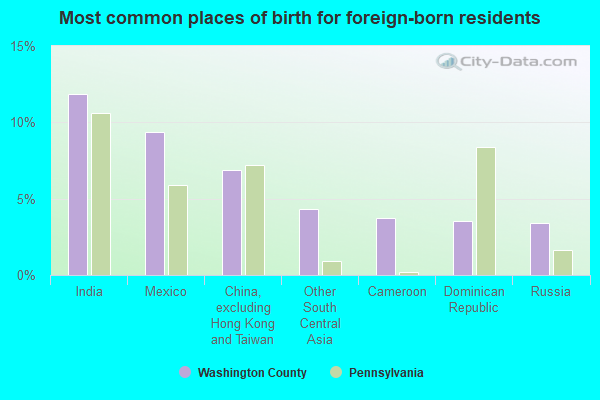
- India (11%)
- Mexico (11%)
- China, excluding Hong Kong and Taiwan (6%)
- Pakistan (4%)
- El Salvador (3%)
- Vietnam (3%)
- Russia (3%)
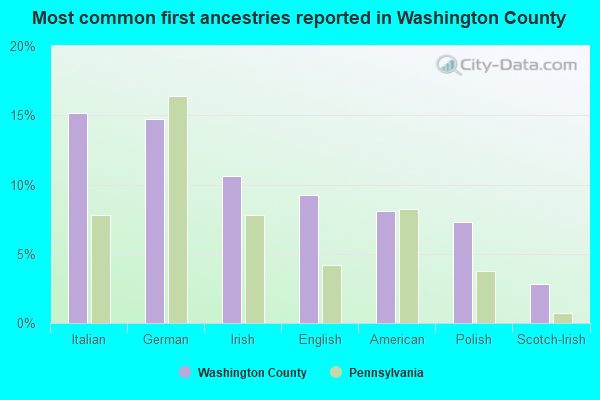
- Italian (16%)
- German (14%)
- Irish (11%)
- English (10%)
- American (8%)
- Polish (7%)
- Scotch-Irish (3%)
People in group quarters in Washington County, Pennsylvania in 2010:
- 3,536 people in college/university student housing
- 1,149 people in nursing facilities/skilled-nursing facilities
- 423 people in group homes intended for adults
- 355 people in local jails and other municipal confinement facilities
- 129 people in other noninstitutional facilities
- 111 people in emergency and transitional shelters (with sleeping facilities) for people experiencing homelessness
- 87 people in residential treatment centers for adults
- 81 people in workers' group living quarters and job corps centers
- 32 people in residential treatment centers for juveniles (non-correctional)
- 22 people in group homes for juveniles (non-correctional)
People in group quarters in Washington County, Pennsylvania in 2000:
- 2,045 people in college dormitories (includes college quarters off campus)
- 1,556 people in nursing homes
- 868 people in other noninstitutional group quarters
- 225 people in local jails and other confinement facilities (including police lockups)
- 173 people in homes for the mentally retarded
- 76 people in homes for the mentally ill
- 75 people in other group homes
- 66 people in mental (psychiatric) hospitals or wards
- 57 people in schools, hospitals, or wards for the intellectually disabled
- 47 people in religious group quarters
- 44 people in hospitals or wards for drug/alcohol abuse
- 30 people in other nonhousehold living situations
- 28 people in hospitals/wards and hospices for chronically ill
- 28 people in hospices or homes for chronically ill
- 27 people in homes or halfway houses for drug/alcohol abuse
- 14 people in training schools for juvenile delinquents
- 6 people in agriculture workers' dormitories on farms
- 4 people in unknown juvenile institutions
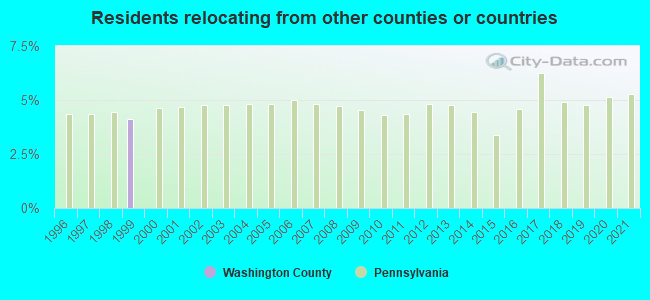
10 or fewer of this county's residents relocated from other counties between 2020 and 2021.1,000 average adjusted gross income)
10 or fewer of this county's residents moved from foreign countries.
10 or fewer of this county's residents relocated from other counties in Pennsylvania.
10 or fewer of this county's residents relocated from other states.
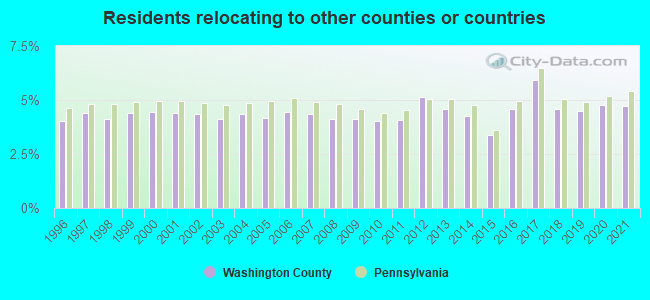
4.74% of this county's 2020 resident taxpayers moved to other counties in 2021 ($69,531 average adjusted gross income)
| Here: | 4.74% |
| Pennsylvania average: | 5.44% |
10 or fewer of this county's residents moved to foreign countries.
2.80% relocated to other counties in Pennsylvania ($34,975 average AGI)
1.94% relocated to other states ($34,556 average AGI)
Washington County: 1.94% Pennsylvania average: 2.47%
Top counties to which taxpayers relocated from this county between 2020 and 2021:
| to Allegheny County, PA | |
| to Westmoreland County, PA | |
| to Fayette County, PA | |
| to Greene County, PA | |
| to Beaver County, PA | |
| to Butler County, PA | |
| to Ohio County, WV |
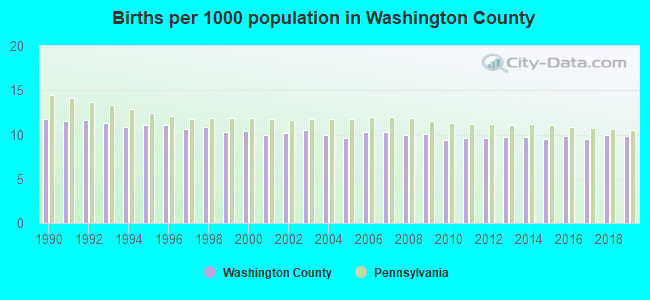
Births per 1000 population from 1990 to 1999: 11.1
Births per 1000 population from 2000 to 2009: 10.1
Births per 1000 population from 2010 to 2022: 8.1
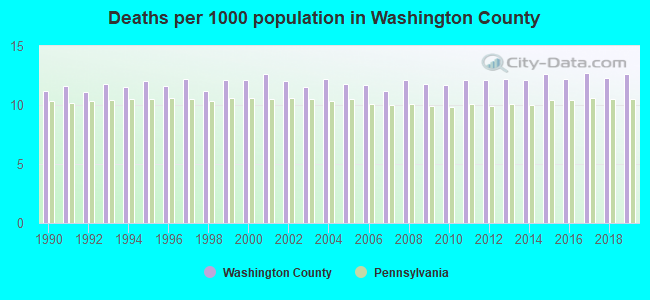
Deaths per 1000 population from 1990 to 1999: 11.6
Deaths per 1000 population from 2000 to 2009: 11.9
Deaths per 1000 population from 2010 to 2020: 12.4
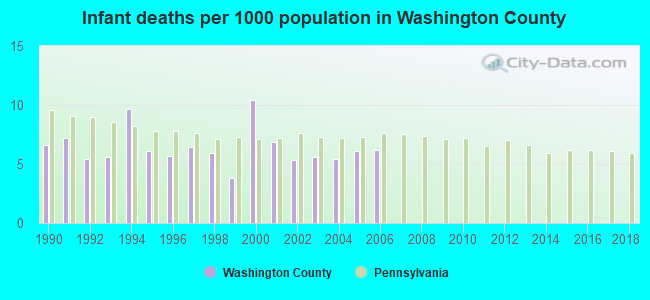
Infant deaths per 1000 live births from 1990 to 1999: 6.2
Infant deaths per 1000 live births from 2000 to 2006: 6.6
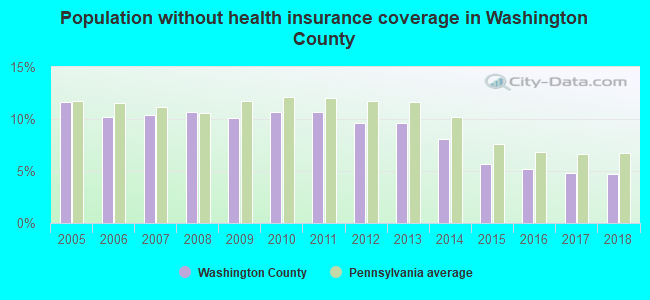
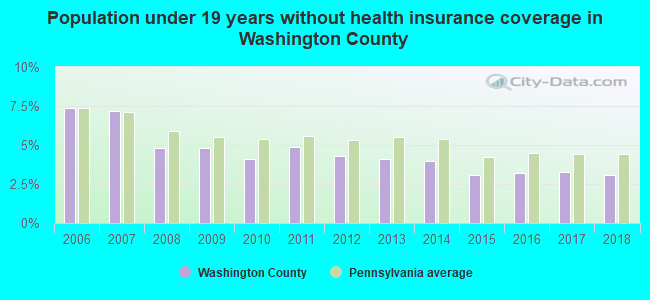
Persons under 19 years old without health insurance coverage in 2018: 3.1%
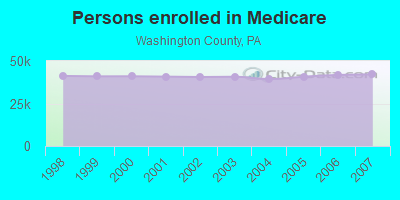
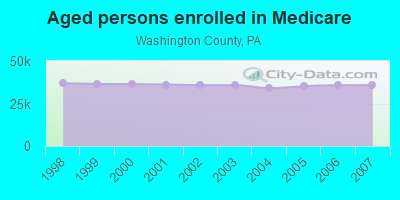
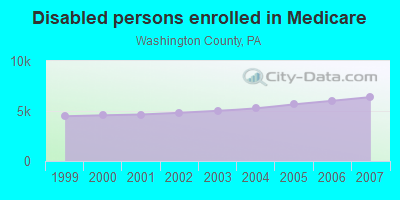
Persons enrolled in hospital insurance and/or supplemental medical insurance (Medicare) in July 1, 2007: 42,176 (35,783 aged, 6,393 disabled)
Children under 18 without health insurance coverage in 2007: 2,348 (5%)
Most common underlying causes of death in Washington County, Pennsylvania in 1999 - 2019:
- Atherosclerotic heart disease (4,829)
- Bronchus or lung, unspecified - Malignant neoplasms (3,356)
- Acute myocardial infarction, unspecified (2,488)
- Chronic obstructive pulmonary disease, unspecified (2,155)
- Unspecified dementia (2,016)
- Other ill-defined and unspecified causes of mortality (1,973)
- Alzheimer disease, unspecified (1,563)
- Stroke, not specified as haemorrhage or infarction (1,528)
- Congestive heart failure (1,224)
- Pneumonia, unspecified (965)
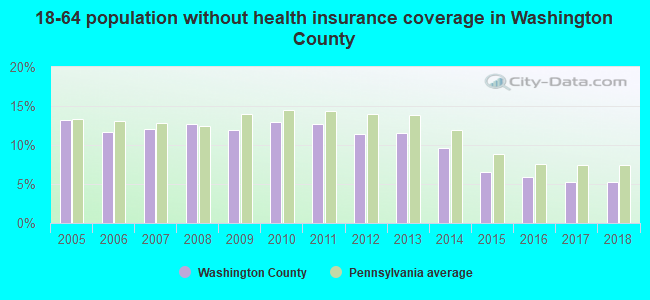
Population without health insurance coverage in 2000: 7%
Children under 18 without health insurance coverage in 2000: 5%
Short term general hospital admissions per 100,000 population in 2004: 14,926
Short term general hospital beds per 100,000 population in 2004: 302
Emergency room visits per 100,000 population in 2004: 44,392
General practice office based MDs per 100,000 population in 2005: 995
Medical specialist MDs per 100,000 population in 2005: 1,252
Dentists per 100,000 population in 1998: 12
Total births per 100,000 population, July 2005 - July 2006 : 47
Total deaths per 100,000 population, July 2005 - July 2006: 82
Limited-service eating places per 100,000 population in 2005 : 12
Beer, wine & liquor stores per 100,000 population in 2005: 1
Homicides per 1,000,000 population from 2000 to 2006: 18.2. This is less than state average.
Suicides per 1,000,000 population from 2000 to 2006: 112.2. This is more than state average.
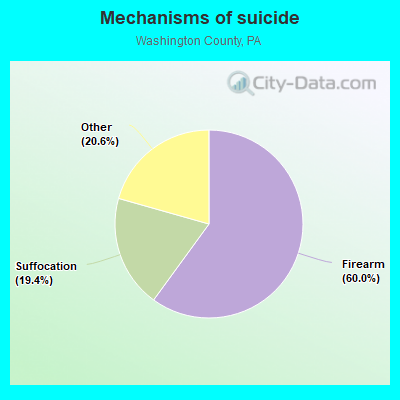
- Firearm - 67.3
- Suffocation - 21.7
- Other - 23.1
Household type by relationship:
Households: 210,383- Male householders: 45,001 (12,137 living alone), Female householders: 44,734 (15,960 living alone)
43,472 spouses (43,197 opposite-sex spouses), 6,437 unmarried partners, (6,316 opposite-sex unmarried partners), 55,260 children (53,117 natural, 673 adopted, 1,470 stepchildren), 3,419 grandchildren, 1,145 brothers or sisters, 944 parents, 34 foster children, 1,630 other relatives, 2,873 non-relatives
- In group quarters: 5,434
Size of family households: 28,327 2-persons, 12,468 3-persons, 8,091 4-persons, 5,010 5-persons, 736 6-persons, 635 7-or-more-persons.
Size of nonfamily households: 28,097 1-person, 5,908 2-persons, 204 3-persons, 259 4-persons.
28,509 married couples with children.
8,799 single-parent households (1,710 men, 7,089 women).
96.5% of residents of Washington speak English at home.
1.3% of residents speak Spanish at home (60% speak English very well, 22% speak English well, 11% speak English not well, 7% don't speak English at all).
1.2% of residents speak other Indo-European language at home (78% speak English very well, 14% speak English well, 8% speak English not well).
0.5% of residents speak Asian or Pacific Island language at home (58% speak English very well, 18% speak English well, 18% speak English not well, 6% don't speak English at all).
0.2% of residents speak other language at home (84% speak English very well, 5% speak English well, 11% speak English not well).
In fiscal year 2004:
Federal Government expenditure: $1,351,917,000 ($6,571 per capita)
Department of Defense expenditure: $37,996,000
Federal direct payments to individuals for retirement and disability: $634,049,000
Federal other direct payments to individuals: $420,128,000
Federal direct payments not to individuals: $4,235,000
Federal grants: $219,555,000
Federal procurement contracts: $27,905,000 ($15,592,000 Department of Defense)
Federal salaries and wages: $46,045,000 ($9,726,000 Department of Defense)
Federal Government direct loans: $822,000
Federal guaranteed/insured loans: $45,803,000
Federal Government insurance: $72,233,000
Population change from April 1, 2000 to July 1, 2005:
Births: 10,985| Here: | 53 per 1000 residents |
| State: | 61 per 1000 residents |
Deaths: 12,687
| Here: | 61 per 1000 residents |
| State: | 54 per 1000 residents |
Net international migration: +317
| Here: | +2 per 1000 residents |
| State: | +8 per 1000 residents |
Net internal migration: +5,095
| Here: | |
| State: |
Total withdrawal of fresh water for public supply: 7.27 millions of gallons per day (0% from ground, 100% from surface)
| Here: | 6.8 |
| State: | 6.8 |
| Here: | 4.5 |
| State: | 4.3 |
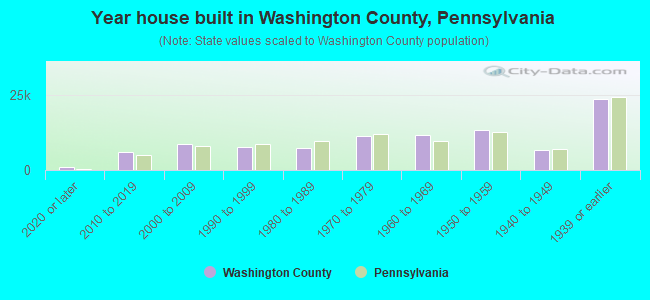
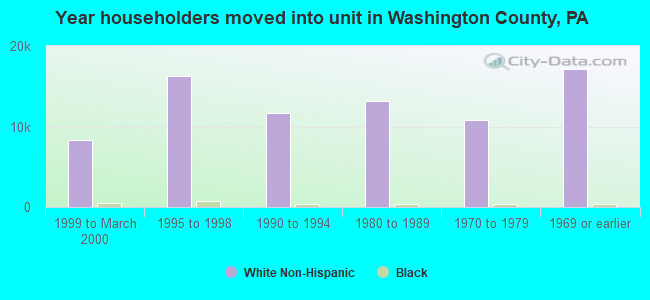
- Year house built in Washington County, Pennsylvania
- 1,3342020 or later
- 7,3022010 to 2019
- 9,0992000 to 2009
- 8,2621990 to 1999
- 9,5881980 to 1989
- 11,3041970 to 1979
- 9,4991960 to 1969
- 10,2261950 to 1959
- 6,5381940 to 1949
- 24,8941939 or earlier
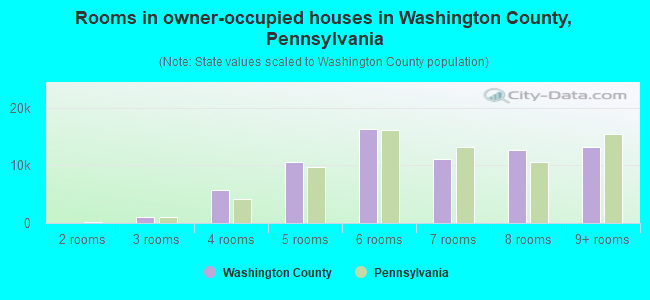
- Rooms in owner-occupied houses in Washington County, Pennsylvania
- 1811 room
- 962 rooms
- 8503 rooms
- 4,5864 rooms
- 11,7515 rooms
- 13,1326 rooms
- 11,7077 rooms
- 9,9348 rooms
- 15,4369+ rooms
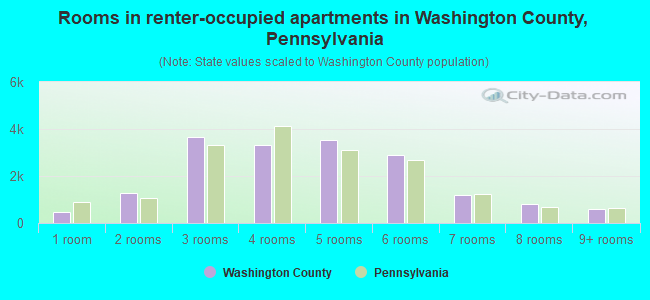
- Rooms in renter-occupied apartments in Washington County, Pennsylvania
- 1,7951 room
- 4362 rooms
- 3,9283 rooms
- 5,0824 rooms
- 4,7135 rooms
- 2,6116 rooms
- 1,4887 rooms
- 1,1338 rooms
- 8769+ rooms
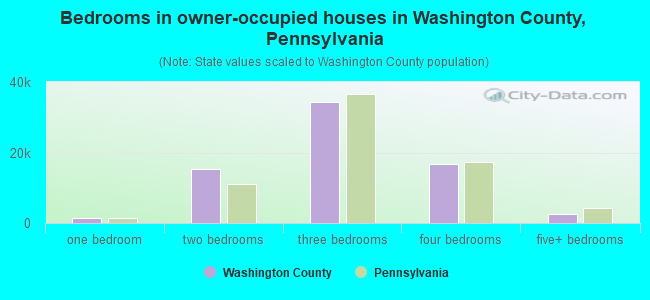
- Bedrooms in owner-occupied houses in Washington County, Pennsylvania
- 181no bedroom
- 8381 bedroom
- 14,9432 bedrooms
- 32,8493 bedrooms
- 15,6024 bedrooms
- 3,2605+ bedrooms
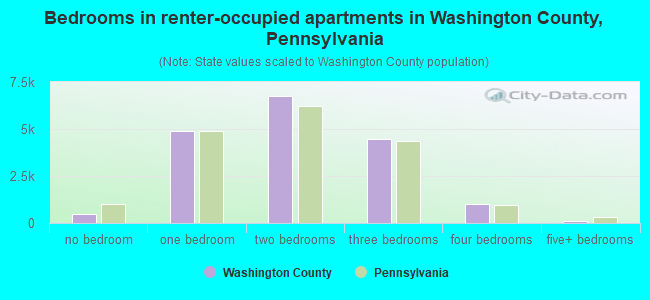
- Bedrooms in renter-occupied apartments in Washington County, Pennsylvania
- 1,871no bedroom
- 5,4481 bedroom
- 8,2432 bedrooms
- 5,1963 bedrooms
- 9234 bedrooms
- 3815+ bedrooms
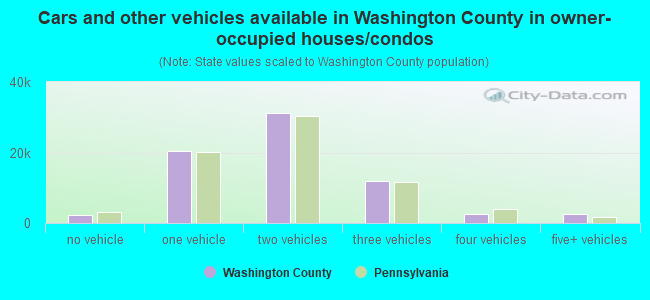
- Cars and other vehicles available in Washington County in owner-occupied houses/condos
- 2,058no vehicle
- 18,8371 vehicle
- 31,5062 vehicles
- 10,5023 vehicles
- 3,3444 vehicles
- 1,4265+ vehicles
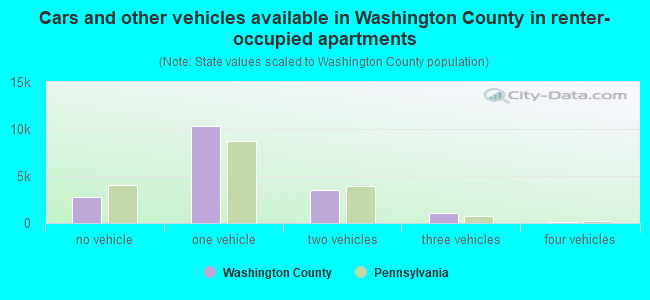
- Cars and other vehicles available in Washington County in renter-occupied apartments
- 5,144no vehicle
- 10,6641 vehicle
- 4,8712 vehicles
- 7933 vehicles
- 4314 vehicles
- 1595+ vehicles
91.3% of Washington County residents lived in the same house 1 years ago.
Out of people who lived in different houses, 34% lived in this county.
Out of people who lived in different counties, 56% lived in Pennsylvania.
| Washington County: | 91.3% |
| State average: | 89.3% |
Place of birth for U.S.-born residents:
- This state: 171,592
- Other state: 33,575
- Northeast: 4,824
- Midwest: 11,448
- South: 13,518
- West: 3,785
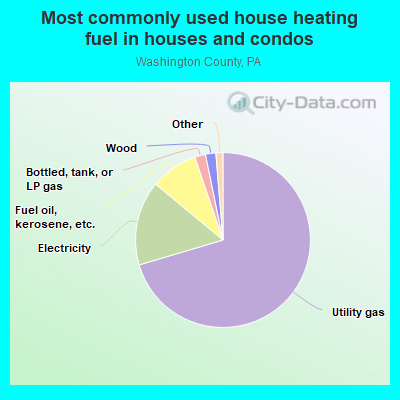
- 70.9%Utility gas
- 16.4%Electricity
- 7.5%Fuel oil, kerosene, etc.
- 2.0%Bottled, tank, or LP gas
- 1.9%Wood
- 1.0%Other fuel
- 0.2%Coal or coke
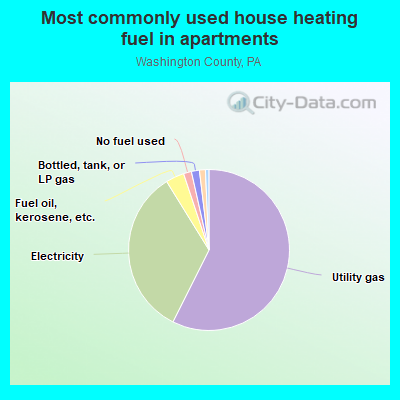
- 56.8%Utility gas
- 35.1%Electricity
- 4.9%Fuel oil, kerosene, etc.
- 1.7%Bottled, tank, or LP gas
- 1.1%No fuel used
- 0.3%Wood
- 0.1%Other fuel
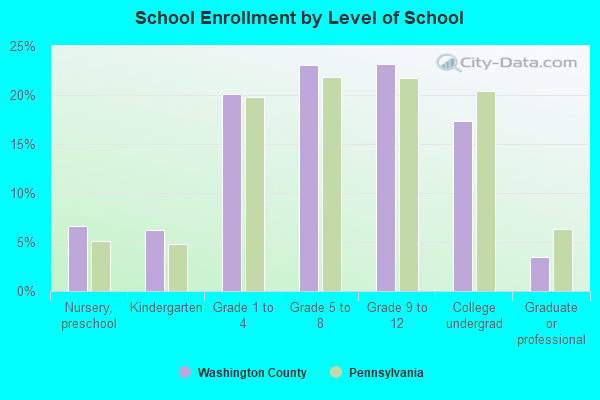
Private vs. public school enrollment:
| Here: | 12.1% |
| Pennsylvania: | 15.7% |
| Here: | 7.8% |
| Pennsylvania: | 13.4% |
| Here: | 40.8% |
| Pennsylvania: | 39.8% |
Washington County government finances - Expenditure in 2018:
- Charges - Other: $30,299,000
Other: $29,135,000
Housing and Community Development: $761,000
Housing and Community Development: $732,000
- Construction - General - Other: $1,980,000
General - Other: $1,980,000
- Current Operations - Public Welfare - Other: $41,325,000
Public Welfare - Other: $41,103,000
Public Welfare Institutions: $22,549,000
Public Welfare Institutions: $22,428,000
Judicial and Legal Services: $17,804,000
Judicial and Legal Services: $17,709,000
Housing and Community Development: $14,443,000
Housing and Community Development: $14,366,000
Health - Other: $12,352,000
Health - Other: $12,285,000
Corrections - Other: $11,004,000
Corrections - Other: $10,945,000
General - Other: $10,011,000
General - Other: $9,958,000
Correctional Institutions: $7,794,000
Correctional Institutions: $7,752,000
Central Staff Services: $7,506,000
Central Staff Services: $7,466,000
Police Protection: $4,143,000
Police Protection: $4,121,000
Financial Administration: $3,307,000
Financial Administration: $3,289,000
General Public Buildings: $1,908,000
General Public Buildings: $1,898,000
Regular Highways: $1,356,000
Regular Highways: $1,349,000
Parks and Recreation: $376,000
Parks and Recreation: $374,000
Natural Resources - Other: $335,000
Natural Resources - Other: $333,000
- Federal Intergovernmental - Public Welfare: $11,991,000
Public Welfare: $11,991,000
General Local Government Support: $6,897,000
General Local Government Support: $6,897,000
Other: $5,147,000
Other: $5,147,000
Housing and Community Development: $4,251,000
Housing and Community Development: $4,251,000
- General - Interest on Debt: $2,466,000
Interest on Debt: $2,422,000
- Local Intergovernmental - Housing and Community Development: $904,000
Housing and Community Development: $904,000
- Long Term Debt - Beginning Outstanding - Unspecified Public Purpose: $48,084,000
Outstanding Unspecified Public Purpose: $44,709,000
Beginning Outstanding - Unspecified Public Purpose: $35,734,000
Outstanding Unspecified Public Purpose: $26,759,000
Retired Unspecified Public Purpose: $8,975,000
Retired Unspecified Public Purpose: $8,975,000
Beginning Outstanding - Public Debt for Private Purpose: $6,577,000
Issue, Unspecified Public Purpose: $5,600,000
Outstanding Nonguaranteed - Industrial Revenue: $5,065,000
Beginning Outstanding - Public Debt for Private Purpose: $3,554,000
Outstanding Nonguaranteed - Industrial Revenue: $2,043,000
Retired Nonguaranteed - Public Debt for Private Purpose: $1,511,000
Retired Nonguaranteed - Public Debt for Private Purpose: $1,511,000
- Miscellaneous - Sale of Property: $32,683,000
Sale of Property: $23,378,000
General Revenue - Other: $11,661,000
General Revenue - Other: $8,341,000
Royalties: $7,138,000
Royalties: $5,106,000
Interest Earnings: $1,938,000
Interest Earnings: $1,386,000
Fines and Forfeits: $271,000
Fines and Forfeits: $194,000
- Other Capital Outlay - Central Staff Services: $1,405,000
Air Transportation: $1,023,000
Central Staff Services: $1,014,000
Regular Highways: $866,000
Air Transportation: $738,000
Regular Highways: $625,000
General - Other: $442,000
Correctional Institutions: $381,000
General - Other: $319,000
Correctional Institutions: $275,000
Judicial and Legal Services: $245,000
Public Welfare - Other: $236,000
Judicial and Legal Services: $177,000
Public Welfare - Other: $170,000
Corrections - Other: $142,000
Corrections - Other: $103,000
- Other Funds - Cash and Securities: $122,611,000
Cash and Securities: $118,336,000
- Sinking Funds - Cash and Securities: $11,580,000
- State Intergovernmental - Other: $17,432,000
Other: $17,288,000
General Local Government Support: $17,084,000
General Local Government Support: $16,942,000
Housing and Community Development: $7,348,000
Housing and Community Development: $7,287,000
Public Welfare: $4,975,000
Public Welfare: $4,933,000
- Tax - Property: $42,630,000
Property: $41,485,000
Other Selective Sales: $1,608,000
Other Selective Sales: $1,565,000
- Total Salaries and Wages: $50,867,000
: $48,617,000
Washington County government finances - Revenue in 2018:
- Charges - Other: $30,299,000
Other: $29,135,000
Housing and Community Development: $761,000
Housing and Community Development: $732,000
- Construction - General - Other: $1,980,000
General - Other: $1,980,000
- Current Operations - Public Welfare - Other: $41,325,000
Public Welfare - Other: $41,103,000
Public Welfare Institutions: $22,549,000
Public Welfare Institutions: $22,428,000
Judicial and Legal Services: $17,804,000
Judicial and Legal Services: $17,709,000
Housing and Community Development: $14,443,000
Housing and Community Development: $14,366,000
Health - Other: $12,352,000
Health - Other: $12,285,000
Corrections - Other: $11,004,000
Corrections - Other: $10,945,000
General - Other: $10,011,000
General - Other: $9,958,000
Correctional Institutions: $7,794,000
Correctional Institutions: $7,752,000
Central Staff Services: $7,506,000
Central Staff Services: $7,466,000
Police Protection: $4,143,000
Police Protection: $4,121,000
Financial Administration: $3,307,000
Financial Administration: $3,289,000
General Public Buildings: $1,908,000
General Public Buildings: $1,898,000
Regular Highways: $1,356,000
Regular Highways: $1,349,000
Parks and Recreation: $376,000
Parks and Recreation: $374,000
Natural Resources - Other: $335,000
Natural Resources - Other: $333,000
- Federal Intergovernmental - Public Welfare: $11,991,000
Public Welfare: $11,991,000
General Local Government Support: $6,897,000
General Local Government Support: $6,897,000
Other: $5,147,000
Other: $5,147,000
Housing and Community Development: $4,251,000
Housing and Community Development: $4,251,000
- General - Interest on Debt: $2,466,000
Interest on Debt: $2,422,000
- Local Intergovernmental - Housing and Community Development: $904,000
Housing and Community Development: $904,000
- Long Term Debt - Beginning Outstanding - Unspecified Public Purpose: $48,084,000
Outstanding Unspecified Public Purpose: $44,709,000
Beginning Outstanding - Unspecified Public Purpose: $35,734,000
Outstanding Unspecified Public Purpose: $26,759,000
Retired Unspecified Public Purpose: $8,975,000
Retired Unspecified Public Purpose: $8,975,000
Beginning Outstanding - Public Debt for Private Purpose: $6,577,000
Issue, Unspecified Public Purpose: $5,600,000
Outstanding Nonguaranteed - Industrial Revenue: $5,065,000
Beginning Outstanding - Public Debt for Private Purpose: $3,554,000
Outstanding Nonguaranteed - Industrial Revenue: $2,043,000
Retired Nonguaranteed - Public Debt for Private Purpose: $1,511,000
Retired Nonguaranteed - Public Debt for Private Purpose: $1,511,000
- Miscellaneous - Sale of Property: $32,683,000
Sale of Property: $23,378,000
General Revenue - Other: $11,661,000
General Revenue - Other: $8,341,000
Royalties: $7,138,000
Royalties: $5,106,000
Interest Earnings: $1,938,000
Interest Earnings: $1,386,000
Fines and Forfeits: $271,000
Fines and Forfeits: $194,000
- Other Capital Outlay - Central Staff Services: $1,405,000
Air Transportation: $1,023,000
Central Staff Services: $1,014,000
Regular Highways: $866,000
Air Transportation: $738,000
Regular Highways: $625,000
General - Other: $442,000
Correctional Institutions: $381,000
General - Other: $319,000
Correctional Institutions: $275,000
Judicial and Legal Services: $245,000
Public Welfare - Other: $236,000
Judicial and Legal Services: $177,000
Public Welfare - Other: $170,000
Corrections - Other: $142,000
Corrections - Other: $103,000
- Other Funds - Cash and Securities: $122,611,000
Cash and Securities: $118,336,000
- Sinking Funds - Cash and Securities: $11,580,000
- State Intergovernmental - Other: $17,432,000
Other: $17,288,000
General Local Government Support: $17,084,000
General Local Government Support: $16,942,000
Housing and Community Development: $7,348,000
Housing and Community Development: $7,287,000
Public Welfare: $4,975,000
Public Welfare: $4,933,000
- Tax - Property: $42,630,000
Property: $41,485,000
Other Selective Sales: $1,608,000
Other Selective Sales: $1,565,000
- Total Salaries and Wages: $50,867,000
: $48,617,000
Washington County government finances - Debt in 2018:
- Charges - Other: $30,299,000
Other: $29,135,000
Housing and Community Development: $761,000
Housing and Community Development: $732,000
- Construction - General - Other: $1,980,000
General - Other: $1,980,000
- Current Operations - Public Welfare - Other: $41,325,000
Public Welfare - Other: $41,103,000
Public Welfare Institutions: $22,549,000
Public Welfare Institutions: $22,428,000
Judicial and Legal Services: $17,804,000
Judicial and Legal Services: $17,709,000
Housing and Community Development: $14,443,000
Housing and Community Development: $14,366,000
Health - Other: $12,352,000
Health - Other: $12,285,000
Corrections - Other: $11,004,000
Corrections - Other: $10,945,000
General - Other: $10,011,000
General - Other: $9,958,000
Correctional Institutions: $7,794,000
Correctional Institutions: $7,752,000
Central Staff Services: $7,506,000
Central Staff Services: $7,466,000
Police Protection: $4,143,000
Police Protection: $4,121,000
Financial Administration: $3,307,000
Financial Administration: $3,289,000
General Public Buildings: $1,908,000
General Public Buildings: $1,898,000
Regular Highways: $1,356,000
Regular Highways: $1,349,000
Parks and Recreation: $376,000
Parks and Recreation: $374,000
Natural Resources - Other: $335,000
Natural Resources - Other: $333,000
- Federal Intergovernmental - Public Welfare: $11,991,000
Public Welfare: $11,991,000
General Local Government Support: $6,897,000
General Local Government Support: $6,897,000
Other: $5,147,000
Other: $5,147,000
Housing and Community Development: $4,251,000
Housing and Community Development: $4,251,000
- General - Interest on Debt: $2,466,000
Interest on Debt: $2,422,000
- Local Intergovernmental - Housing and Community Development: $904,000
Housing and Community Development: $904,000
- Long Term Debt - Beginning Outstanding - Unspecified Public Purpose: $48,084,000
Outstanding Unspecified Public Purpose: $44,709,000
Beginning Outstanding - Unspecified Public Purpose: $35,734,000
Outstanding Unspecified Public Purpose: $26,759,000
Retired Unspecified Public Purpose: $8,975,000
Retired Unspecified Public Purpose: $8,975,000
Beginning Outstanding - Public Debt for Private Purpose: $6,577,000
Issue, Unspecified Public Purpose: $5,600,000
Outstanding Nonguaranteed - Industrial Revenue: $5,065,000
Beginning Outstanding - Public Debt for Private Purpose: $3,554,000
Outstanding Nonguaranteed - Industrial Revenue: $2,043,000
Retired Nonguaranteed - Public Debt for Private Purpose: $1,511,000
Retired Nonguaranteed - Public Debt for Private Purpose: $1,511,000
- Miscellaneous - Sale of Property: $32,683,000
Sale of Property: $23,378,000
General Revenue - Other: $11,661,000
General Revenue - Other: $8,341,000
Royalties: $7,138,000
Royalties: $5,106,000
Interest Earnings: $1,938,000
Interest Earnings: $1,386,000
Fines and Forfeits: $271,000
Fines and Forfeits: $194,000
- Other Capital Outlay - Central Staff Services: $1,405,000
Air Transportation: $1,023,000
Central Staff Services: $1,014,000
Regular Highways: $866,000
Air Transportation: $738,000
Regular Highways: $625,000
General - Other: $442,000
Correctional Institutions: $381,000
General - Other: $319,000
Correctional Institutions: $275,000
Judicial and Legal Services: $245,000
Public Welfare - Other: $236,000
Judicial and Legal Services: $177,000
Public Welfare - Other: $170,000
Corrections - Other: $142,000
Corrections - Other: $103,000
- Other Funds - Cash and Securities: $122,611,000
Cash and Securities: $118,336,000
- Sinking Funds - Cash and Securities: $11,580,000
- State Intergovernmental - Other: $17,432,000
Other: $17,288,000
General Local Government Support: $17,084,000
General Local Government Support: $16,942,000
Housing and Community Development: $7,348,000
Housing and Community Development: $7,287,000
Public Welfare: $4,975,000
Public Welfare: $4,933,000
- Tax - Property: $42,630,000
Property: $41,485,000
Other Selective Sales: $1,608,000
Other Selective Sales: $1,565,000
- Total Salaries and Wages: $50,867,000
: $48,617,000
Washington County government finances - Cash and Securities in 2018:
- Charges - Other: $30,299,000
Other: $29,135,000
Housing and Community Development: $761,000
Housing and Community Development: $732,000
- Construction - General - Other: $1,980,000
General - Other: $1,980,000
- Current Operations - Public Welfare - Other: $41,325,000
Public Welfare - Other: $41,103,000
Public Welfare Institutions: $22,549,000
Public Welfare Institutions: $22,428,000
Judicial and Legal Services: $17,804,000
Judicial and Legal Services: $17,709,000
Housing and Community Development: $14,443,000
Housing and Community Development: $14,366,000
Health - Other: $12,352,000
Health - Other: $12,285,000
Corrections - Other: $11,004,000
Corrections - Other: $10,945,000
General - Other: $10,011,000
General - Other: $9,958,000
Correctional Institutions: $7,794,000
Correctional Institutions: $7,752,000
Central Staff Services: $7,506,000
Central Staff Services: $7,466,000
Police Protection: $4,143,000
Police Protection: $4,121,000
Financial Administration: $3,307,000
Financial Administration: $3,289,000
General Public Buildings: $1,908,000
General Public Buildings: $1,898,000
Regular Highways: $1,356,000
Regular Highways: $1,349,000
Parks and Recreation: $376,000
Parks and Recreation: $374,000
Natural Resources - Other: $335,000
Natural Resources - Other: $333,000
- Federal Intergovernmental - Public Welfare: $11,991,000
Public Welfare: $11,991,000
General Local Government Support: $6,897,000
General Local Government Support: $6,897,000
Other: $5,147,000
Other: $5,147,000
Housing and Community Development: $4,251,000
Housing and Community Development: $4,251,000
- General - Interest on Debt: $2,466,000
Interest on Debt: $2,422,000
- Local Intergovernmental - Housing and Community Development: $904,000
Housing and Community Development: $904,000
- Long Term Debt - Beginning Outstanding - Unspecified Public Purpose: $48,084,000
Outstanding Unspecified Public Purpose: $44,709,000
Beginning Outstanding - Unspecified Public Purpose: $35,734,000
Outstanding Unspecified Public Purpose: $26,759,000
Retired Unspecified Public Purpose: $8,975,000
Retired Unspecified Public Purpose: $8,975,000
Beginning Outstanding - Public Debt for Private Purpose: $6,577,000
Issue, Unspecified Public Purpose: $5,600,000
Outstanding Nonguaranteed - Industrial Revenue: $5,065,000
Beginning Outstanding - Public Debt for Private Purpose: $3,554,000
Outstanding Nonguaranteed - Industrial Revenue: $2,043,000
Retired Nonguaranteed - Public Debt for Private Purpose: $1,511,000
Retired Nonguaranteed - Public Debt for Private Purpose: $1,511,000
- Miscellaneous - Sale of Property: $32,683,000
Sale of Property: $23,378,000
General Revenue - Other: $11,661,000
General Revenue - Other: $8,341,000
Royalties: $7,138,000
Royalties: $5,106,000
Interest Earnings: $1,938,000
Interest Earnings: $1,386,000
Fines and Forfeits: $271,000
Fines and Forfeits: $194,000
- Other Capital Outlay - Central Staff Services: $1,405,000
Air Transportation: $1,023,000
Central Staff Services: $1,014,000
Regular Highways: $866,000
Air Transportation: $738,000
Regular Highways: $625,000
General - Other: $442,000
Correctional Institutions: $381,000
General - Other: $319,000
Correctional Institutions: $275,000
Judicial and Legal Services: $245,000
Public Welfare - Other: $236,000
Judicial and Legal Services: $177,000
Public Welfare - Other: $170,000
Corrections - Other: $142,000
Corrections - Other: $103,000
- Other Funds - Cash and Securities: $122,611,000
Cash and Securities: $118,336,000
- Sinking Funds - Cash and Securities: $11,580,000
- State Intergovernmental - Other: $17,432,000
Other: $17,288,000
General Local Government Support: $17,084,000
General Local Government Support: $16,942,000
Housing and Community Development: $7,348,000
Housing and Community Development: $7,287,000
Public Welfare: $4,975,000
Public Welfare: $4,933,000
- Tax - Property: $42,630,000
Property: $41,485,000
Other Selective Sales: $1,608,000
Other Selective Sales: $1,565,000
- Total Salaries and Wages: $50,867,000
: $48,617,000
Supplemental Security Income (SSI) in 2006:
- Total number of recipients: 5,405
- Number of aged recipients: 368
- Number of blind and disabled recipients: 5,037
- Number of recipients under 18: 858
- Number of recipients between 18 and 64: 3,645
- Number of recipients older than 64: 902
- Number of recipients also receiving OASDI: 1,800
- Amount of payments (thousands of dollars): 2,607
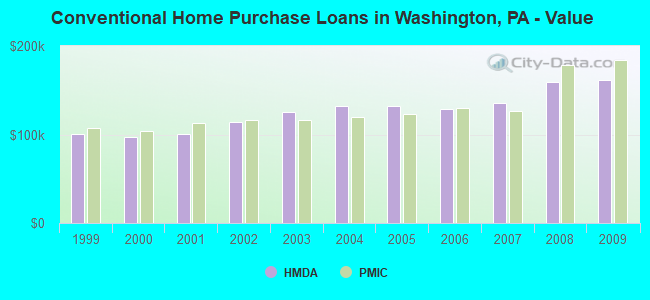
| Home Mortgage Disclosure Act Aggregated Statistics For Year 2009 (Based on 59 full tracts) | ||||||||||||||
| A) FHA, FSA/RHS & VA Home Purchase Loans | B) Conventional Home Purchase Loans | C) Refinancings | D) Home Improvement Loans | E) Loans on Dwellings For 5+ Families | F) Non-occupant Loans on < 5 Family Dwellings (A B C & D) | G) Loans On Manufactured Home Dwelling (A B C & D) | ||||||||
|---|---|---|---|---|---|---|---|---|---|---|---|---|---|---|
| Number | Average Value | Number | Average Value | Number | Average Value | Number | Average Value | Number | Average Value | Number | Average Value | Number | Average Value | |
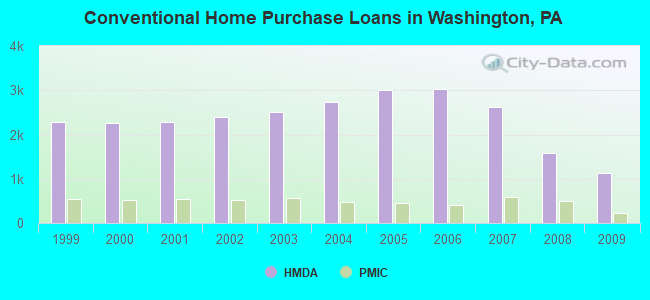
| LOANS ORIGINATED | 675 | $130,126 | 1,123 | $161,861 | 3,573 | $166,561 | 543 | $47,022 | 9 | $309,333 | 174 | $87,943 | 40 | $65,075 |
| APPLICATIONS APPROVED, NOT ACCEPTED | 35 | $129,429 | 70 | $130,200 | 341 | $158,563 | 43 | $32,907 | 1 | $120,000 | 15 | $94,800 | 10 | $76,200 |
| APPLICATIONS DENIED | 81 | $123,444 | 129 | $118,977 | 1,468 | $145,636 | 385 | $33,964 | 6 | $76,167 | 55 | $82,291 | 51 | $59,412 |
| APPLICATIONS WITHDRAWN | 52 | $127,269 | 87 | $158,345 | 845 | $156,559 | 57 | $57,175 | 1 | $90,000 | 29 | $113,345 | 16 | $91,562 |
| FILES CLOSED FOR INCOMPLETENESS | 13 | $90,769 | 19 | $171,895 | 192 | $156,953 | 11 | $120,545 | 0 | $0 | 2 | $303,000 | 3 | $46,333 |
| Private Mortgage Insurance Companies Aggregated Statistics For Year 2009 (Based on 55 full tracts) | ||||||
| A) Conventional Home Purchase Loans | B) Refinancings | C) Non-occupant Loans on < 5 Family Dwellings (A & B) | ||||
|---|---|---|---|---|---|---|
| Number | Average Value | Number | Average Value | Number | Average Value | |
| LOANS ORIGINATED | 223 | $184,659 | 98 | $200,296 | 1 | $98,000 |
| APPLICATIONS APPROVED, NOT ACCEPTED | 89 | $203,629 | 34 | $179,971 | 3 | $82,333 |
| APPLICATIONS DENIED | 18 | $251,389 | 15 | $299,333 | 0 | $0 |
| APPLICATIONS WITHDRAWN | 9 | $211,889 | 12 | $255,333 | 0 | $0 |
| FILES CLOSED FOR INCOMPLETENESS | 20 | $223,600 | 3 | $236,000 | 3 | $124,667 |
| Most common first names in Washington County, PA among deceased individuals | ||
| Name | Count | Lived (average) |
|---|---|---|
| John | 2,889 | 74.8 years |
| Mary | 2,641 | 80.6 years |
| William | 1,737 | 73.6 years |
| Joseph | 1,413 | 74.9 years |
| James | 1,393 | 72.1 years |
| Charles | 1,166 | 74.0 years |
| George | 1,150 | 75.3 years |
| Anna | 1,079 | 82.4 years |
| Robert | 1,065 | 71.0 years |
| Margaret | 1,063 | 79.6 years |
| Most common last names in Washington County, PA among deceased individuals | ||
| Last name | Count | Lived (average) |
|---|---|---|
| Smith | 450 | 76.8 years |
| Miller | 425 | 76.6 years |
| Johnson | 263 | 75.4 years |
| Jones | 262 | 77.6 years |
| Wilson | 231 | 77.4 years |
| Anderson | 226 | 76.1 years |
| Davis | 217 | 73.3 years |
| Williams | 210 | 75.7 years |
| Martin | 208 | 76.4 years |
| Brown | 204 | 74.6 years |
| Businesses in Washington County, PA | ||||
| Name | Count | Name | Count | |
|---|---|---|---|---|
| 7-Eleven | 5 | Lane Bryant | 1 | |
| AT&T | 2 | Lane Furniture | 5 | |
| Ace Hardware | 1 | LensCrafters | 1 | |
| Advance Auto Parts | 4 | Levi Strauss & Co. | 1 | |
| Aeropostale | 2 | Little Caesars Pizza | 3 | |
| American Eagle Outfitters | 1 | Long John Silver's | 3 | |
| Ann Taylor | 1 | Lowe's | 1 | |
| Applebee's | 2 | Macy's | 1 | |
| Arby's | 2 | Marriott | 1 | |
| Audi | 1 | MasterBrand Cabinets | 19 | |
| AutoZone | 2 | Mazda | 1 | |
| BMW | 1 | McDonald's | 11 | |
| Banana Republic | 1 | Motel 6 | 1 | |
| Bath & Body Works | 2 | Motherhood Maternity | 1 | |
| Bed Bath & Beyond | 1 | Nike | 8 | |
| Best Western | 1 | Nissan | 1 | |
| Brooks Brothers | 1 | OfficeMax | 1 | |
| Burger King | 4 | Old Navy | 1 | |
| CVS | 2 | Outback | 1 | |
| Cambria | 1 | Outback Steakhouse | 1 | |
| Carson Pirie Scott | 1 | Pac Sun | 1 | |
| Casual Male XL | 1 | Panera Bread | 2 | |
| Chevrolet | 2 | Papa John's Pizza | 2 | |
| Chico's | 1 | Payless | 2 | |
| Circle K | 2 | Penske | 1 | |
| Clarks | 1 | PetSmart | 1 | |
| Comfort Inn | 1 | Pier 1 Imports | 1 | |
| Comfort Suites | 1 | Pizza Hut | 4 | |
| Cracker Barrel | 1 | Quiznos | 3 | |
| Cricket Wireless | 7 | RadioShack | 2 | |
| Curves | 3 | Ramada | 1 | |
| Dairy Queen | 7 | Red Lobster | 1 | |
| Days Inn | 1 | Red Robin | 1 | |
| Decora Cabinetry | 4 | Red Roof Inn | 1 | |
| Dennys | 1 | Rite Aid | 10 | |
| Domino's Pizza | 1 | Rue21 | 1 | |
| DressBarn | 2 | SAS Shoes | 1 | |
| Dressbarn | 2 | SONIC Drive-In | 1 | |
| Eddie Bauer | 1 | Sam's Club | 1 | |
| Famous Footwear | 2 | Sears | 4 | |
| Fashion Bug | 1 | Skechers USA | 1 | |
| FedEx | 32 | Spencer Gifts | 1 | |
| Finish Line | 1 | Sprint Nextel | 1 | |
| Firestone Complete Auto Care | 1 | Staples | 1 | |
| Foot Locker | 1 | Starbucks | 5 | |
| GNC | 7 | Subaru | 1 | |
| GameStop | 3 | Subway | 19 | |
| Gap | 1 | Super 8 | 1 | |
| Goodwill | 9 | T-Mobile | 4 | |
| Gymboree | 1 | T.G.I. Driday's | 1 | |
| H&R Block | 9 | T.J.Maxx | 1 | |
| Hilton | 2 | Taco Bell | 2 | |
| Holiday Inn | 3 | Talbots | 1 | |
| Home Depot | 1 | Target | 1 | |
| Honda | 2 | Toyota | 1 | |
| Hot Topic | 1 | Toys"R"Us | 1 | |
| Hyundai | 1 | True Value | 3 | |
| IZOD | 1 | U-Haul | 15 | |
| J.Crew | 1 | UPS | 33 | |
| JCPenney | 2 | Verizon Wireless | 2 | |
| Jones New York | 5 | Victoria's Secret | 1 | |
| Journeys | 1 | Volkswagen | 1 | |
| Justice | 1 | Waffle House | 2 | |
| KFC | 2 | Walgreens | 3 | |
| Kincaid | 1 | Walmart | 1 | |
| Kmart | 1 | Wendy's | 4 | |
| Kohl's | 1 | YMCA | 1 | |
| La-Z-Boy | 1 | |||
Washington County on our top lists:
- #10 on the list of "Top 101 counties with the lowest ground withdrawal of fresh water for public supply (pop. 50,000+)"
- #14 on the list of "Top 101 counties with the highest Sulfur Oxides Annual air pollution readings in 2012 (µg/m3)"
- #21 on the list of "Top 101 counties with the lowest percentage of residents relocating to foreign countries in 2011 (pop. 50,000+)"
- #37 on the list of "Top 101 counties with the lowest number of births per 1000 residents 2007-2013"
- #37 on the list of "Top 101 counties with the lowest number of births per 1000 residents 2007-2013 (pop 50,000+)"
- #54 on the list of "Top 101 counties with the lowest percentage of residents relocating to other counties in 2011 (pop. 50,000+)"
- #55 on the list of "Top 101 counties with the lowest percentage of residents relocating to foreign countries in 2011"
- #63 on the list of "Top 101 counties with the highest number of deaths per 1000 residents 2007-2013 (pop. 50,000+)"
- #68 on the list of "Top 101 counties with the most Mainline Protestant congregations"
- #70 on the list of "Top 101 counties with the most Mainline Protestant congregations (pop. 50,000+)"
- #75 on the list of "Top 101 counties with the lowest Nitrogen Dioxide air pollution readings in 2012 (ppm)"
- #78 on the list of "Top 101 counties with the lowest ground withdrawal of fresh water for public supply"
- #90 on the list of "Top 101 counties with the lowest Ozone (1-hour) air pollution readings in 2012 (ppm)"
- #90 on the list of "Top 101 counties with the lowest percentage of residents relocating to other counties in 2011"
- #94 on the list of "Top 101 counties with the most Orthodox congregations"
- #98 on the list of "Top 101 counties with the most Orthodox congregations (pop. 50,000+)"