Washington, Pennsylvania Submit your own pictures of this city and show them to the world
OSM Map
General Map
Google Map
MSN Map
OSM Map
General Map
Google Map
MSN Map
OSM Map
General Map
Google Map
MSN Map
OSM Map
General Map
Google Map
MSN Map
Please wait while loading the map...
Population in 2022: 13,483 (100% urban, 0% rural). Population change since 2000: -11.7%Males: 6,815 Females: 6,668
March 2022 cost of living index in Washington: 89.3 (less than average, U.S. average is 100) Percentage of residents living in poverty in 2022: 19.4%for White Non-Hispanic residents , 44.2% for Black residents , 9.1% for Hispanic or Latino residents , 28.6% for two or more races residents )
Profiles of local businesses
Business Search - 14 Million verified businesses
Data:
Median household income ($)
Median household income (% change since 2000)
Household income diversity
Ratio of average income to average house value (%)
Ratio of average income to average rent
Median household income ($) - White
Median household income ($) - Black or African American
Median household income ($) - Asian
Median household income ($) - Hispanic or Latino
Median household income ($) - American Indian and Alaska Native
Median household income ($) - Multirace
Median household income ($) - Other Race
Median household income for houses/condos with a mortgage ($)
Median household income for apartments without a mortgage ($)
Races - White alone (%)
Races - White alone (% change since 2000)
Races - Black alone (%)
Races - Black alone (% change since 2000)
Races - American Indian alone (%)
Races - American Indian alone (% change since 2000)
Races - Asian alone (%)
Races - Asian alone (% change since 2000)
Races - Hispanic (%)
Races - Hispanic (% change since 2000)
Races - Native Hawaiian and Other Pacific Islander alone (%)
Races - Native Hawaiian and Other Pacific Islander alone (% change since 2000)
Races - Two or more races (%)
Races - Two or more races (% change since 2000)
Races - Other race alone (%)
Races - Other race alone (% change since 2000)
Racial diversity
Unemployment (%)
Unemployment (% change since 2000)
Unemployment (%) - White
Unemployment (%) - Black or African American
Unemployment (%) - Asian
Unemployment (%) - Hispanic or Latino
Unemployment (%) - American Indian and Alaska Native
Unemployment (%) - Multirace
Unemployment (%) - Other Race
Population density (people per square mile)
Population - Males (%)
Population - Females (%)
Population - Males (%) - White
Population - Males (%) - Black or African American
Population - Males (%) - Asian
Population - Males (%) - Hispanic or Latino
Population - Males (%) - American Indian and Alaska Native
Population - Males (%) - Multirace
Population - Males (%) - Other Race
Population - Females (%) - White
Population - Females (%) - Black or African American
Population - Females (%) - Asian
Population - Females (%) - Hispanic or Latino
Population - Females (%) - American Indian and Alaska Native
Population - Females (%) - Multirace
Population - Females (%) - Other Race
Coronavirus confirmed cases (Apr 26, 2024)
Deaths caused by coronavirus (Apr 26, 2024)
Coronavirus confirmed cases (per 100k population) (Apr 26, 2024)
Deaths caused by coronavirus (per 100k population) (Apr 26, 2024)
Daily increase in number of cases (Apr 26, 2024)
Weekly increase in number of cases (Apr 26, 2024)
Cases doubled (in days) (Apr 26, 2024)
Hospitalized patients (Apr 18, 2022)
Negative test results (Apr 18, 2022)
Total test results (Apr 18, 2022)
COVID Vaccine doses distributed (per 100k population) (Sep 19, 2023)
COVID Vaccine doses administered (per 100k population) (Sep 19, 2023)
COVID Vaccine doses distributed (Sep 19, 2023)
COVID Vaccine doses administered (Sep 19, 2023)
Likely homosexual households (%)
Likely homosexual households (% change since 2000)
Likely homosexual households - Lesbian couples (%)
Likely homosexual households - Lesbian couples (% change since 2000)
Likely homosexual households - Gay men (%)
Likely homosexual households - Gay men (% change since 2000)
Cost of living index
Median gross rent ($)
Median contract rent ($)
Median monthly housing costs ($)
Median house or condo value ($)
Median house or condo value ($ change since 2000)
Mean house or condo value by units in structure - 1, detached ($)
Mean house or condo value by units in structure - 1, attached ($)
Mean house or condo value by units in structure - 2 ($)
Mean house or condo value by units in structure by units in structure - 3 or 4 ($)
Mean house or condo value by units in structure - 5 or more ($)
Mean house or condo value by units in structure - Boat, RV, van, etc. ($)
Mean house or condo value by units in structure - Mobile home ($)
Median house or condo value ($) - White
Median house or condo value ($) - Black or African American
Median house or condo value ($) - Asian
Median house or condo value ($) - Hispanic or Latino
Median house or condo value ($) - American Indian and Alaska Native
Median house or condo value ($) - Multirace
Median house or condo value ($) - Other Race
Median resident age
Resident age diversity
Median resident age - Males
Median resident age - Females
Median resident age - White
Median resident age - Black or African American
Median resident age - Asian
Median resident age - Hispanic or Latino
Median resident age - American Indian and Alaska Native
Median resident age - Multirace
Median resident age - Other Race
Median resident age - Males - White
Median resident age - Males - Black or African American
Median resident age - Males - Asian
Median resident age - Males - Hispanic or Latino
Median resident age - Males - American Indian and Alaska Native
Median resident age - Males - Multirace
Median resident age - Males - Other Race
Median resident age - Females - White
Median resident age - Females - Black or African American
Median resident age - Females - Asian
Median resident age - Females - Hispanic or Latino
Median resident age - Females - American Indian and Alaska Native
Median resident age - Females - Multirace
Median resident age - Females - Other Race
Commute - mean travel time to work (minutes)
Travel time to work - Less than 5 minutes (%)
Travel time to work - Less than 5 minutes (% change since 2000)
Travel time to work - 5 to 9 minutes (%)
Travel time to work - 5 to 9 minutes (% change since 2000)
Travel time to work - 10 to 19 minutes (%)
Travel time to work - 10 to 19 minutes (% change since 2000)
Travel time to work - 20 to 29 minutes (%)
Travel time to work - 20 to 29 minutes (% change since 2000)
Travel time to work - 30 to 39 minutes (%)
Travel time to work - 30 to 39 minutes (% change since 2000)
Travel time to work - 40 to 59 minutes (%)
Travel time to work - 40 to 59 minutes (% change since 2000)
Travel time to work - 60 to 89 minutes (%)
Travel time to work - 60 to 89 minutes (% change since 2000)
Travel time to work - 90 or more minutes (%)
Travel time to work - 90 or more minutes (% change since 2000)
Marital status - Never married (%)
Marital status - Now married (%)
Marital status - Separated (%)
Marital status - Widowed (%)
Marital status - Divorced (%)
Median family income ($)
Median family income (% change since 2000)
Median non-family income ($)
Median non-family income (% change since 2000)
Median per capita income ($)
Median per capita income (% change since 2000)
Median family income ($) - White
Median family income ($) - Black or African American
Median family income ($) - Asian
Median family income ($) - Hispanic or Latino
Median family income ($) - American Indian and Alaska Native
Median family income ($) - Multirace
Median family income ($) - Other Race
Median year house/condo built
Median year apartment built
Year house built - Built 2005 or later (%)
Year house built - Built 2000 to 2004 (%)
Year house built - Built 1990 to 1999 (%)
Year house built - Built 1980 to 1989 (%)
Year house built - Built 1970 to 1979 (%)
Year house built - Built 1960 to 1969 (%)
Year house built - Built 1950 to 1959 (%)
Year house built - Built 1940 to 1949 (%)
Year house built - Built 1939 or earlier (%)
Average household size
Household density (households per square mile)
Average household size - White
Average household size - Black or African American
Average household size - Asian
Average household size - Hispanic or Latino
Average household size - American Indian and Alaska Native
Average household size - Multirace
Average household size - Other Race
Occupied housing units (%)
Vacant housing units (%)
Owner occupied housing units (%)
Renter occupied housing units (%)
Vacancy status - For rent (%)
Vacancy status - For sale only (%)
Vacancy status - Rented or sold, not occupied (%)
Vacancy status - For seasonal, recreational, or occasional use (%)
Vacancy status - For migrant workers (%)
Vacancy status - Other vacant (%)
Residents with income below the poverty level (%)
Residents with income below 50% of the poverty level (%)
Children below poverty level (%)
Poor families by family type - Married-couple family (%)
Poor families by family type - Male, no wife present (%)
Poor families by family type - Female, no husband present (%)
Poverty status for native-born residents (%)
Poverty status for foreign-born residents (%)
Poverty among high school graduates not in families (%)
Poverty among people who did not graduate high school not in families (%)
Residents with income below the poverty level (%) - White
Residents with income below the poverty level (%) - Black or African American
Residents with income below the poverty level (%) - Asian
Residents with income below the poverty level (%) - Hispanic or Latino
Residents with income below the poverty level (%) - American Indian and Alaska Native
Residents with income below the poverty level (%) - Multirace
Residents with income below the poverty level (%) - Other Race
Air pollution - Air Quality Index (AQI)
Air pollution - CO
Air pollution - NO2
Air pollution - SO2
Air pollution - Ozone
Air pollution - PM10
Air pollution - PM25
Air pollution - Pb
Crime - Murders per 100,000 population
Crime - Rapes per 100,000 population
Crime - Robberies per 100,000 population
Crime - Assaults per 100,000 population
Crime - Burglaries per 100,000 population
Crime - Thefts per 100,000 population
Crime - Auto thefts per 100,000 population
Crime - Arson per 100,000 population
Crime - City-data.com crime index
Crime - Violent crime index
Crime - Property crime index
Crime - Murders per 100,000 population (5 year average)
Crime - Rapes per 100,000 population (5 year average)
Crime - Robberies per 100,000 population (5 year average)
Crime - Assaults per 100,000 population (5 year average)
Crime - Burglaries per 100,000 population (5 year average)
Crime - Thefts per 100,000 population (5 year average)
Crime - Auto thefts per 100,000 population (5 year average)
Crime - Arson per 100,000 population (5 year average)
Crime - City-data.com crime index (5 year average)
Crime - Violent crime index (5 year average)
Crime - Property crime index (5 year average)
1996 Presidential Elections Results (%) - Democratic Party (Clinton)
1996 Presidential Elections Results (%) - Republican Party (Dole)
1996 Presidential Elections Results (%) - Other
2000 Presidential Elections Results (%) - Democratic Party (Gore)
2000 Presidential Elections Results (%) - Republican Party (Bush)
2000 Presidential Elections Results (%) - Other
2004 Presidential Elections Results (%) - Democratic Party (Kerry)
2004 Presidential Elections Results (%) - Republican Party (Bush)
2004 Presidential Elections Results (%) - Other
2008 Presidential Elections Results (%) - Democratic Party (Obama)
2008 Presidential Elections Results (%) - Republican Party (McCain)
2008 Presidential Elections Results (%) - Other
2012 Presidential Elections Results (%) - Democratic Party (Obama)
2012 Presidential Elections Results (%) - Republican Party (Romney)
2012 Presidential Elections Results (%) - Other
2016 Presidential Elections Results (%) - Democratic Party (Clinton)
2016 Presidential Elections Results (%) - Republican Party (Trump)
2016 Presidential Elections Results (%) - Other
2020 Presidential Elections Results (%) - Democratic Party (Biden)
2020 Presidential Elections Results (%) - Republican Party (Trump)
2020 Presidential Elections Results (%) - Other
Ancestries Reported - Arab (%)
Ancestries Reported - Czech (%)
Ancestries Reported - Danish (%)
Ancestries Reported - Dutch (%)
Ancestries Reported - English (%)
Ancestries Reported - French (%)
Ancestries Reported - French Canadian (%)
Ancestries Reported - German (%)
Ancestries Reported - Greek (%)
Ancestries Reported - Hungarian (%)
Ancestries Reported - Irish (%)
Ancestries Reported - Italian (%)
Ancestries Reported - Lithuanian (%)
Ancestries Reported - Norwegian (%)
Ancestries Reported - Polish (%)
Ancestries Reported - Portuguese (%)
Ancestries Reported - Russian (%)
Ancestries Reported - Scotch-Irish (%)
Ancestries Reported - Scottish (%)
Ancestries Reported - Slovak (%)
Ancestries Reported - Subsaharan African (%)
Ancestries Reported - Swedish (%)
Ancestries Reported - Swiss (%)
Ancestries Reported - Ukrainian (%)
Ancestries Reported - United States (%)
Ancestries Reported - Welsh (%)
Ancestries Reported - West Indian (%)
Ancestries Reported - Other (%)
Educational Attainment - No schooling completed (%)
Educational Attainment - Less than high school (%)
Educational Attainment - High school or equivalent (%)
Educational Attainment - Less than 1 year of college (%)
Educational Attainment - 1 or more years of college (%)
Educational Attainment - Associate degree (%)
Educational Attainment - Bachelor's degree (%)
Educational Attainment - Master's degree (%)
Educational Attainment - Professional school degree (%)
Educational Attainment - Doctorate degree (%)
School Enrollment - Nursery, preschool (%)
School Enrollment - Kindergarten (%)
School Enrollment - Grade 1 to 4 (%)
School Enrollment - Grade 5 to 8 (%)
School Enrollment - Grade 9 to 12 (%)
School Enrollment - College undergrad (%)
School Enrollment - Graduate or professional (%)
School Enrollment - Not enrolled in school (%)
School enrollment - Public schools (%)
School enrollment - Private schools (%)
School enrollment - Not enrolled (%)
Median number of rooms in houses and condos
Median number of rooms in apartments
Housing units lacking complete plumbing facilities (%)
Housing units lacking complete kitchen facilities (%)
Density of houses
Urban houses (%)
Rural houses (%)
Households with people 60 years and over (%)
Households with people 65 years and over (%)
Households with people 75 years and over (%)
Households with one or more nonrelatives (%)
Households with no nonrelatives (%)
Population in households (%)
Family households (%)
Nonfamily households (%)
Population in families (%)
Family households with own children (%)
Median number of bedrooms in owner occupied houses
Mean number of bedrooms in owner occupied houses
Median number of bedrooms in renter occupied houses
Mean number of bedrooms in renter occupied houses
Median number of vehichles in owner occupied houses
Mean number of vehichles in owner occupied houses
Median number of vehichles in renter occupied houses
Mean number of vehichles in renter occupied houses
Mortgage status - with mortgage (%)
Mortgage status - with second mortgage (%)
Mortgage status - with home equity loan (%)
Mortgage status - with both second mortgage and home equity loan (%)
Mortgage status - without a mortgage (%)
Average family size
Average family size - White
Average family size - Black or African American
Average family size - Asian
Average family size - Hispanic or Latino
Average family size - American Indian and Alaska Native
Average family size - Multirace
Average family size - Other Race
Geographical mobility - Same house 1 year ago (%)
Geographical mobility - Moved within same county (%)
Geographical mobility - Moved from different county within same state (%)
Geographical mobility - Moved from different state (%)
Geographical mobility - Moved from abroad (%)
Place of birth - Born in state of residence (%)
Place of birth - Born in other state (%)
Place of birth - Native, outside of US (%)
Place of birth - Foreign born (%)
Housing units in structures - 1, detached (%)
Housing units in structures - 1, attached (%)
Housing units in structures - 2 (%)
Housing units in structures - 3 or 4 (%)
Housing units in structures - 5 to 9 (%)
Housing units in structures - 10 to 19 (%)
Housing units in structures - 20 to 49 (%)
Housing units in structures - 50 or more (%)
Housing units in structures - Mobile home (%)
Housing units in structures - Boat, RV, van, etc. (%)
House/condo owner moved in on average (years ago)
Renter moved in on average (years ago)
Year householder moved into unit - Moved in 1999 to March 2000 (%)
Year householder moved into unit - Moved in 1995 to 1998 (%)
Year householder moved into unit - Moved in 1990 to 1994 (%)
Year householder moved into unit - Moved in 1980 to 1989 (%)
Year householder moved into unit - Moved in 1970 to 1979 (%)
Year householder moved into unit - Moved in 1969 or earlier (%)
Means of transportation to work - Drove car alone (%)
Means of transportation to work - Carpooled (%)
Means of transportation to work - Public transportation (%)
Means of transportation to work - Bus or trolley bus (%)
Means of transportation to work - Streetcar or trolley car (%)
Means of transportation to work - Subway or elevated (%)
Means of transportation to work - Railroad (%)
Means of transportation to work - Ferryboat (%)
Means of transportation to work - Taxicab (%)
Means of transportation to work - Motorcycle (%)
Means of transportation to work - Bicycle (%)
Means of transportation to work - Walked (%)
Means of transportation to work - Other means (%)
Working at home (%)
Industry diversity
Most Common Industries - Agriculture, forestry, fishing and hunting, and mining (%)
Most Common Industries - Agriculture, forestry, fishing and hunting (%)
Most Common Industries - Mining, quarrying, and oil and gas extraction (%)
Most Common Industries - Construction (%)
Most Common Industries - Manufacturing (%)
Most Common Industries - Wholesale trade (%)
Most Common Industries - Retail trade (%)
Most Common Industries - Transportation and warehousing, and utilities (%)
Most Common Industries - Transportation and warehousing (%)
Most Common Industries - Utilities (%)
Most Common Industries - Information (%)
Most Common Industries - Finance and insurance, and real estate and rental and leasing (%)
Most Common Industries - Finance and insurance (%)
Most Common Industries - Real estate and rental and leasing (%)
Most Common Industries - Professional, scientific, and management, and administrative and waste management services (%)
Most Common Industries - Professional, scientific, and technical services (%)
Most Common Industries - Management of companies and enterprises (%)
Most Common Industries - Administrative and support and waste management services (%)
Most Common Industries - Educational services, and health care and social assistance (%)
Most Common Industries - Educational services (%)
Most Common Industries - Health care and social assistance (%)
Most Common Industries - Arts, entertainment, and recreation, and accommodation and food services (%)
Most Common Industries - Arts, entertainment, and recreation (%)
Most Common Industries - Accommodation and food services (%)
Most Common Industries - Other services, except public administration (%)
Most Common Industries - Public administration (%)
Occupation diversity
Most Common Occupations - Management, business, science, and arts occupations (%)
Most Common Occupations - Management, business, and financial occupations (%)
Most Common Occupations - Management occupations (%)
Most Common Occupations - Business and financial operations occupations (%)
Most Common Occupations - Computer, engineering, and science occupations (%)
Most Common Occupations - Computer and mathematical occupations (%)
Most Common Occupations - Architecture and engineering occupations (%)
Most Common Occupations - Life, physical, and social science occupations (%)
Most Common Occupations - Education, legal, community service, arts, and media occupations (%)
Most Common Occupations - Community and social service occupations (%)
Most Common Occupations - Legal occupations (%)
Most Common Occupations - Education, training, and library occupations (%)
Most Common Occupations - Arts, design, entertainment, sports, and media occupations (%)
Most Common Occupations - Healthcare practitioners and technical occupations (%)
Most Common Occupations - Health diagnosing and treating practitioners and other technical occupations (%)
Most Common Occupations - Health technologists and technicians (%)
Most Common Occupations - Service occupations (%)
Most Common Occupations - Healthcare support occupations (%)
Most Common Occupations - Protective service occupations (%)
Most Common Occupations - Fire fighting and prevention, and other protective service workers including supervisors (%)
Most Common Occupations - Law enforcement workers including supervisors (%)
Most Common Occupations - Food preparation and serving related occupations (%)
Most Common Occupations - Building and grounds cleaning and maintenance occupations (%)
Most Common Occupations - Personal care and service occupations (%)
Most Common Occupations - Sales and office occupations (%)
Most Common Occupations - Sales and related occupations (%)
Most Common Occupations - Office and administrative support occupations (%)
Most Common Occupations - Natural resources, construction, and maintenance occupations (%)
Most Common Occupations - Farming, fishing, and forestry occupations (%)
Most Common Occupations - Construction and extraction occupations (%)
Most Common Occupations - Installation, maintenance, and repair occupations (%)
Most Common Occupations - Production, transportation, and material moving occupations (%)
Most Common Occupations - Production occupations (%)
Most Common Occupations - Transportation occupations (%)
Most Common Occupations - Material moving occupations (%)
People in Group quarters - Institutionalized population (%)
People in Group quarters - Correctional institutions (%)
People in Group quarters - Federal prisons and detention centers (%)
People in Group quarters - Halfway houses (%)
People in Group quarters - Local jails and other confinement facilities (including police lockups) (%)
People in Group quarters - Military disciplinary barracks (%)
People in Group quarters - State prisons (%)
People in Group quarters - Other types of correctional institutions (%)
People in Group quarters - Nursing homes (%)
People in Group quarters - Hospitals/wards, hospices, and schools for the handicapped (%)
People in Group quarters - Hospitals/wards and hospices for chronically ill (%)
People in Group quarters - Hospices or homes for chronically ill (%)
People in Group quarters - Military hospitals or wards for chronically ill (%)
People in Group quarters - Other hospitals or wards for chronically ill (%)
People in Group quarters - Hospitals or wards for drug/alcohol abuse (%)
People in Group quarters - Mental (Psychiatric) hospitals or wards (%)
People in Group quarters - Schools, hospitals, or wards for the mentally retarded (%)
People in Group quarters - Schools, hospitals, or wards for the physically handicapped (%)
People in Group quarters - Institutions for the deaf (%)
People in Group quarters - Institutions for the blind (%)
People in Group quarters - Orthopedic wards and institutions for the physically handicapped (%)
People in Group quarters - Wards in general hospitals for patients who have no usual home elsewhere (%)
People in Group quarters - Wards in military hospitals for patients who have no usual home elsewhere (%)
People in Group quarters - Juvenile institutions (%)
People in Group quarters - Long-term care (%)
People in Group quarters - Homes for abused, dependent, and neglected children (%)
People in Group quarters - Residential treatment centers for emotionally disturbed children (%)
People in Group quarters - Training schools for juvenile delinquents (%)
People in Group quarters - Short-term care, detention or diagnostic centers for delinquent children (%)
People in Group quarters - Type of juvenile institution unknown (%)
People in Group quarters - Noninstitutionalized population (%)
People in Group quarters - College dormitories (includes college quarters off campus) (%)
People in Group quarters - Military quarters (%)
People in Group quarters - On base (%)
People in Group quarters - Barracks, unaccompanied personnel housing (UPH), (Enlisted/Officer), ;and similar group living quarters for military personnel (%)
People in Group quarters - Transient quarters for temporary residents (%)
People in Group quarters - Military ships (%)
People in Group quarters - Group homes (%)
People in Group quarters - Homes or halfway houses for drug/alcohol abuse (%)
People in Group quarters - Homes for the mentally ill (%)
People in Group quarters - Homes for the mentally retarded (%)
People in Group quarters - Homes for the physically handicapped (%)
People in Group quarters - Other group homes (%)
People in Group quarters - Religious group quarters (%)
People in Group quarters - Dormitories (%)
People in Group quarters - Agriculture workers' dormitories on farms (%)
People in Group quarters - Job Corps and vocational training facilities (%)
People in Group quarters - Other workers' dormitories (%)
People in Group quarters - Crews of maritime vessels (%)
People in Group quarters - Other nonhousehold living situations (%)
People in Group quarters - Other noninstitutional group quarters (%)
Residents speaking English at home (%)
Residents speaking English at home - Born in the United States (%)
Residents speaking English at home - Native, born elsewhere (%)
Residents speaking English at home - Foreign born (%)
Residents speaking Spanish at home (%)
Residents speaking Spanish at home - Born in the United States (%)
Residents speaking Spanish at home - Native, born elsewhere (%)
Residents speaking Spanish at home - Foreign born (%)
Residents speaking other language at home (%)
Residents speaking other language at home - Born in the United States (%)
Residents speaking other language at home - Native, born elsewhere (%)
Residents speaking other language at home - Foreign born (%)
Class of Workers - Employee of private company (%)
Class of Workers - Self-employed in own incorporated business (%)
Class of Workers - Private not-for-profit wage and salary workers (%)
Class of Workers - Local government workers (%)
Class of Workers - State government workers (%)
Class of Workers - Federal government workers (%)
Class of Workers - Self-employed workers in own not incorporated business and Unpaid family workers (%)
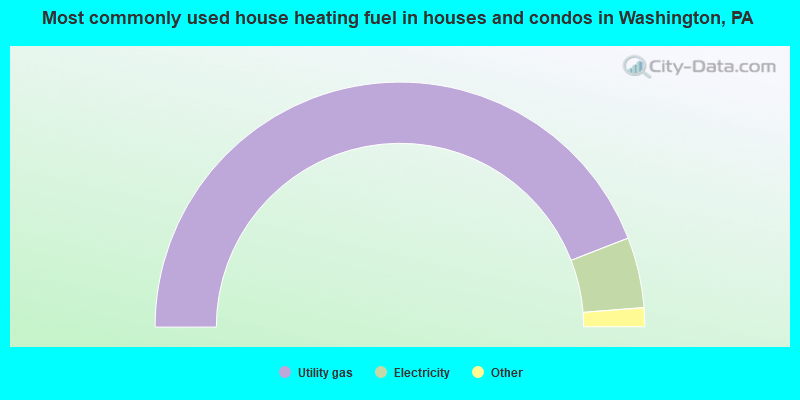
House heating fuel used in houses and condos - Utility gas (%)
House heating fuel used in houses and condos - Bottled, tank, or LP gas (%)
House heating fuel used in houses and condos - Electricity (%)
House heating fuel used in houses and condos - Fuel oil, kerosene, etc. (%)
House heating fuel used in houses and condos - Coal or coke (%)
House heating fuel used in houses and condos - Wood (%)
House heating fuel used in houses and condos - Solar energy (%)
House heating fuel used in houses and condos - Other fuel (%)
House heating fuel used in houses and condos - No fuel used (%)
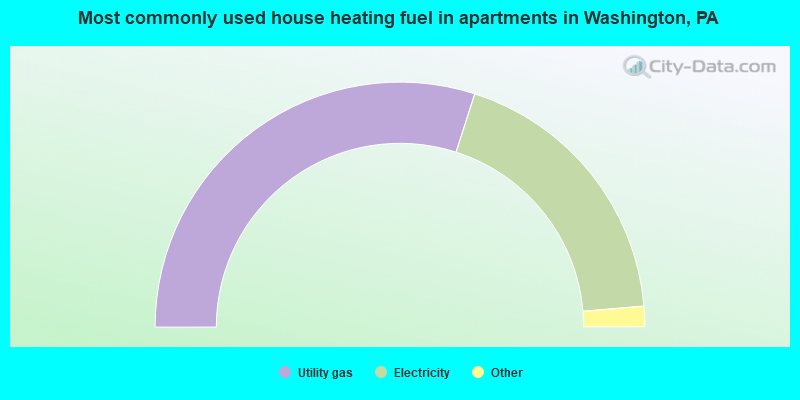
House heating fuel used in apartments - Utility gas (%)
House heating fuel used in apartments - Bottled, tank, or LP gas (%)
House heating fuel used in apartments - Electricity (%)
House heating fuel used in apartments - Fuel oil, kerosene, etc. (%)
House heating fuel used in apartments - Coal or coke (%)
House heating fuel used in apartments - Wood (%)
House heating fuel used in apartments - Solar energy (%)
House heating fuel used in apartments - Other fuel (%)
House heating fuel used in apartments - No fuel used (%)
Armed forces status - In Armed Forces (%)
Armed forces status - Civilian (%)
Armed forces status - Civilian - Veteran (%)
Armed forces status - Civilian - Nonveteran (%)
Fatal accidents locations in years 2005-2021
Fatal accidents locations in 2005
Fatal accidents locations in 2006
Fatal accidents locations in 2007
Fatal accidents locations in 2008
Fatal accidents locations in 2009
Fatal accidents locations in 2010
Fatal accidents locations in 2011
Fatal accidents locations in 2012
Fatal accidents locations in 2013
Fatal accidents locations in 2014
Fatal accidents locations in 2015
Fatal accidents locations in 2016
Fatal accidents locations in 2017
Fatal accidents locations in 2018
Fatal accidents locations in 2019
Fatal accidents locations in 2020
Fatal accidents locations in 2021
Alcohol use - People drinking some alcohol every month (%)
Alcohol use - People not drinking at all (%)
Alcohol use - Average days/month drinking alcohol
Alcohol use - Average drinks/week
Alcohol use - Average days/year people drink much
Audiometry - Average condition of hearing (%)
Audiometry - People that can hear a whisper from across a quiet room (%)
Audiometry - People that can hear normal voice from across a quiet room (%)
Audiometry - Ears ringing, roaring, buzzing (%)
Audiometry - Had a job exposure to loud noise (%)
Audiometry - Had off-work exposure to loud noise (%)
Blood Pressure & Cholesterol - Has high blood pressure (%)
Blood Pressure & Cholesterol - Checking blood pressure at home (%)
Blood Pressure & Cholesterol - Frequently checking blood cholesterol (%)
Blood Pressure & Cholesterol - Has high cholesterol level (%)
Consumer Behavior - Money monthly spent on food at supermarket/grocery store
Consumer Behavior - Money monthly spent on food at other stores
Consumer Behavior - Money monthly spent on eating out
Consumer Behavior - Money monthly spent on carryout/delivered foods
Consumer Behavior - Income spent on food at supermarket/grocery store (%)
Consumer Behavior - Income spent on food at other stores (%)
Consumer Behavior - Income spent on eating out (%)
Consumer Behavior - Income spent on carryout/delivered foods (%)
Current Health Status - General health condition (%)
Current Health Status - Blood donors (%)
Current Health Status - Has blood ever tested for HIV virus (%)
Current Health Status - Left-handed people (%)
Dermatology - People using sunscreen (%)
Diabetes - Diabetics (%)
Diabetes - Had a blood test for high blood sugar (%)
Diabetes - People taking insulin (%)
Diet Behavior & Nutrition - Diet health (%)
Diet Behavior & Nutrition - Milk product consumption (# of products/month)
Diet Behavior & Nutrition - Meals not home prepared (#/week)
Diet Behavior & Nutrition - Meals from fast food or pizza place (#/week)
Diet Behavior & Nutrition - Ready-to-eat foods (#/month)
Diet Behavior & Nutrition - Frozen meals/pizza (#/month)
Drug Use - People that ever used marijuana or hashish (%)
Drug Use - Ever used hard drugs (%)
Drug Use - Ever used any form of cocaine (%)
Drug Use - Ever used heroin (%)
Drug Use - Ever used methamphetamine (%)
Health Insurance - People covered by health insurance (%)
Kidney Conditions-Urology - Avg. # of times urinating at night
Medical Conditions - People with asthma (%)
Medical Conditions - People with anemia (%)
Medical Conditions - People with psoriasis (%)
Medical Conditions - People with overweight (%)
Medical Conditions - Elderly people having difficulties in thinking or remembering (%)
Medical Conditions - People who ever received blood transfusion (%)
Medical Conditions - People having trouble seeing even with glass/contacts (%)
Medical Conditions - People with arthritis (%)
Medical Conditions - People with gout (%)
Medical Conditions - People with congestive heart failure (%)
Medical Conditions - People with coronary heart disease (%)
Medical Conditions - People with angina pectoris (%)
Medical Conditions - People who ever had heart attack (%)
Medical Conditions - People who ever had stroke (%)
Medical Conditions - People with emphysema (%)
Medical Conditions - People with thyroid problem (%)
Medical Conditions - People with chronic bronchitis (%)
Medical Conditions - People with any liver condition (%)
Medical Conditions - People who ever had cancer or malignancy (%)
Mental Health - People who have little interest in doing things (%)
Mental Health - People feeling down, depressed, or hopeless (%)
Mental Health - People who have trouble sleeping or sleeping too much (%)
Mental Health - People feeling tired or having little energy (%)
Mental Health - People with poor appetite or overeating (%)
Mental Health - People feeling bad about themself (%)
Mental Health - People who have trouble concentrating on things (%)
Mental Health - People moving or speaking slowly or too fast (%)
Mental Health - People having thoughts they would be better off dead (%)
Oral Health - Average years since last visit a dentist
Oral Health - People embarrassed because of mouth (%)
Oral Health - People with gum disease (%)
Oral Health - General health of teeth and gums (%)
Oral Health - Average days a week using dental floss/device
Oral Health - Average days a week using mouthwash for dental problem
Oral Health - Average number of teeth
Pesticide Use - Households using pesticides to control insects (%)
Pesticide Use - Households using pesticides to kill weeds (%)
Physical Activity - People doing vigorous-intensity work activities (%)
Physical Activity - People doing moderate-intensity work activities (%)
Physical Activity - People walking or bicycling (%)
Physical Activity - People doing vigorous-intensity recreational activities (%)
Physical Activity - People doing moderate-intensity recreational activities (%)
Physical Activity - Average hours a day doing sedentary activities
Physical Activity - Average hours a day watching TV or videos
Physical Activity - Average hours a day using computer
Physical Functioning - People having limitations keeping them from working (%)
Physical Functioning - People limited in amount of work they can do (%)
Physical Functioning - People that need special equipment to walk (%)
Physical Functioning - People experiencing confusion/memory problems (%)
Physical Functioning - People requiring special healthcare equipment (%)
Prescription Medications - Average number of prescription medicines taking
Preventive Aspirin Use - Adults 40+ taking low-dose aspirin (%)
Reproductive Health - Vaginal deliveries (%)
Reproductive Health - Cesarean deliveries (%)
Reproductive Health - Deliveries resulted in a live birth (%)
Reproductive Health - Pregnancies resulted in a delivery (%)
Reproductive Health - Women breastfeeding newborns (%)
Reproductive Health - Women that had a hysterectomy (%)
Reproductive Health - Women that had both ovaries removed (%)
Reproductive Health - Women that have ever taken birth control pills (%)
Reproductive Health - Women taking birth control pills (%)
Reproductive Health - Women that have ever used Depo-Provera or injectables (%)
Reproductive Health - Women that have ever used female hormones (%)
Sexual Behavior - People 18+ that ever had sex (vaginal, anal, or oral) (%)
Sexual Behavior - Males 18+ that ever had vaginal sex with a woman (%)
Sexual Behavior - Males 18+ that ever performed oral sex on a woman (%)
Sexual Behavior - Males 18+ that ever had anal sex with a woman (%)
Sexual Behavior - Males 18+ that ever had any sex with a man (%)
Sexual Behavior - Females 18+ that ever had vaginal sex with a man (%)
Sexual Behavior - Females 18+ that ever performed oral sex on a man (%)
Sexual Behavior - Females 18+ that ever had anal sex with a man (%)
Sexual Behavior - Females 18+ that ever had any kind of sex with a woman (%)
Sexual Behavior - Average age people first had sex
Sexual Behavior - Average number of female sex partners in lifetime (males 18+)
Sexual Behavior - Average number of female vaginal sex partners in lifetime (males 18+)
Sexual Behavior - Average age people first performed oral sex on a woman (18+)
Sexual Behavior - Average number of woman performed oral sex on in lifetime (18+)
Sexual Behavior - Average number of male sex partners in lifetime (males 18+)
Sexual Behavior - Average number of male anal sex partners in lifetime (males 18+)
Sexual Behavior - Average age people first performed oral sex on a man (18+)
Sexual Behavior - Average number of male oral sex partners in lifetime (18+)
Sexual Behavior - People using protection when performing oral sex (%)
Sexual Behavior - Average number of times people have vaginal or anal sex a year
Sexual Behavior - People having sex without condom (%)
Sexual Behavior - Average number of male sex partners in lifetime (females 18+)
Sexual Behavior - Average number of male vaginal sex partners in lifetime (females 18+)
Sexual Behavior - Average number of female sex partners in lifetime (females 18+)
Sexual Behavior - Circumcised males 18+ (%)
Sleep Disorders - Average hours sleeping at night
Sleep Disorders - People that has trouble sleeping (%)
Smoking-Cigarette Use - People smoking cigarettes (%)
Taste & Smell - People 40+ having problems with smell (%)
Taste & Smell - People 40+ having problems with taste (%)
Taste & Smell - People 40+ that ever had wisdom teeth removed (%)
Taste & Smell - People 40+ that ever had tonsils teeth removed (%)
Taste & Smell - People 40+ that ever had a loss of consciousness because of a head injury (%)
Taste & Smell - People 40+ that ever had a broken nose or other serious injury to face or skull (%)
Taste & Smell - People 40+ that ever had two or more sinus infections (%)
Weight - Average height (inches)
Weight - Average weight (pounds)
Weight - Average BMI
Weight - People that are obese (%)
Weight - People that ever were obese (%)
Weight - People trying to lose weight (%)
Officers per 1,000 residents here:
2.32Pennsylvania average:
2.70
Latest news from Washington, PA collected exclusively by city-data.com from local newspapers, TV, and radio stations
Ancestries: German (12.0%), English (8.9%), Italian (8.6%), American (6.0%), Polish (5.7%), Irish (5.5%).
Current Local Time:
Land area: 2.94 square miles.
Population density: 4,591 people per square mile (average).
435 residents are foreign born (1.7% Asia , 0.9% Latin America ).
This city:
3.2%Pennsylvania:
7.3%
Median real estate property taxes paid for housing units with mortgages in 2022: $2,208 (1.8%)Median real estate property taxes paid for housing units with no mortgage in 2022: $1,491 (1.4%)
Nearest city with pop. 50,000+: Pittsburgh, PA
Nearest city with pop. 1,000,000+: Philadelphia, PA
Nearest cities:
Green Hills, PA (2.2 miles),
Latitude: 40.17 N, Longitude: 80.25 W
Daytime population change due to commuting: +5,630 (+42.0%)Workers who live and work in this city: 1,928 (30.9%)
Property values in Washington, PA
Washington tourist attractions:
Single-family new house construction building permits:
2022: 4 buildings , average cost: $155,9002021: 3 buildings , average cost: $155,9002020: 3 buildings , average cost: $155,9002019: 3 buildings , average cost: $155,9002017: 1 building , cost: $21,2002016: 1 building , cost: $21,2002015: 1 building , cost: $168,0002014: 1 building , cost: $168,0002013: 2 buildings , average cost: $160,0002012: 1 building , cost: $130,2002011: 4 buildings , average cost: $133,4002010: 3 buildings , average cost: $114,1002009: 1 building , cost: $112,5002007: 12 buildings , average cost: $101,1002005: 5 buildings , average cost: $118,1002004: 7 buildings , average cost: $52,7002003: 5 buildings , average cost: $32,0002002: 3 buildings , average cost: $60,0002001: 4 buildings , average cost: $59,3002000: 5 buildings , average cost: $93,4001999: 1 building , cost: $40,0001998: 3 buildings , average cost: $51,7001997: 4 buildings , average cost: $95,000Unemployment in December 2023: Here:
2.9%Pennsylvania:
2.9%
Most common occupations in Washington, PA (%)
Both Males Females
Other office and administrative support workers, including supervisors (4.2%)
Other production occupations, including supervisors (3.7%)
Retail sales workers, except cashiers (3.7%)
Cashiers (3.6%)
Nursing, psychiatric, and home health aides (3.6%)
Material recording, scheduling, dispatching, and distributing workers (3.5%)
Laborers and material movers, hand (3.3%)
Laborers and material movers, hand (6.3%)
Other production occupations, including supervisors (6.3%)
Metal workers and plastic workers (5.7%)
Material recording, scheduling, dispatching, and distributing workers (5.4%)
Driver/sales workers and truck drivers (4.7%)
Electrical equipment mechanics and other installation, maintenance, and repair workers, including supervisors (4.0%)
Construction traders workers except carpenters, electricians, painters, plumbers, and construction laborers (3.3%)
Other office and administrative support workers, including supervisors (6.6%)
Cashiers (6.0%)
Nursing, psychiatric, and home health aides (5.6%)
Secretaries and administrative assistants (5.6%)
Retail sales workers, except cashiers (4.7%)
Waiters and waitresses (4.5%)
Information and record clerks, except customer service representatives (4.5%)
Tornado activity:
Washington-area historical tornado activity is slightly below Pennsylvania state average. It is 30% smaller than the overall U.S. average.
On 8/3/1963, a category F3 (max. wind speeds 158-206 mph) tornado 22.0 miles away from the Washington city center killed 2 people and injured 70 people and caused between $5,000,000 and $50,000,000 in damages.
On 6/3/1980, a category F4 (max. wind speeds 207-260 mph) tornado 42.8 miles away from the city center injured 140 people and caused between $50,000,000 and $500,000,000 in damages.
Earthquake activity:
Washington-area historical earthquake activity is significantly above Pennsylvania state average. It is 52% smaller than the overall U.S. average. On 8/23/2011 at 17:51:04, a magnitude 5.8 (5.8 MW, Depth: 3.7 mi, Class: Moderate, Intensity: VI - VII) earthquake occurred 200.0 miles away from Washington center On 9/25/1998 at 19:52:52, a magnitude 5.2 (4.8 MB, 4.3 MS, 5.2 LG, 4.5 MW, Depth: 3.1 mi) earthquake occurred 91.3 miles away from Washington center On 1/31/1986 at 16:46:43, a magnitude 5.0 (5.0 MB) earthquake occurred 109.6 miles away from the city center On 7/27/1980 at 18:52:21, a magnitude 5.2 (5.1 MB, 4.7 MS, 5.0 UK, 5.2 UK) earthquake occurred 240.3 miles away from Washington center On 8/9/2020 at 12:07:37, a magnitude 5.1 (5.1 MW, Depth: 4.7 mi) earthquake occurred 259.9 miles away from Washington center On 12/31/2011 at 20:05:01, a magnitude 4.0 (4.0 ML, Depth: 3.1 mi, Class: Light, Intensity: IV - V) earthquake occurred 69.3 miles away from Washington center Magnitude types: regional Lg-wave magnitude (LG), body-wave magnitude (MB), local magnitude (ML), surface-wave magnitude (MS), moment magnitude (MW) Natural disasters: The number of natural disasters in Washington County (13) is near the US average (15).Major Disasters (Presidential) Declared: 8Emergencies Declared: 5Floods: 3, Storms: 3, Hurricanes: 2, Snowstorms: 2, Tropical Depressions: 2, Winter Storms: 2, Blizzard: 1, Snowfall: 1, Tropical Storm: 1, Other: 1 (Note: some incidents may be assigned to more than one category). Hospitals in Washington: ADVANCED SURGICAL HOSPITAL (Proprietary, provides emergency services, 100 TRICH DRIVE) HOSPICE CARE OF THE WASHINGTON (10 LEET STREET) WASHINGTON GREENE ALTER RES SR (1305 PARK AVE) WASHINGTON HOSPITAL, THE (Government - Local, 155 WILSON AVENUE) Nursing Homes in Washington: HUMBERT LANE NURSING AND REHABILITATION CENTRE (90 HUMBERT LANE) KADE HEALTH AND REHABILITATION CENTER (1198 W. WYLIE AVENUE) PRESBYTERIAN MED CTR WASHINGTON PA (835 S MAIN ST) SOUTHMONT OF PRESBYTERIAN SENIORCARE (835 SOUTH MAIN STREET) WASHINGTON CO HME FOR AGED WOMEN (2001 MAIN ST) WASHINGTON COUNTY HEALTH CENTE (36 OLD HICKORY RIDGE RD) WASHINGTON HOSP TRANSITIONAL C (155 WILSON AVENUE) Dialysis Facilities in Washington: DAVITA - OAK SPRINGS DIALYSIS (764 LOCUST AVENUE) DCI OF WASHINGTON (280 NORTH AVENUE) LIBERTY DIALYSIS - WASHINGTON (90 WEST CHESTNUT STREET) Home Health Centers in Washington: AMEDISYS HOME HEALTH (275 MEADOWLANDS BOULEVARD) TCM HOME HEALTH LP (1046 JEFFERSON AVENUE) WASHINGTON HOSPITAL HH SERVICE (275 MEADOWLANDS BOULEVARD)
Colleges/Universities in Washington: Washington & Jefferson College Full-time enrollment: 1,607; Location: 60 S Lincoln St; Private, not-for-profit; Website: www.washjeff.edu)
Penn Commercial Business/Technical School Full-time enrollment: 462; Location: 242 Oak Spring Road; Private, for-profit; Website: www.penncommercial.edu)
Washington Hospital School of Nursing Full-time enrollment: 156; Location: 155 Wilson Ave; Private, not-for-profit; Website: www.washingtonhospital.org)
Washington Hospital School of Radiography Full-time enrollment: 22; Location: 155 Wilson Ave; Private, not-for-profit; Website: www.washingtonhospital.org)
Colleges/universities with over 2000 students nearest to Washington:
Pittsburgh Technical Institute (about 18 miles; Oakdale, PA ; Full-time enrollment: 2,805)
West Liberty University (about 19 miles; West Liberty, WV ; FT enrollment: 2,728)
Waynesburg University (about 20 miles; Waynesburg, PA ; FT enrollment: 2,080)
California University of Pennsylvania (about 21 miles; California, PA ; FT enrollment: 7,773)
Point Park University (about 23 miles; Pittsburgh, PA ; FT enrollment: 3,525)
Community College of Allegheny County (about 23 miles; Pittsburgh, PA ; FT enrollment: 13,486)
Duquesne University (about 23 miles; Pittsburgh, PA ; FT enrollment: 8,211)
Public high schools in Washington:
Public elementary/middle schools in Washington: BARCLAY EL SCH Students: 650, Location: 2015 PALOMINO DR, Grades: KG-6)MILL CREEK EL SCH Location: 638 BELLFLOWER BOULEVARD, Grades: KG-6)
TITUS EL SCH Location: 2333 LOWER BARNESS ROAD, Grades: KG-6)
Private elementary/middle schools in Washington: ST JOSEPH ST ROBERT SCHOOL Students: 243, Location: 850 EUCLID AVE, Grades: PK-8)
CROSSROADS COUNTRY DAY SCHOOL Students: 68, Location: 832 EASTON RD, Grades: PK-2)
See full list of schools located in Washington Library in Washington: CITIZENS LIBRARY Operating income: $1,160,388; Location: 55 SOUTH COLLEGE ST; 137,195 books ; 4,862 audio materials ; 3,235 video materials ; 4 local licensed databases ; 82 state licensed databases ; 5 other licensed databases ; 216 print serial subscriptions ; 4 electronic serial subscriptions )
User-submitted facts and corrections:
The YWCA does not exist any longer.
Add - First Baptist Church to listing. 101 S. College St. Washington PA
Notable locations in Washington: (A) , Brownson House (B) , President's Row (C) , Washington County Courthouse and Jail (D) , Lemoyne House (E) , David Bradford House (F) , Abraham Lincoln Hall (G) , Beau lll Hall (H) , Bica-Ross Hall (I) , Dieter - Porter Life Sciences Building (J) , Doctor Jesse Lazear Chemistry Building (K) , Grover Cleveland Hall (L) , Henry Memorial Center/Natatorium (M) , Honorable Elder W Marshall Hall (N) , Howard J Burnett Center (O) , James Buchanan Hall (P) , James Ross Mellon Hall (Q) , John Adams Hall (R) , John McMillan Hall (S) , Mcllvaine (T) . Display/hide their locations on the map
Churches in Washington include: (A) , Saint Hilary Church (B) , Saint Pauls Church (C) . Display/hide their locations on the map
Parks in Washington include: (1) , Janet L Swanson Tennis Courts (2) , Cameron Stadium (3) , Bull Thistle (4) . Display/hide their locations on the map
Tourist attractions:
Hotels:
Birthplace of: Jerry Sandusky - Retired football player and coach, Rebecca Harding Davis - Journalist, George Parros - Ice hockey player, Absalom Baird - Union Army general and Medal of Honor recipient, Jesse J. White - Politician, William McEntyre Dye - General, Joseph Vance - General, Dan Mozes - College football player, Paul Jacobs (organist) - Organist, Samuel W. Bryant - Navy admiral.
Washington County has a predicted average indoor radon screening level between 2 and 4 pCi/L (pico curies per liter) - Moderate Potential Drinking water stations with addresses in Washington and their reported violations in the past:
LONE PINE COMMUNITY CENTER (Population served: 100, Groundwater):
Past health violations:
MCL, Monthly (TCR) - Between OCT-2011 and DEC-2011, Contaminant: Coliform. Follow-up actions: St Violation/Reminder Notice (FEB-01-2012), St Compliance achieved (FEB-01-2012)
Past monitoring violations:
Monitoring, Source Water (GWR) - Between OCT-09-2011 and NOV-09-2011, Contaminant: E. COLI. Follow-up actions: St Violation/Reminder Notice (DEC-23-2011), St Compliance achieved (DEC-23-2011)
7 routine major monitoring violations
One minor monitoring violation
Population served: 50, Groundwater):
Past health violations:
MCL, Monthly (TCR) - In JUL-2007, Contaminant: Coliform. Follow-up actions: St Public Notif requested (AUG-20-2007), St Public Notif received (AUG-20-2007), St Compliance achieved (AUG-20-2007), St Site Visit (enforcement) (AUG-20-2007)
Average household size: This city:
2.1 peoplePennsylvania:
2.5 people
Percentage of family households: This city:
51.8%Whole state:
65.0%
Percentage of households with unmarried partners: This city:
9.5%Whole state:
6.6%
Likely homosexual households (counted as self-reported same-sex unmarried-partner households)
Lesbian couples: 0.3% of all households Gay men: 0.4% of all households
People in group quarters in Washington in 2010:
799 people in college/university student housing
355 people in local jails and other municipal confinement facilities
118 people in other noninstitutional facilities
94 people in emergency and transitional shelters (with sleeping facilities) for people experiencing homelessness
67 people in group homes intended for adults
42 people in workers' group living quarters and job corps centers
18 people in residential treatment centers for adults
4 people in group homes for juveniles (non-correctional)
People in group quarters in Washington in 2000:
869 people in college dormitories (includes college quarters off campus)
231 people in other noninstitutional group quarters
225 people in local jails and other confinement facilities (including police lockups)
107 people in homes for the mentally retarded
50 people in other group homes
15 people in nursing homes
8 people in homes or halfway houses for drug/alcohol abuse
8 people in homes for the mentally ill
8 people in religious group quarters
Banks with most branches in Washington (2011 data):
Washington Financial Bank: Murtland Avenue Branch, Tylerdale Branch, Franklin Mall Branch, at 77 South Main Street. Info updated 2010/01/04: Bank assets: $844.7 mil, Deposits: $736.8 mil, local headquarters , positive income , Commercial Lending Specialization, 8 total offices
PNC Bank, National Association: Trinity Point Branch, Washington-West Branch, Washington North Branch. Info updated 2012/03/20: Bank assets: $263,309.6 mil, Deposits: $197,343.0 mil, headquarters in Wilmington, DE, positive income , Commercial Lending Specialization, 3085 total offices , Holding Company: Pnc Financial Services Group, Inc., The
Community Bank: Washington Branch at 90 West Chestnut Street, branch established on 1974/03/01; Washington Mall Office Branch at 301 Oak Spring Road, Washington Mall, branch established on 2000/03/20. Info updated 2009/11/19: Bank assets: $533.5 mil, Deposits: $450.9 mil, headquarters in Carmichaels, PA, positive income , Commercial Lending Specialization, 11 total offices , Holding Company: Cb Financial Services, Inc.
Northwest Savings Bank: 1265 West Chestnut Street Branch at 1265 West Chestnut Street, branch established on 1924/01/01; Wal-Mart Superstore Branch at 30 Trinity Point Drive, branch established on 2000/02/24. Info updated 2009/11/23: Bank assets: $7,975.9 mil, Deposits: $5,985.6 mil, headquarters in Warren, PA, positive income , Mortgage Lending Specialization, 172 total offices
Wesbanco Bank, Inc.: Washington Branch at 6 South Main Street, Washington Trust Building, branch established on 2000/06/05; Trinity Point Branch at 1003 Trinity Circle, branch established on 2004/08/02. Info updated 2009/04/02: Bank assets: $5,520.2 mil, Deposits: $4,394.5 mil, headquarters in Wheeling, WV, positive income , Commercial Lending Specialization, 115 total offices , Holding Company: Wesbanco, Inc.
Citizens Bank of Pennsylvania: Washington Mall Giant Eagle Branch at 331 Washington Road, branch established on 1991/04/04; Washington Branch at 40 South Main Street, branch established on 1948/11/22. Info updated 2010/09/24: Bank assets: $32,316.9 mil, Deposits: $25,297.1 mil, headquarters in Philadelphia, PA, positive income , 396 total offices , Holding Company: Uk Financial Investments Limited
First Niagara Bank, National Association: West Beau Street Branch at 200 West Beau Street, branch established on 1901/06/27. Info updated 2011/06/09: Bank assets: $32,750.6 mil, Deposits: $19,595.4 mil, headquarters in Buffalo, NY, positive income , Commercial Lending Specialization, 351 total offices , Holding Company: First Niagara Financial Group, Inc.
Charleroi Federal Savings Bank: Washington Branch at 730 East Beau Street, branch established on 2008/04/28. Info updated 2011/07/21: Bank assets: $568.7 mil, Deposits: $499.0 mil, headquarters in Charleroi, PA, positive income , Mortgage Lending Specialization, 9 total offices
The Huntington National Bank: South Strabane Branch at 590 Washington Road, branch established on 1963/09/16. Info updated 2012/04/02: Bank assets: $54,183.4 mil, Deposits: $44,300.3 mil, headquarters in Columbus, OH, positive income , Commercial Lending Specialization, 878 total offices , Holding Company: Huntington Bancshares Incorporated
5 other banks with 5 local branches
For population 15 years and over in Washington:
Never married: 49.9%Now married: 25.9%Separated: 0.6%Widowed: 6.8%Divorced: 16.8% For population 25 years and over in Washington:
High school or higher: 88.7%Bachelor's degree or higher: 19.4%Graduate or professional degree: 7.5%Unemployed: 7.9%Mean travel time to work (commute): 20.2 minutes
Education Gini index (Inequality in education) Here:
11.1Pennsylvania average:
11.4
Religion statistics for Washington, PA (based on Washington County data)
Religion Adherents Congregations Catholic 53,777 28 Mainline Protestant 28,797 129 Evangelical Protestant 16,871 97 Other 1,459 8 Black Protestant 1,340 11 Orthodox 1,275 7 None 104,301 -
Source: Clifford Grammich, Kirk Hadaway, Richard Houseal, Dale E.Jones, Alexei Krindatch, Richie Stanley and Richard H.Taylor. 2012. 2010 U.S.Religion Census: Religious Congregations & Membership Study. Association of Statisticians of American Religious Bodies. Jones, Dale E., et al. 2002. Congregations and Membership in the United States 2000. Nashville, TN: Glenmary Research Center. Graphs represent county-level data
Food Environment Statistics: Number of grocery stores : 34Here :
1.66 / 10,000 pop.Pennsylvania :
2.04 / 10,000 pop.
Number of supercenters and club stores : 2Washington County :
0.10 / 10,000 pop.State :
0.09 / 10,000 pop.
Number of convenience stores (no gas) : 16Here :
0.78 / 10,000 pop.Pennsylvania :
0.88 / 10,000 pop.
Number of convenience stores (with gas) : 58Here :
2.82 / 10,000 pop.Pennsylvania :
2.52 / 10,000 pop.
Number of full-service restaurants : 119Washington County :
5.79 / 10,000 pop.Pennsylvania :
7.12 / 10,000 pop.
Adult diabetes rate : Here :
10.1%Pennsylvania :
9.1%
Adult obesity rate : This county :
30.9%Pennsylvania :
27.2%
Low-income preschool obesity rate : Washington County :
12.3%Pennsylvania :
11.5%
Health and Nutrition: Healthy diet rate : This city:
50.7%Pennsylvania:
50.2%
Average overall health of teeth and gums : Washington:
47.9%State:
47.1%
Average BMI : This city:
28.7Pennsylvania:
28.7
People feeling badly about themselves : Washington:
19.4%Pennsylvania:
20.8%
People not drinking alcohol at all : Washington:
11.5%Pennsylvania:
10.9%
Average hours sleeping at night : Overweight people : This city:
33.6%Pennsylvania:
34.3%
General health condition : This city:
56.9%Pennsylvania:
56.2%
Average condition of hearing : This city:
78.8%Pennsylvania:
78.3%
More about Health and Nutrition of Washington, PA Residents
Local government employment and payroll (March 2022)
Function
Full-time employees
Monthly full-time payroll
Average yearly full-time wage
Part-time employees
Monthly part-time payroll
Police Protection - Officers
29 $175,383 $72,572 0 $0 Firefighters
23 $137,649 $71,817 0 $0 Streets and Highways
10 $42,695 $51,234 0 $0 Other Government Administration
9 $12,590 $16,787 0 $0 Financial Administration
6 $19,052 $38,104 1 $876 Parks and Recreation
3 $13,427 $53,708 1 $581 Other and Unallocable
2 $7,046 $42,276 2 $796 Police - Other
2 $10,129 $60,774 0 $0
Totals for Government
84 $417,972 $59,710 4 $2,253
Washington government finances - Expenditure in 2017 (per resident):
Construction - Regular Highways: $140,000 ($10.38)
Current Operations - General - Other: $2,490,000 ($184.68)
Police Protection: $2,358,000 ($174.89)Local Fire Protection: $1,509,000 ($111.92)Regular Highways: $1,426,000 ($105.76)Solid Waste Management: $990,000 ($73.43)Parks and Recreation: $457,000 ($33.89)General Public Buildings: $214,000 ($15.87)Housing and Community Development: $208,000 ($15.43)Parking Facilities: $191,000 ($14.17)Financial Administration: $190,000 ($14.09)Central Staff Services: $168,000 ($12.46)Transit Utilities: $133,000 ($9.86)Natural Resources - Other: $100,000 ($7.42)Protective Inspection and Regulation - Other: $92,000 ($6.82)Judicial and Legal Services: $63,000 ($4.67)Libraries: $25,000 ($1.85)General - Interest on Debt: $340,000 ($25.22)
Other Capital Outlay - Housing and Community Development: $826,000 ($61.26)
Police Protection: $67,000 ($4.97)Parks and Recreation: $17,000 ($1.26)Total Salaries and Wages: $4,624,000 ($342.95)
Washington government finances - Revenue in 2017 (per resident):
Charges - Solid Waste Management: $1,095,000 ($81.21)
Other: $511,000 ($37.90)Parking Facilities: $458,000 ($33.97)Parks and Recreation: $128,000 ($9.49)Federal Intergovernmental - Housing and Community Development: $47,000 ($3.49)
Other: $32,000 ($2.37)Local Intergovernmental - Other: $1,202,000 ($89.15)
General Local Government Support: $84,000 ($6.23)Miscellaneous - Fines and Forfeits: $125,000 ($9.27)
General Revenue - Other: $50,000 ($3.71)Special Assessments: $49,000 ($3.63)Interest Earnings: $13,000 ($0.96)Sale of Property: $8,000 ($0.59)Donations From Private Sources: $4,000 ($0.30)Rents: $3,000 ($0.22)State Intergovernmental - Other: $1,211,000 ($89.82)
Highways: $395,000 ($29.30)Housing and Community Development: $84,000 ($6.23)General Local Government Support: $17,000 ($1.26)Tax - Property: $5,173,000 ($383.67)
Individual Income: $4,421,000 ($327.89)Occupation and Business License - Other: $1,493,000 ($110.73)Public Utility License: $231,000 ($17.13)Documentary and Stock Transfer: $91,000 ($6.75)
Washington government finances - Debt in 2017 (per resident):
Long Term Debt - Beginning Outstanding - Unspecified Public Purpose: $13,511,000 ($1002.08)
Outstanding Unspecified Public Purpose: $11,941,000 ($885.63)Retired Unspecified Public Purpose: $2,370,000 ($175.78)Issue, Unspecified Public Purpose: $800,000 ($59.33)
Washington government finances - Cash and Securities in 2017 (per resident):
Bond Funds - Cash and Securities: $653,000 ($48.43)
Other Funds - Cash and Securities: $1,196,000 ($88.70)
Businesses in Washington, PA
Name Count Name Count
7-Eleven 1 Lane Bryant 1 AT&T 2 Lane Furniture 1 Advance Auto Parts 2 LensCrafters 1 Aeropostale 2 Levi Strauss & Co. 1 American Eagle Outfitters 1 Little Caesars Pizza 1 Ann Taylor 1 Long John Silver's 2 Applebee's 1 Lowe's 1 Arby's 1 Macy's 1 Audi 1 Marriott 1 AutoZone 1 MasterBrand Cabinets 6 Banana Republic 1 Mazda 1 Bath & Body Works 2 McDonald's 5 Bed Bath & Beyond 1 Motel 6 1 Brooks Brothers 1 Motherhood Maternity 1 Burger King 2 Nike 8 CVS 1 Nissan 1 Cambria 1 OfficeMax 1 Carson Pirie Scott 1 Old Navy 1 Casual Male XL 1 Outback 1 Chevrolet 1 Outback Steakhouse 1 Chico's 1 Pac Sun 1 Circle K 2 Panera Bread 1 Clarks 1 Papa John's Pizza 1 Comfort Inn 1 Payless 2 Comfort Suites 1 Penske 1 Cracker Barrel 1 PetSmart 1 Cricket Wireless 2 Pier 1 Imports 1 Curves 1 Pizza Hut 2 Dairy Queen 1 Quiznos 1 Days Inn 1 RadioShack 1 Decora Cabinetry 2 Ramada 1 Dennys 1 Red Lobster 1 Domino's Pizza 1 Red Robin 1 DressBarn 2 Red Roof Inn 1 Dressbarn 2 Rite Aid 2 Eddie Bauer 1 Rue21 1 Famous Footwear 1 SAS Shoes 1 Fashion Bug 1 Sam's Club 1 FedEx 11 Sears 2 Finish Line 1 Skechers USA 1 Firestone Complete Auto Care 1 Spencer Gifts 1 Foot Locker 1 Sprint Nextel 1 GNC 2 Staples 1 GameStop 2 Starbucks 1 Gap 1 Subaru 1 Goodwill 3 Subway 5 Gymboree 1 T-Mobile 3 H&R Block 4 T.G.I. Driday's 1 Hilton 1 Taco Bell 1 Holiday Inn 2 Talbots 1 Home Depot 1 Target 1 Honda 1 Toyota 1 Hot Topic 1 Toys"R"Us 1 Hyundai 1 U-Haul 3 IZOD 1 UPS 10 J.Crew 1 Vans 1 JCPenney 2 Verizon Wireless 2 Jones New York 3 Victoria's Secret 1 Journeys 1 Waffle House 2 Justice 1 Walgreens 1 KFC 1 Walmart 1 Kincaid 1 Wendy's 2 Kohl's 1
Strongest AM radio stations in Washington:
WJPA (1450 AM; 1 kW; WASHINGTON, PA; Owner: WASHINGTON BROACASTING COMPANY)
WWCS (540 AM; 5 kW; CANONSBURG, PA; Owner: BIRACH BROADCASTING CORPORATION)
WKZV (1110 AM; daytime; 1 kW; WASHINGTON, PA; Owner: MY-KEY BROADCASTING, INC.)
KDKA (1020 AM; 50 kW; PITTSBURGH, PA; Owner: INFINITY BROADCASTING OPERATIONS, INC.)
WWVA (1170 AM; 53 kW; WHEELING, WV; Owner: CAPSTAR TX LIMITED PARTNERSHIP)
WASP (1130 AM; daytime; 5 kW; BROWNSVILLE, PA; Owner: KEYMARKET LICENSES, LLC)
WPIT (730 AM; 5 kW; PITTSBURGH, PA; Owner: PENNSYLVANIA MEDIA ASSOCIATES, INC.)
WKHB (620 AM; 6 kW; IRWIN, PA; Owner: BROADCAST COMMUNICATIONS, INC.)
WEAE (1250 AM; 5 kW; PITTSBURGH, PA; Owner: ABC, INC.)
WJAS (1320 AM; 6 kW; PITTSBURGH, PA; Owner: RENDA BROADCASTING CORP. OF NEVADA)
WZUM (1590 AM; 4 kW; CARNEGIE, PA; Owner: HORVATH BROADCASTING, L.L.C.)
WBGG (970 AM; 5 kW; PITTSBURGH, PA; Owner: AMFM RADIO LICENSES, L.L.C.)
WPTT (1360 AM; 5 kW; MCKEESPORT, PA; Owner: RENDA BROADCASTING CORPORATION OF NEVADA)
Strongest FM radio stations in Washington:
WJPA-FM (95.3 FM; WASHINGTON, PA; Owner: WASHINGTON BROADCASTING COMPANY)
WNJR (91.7 FM; WASHINGTON, PA; Owner: WASHINGTON AND JEFFERSON COLLEGE)
WOGH (103.5 FM; BURGETTSTOWN, PA; Owner: KEYMARKET LICENSES, LLC)
WSHH (99.7 FM; PITTSBURGH, PA; Owner: RENDA B/CING CORP. OF NEVADA)
WLTJ (92.9 FM; PITTSBURGH, PA; Owner: WPNT, INC.)
WVNP (89.9 FM; WHEELING, WV; Owner: WEST VIRGINIA EDUCATIONAL BROADCASTING AUTHORITY)
WWSW-FM (94.5 FM; PITTSBURGH, PA; Owner: AMFM RADIO LICENSES, L.L.C.)
WDSY-FM (107.9 FM; PITTSBURGH, PA; Owner: INFINITY RADIO SUBSIDIARY OPERATIONS INC.)
WDVE (102.5 FM; PITTSBURGH, PA; Owner: CAPSTAR TX LIMITED PARTNERSHIP)
WJJJ (104.7 FM; PITTSBURGH, PA; Owner: CAPSTAR TX LIMITED PARTNERSHIP)
WOVK (98.7 FM; WHEELING, WV; Owner: CAPSTAR TX LIMITED PARTNERSHIP)
WEGW (107.5 FM; WHEELING, WV; Owner: CAPSTAR TX LIMITED PARTNERSHIP)
WANB-FM (103.1 FM; WAYNESBURG, PA; Owner: BROADCAST COMMUNICATIONS, INC.)
WVPM (90.9 FM; MORGANTOWN, WV; Owner: WEST VIRGINIA EDUCATIONAL BROADCASTING AUTHORITY)
WVBC (88.1 FM; BETHANY, WV; Owner: BETHANY COLLEGE)
WOGG (94.9 FM; OLIVER, PA; Owner: KEYMARKET LICENSES, LLC)
WQED-FM (89.3 FM; PITTSBURGH, PA; Owner: WQED MULTIMEDIA)
WBZZ (93.7 FM; PITTSBURGH, PA; Owner: INFINITY RADIO SUBSIDIARY OPERATIONS INC.)
WKST-FM (96.1 FM; PITTSBURGH, PA; Owner: CAPSTAR TX LIMITED PARTNERSHIP)
WZPT (100.7 FM; NEW KENSINGTON, PA; Owner: INFINITY RADIO SUBSIDIARY OPERATIONS INC.)
TV broadcast stations around Washington:
W20AN (Channel 20; WASHINGTON, PA; Owner: TURNPIKE TELEVISION)
WTOV-TV (Channel 9; STEUBENVILLE, OH; Owner: WTOV-TV HOLDINGS, INC.)
WPXI (Channel 11; PITTSBURGH, PA; Owner: WPXI-TV HOLDINGS, INC.)
WTAE-TV (Channel 4; PITTSBURGH, PA; Owner: WTAE HEARST-ARGYLE TV, INC. (CA CORP.))
WBGN-LP (Channel 59; PITTSBURGH, PA; Owner: BRUNO GOODWORTH NETWORK, INC.)
WPTG-LP (Channel 69; PITTSBURGH, PA; Owner: ABACUS TELEVISION)
W65CG (Channel 65; PITTSBURGH, PA; Owner: TRINITY BROADCASTING NETWORK)
WQEX (Channel 16; PITTSBURGH, PA; Owner: WQED MULTIMEDIA)
KDKA-TV (Channel 2; PITTSBURGH, PA; Owner: CBS BROADCASTING INC.)
WTRF-TV (Channel 7; WHEELING, WV; Owner: WEST VIRGINIA MEDIA HOLDINGS, LLC)
W25CI (Channel 25; STEUBENVILLE, OH; Owner: ABACUS TELEVISION)
W57BH (Channel 57; WEIRTON, WV; Owner: TURNPIKE TELEVISION)
WPGH-TV (Channel 53; PITTSBURGH, PA; Owner: WPGH LICENSEE, LLC)
WPCB-TV (Channel 40; GREENSBURG, PA; Owner: CORNERSTONE TELEVISION, INC.)
WQED (Channel 13; PITTSBURGH, PA; Owner: WQED MULTIMEDIA)
WBPA-LP (Channel 29; PITTSBURGH, PA; Owner: VENTURE TECHNOLOGIES GROUP, LLC)
W61CC (Channel 61; PITTSBURGH, PA; Owner: THE VIDEOHOUSE, INC.)
WCWB (Channel 22; PITTSBURGH, PA; Owner: WCWB LICENSEE, LLC)
WIIC-LP (Channel 29; PITTSBURGH, PA; Owner: ABACUS TELEVISION)
W63AU (Channel 63; PITTSBURGH, PA; Owner: THE BON-TELE NETWORK, INC.)
W26AV (Channel 26; CHARLEROI, PA; Owner: DEBRA GOODWORTH)
WBYD-CA (Channel 35; JOHNSTOWN, PA; Owner: BENJAMIN PEREZ)
Medal of Honor Recipients
Medal of Honor Recipients born in Washington: Absalom Baird, Hugh P. Boon, James W. Huff.
National Bridge Inventory (NBI) Statistics 104 Number of bridges876ft / 267m Total length $30,058,000 Total costs1,108,997 Total average daily traffic237,285 Total average daily truck traffic
New bridges - historical statistics
1 1910-1919 2 1930-1939 2 1940-1949 2 1950-1959 44 1960-1969 1 1970-1979 19 1990-1999 13 2000-2009 20 2010-2019
See full National Bridge Inventory statistics for Washington, PA
Home Mortgage Disclosure Act Aggregated Statistics For Year 2009(Based on 6 full tracts) A) FHA, FSA/RHS & VA B) Conventional C) Refinancings D) Home Improvement Loans E) Loans on Dwellings For 5+ Families F) Non-occupant Loans on G) Loans On Manufactured Number Average Value Number Average Value Number Average Value Number Average Value Number Average Value Number Average Value Number Average Value
LOANS ORIGINATED 40 $95,800 46 $82,217 80 $91,375 23 $21,261 0 $0 21 $54,143 0 $0 APPLICATIONS APPROVED, NOT ACCEPTED 0 $0 5 $51,400 5 $64,000 1 $8,000 0 $0 1 $14,000 2 $72,500 APPLICATIONS DENIED 7 $59,857 12 $47,417 69 $81,797 21 $19,048 2 $50,500 6 $61,000 4 $26,500 APPLICATIONS WITHDRAWN 4 $64,000 6 $176,167 47 $107,681 1 $90,000 0 $0 4 $62,250 0 $0 FILES CLOSED FOR INCOMPLETENESS 1 $42,000 0 $0 9 $67,444 0 $0 0 $0 0 $0 0 $0
Aggregated Statistics For Year 2008(Based on 6 full tracts) A) FHA, FSA/RHS & VA B) Conventional C) Refinancings D) Home Improvement Loans E) Loans on Dwellings For 5+ Families F) Non-occupant Loans on G) Loans On Manufactured Number Average Value Number Average Value Number Average Value Number Average Value Number Average Value Number Average Value Number Average Value
LOANS ORIGINATED 20 $90,900 75 $78,867 83 $74,482 35 $43,714 1 $152,000 40 $83,400 1 $33,000 APPLICATIONS APPROVED, NOT ACCEPTED 1 $94,000 7 $74,143 10 $76,200 4 $11,750 0 $0 3 $65,333 1 $55,000 APPLICATIONS DENIED 8 $87,625 14 $87,929 107 $91,252 45 $41,333 0 $0 16 $45,938 4 $77,000 APPLICATIONS WITHDRAWN 2 $99,000 6 $284,833 23 $107,087 2 $51,000 0 $0 3 $69,333 0 $0 FILES CLOSED FOR INCOMPLETENESS 2 $99,000 1 $72,000 6 $82,667 1 $83,000 0 $0 1 $40,000 0 $0
Aggregated Statistics For Year 2007(Based on 6 full tracts) A) FHA, FSA/RHS & VA B) Conventional C) Refinancings D) Home Improvement Loans E) Loans on Dwellings For 5+ Families F) Non-occupant Loans on G) Loans On Manufactured Number Average Value Number Average Value Number Average Value Number Average Value Number Average Value Number Average Value Number Average Value
LOANS ORIGINATED 16 $87,500 119 $74,555 131 $69,969 44 $29,455 2 $1,202,500 32 $65,812 1 $14,000 APPLICATIONS APPROVED, NOT ACCEPTED 0 $0 9 $65,889 34 $78,059 7 $14,857 0 $0 7 $57,429 2 $115,500 APPLICATIONS DENIED 2 $91,000 30 $79,667 172 $87,163 81 $42,506 0 $0 11 $50,818 7 $43,714 APPLICATIONS WITHDRAWN 0 $0 9 $56,222 46 $103,239 7 $67,143 0 $0 3 $81,000 0 $0 FILES CLOSED FOR INCOMPLETENESS 0 $0 4 $60,250 20 $97,500 0 $0 0 $0 2 $61,500 0 $0
Aggregated Statistics For Year 2006(Based on 6 full tracts) A) FHA, FSA/RHS & VA B) Conventional C) Refinancings D) Home Improvement Loans E) Loans on Dwellings For 5+ Families F) Non-occupant Loans on G) Loans On Manufactured Number Average Value Number Average Value Number Average Value Number Average Value Number Average Value Number Average Value Number Average Value
LOANS ORIGINATED 13 $90,923 181 $71,961 167 $68,192 58 $28,017 3 $8,752,000 79 $57,620 2 $16,000 APPLICATIONS APPROVED, NOT ACCEPTED 1 $87,000 18 $63,167 46 $70,717 5 $29,800 0 $0 8 $54,375 1 $5,000 APPLICATIONS DENIED 2 $79,000 45 $60,222 238 $75,534 55 $46,709 0 $0 36 $64,806 5 $15,000 APPLICATIONS WITHDRAWN 2 $94,000 33 $82,364 87 $79,908 3 $17,333 0 $0 9 $77,000 0 $0 FILES CLOSED FOR INCOMPLETENESS 0 $0 11 $44,091 9 $97,444 0 $0 0 $0 4 $41,750 0 $0
Aggregated Statistics For Year 2005(Based on 6 full tracts) A) FHA, FSA/RHS & VA B) Conventional C) Refinancings D) Home Improvement Loans E) Loans on Dwellings For 5+ Families F) Non-occupant Loans on G) Loans On Manufactured Number Average Value Number Average Value Number Average Value Number Average Value Number Average Value Number Average Value Number Average Value
LOANS ORIGINATED 16 $108,000 182 $76,198 175 $74,451 84 $35,048 4 $189,750 86 $71,547 3 $28,000 APPLICATIONS APPROVED, NOT ACCEPTED 0 $0 24 $55,458 42 $85,524 6 $24,000 1 $55,000 8 $55,625 6 $34,500 APPLICATIONS DENIED 2 $82,500 45 $59,222 257 $80,218 66 $39,030 1 $94,000 33 $41,273 12 $27,333 APPLICATIONS WITHDRAWN 3 $71,333 20 $103,500 146 $90,829 27 $80,296 1 $89,000 13 $88,846 1 $58,000 FILES CLOSED FOR INCOMPLETENESS 0 $0 0 $0 16 $58,125 1 $30,000 0 $0 1 $50,000 0 $0
Aggregated Statistics For Year 2004(Based on 6 full tracts) A) FHA, FSA/RHS & VA B) Conventional C) Refinancings D) Home Improvement Loans E) Loans on Dwellings For 5+ Families F) Non-occupant Loans on G) Loans On Manufactured Number Average Value Number Average Value Number Average Value Number Average Value Number Average Value Number Average Value Number Average Value
LOANS ORIGINATED 8 $80,125 163 $76,963 228 $62,066 67 $41,821 4 $254,000 84 $53,274 2 $25,000 APPLICATIONS APPROVED, NOT ACCEPTED 1 $40,000 19 $77,105 67 $71,209 12 $37,917 2 $525,000 11 $54,545 1 $14,000 APPLICATIONS DENIED 3 $75,667 32 $92,750 275 $74,251 81 $19,198 3 $683,333 50 $41,920 8 $51,875 APPLICATIONS WITHDRAWN 6 $104,833 30 $124,500 133 $75,128 8 $44,875 0 $0 10 $64,200 0 $0 FILES CLOSED FOR INCOMPLETENESS 1 $116,000 6 $104,500 39 $87,872 3 $62,667 0 $0 2 $34,000 0 $0
Aggregated Statistics For Year 2003(Based on 6 full tracts) A) FHA, FSA/RHS & VA B) Conventional C) Refinancings D) Home Improvement Loans E) Loans on Dwellings For 5+ Families F) Non-occupant Loans on Number Average Value Number Average Value Number Average Value Number Average Value Number Average Value Number Average Value
LOANS ORIGINATED 19 $77,842 103 $77,553 323 $63,929 64 $24,094 2 $199,000 71 $49,789 APPLICATIONS APPROVED, NOT ACCEPTED 4 $49,750 18 $68,611 101 $71,386 16 $18,062 0 $0 13 $35,769 APPLICATIONS DENIED 0 $0 31 $56,710 254 $67,461 57 $19,491 1 $217,000 26 $43,500 APPLICATIONS WITHDRAWN 1 $74,000 17 $80,118 100 $78,850 7 $10,714 0 $0 9 $47,444 FILES CLOSED FOR INCOMPLETENESS 0 $0 3 $56,667 17 $71,647 1 $45,000 0 $0 2 $42,500
Aggregated Statistics For Year 2002(Based on 6 full tracts) A) FHA, FSA/RHS & VA B) Conventional C) Refinancings D) Home Improvement Loans E) Loans on Dwellings For 5+ Families F) Non-occupant Loans on Number Average Value Number Average Value Number Average Value Number Average Value Number Average Value Number Average Value
LOANS ORIGINATED 14 $63,786 106 $64,736 238 $62,706 38 $25,947 1 $92,000 42 $55,881 APPLICATIONS APPROVED, NOT ACCEPTED 1 $57,000 24 $44,000 102 $55,569 11 $22,818 2 $74,500 15 $45,400 APPLICATIONS DENIED 4 $53,500 50 $49,680 241 $60,647 49 $22,408 0 $0 22 $44,909 APPLICATIONS WITHDRAWN 2 $80,000 10 $110,300 95 $71,937 7 $10,286 0 $0 5 $60,400 FILES CLOSED FOR INCOMPLETENESS 0 $0 9 $49,333 34 $57,353 2 $42,500 0 $0 4 $38,750
Aggregated Statistics For Year 2001(Based on 6 full tracts) A) FHA, FSA/RHS & VA B) Conventional C) Refinancings D) Home Improvement Loans E) Loans on Dwellings For 5+ Families F) Non-occupant Loans on Number Average Value Number Average Value Number Average Value Number Average Value Number Average Value Number Average Value
LOANS ORIGINATED 21 $67,714 119 $57,378 257 $58,280 60 $22,800 2 $147,500 50 $60,780 APPLICATIONS APPROVED, NOT ACCEPTED 3 $62,000 15 $34,533 77 $52,455 17 $12,824 0 $0 6 $47,000 APPLICATIONS DENIED 0 $0 72 $36,389 226 $58,699 57 $18,386 0 $0 20 $37,850 APPLICATIONS WITHDRAWN 3 $41,333 9 $60,222 97 $60,021 16 $12,750 0 $0 8 $45,750 FILES CLOSED FOR INCOMPLETENESS 0 $0 2 $47,000 23 $58,348 0 $0 0 $0 1 $46,000
Aggregated Statistics For Year 2000(Based on 6 full tracts) A) FHA, FSA/RHS & VA B) Conventional C) Refinancings D) Home Improvement Loans E) Loans on Dwellings For 5+ Families F) Non-occupant Loans on Number Average Value Number Average Value Number Average Value Number Average Value Number Average Value Number Average Value
LOANS ORIGINATED 25 $57,400 98 $51,184 144 $52,194 68 $17,868 1 $137,000 38 $47,737 APPLICATIONS APPROVED, NOT ACCEPTED 2 $40,000 13 $48,231 69 $58,043 26 $21,038 0 $0 4 $111,000 APPLICATIONS DENIED 0 $0 86 $36,849 213 $56,221 67 $16,970 1 $20,000 19 $56,684 APPLICATIONS WITHDRAWN 3 $48,000 10 $52,500 76 $48,697 13 $19,769 1 $212,000 3 $47,667 FILES CLOSED FOR INCOMPLETENESS 0 $0 3 $101,667 27 $67,444 3 $27,000 0 $0 1 $32,000
Aggregated Statistics For Year 1999(Based on 6 full tracts) A) FHA, FSA/RHS & VA B) Conventional C) Refinancings D) Home Improvement Loans E) Loans on Dwellings For 5+ Families F) Non-occupant Loans on Number Average Value Number Average Value Number Average Value Number Average Value Number Average Value Number Average Value
LOANS ORIGINATED 30 $57,069 118 $46,458 206 $52,648 69 $19,334 1 $10,800 54 $39,892 APPLICATIONS APPROVED, NOT ACCEPTED 1 $44,350 25 $43,623 93 $43,225 20 $16,250 0 $0 10 $35,415 APPLICATIONS DENIED 6 $48,483 85 $38,219 226 $52,120 64 $18,623 0 $0 19 $43,873 APPLICATIONS WITHDRAWN 1 $75,370 15 $65,113 91 $49,906 21 $39,710 0 $0 5 $42,402 FILES CLOSED FOR INCOMPLETENESS 1 $5,850 11 $57,147 16 $53,514 0 $0 0 $0 0 $0
Detailed HMDA statistics for the following Tracts:
7041.00
, 7542.00 , 7543.00 , 7544.00 , 7545.00 , 7546.00
Private Mortgage Insurance Companies Aggregated Statistics For Year 2009(Based on 5 full tracts) A) Conventional B) Refinancings Number Average Value Number Average Value
LOANS ORIGINATED 5 $96,200 4 $100,500 APPLICATIONS APPROVED, NOT ACCEPTED 4 $163,750 2 $93,000 APPLICATIONS DENIED 0 $0 0 $0 APPLICATIONS WITHDRAWN 1 $97,000 1 $133,000 FILES CLOSED FOR INCOMPLETENESS 0 $0 0 $0
Aggregated Statistics For Year 2008(Based on 5 full tracts) A) Conventional B) Refinancings C) Non-occupant Loans on Number Average Value Number Average Value Number Average Value
LOANS ORIGINATED 16 $88,125 5 $94,800 0 $0 APPLICATIONS APPROVED, NOT ACCEPTED 2 $92,500 1 $122,000 0 $0 APPLICATIONS DENIED 3 $73,333 0 $0 2 $68,000 APPLICATIONS WITHDRAWN 0 $0 0 $0 0 $0 FILES CLOSED FOR INCOMPLETENESS 2 $58,000 0 $0 1 $78,000
Aggregated Statistics For Year 2007(Based on 5 full tracts) A) Conventional B) Refinancings C) Non-occupant Loans on D) Loans On Manufactured Number Average Value Number Average Value Number Average Value Number Average Value
LOANS ORIGINATED 36 $72,917 13 $98,000 1 $51,000 0 $0 APPLICATIONS APPROVED, NOT ACCEPTED 2 $94,000 3 $98,000 0 $0 1 $139,000 APPLICATIONS DENIED 1 $85,000 0 $0 0 $0 0 $0 APPLICATIONS WITHDRAWN 2 $101,000 1 $113,000 0 $0 0 $0 FILES CLOSED FOR INCOMPLETENESS 0 $0 0 $0 0 $0 0 $0
Aggregated Statistics For Year 2006(Based on 5 full tracts) A) Conventional B) Refinancings C) Non-occupant Loans on Number Average Value Number Average Value Number Average Value
LOANS ORIGINATED 15 $80,600 8 $105,875 3 $46,000 APPLICATIONS APPROVED, NOT ACCEPTED 4 $114,000 1 $59,000 1 $59,000 APPLICATIONS DENIED 0 $0 0 $0 0 $0 APPLICATIONS WITHDRAWN 0 $0 1 $111,000 0 $0 FILES CLOSED FOR INCOMPLETENESS 0 $0 0 $0 0 $0
Aggregated Statistics For Year 2005(Based on 6 full tracts) A) Conventional B) Refinancings C) Non-occupant Loans on Number Average Value Number Average Value Number Average Value
LOANS ORIGINATED 37 $68,027 10 $90,100 7 $73,429 APPLICATIONS APPROVED, NOT ACCEPTED 2 $72,500 3 $91,667 0 $0 APPLICATIONS DENIED 0 $0 1 $135,000 0 $0 APPLICATIONS WITHDRAWN 1 $17,000 2 $110,500 0 $0 FILES CLOSED FOR INCOMPLETENESS 0 $0 0 $0 0 $0
Aggregated Statistics For Year 2004(Based on 6 full tracts) A) Conventional B) Refinancings C) Non-occupant Loans on Number Average Value Number Average Value Number Average Value
LOANS ORIGINATED 41 $66,390 11 $82,000 7 $50,000 APPLICATIONS APPROVED, NOT ACCEPTED 8 $107,125 5 $103,200 0 $0 APPLICATIONS DENIED 1 $44,000 0 $0 1 $44,000 APPLICATIONS WITHDRAWN 1 $16,000 1 $99,000 0 $0 FILES CLOSED FOR INCOMPLETENESS 0 $0 1 $53,000 0 $0
Aggregated Statistics For Year 2003(Based on 6 full tracts) A) Conventional B) Refinancings C) Non-occupant Loans on Number Average Value Number Average Value Number Average Value
LOANS ORIGINATED 37 $72,703 23 $76,826 5 $45,000 APPLICATIONS APPROVED, NOT ACCEPTED 8 $84,375 10 $66,500 1 $122,000 APPLICATIONS DENIED 0 $0 3 $50,667 3 $50,667 APPLICATIONS WITHDRAWN 3 $75,667 3 $100,000 1 $33,000 FILES CLOSED FOR INCOMPLETENESS 0 $0 0 $0 0 $0
Aggregated Statistics For Year 2002(Based on 6 full tracts) A) Conventional B) Refinancings C) Non-occupant Loans on Number Average Value Number Average Value Number Average Value
LOANS ORIGINATED 39 $79,718 22 $80,091 2 $52,000 APPLICATIONS APPROVED, NOT ACCEPTED 7 $45,857 4 $66,750 2 $30,000 APPLICATIONS DENIED 0 $0 1 $72,000 0 $0 APPLICATIONS WITHDRAWN 1 $188,000 0 $0 0 $0 FILES CLOSED FOR INCOMPLETENESS 0 $0 0 $0 0 $0
Aggregated Statistics For Year 2001(Based on 5 full tracts) A) Conventional B) Refinancings C) Non-occupant Loans on Number Average Value Number Average Value Number Average Value
LOANS ORIGINATED 34 $63,794 22 $70,818 5 $39,200 APPLICATIONS APPROVED, NOT ACCEPTED 7 $48,286 6 $64,333 3 $58,333 APPLICATIONS DENIED 3 $47,333 1 $57,000 4 $49,750 APPLICATIONS WITHDRAWN 3 $42,667 0 $0 2 $29,500 FILES CLOSED FOR INCOMPLETENESS 0 $0 0 $0 0 $0
Aggregated Statistics For Year 2000(Based on 6 full tracts) A) Conventional B) Refinancings C) Non-occupant Loans on Number Average Value Number Average Value Number Average Value
LOANS ORIGINATED 30 $63,500 11 $57,636 3 $34,667 APPLICATIONS APPROVED, NOT ACCEPTED 9 $63,556 3 $98,333 0 $0 APPLICATIONS DENIED 0 $0 1 $36,000 0 $0 APPLICATIONS WITHDRAWN 2 $32,500 0 $0 0 $0 FILES CLOSED FOR INCOMPLETENESS 0 $0 0 $0 0 $0
Aggregated Statistics For Year 1999(Based on 6 full tracts) A) Conventional B) Refinancings C) Non-occupant Loans on Number Average Value Number Average Value Number Average Value
LOANS ORIGINATED 31 $52,919 11 $64,135 5 $36,564 APPLICATIONS APPROVED, NOT ACCEPTED 1 $58,190 2 $46,015 0 $0 APPLICATIONS DENIED 3 $41,817 0 $0 1 $14,780 APPLICATIONS WITHDRAWN 1 $35,480 1 $101,440 1 $35,480 FILES CLOSED FOR INCOMPLETENESS 0 $0 0 $0 0 $0
Detailed PMIC statistics for the following Tracts:
7041.00
, 7542.00 , 7543.00 , 7544.00 , 7545.00 , 7546.00 Fire-safe hotels and motels in Washington, Pennsylvania:
Interstate Hotel, 1396 W Chestnut St, Washington, Pennsylvania 15301 Phone: (724) 225-9900
Red Roof Inn, 1399 W Chestnut St, Washington, Pennsylvania 15301 Phone: (412) 228-5750, Fax: (412) 228-5865
Ramada Inn, 1170 W Chestnut St, Washington, Pennsylvania 15301 Phone: (724) 225-9750, Fax: (724) 223-2912
Motel 6, 1283 Motel 6 Dr, Washington, Pennsylvania 15301 Phone: (724) 223-8040, Fax: (724) 228-6445
Comfort Inn Meadowlands, 237 Meadowlands Blvd, Washington, Pennsylvania 15301 Phone: (724) 746-9700, Fax: (724) 746-9706
Doubletree by Hilton Pittsburgh - Meadowlands, 340 Racetrack Rd, Washington, Pennsylvania 15301 Phone: (724) 222-6200, Fax: (724) 228-0709
Washington Hampton Inn, 119 Murtland Ave, Washington, Pennsylvania 15301 Phone: (724) 228-4100, Fax: (724) 228-0309
Comfort Suites, 2110 N Franklin Dr, Washington, Pennsylvania 15301 Phone: (724) 884-0299, Fax: (724) 884-0275
12 other hotels and motels
All 20 fire-safe hotels and motels in Washington, Pennsylvania Washington compared to Pennsylvania state average:
Median household income below state average. Median house value below state average. Unemployed percentage below state average. Hispanic race population percentage below state average. Foreign-born population percentage significantly below state average. Renting percentage above state average. Length of stay since moving in above state average. Washington on our top lists :
#74 on the list of "Top 101 cities with the largest percentage of people in dormitories (population 1,000+)"
#74 on the list of "Top 101 cities with the largest percentage of people in group homes (population 1,000+)"
#74 on the list of "Top 101 cities with the largest percentage of people in hospitals/wards, hospices, and schools for the handicapped (population 1,000+)"
#74 on the list of "Top 101 cities with the largest percentage of people in long-term care (population 1,000+)"
#74 on the list of "Top 101 cities with the largest percentage of people in military quarters (population 1,000+)"
#74 on the list of "Top 101 cities with the largest percentage of people in noninstitutionalized settings (population 1,000+)"
#74 on the list of "Top 101 cities with the largest percentage of people in on base quarters (population 1,000+)"
#74 on the list of "Top 101 cities with the largest percentage of people in schools, hospitals, or wards for the physically handicapped (population 1,000+)"
#81 on the list of "Top 101 cities with the largest percentage of people in wards in military hospitals for patients who have no usual home elsewhere (population 1,000+)"
#89 on the list of "Top 101 cities with the largest percentage of people in military disciplinary barracks (population 1,000+)"
#91 on the list of "Top 101 cities with the largest percentage of people in military hospitals or wards for chronically ill (population 1,000+)"
#93 on the list of "Top 101 cities with the largest percentage of people in institutions for the deaf (population 1,000+)"
#96 on the list of "Top 101 cities with the largest percentage of people in crews of maritime vessels (population 1,000+)"
#97 on the list of "Top 101 cities with the largest percentage of people in institutions for the blind (population 1,000+)"
#10 on the list of "Top 101 counties with the lowest ground withdrawal of fresh water for public supply (pop. 50,000+)"
#14 on the list of "Top 101 counties with the highest Sulfur Oxides Annual air pollution readings in 2012 (µg/m3 )"
#21 on the list of "Top 101 counties with the lowest percentage of residents relocating to foreign countries in 2011 (pop. 50,000+)"
#37 on the list of "Top 101 counties with the lowest number of births per 1000 residents 2007-2013"
#54 on the list of "Top 101 counties with the lowest percentage of residents relocating to other counties in 2011 (pop. 50,000+)"
Top Patent Applicants
Jeffrey D. Taft (16)
George E. Sakoske (9)
Joseph M. Fink (8)
Joseph E. Sarver (4)
Lena Elizabeth Sturgeon (4)
Jason D. Lalli (4)
David M. Stotka (3)
Terry J. Detrie (3)
Francisco Jose Cidral-Filho (3)
John J. Mccosby (3)
Total of 103 patent applications in 2008-2024.
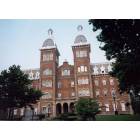
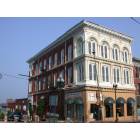

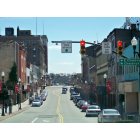
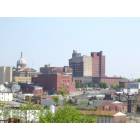
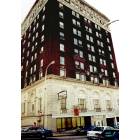
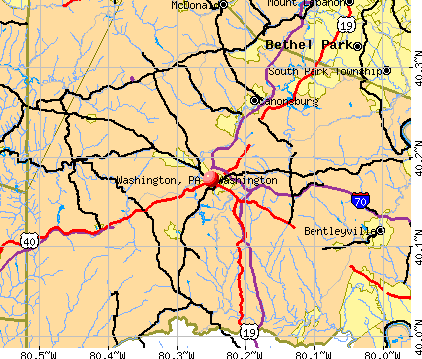


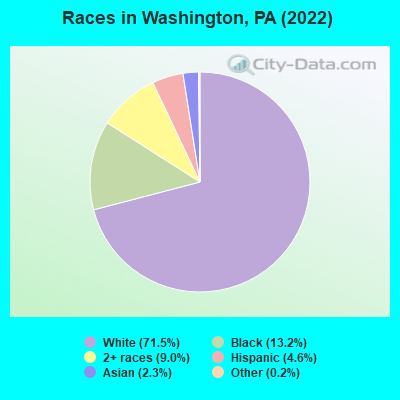
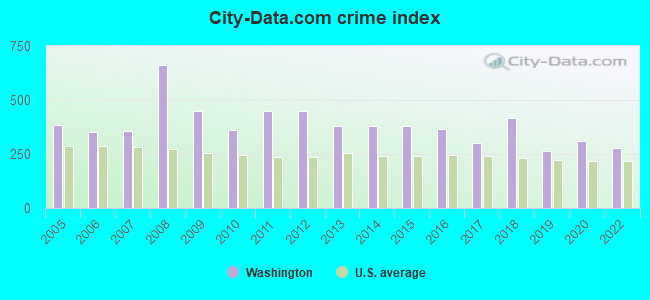
 Recent articles from our blog. Our writers, many of them Ph.D. graduates or candidates, create easy-to-read articles on a wide variety of topics.

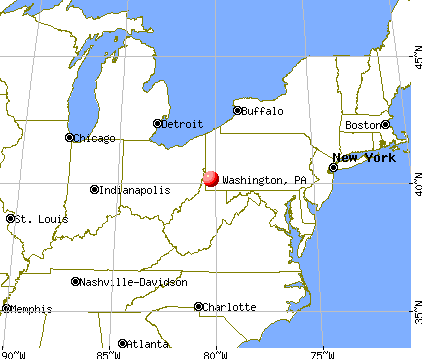
 (23.4 miles
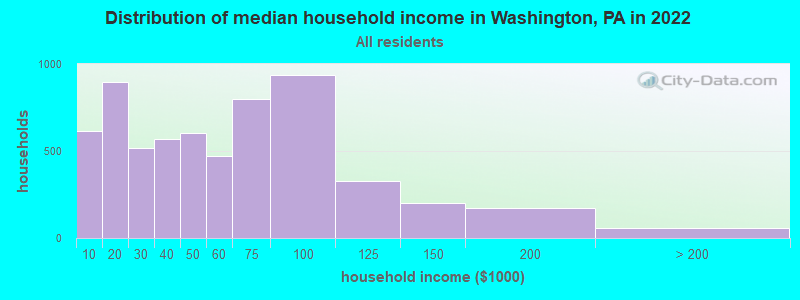
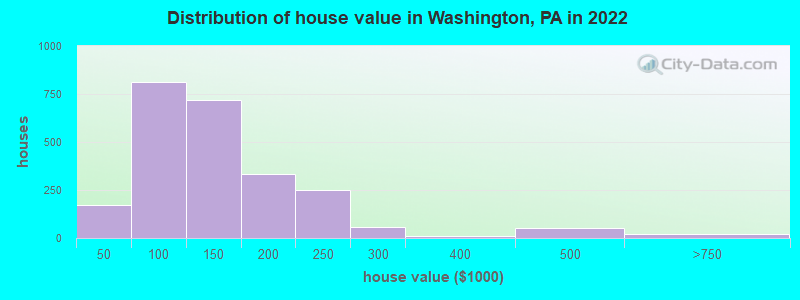

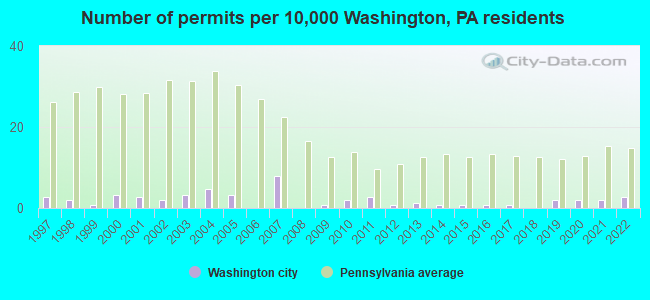
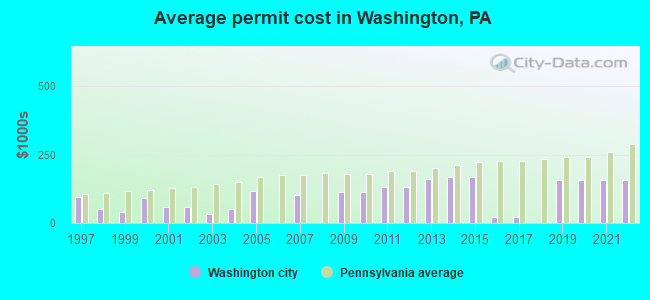
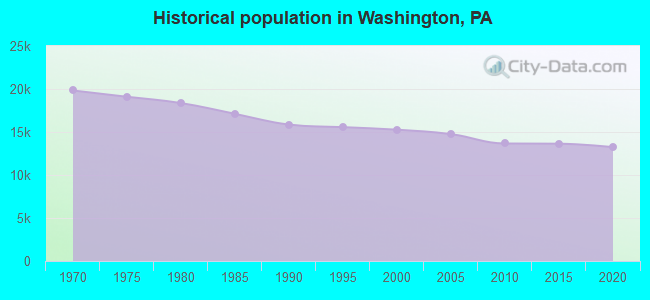
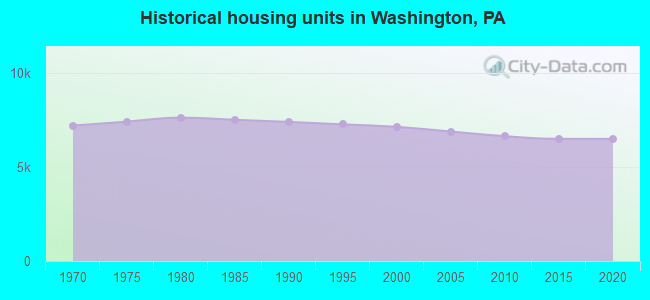
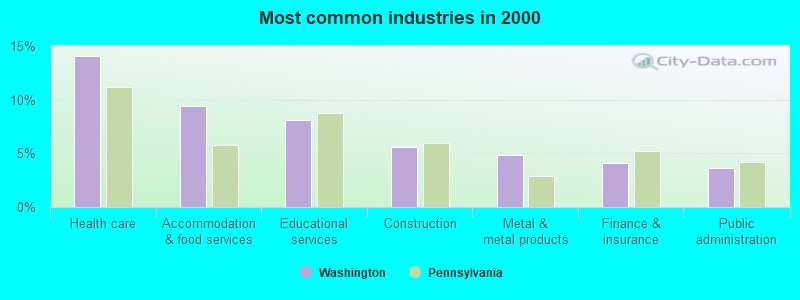
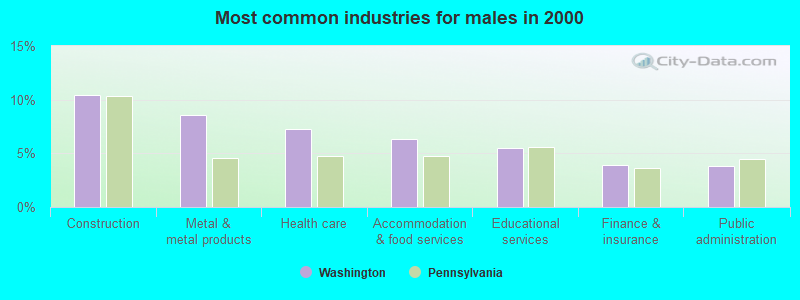
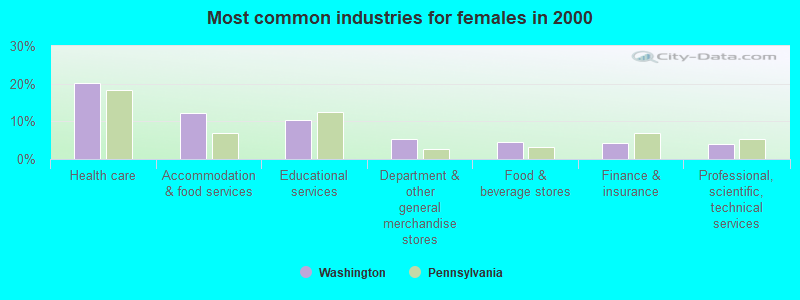
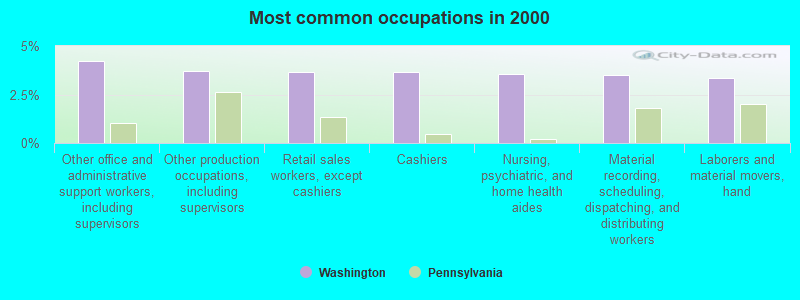
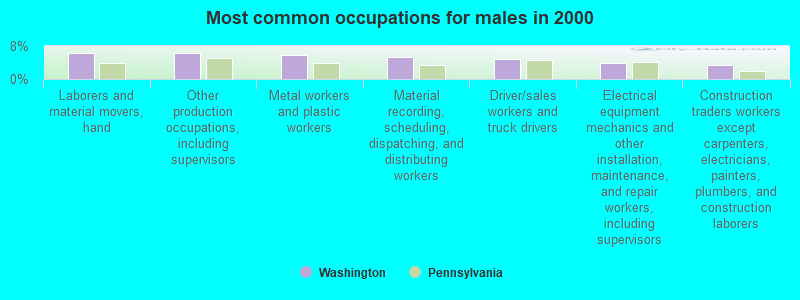
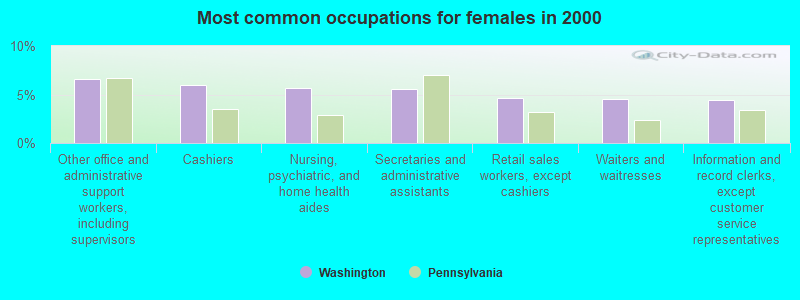
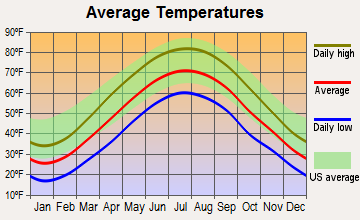
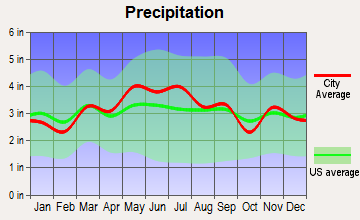
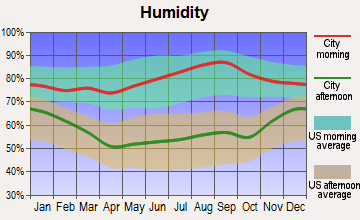
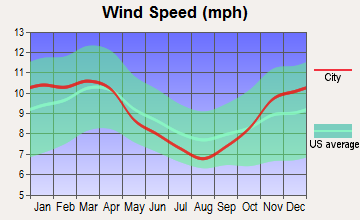
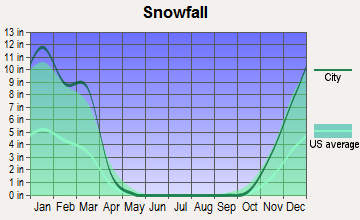
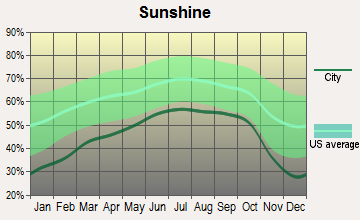
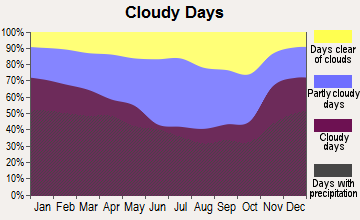
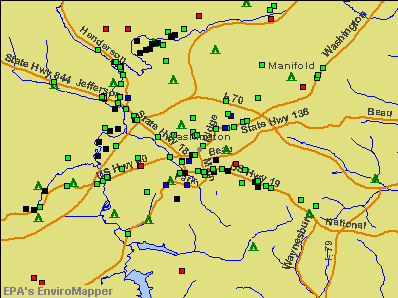

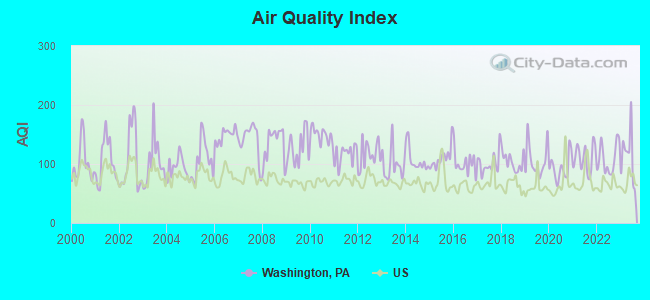
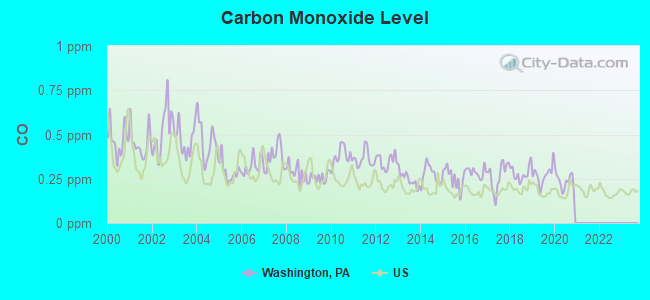

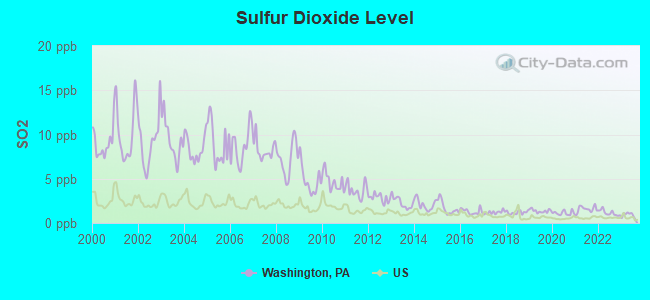
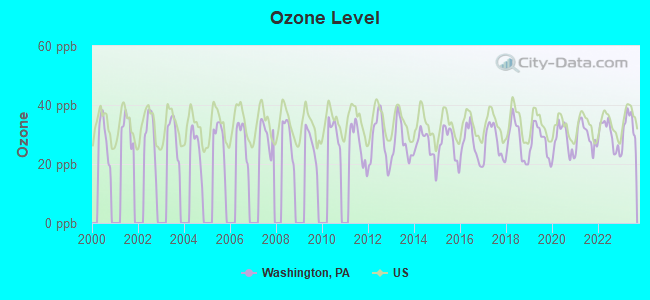
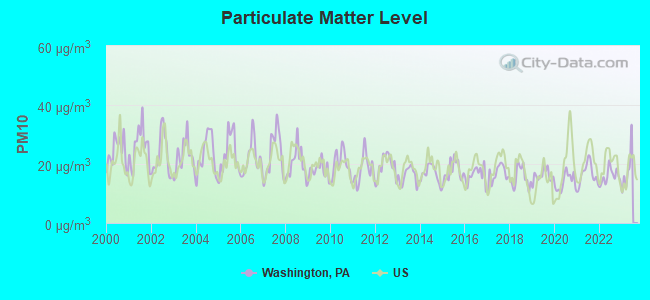
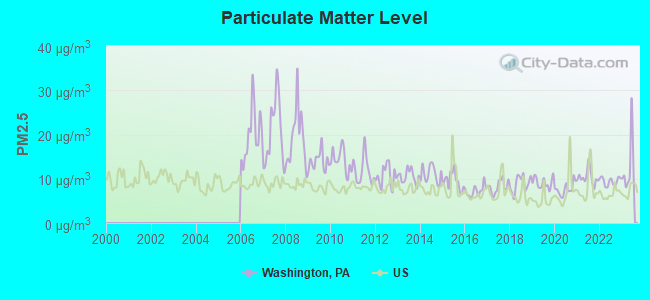
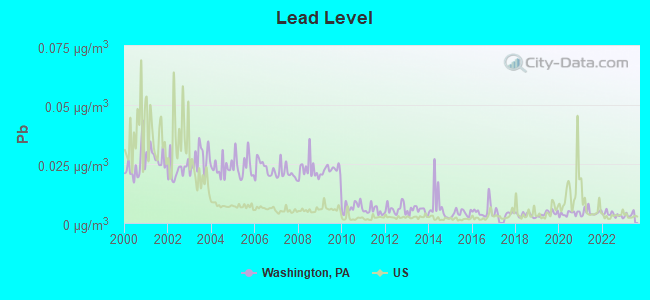
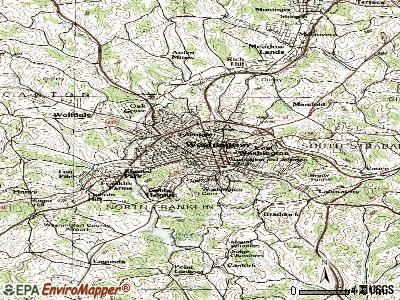
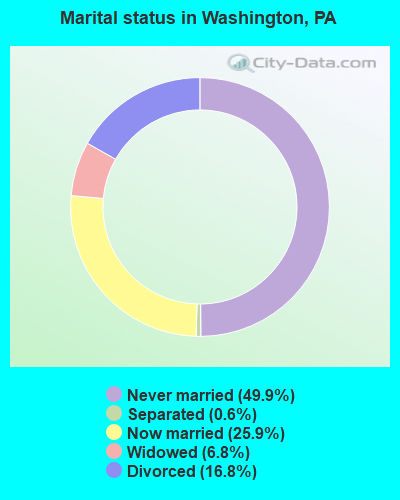
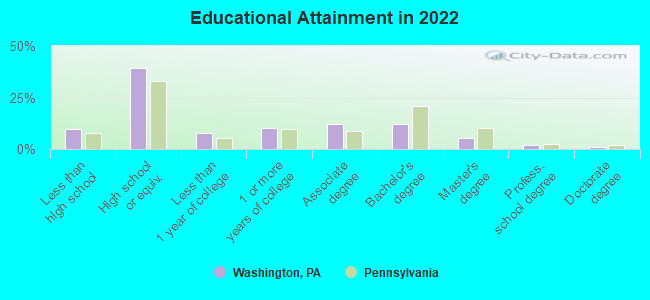
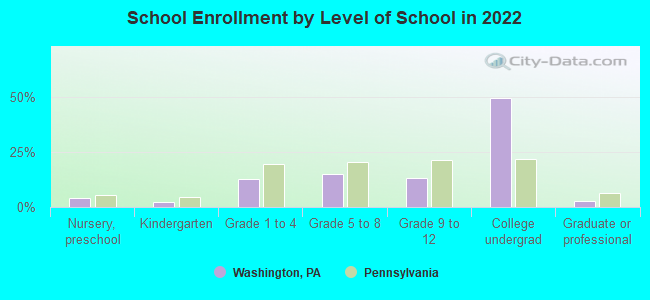
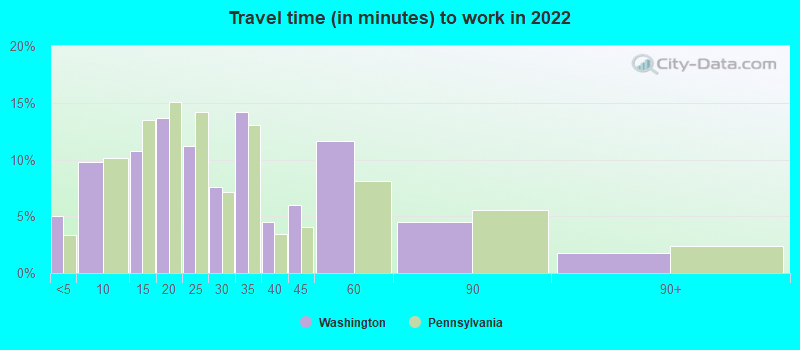
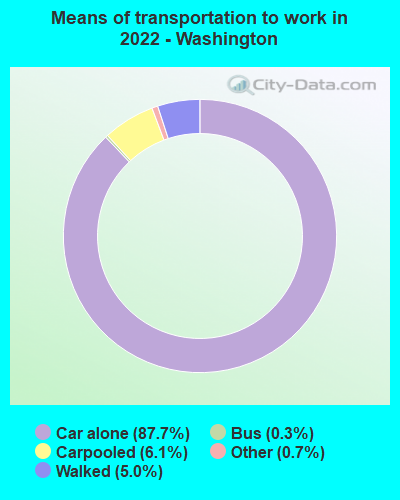

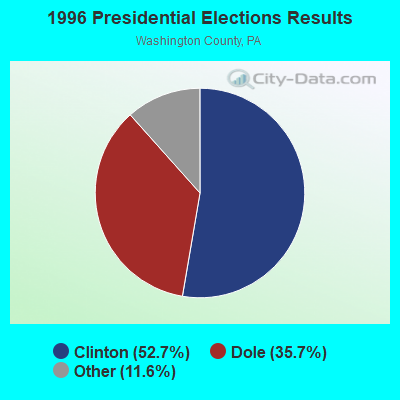
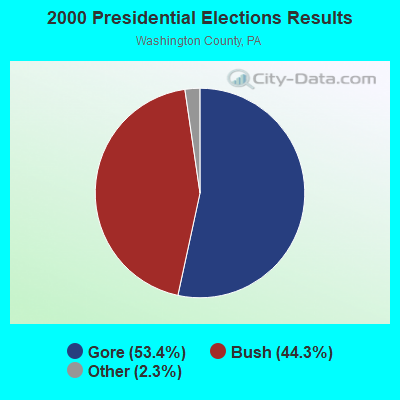
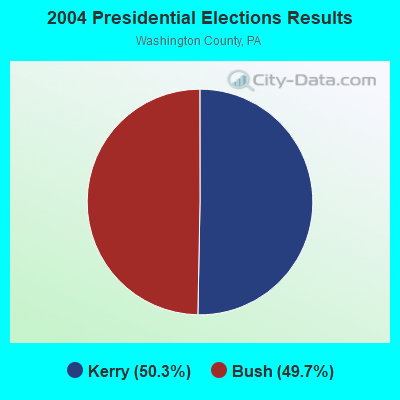
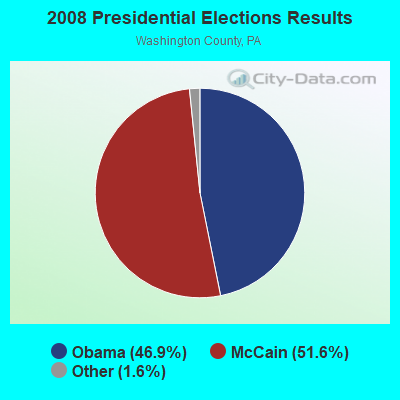
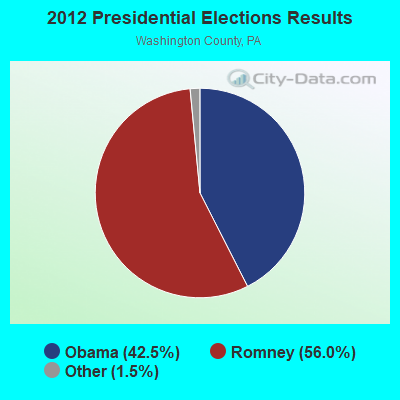
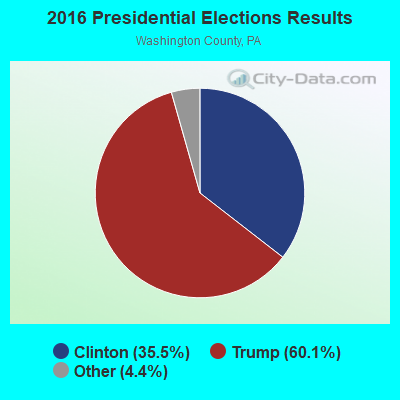
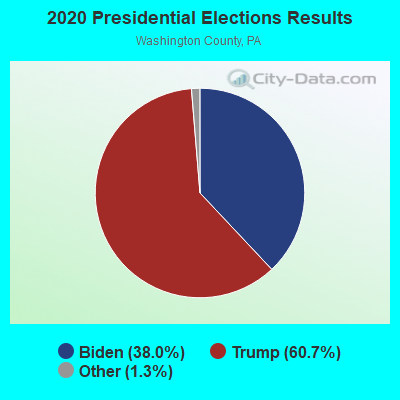
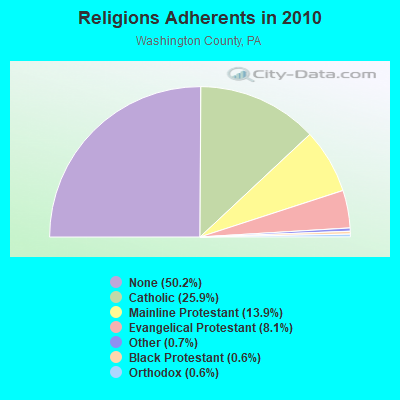
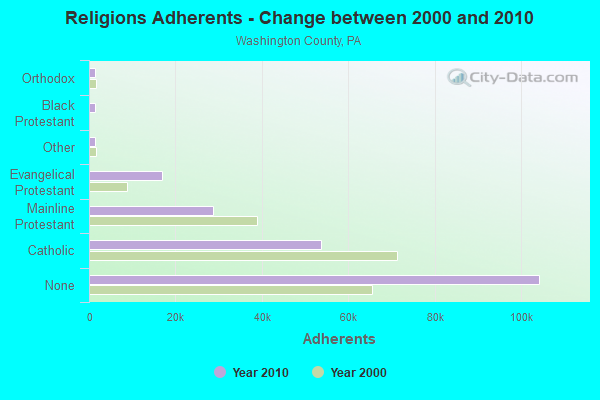
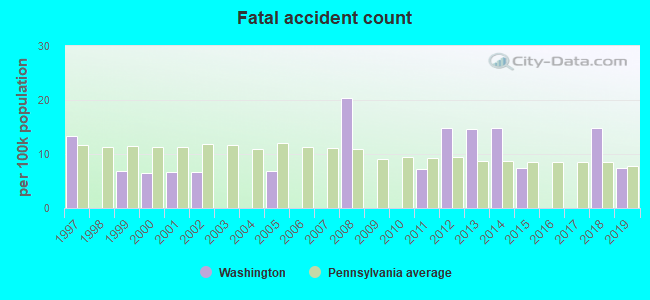
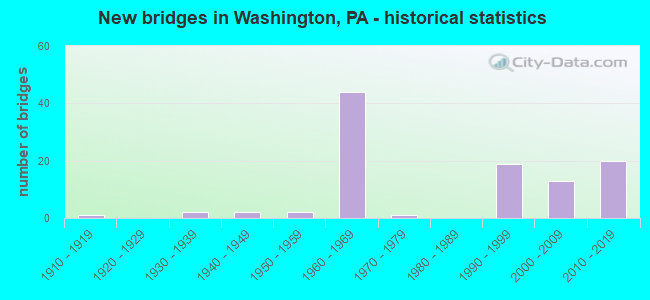
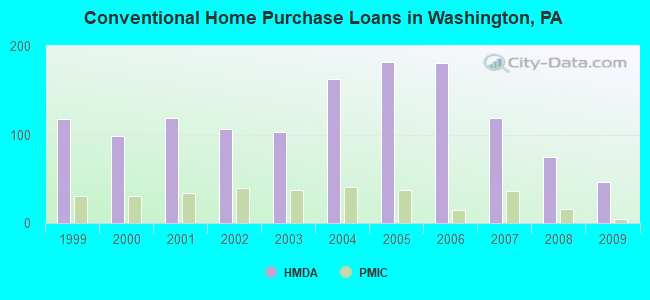
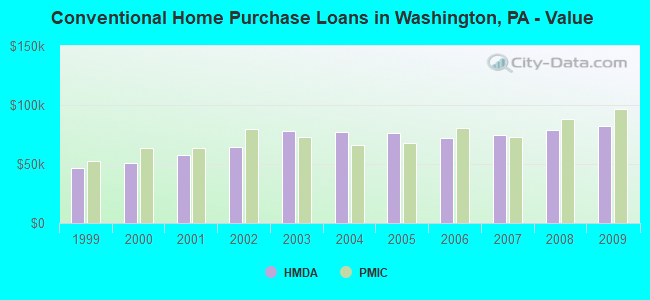
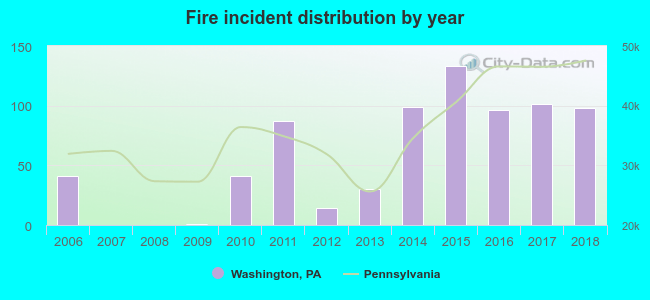 Based on the data from the years 2006 - 2018 the average number of fire incidents per year is 57. The highest number of reported fires - 133 took place in 2015, and the least - 0 in 2007. The data has an increasing trend.
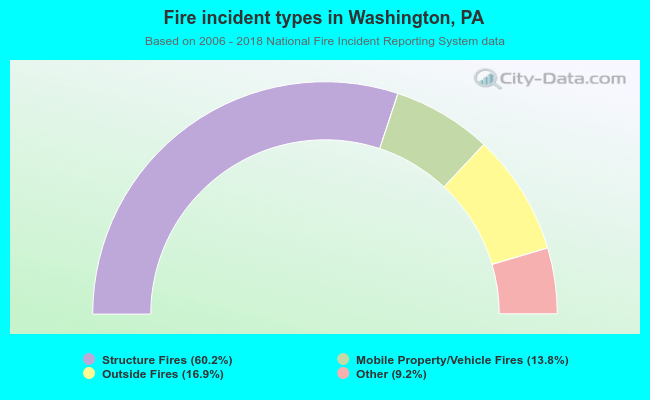 When looking into fire subcategories, the most reports belonged to: Structure Fires (60.2%), and Outside Fires (16.9%).