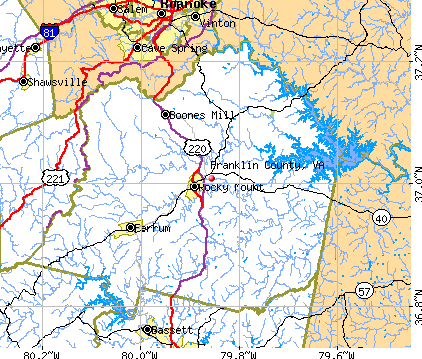
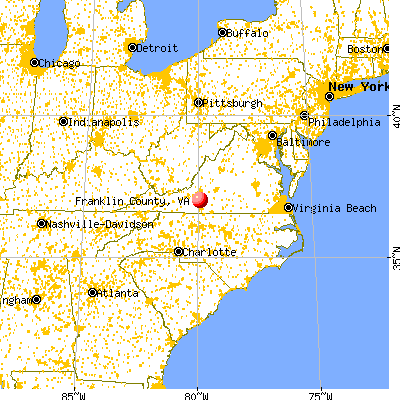
Franklin County, Virginia (VA)
County owner-occupied free and clear houses and condos in 2010: 7,130
County owner-occupied houses and condos in 2000: 15,398
Renter-occupied apartments: 4,906 (it was 3,565 in 2000)
| % of renters here: | 19% |
| State: | 33% |
Land area: 692 sq. mi.
Water area: 19.5 sq. mi.
Population density: 80 people per square mile (average).
Industries providing employment: Educational, health and social services (24.7%), Manufacturing (13.0%), Retail trade (12.2%).
Type of workers:
- Private wage or salary: 80%
- Government: 14%
- Self-employed, not incorporated: 6%
- Unpaid family work: 0%
- OSM Map
- General Map
- Google Map
- MSN Map

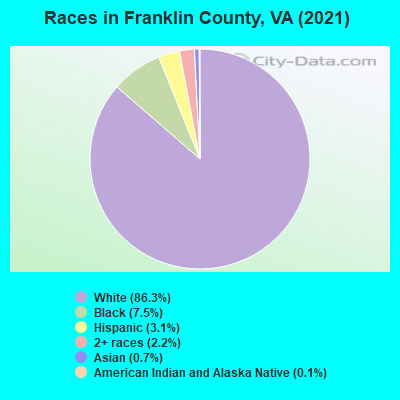
- 46,82586.1%White Non-Hispanic Alone
- 4,1987.7%Black Non-Hispanic Alone
- 1,7153.2%Hispanic or Latino
- 1,2532.3%Two or more races
- 3620.7%Asian alone
- 220.04%American Indian and Alaska Native alone
- 200.04%Some other race alone
- 60.01%Native Hawaiian and Other
Pacific Islander alone
| Median resident age: | 48.8 years |
| Virginia median age: | 39.0 years |
| Males: 27,340 | |
| Females: 27,873 |

 | Lobelia Va ( a "town" ) (11 replies) |
| Thinking of Moving to Western Virgina (18 replies) |
| Well there goes deschutes... (51 replies) |
| New film "Lawless" set in Franklin County, VA (3 replies) |
| Moonshine Capital Franklin County VA (5 replies) |
| What is "Nova?" (23 replies) |
| Franklin County: | 2.0 people |
| Virginia: | 3 people |
Estimated median household income in 2022: $65,229 ($38,056 in 1999)
| This county: | $65,229 |
| Virginia: | $85,873 |
Median contract rent in 2022 for apartments: $621 (lower quartile is $471, upper quartile is $798)
| This county: | $621 |
| State: | $1270 |
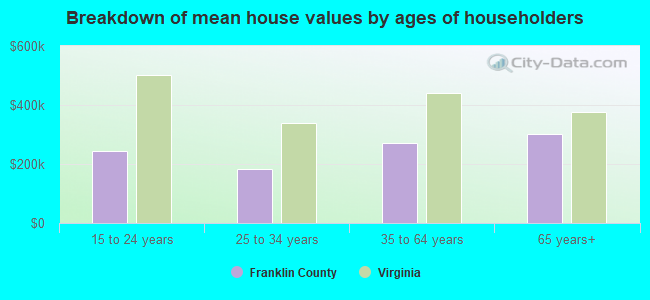
Estimated median house or condo value in 2022: $223,531 (it was $95,300 in 2000)
| Franklin: | $223,531 |
| Virginia: | $365,700 |
Mean price in 2022:
Median monthly housing costs for homes and condos with a mortgage: $1,242Detached houses: $326,137
Here: $326,137 State: $472,865 Townhouses or other attached units: $541,205
Here: $541,205 State: $457,437 In 2-unit structures: $312,809
Here: $312,809 State: $396,289 In 3-to-4-unit structures: $557,334
Here: $557,334 State: $252,346 In 5-or-more-unit structures: $441,848
Here: $441,848 State: $382,551 Mobile homes: $134,688
Here: $134,688 State: $100,736
Median monthly housing costs for units without a mortgage: $369
Institutionalized population: 312
Crime in 2021 (reported by the sheriff's office or county police, not the county total):
- Murders: 6
- Rapes: 19
- Robberies: 1
- Assaults: 35
- Burglaries: 55
- Thefts: 316
- Auto thefts: 74
Crime in 2020 (reported by the sheriff's office or county police, not the county total):
- Murders: 7
- Rapes: 11
- Robberies: 3
- Assaults: 45
- Burglaries: 62
- Thefts: 366
- Auto thefts: 68
Health of residents in Franklin County based on CDC Behavioral Risk Factor Surveillance System Survey Questionnaires from 2013 to 2021:
General health status score of residents in this county from 1 (poor) to 5 (excellent) is 3.4. This is about average.72.7% of residents exercised in the past month. This is about average.
43.5% of residents smoked 100+ cigarettes in their lives. This is about average.
47.1% of adult residents drank alcohol in the past 30 days. This is less than average.
74.4% of residents visited a dentist within the past year. This is about average.
Average weight of males is 196 pounds. This is about average.
Average weight of females is 163 pounds. This is about average.
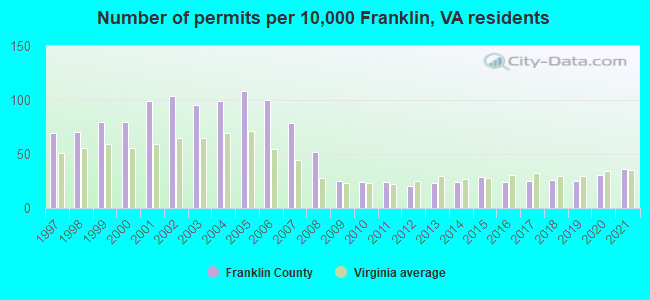
Single-family new house construction building permits:
- 2022: 152 buildings, average cost: $383,800
- 2021: 169 buildings, average cost: $347,200
- 2020: 147 buildings, average cost: $347,200
- 2019: 117 buildings, average cost: $347,200
- 2018: 122 buildings, average cost: $313,900
- 2017: 119 buildings, average cost: $290,000
- 2016: 113 buildings, average cost: $318,800
- 2015: 138 buildings, average cost: $279,300
- 2014: 112 buildings, average cost: $261,600
- 2013: 111 buildings, average cost: $262,700
- 2012: 95 buildings, average cost: $239,300
- 2011: 114 buildings, average cost: $264,900
- 2010: 115 buildings, average cost: $248,800
- 2009: 119 buildings, average cost: $233,400
- 2008: 244 buildings, average cost: $221,400
- 2007: 374 buildings, average cost: $274,100
- 2006: 475 buildings, average cost: $248,000
- 2005: 509 buildings, average cost: $221,800
- 2004: 469 buildings, average cost: $200,800
- 2003: 449 buildings, average cost: $187,400
- 2002: 492 buildings, average cost: $164,500
- 2001: 468 buildings, average cost: $144,300
- 2000: 380 buildings, average cost: $151,800
- 1999: 377 buildings, average cost: $164,500
- 1998: 329 buildings, average cost: $132,500
- 1997: 327 buildings, average cost: $115,200
Median real estate property taxes paid for housing units with mortgages in 2022: $1,271 (0.5%)
Median real estate property taxes paid for housing units with no mortgage in 2022: $1,158 (0.6%)

| Franklin County: | 14.0% |
| Virginia: | 10.6% |
Median age of residents in 2022: 48.8 years old
(Males: 48.2 years old, Females: 49.4 years old)
(Median age for: White residents: 50.1 years old, Black residents: 45.2 years old, American Indian residents: 33.8 years old, Asian residents: 24.3 years old, Hispanic or Latino residents: 25.6 years old, Other race residents: 32.8 years old)
Fair market rent in 2006 for a 1-bedroom apartment in Franklin County is $375 a month.
Fair market rent for a 2-bedroom apartment is $483 a month.
Fair market rent for a 3-bedroom apartment is $578 a month.
Cities in this county include: Rocky Mount, North Shore, Ferrum, Henry Fork, Union Hall, Westlake Corner, Penhook, Boones Mill.
Neighboring counties: Alexander County, Illinois  , Ballard County, Kentucky , Bell County, Kentucky , Laurel County, Kentucky , Wythe County .
| Here: | 2.7% |
| Virginia: | 2.7% |
Current college students: 2,126
People 25 years of age or older with a high school degree or higher: 89.7%
People 25 years of age or older with a bachelor's degree or higher: 23.8%
Number of foreign born residents: 1,287 (51.8% naturalized citizens)
| Franklin County: | 2.3% |
| Whole state: | 12.7% |
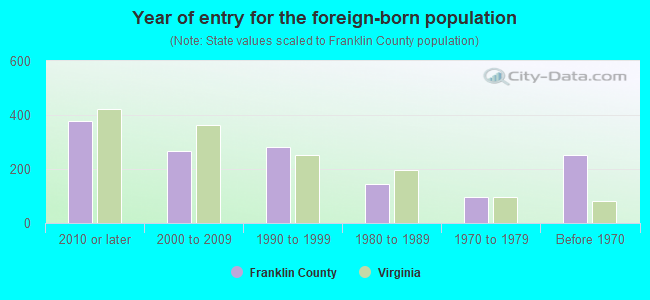
- Year of entry for the foreign-born population
- 4142010 or later
- 2122000 to 2009
- 2791990 to 1999
- 1441980 to 1989
- 971970 to 1979
- 251Before 1970
Mean travel time to work (commute): minutes
Percentage of county residents living and working in this county: 99.3%
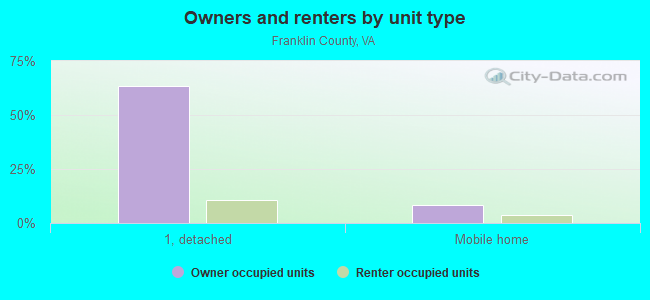
Housing units in structures:
- One, detached: 21,158
- One, attached: 579
- Two: 252
- 3 or 4: 308
- 5 to 9: 485
- 10 to 19: 691
- 20 to 49: 50
- 50 or more: 236
- Mobile homes: 4,744
- Boats, RVs, vans, etc.: 59
Housing units in Franklin County with a mortgage: 9,334 (915 second mortgage, 42 home equity loan, 773 both second mortgage and home equity loan)
Houses without a mortgage: 437
| Here: | 2.0% with mortgage |
| State: | 97.2% with mortgage |
Religion statistics for Franklin County

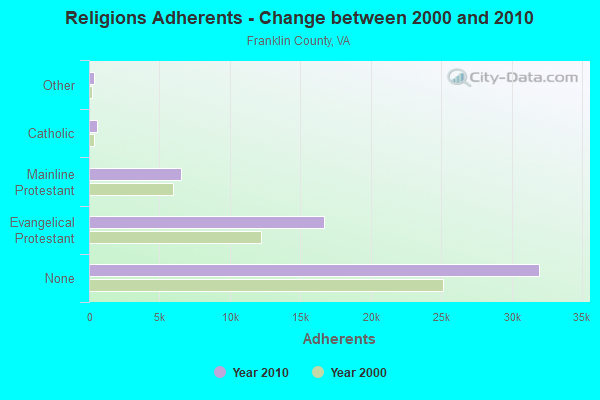
| Religion | Adherents | Congregations |
|---|---|---|
| Evangelical Protestant | 16,656 | 64 |
| Mainline Protestant | 6,544 | 36 |
| Catholic | 559 | 1 |
| Other | 331 | 2 |
| Black Protestant | 119 | 2 |
| None | 31,950 | - |
Source: Clifford Grammich, Kirk Hadaway, Richard Houseal, Dale E.Jones, Alexei Krindatch, Richie Stanley and Richard H.Taylor. 2012. 2010 U.S.Religion Census: Religious Congregations & Membership Study. Association of Statisticians of American Religious Bodies. Jones, Dale E., et al. 2002. Congregations and Membership in the United States 2000. Nashville, TN: Glenmary Research Center.
Food Environment Statistics:
| Franklin County: | 1.17 / 10,000 pop. |
| State: | 2.03 / 10,000 pop. |
| Here: | 0.20 / 10,000 pop. |
| Virginia: | 0.17 / 10,000 pop. |
| This county: | 0.78 / 10,000 pop. |
| Virginia: | 1.43 / 10,000 pop. |
| Franklin County: | 6.05 / 10,000 pop. |
| Virginia: | 4.03 / 10,000 pop. |
| This county: | 5.07 / 10,000 pop. |
| State: | 7.65 / 10,000 pop. |
| Franklin County: | 9.4% |
| Virginia: | 9.3% |
| Franklin County: | 27.5% |
| State: | 26.7% |
| Here: | 19.3% |
| State: | 18.6% |
Agriculture in Franklin County:
Average size of farms: 170 acresAverage value of agricultural products sold per farm: $36,068
Average value of crops sold per acre for harvested cropland: $131.23
The value of nursery, greenhouse, floriculture, and sod as a percentage of the total market value of agricultural products sold: 3.25%
The value of livestock, poultry, and their products as a percentage of the total market value of agricultural products sold: 82.74%
Average total farm production expenses per farm: $32,463
Harvested cropland as a percentage of land in farms: 27.82%
Irrigated harvested cropland as a percentage of land in farms: 2.29%
Average market value of all machinery and equipment per farm: $47,019
The percentage of farms operated by a family or individual: 91.11%
Average age of principal farm operators: 56 years
Average number of cattle and calves per 100 acres of all land in farms: 24.91
Milk cows as a percentage of all cattle and calves: 20.66%
Corn for grain: 2674 harvested acres
All wheat for grain: 641 harvested acres
Soybeans for beans: 564 harvested acres
Vegetables: 36 harvested acres
Land in orchards: 234 acres
Earthquake activity:
Franklin County-area historical earthquake activity is significantly above Virginia state average. It is 32% smaller than the overall U.S. average.On 8/23/2011 at 17:51:04, a magnitude 5.8 (5.8 MW, Depth: 3.7 mi, Class: Moderate, Intensity: VI - VII) earthquake occurred 122.5 miles away from Franklin County center
On 8/9/2020 at 12:07:37, a magnitude 5.1 (5.1 MW, Depth: 4.7 mi) earthquake occurred 77.8 miles away from the county center
On 7/27/1980 at 18:52:21, a magnitude 5.2 (5.1 MB, 4.7 MS, 5.0 UK, 5.2 UK) earthquake occurred 238.7 miles away from the county center
On 12/9/2003 at 20:59:18, a magnitude 4.5 (4.5 ML, Depth: 6.2 mi, Class: Light, Intensity: IV - V) earthquake occurred 110.2 miles away from the county center
On 12/9/2003 at 20:59:14, a magnitude 4.5 (4.5 MB, 4.5 LG) earthquake occurred 114.8 miles away from Franklin County center
On 8/25/2011 at 05:07:52, a magnitude 4.5 (4.5 ML, Depth: 4.2 mi) earthquake occurred 122.4 miles away from the county center
Magnitude types: regional Lg-wave magnitude (LG), body-wave magnitude (MB), local magnitude (ML), surface-wave magnitude (MS), moment magnitude (MW)
Most recent natural disasters:
- Virginia Covid-19 Pandemic, Incident Period: January 20, 2020, Major Disaster (Presidential) Declared DR-4512-VA: April 2, 2020, FEMA Id: 4512, Natural disaster type: Other
- Virginia Tropical Storm Michael, Incident Period: October 9, 2018 - October 16, 2018, FEMA Id: 4411, Natural disaster type: Tropical Storm
- Virginia Hurricane Florence, Incident Period: September 8, 2018 - September 21, 2018, FEMA Id: 4401, Natural disaster type: Hurricane
- Virginia Hurricane Sandy, Incident Period: October 26, 2012 to November 01, 2012, Emergency Declared EM-3359: October 29, 2012, FEMA Id: 3359, Natural disaster type: Hurricane
- Virginia Severe Storms and Straight-line Winds, Incident Period: June 29, 2012 to July 01, 2012, Major Disaster (Presidential) Declared DR-4072: July 27, 2012, FEMA Id: 4072, Natural disaster type: Storm, Wind
- Virginia Hurricane Katrina Evacuation, Incident Period: August 29, 2005 to October 01, 2005, Emergency Declared EM-3240: September 12, 2005, FEMA Id: 3240, Natural disaster type: Hurricane
- Virginia Winter Storm, Incident Period: January 25, 2000 to January 30, 2000, Major Disaster (Presidential) Declared DR-1318: February 28, 2000, FEMA Id: 1318, Natural disaster type: Winter Storm
- Virginia Hurricane Fran, Incident Period: September 05, 1996 to September 23, 1996, Major Disaster (Presidential) Declared DR-1135: September 06, 1996, FEMA Id: 1135, Natural disaster type: Hurricane
- Virginia Blizzard, Incident Period: January 06, 1996 to January 12, 1996, Major Disaster (Presidential) Declared DR-1086: January 13, 1996, FEMA Id: 1086, Natural disaster type: Blizzard
- Virginia Severe Storm, Flooding, Incident Period: June 22, 1995 to July 07, 1995, Major Disaster (Presidential) Declared DR-1059: July 01, 1995, FEMA Id: 1059, Natural disaster type: Storm, Flood
- 7 other natural disasters have been reported since 1953.
The number of natural disasters in Franklin County (17) is near the US average (15).
Major Disasters (Presidential) Declared: 10
Emergencies Declared: 5
Causes of natural disasters: Storms: 5, Hurricanes: 4, Floods: 3, Winter Storms: 3, Droughts: 2, Tropical Storms: 2, Blizzard: 1, Ice Storm: 1, Wind: 1, Other: 1 (Note: some incidents may be assigned to more than one category).
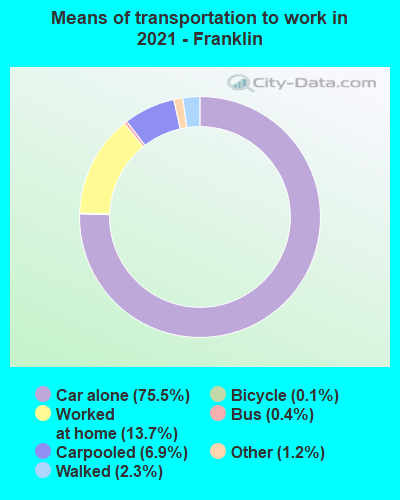
Means of transportation to work:
- Drove a car alone: 12,505 (70.8%)
- Carpooled: 1,373 (7.8%)
- Bus: 63 (0.4%)
- Taxicab, motorcycle, or other means: 219 (1.2%)
- Bicycle: 2 (0.0%)
- Walked: 525 (3.0%)
- Worked at home: 2,999 (17.0%)
- Health care and social assistance (22%)
- Educational services (15%)
- Retail trade (12%)
- Accommodation and food services (9%)
- Finance and insurance (6%)
- Manufacturing (5%)
- Professional, scientific, and technical services (4%)

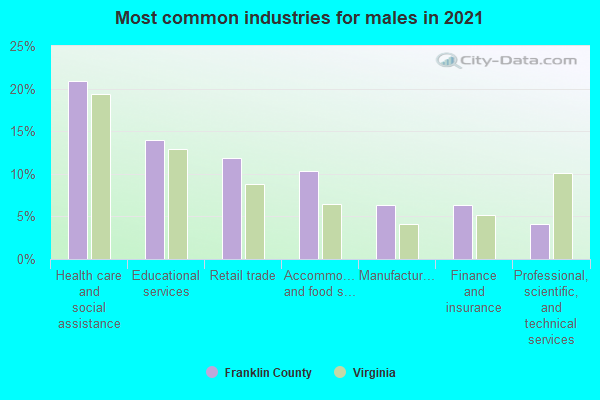
- Health care and social assistance (24%)
- Educational services (16%)
- Retail trade (13%)
- Accommodation and food services (9%)
- Finance and insurance (6%)
- Manufacturing (6%)
- Professional, scientific, and technical services (4%)
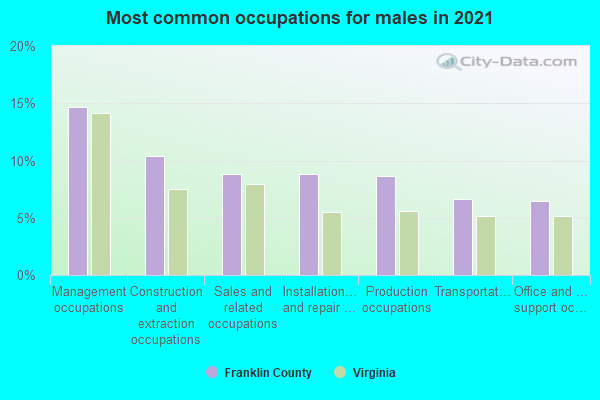
- Management occupations (14%)
- Construction and extraction occupations (11%)
- Sales and related occupations (11%)
- Production occupations (9%)
- Transportation occupations (8%)
- Installation, maintenance, and repair occupations (7%)
- Office and administrative support occupations (6%)

- Office and administrative support occupations (15%)
- Educational instruction, and library occupations (11%)
- Food preparation and serving related occupations (9%)
- Sales and related occupations (8%)
- Management occupations (7%)
- Business and financial operations occupations (7%)
- Health diagnosing and treating practitioners and other technical occupations (7%)
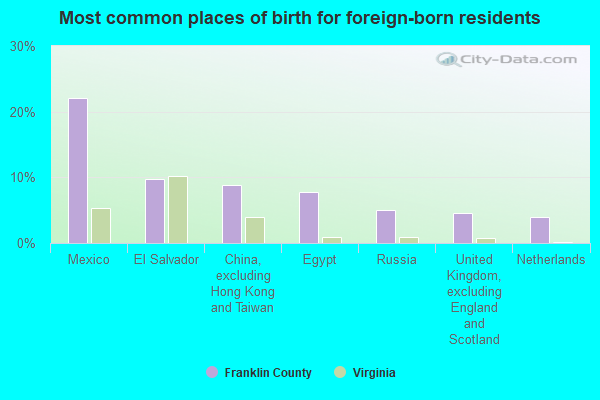
- Mexico (20%)
- China, excluding Hong Kong and Taiwan (11%)
- Egypt (9%)
- El Salvador (9%)
- Panama (5%)
- Russia (4%)
- United Kingdom, excluding England and Scotland (4%)
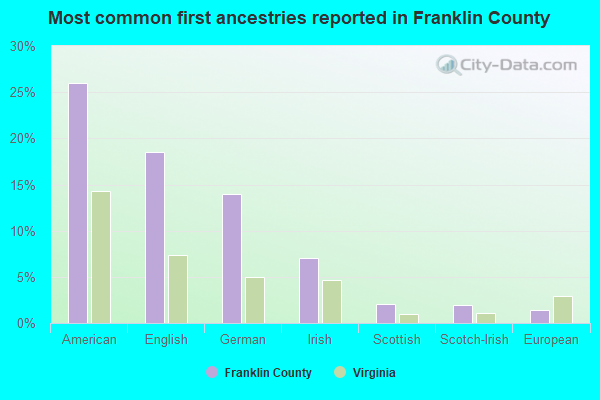
- American (26%)
- English (19%)
- German (11%)
- Irish (7%)
- Scottish (2%)
- European (1%)
- Italian (1%)
People in group quarters in Franklin County, Virginia in 2010:
- 1,051 people in college/university student housing
- 258 people in nursing facilities/skilled-nursing facilities
- 78 people in group homes intended for adults
- 54 people in local jails and other municipal confinement facilities
- 17 people in other noninstitutional facilities
- 14 people in workers' group living quarters and job corps centers
People in group quarters in Franklin County, Virginia in 2000:
- 692 people in college dormitories (includes college quarters off campus)
- 247 people in nursing homes
- 82 people in local jails and other confinement facilities (including police lockups)
- 13 people in homes for the mentally retarded
- 6 people in agriculture workers' dormitories on farms
- 6 people in other noninstitutional group quarters
7.36% of this county's 2021 resident taxpayers lived in other counties in 2020 ($84,687 average adjusted gross income)
| Here: | 7.36% |
| Virginia average: | 10.16% |
10 or fewer of this county's residents moved from foreign countries.
4.75% relocated from other counties in Virginia ($49,698 average AGI)
2.61% relocated from other states ($34,989 average AGI)
Franklin County: 2.61% Virginia average: 3.91%

Top counties from which taxpayers relocated into this county between 2020 and 2021:
| from Roanoke County, VA | |
| from Roanoke city, VA | |
| from Bedford County, VA | |
| from Henry County, VA | |
| from Salem city, VA | |
| from Botetourt County, VA | |
| from Pittsylvania County, VA |
5.71% of this county's 2020 resident taxpayers moved to other counties in 2021 ($61,186 average adjusted gross income)
| Here: | 5.71% |
| Virginia average: | 10.20% |
10 or fewer of this county's residents moved to foreign countries.
3.87% relocated to other counties in Virginia ($34,059 average AGI)
1.84% relocated to other states ($27,126 average AGI)
Franklin County: 1.84% Virginia average: 3.98%
Top counties to which taxpayers relocated from this county between 2020 and 2021:
| to Roanoke city, VA | |
| to Roanoke County, VA | |
| to Bedford County, VA | |
| to Henry County, VA | |
| to Pittsylvania County, VA | |
| to Salem city, VA | |
| to Botetourt County, VA |
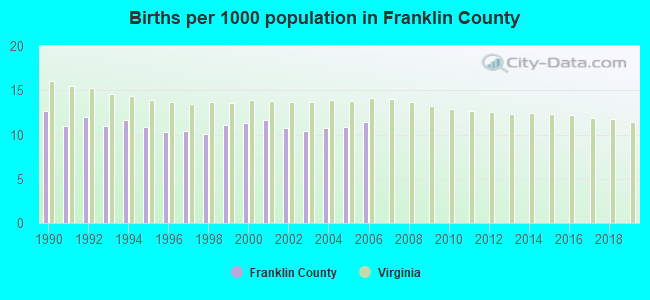
Births per 1000 population from 1990 to 1999: 11.1
Births per 1000 population from 2000 to 2006: 11.0
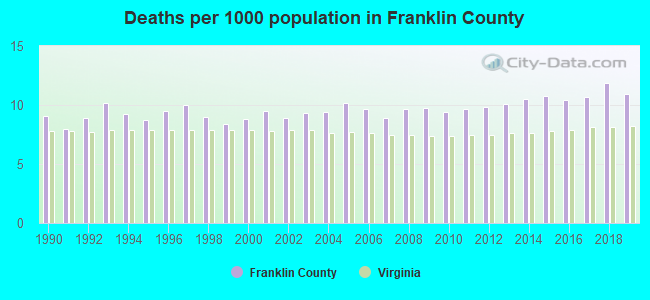
Deaths per 1000 population from 1990 to 1999: 9.1
Deaths per 1000 population from 2000 to 2009: 9.4
Deaths per 1000 population from 2010 to 2020: 10.6
Infant deaths per 1000 live births from 1990 to 1999: 7.4
Infant deaths per 1000 live births from 2000 to 2006: 8.6

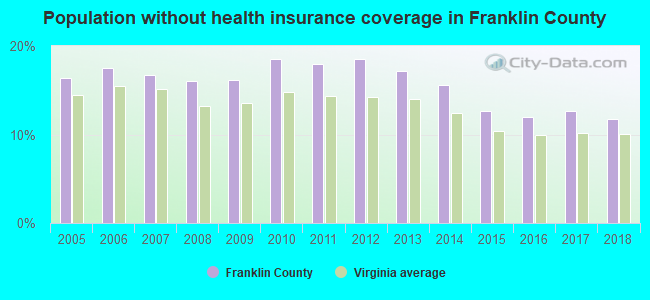
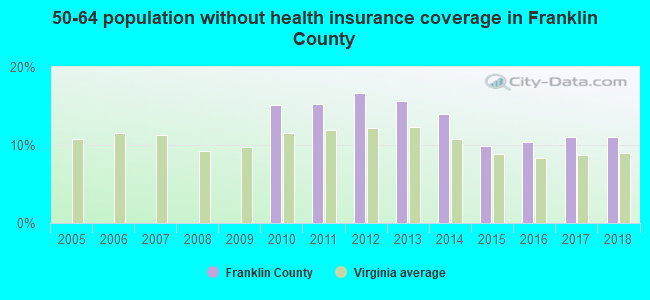
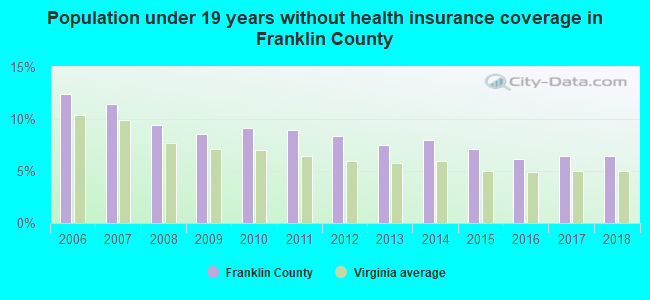
Persons under 19 years old without health insurance coverage in 2018: 6.4%
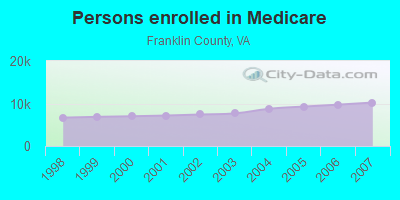
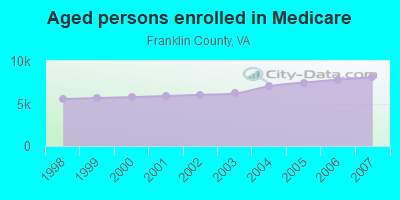
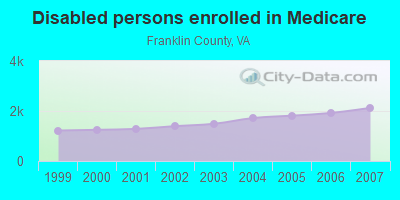
Persons enrolled in hospital insurance and/or supplemental medical insurance (Medicare) in July 1, 2007: 10,223 (8,098 aged, 2,125 disabled)
Children under 18 without health insurance coverage in 2007: 1,166 (10%)
Most common underlying causes of death in Franklin County, Virginia in 1999 - 2019:
- Bronchus or lung, unspecified - Malignant neoplasms (693)
- Atherosclerotic heart disease (600)
- Acute myocardial infarction, unspecified (551)
- Chronic obstructive pulmonary disease, unspecified (397)
- Stroke, not specified as haemorrhage or infarction (364)
- Alzheimer disease, unspecified (303)
- Unspecified dementia (270)
- Pneumonia, unspecified (149)
- Congestive heart failure (136)
- Colon, unspecified - Malignant neoplasms (88)
Population without health insurance coverage in 2000: 11%
Children under 18 without health insurance coverage in 2000: 8%
Short term general hospital admissions per 100,000 population in 2004: 4,701
Short term general hospital beds per 100,000 population in 2004: 74
Emergency room visits per 100,000 population in 2004: 43,922
General practice office based MDs per 100,000 population in 2005: 1,120
Medical specialist MDs per 100,000 population in 2005: 1,041
Dentists per 100,000 population in 1998: 4
Total births per 100,000 population, July 2005 - July 2006 : 13
Total deaths per 100,000 population, July 2005 - July 2006: 52
Limited-service eating places per 100,000 population in 2005 : 10
Suicides per 1,000,000 population from 2000 to 2006: 152.3. This is more than state average.
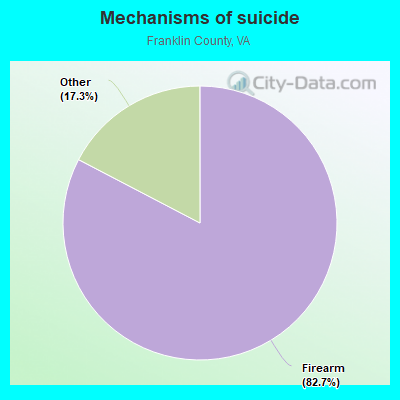
- Firearm - 125.9
- Other - 26.4
Household type by relationship:
Households: 55,213- Male householders: 11,224 (2,641 living alone), Female householders: 11,405 (3,238 living alone)
12,036 spouses (11,981 opposite-sex spouses), 1,657 unmarried partners, (1,589 opposite-sex unmarried partners), 12,968 children (10,430 natural, 632 adopted, 1,835 stepchildren), 1,496 grandchildren, 430 brothers or sisters, 585 parents, 222 foster children, 766 other relatives, 1,030 non-relatives
- In group quarters: 1,430
Size of family households: 8,483 2-persons, 2,621 3-persons, 2,579 4-persons, 1,046 5-persons, 466 6-persons, 388 7-or-more-persons.
Size of nonfamily households: 5,879 1-person, 1,031 2-persons, 97 3-persons, 63 4-persons.
5,848 married couples with children.
2,694 single-parent households (1,240 men, 1,454 women).
96.9% of residents of Franklin speak English at home.
2.0% of residents speak Spanish at home (61% speak English very well, 21% speak English well, 15% speak English not well, 2% don't speak English at all).
0.6% of residents speak other Indo-European language at home (77% speak English very well, 14% speak English well, 9% don't speak English at all).
0.3% of residents speak Asian or Pacific Island language at home (74% speak English very well, 9% speak English well, 17% speak English not well).
0.3% of residents speak other language at home (55% speak English very well, 45% speak English well).
In fiscal year 2004:
Federal Government expenditure: $203,666,000 ($4,086 per capita)
Department of Defense expenditure: $5,796,000
Federal direct payments to individuals for retirement and disability: $118,898,000
Federal other direct payments to individuals: $39,756,000
Federal direct payments not to individuals: $1,815,000
Federal grants: $31,438,000
Federal procurement contracts: $4,312,000 ($269,000 Department of Defense)
Federal salaries and wages: $7,448,000 ($1,010,000 Department of Defense)
Federal Government direct loans: $15,524,000
Federal guaranteed/insured loans: $18,376,000
Federal Government insurance: $25,787,000
Population change from April 1, 2000 to July 1, 2005:
Births: 2,779| Here: | 55 per 1000 residents |
| State: | 70 per 1000 residents |
Deaths: 2,325
| Here: | 46 per 1000 residents |
| State: | 40 per 1000 residents |
Net international migration: +49
| Here: | +1 per 1000 residents |
| State: | +18 per 1000 residents |
Net internal migration: +2,621
| Here: | +52 per 1000 residents |
| State: | +14 per 1000 residents |
Total withdrawal of fresh water for public supply: 1.05 millions of gallons per day (all from ground)
| Here: | 6.4 |
| State: | 7.0 |
| Here: | 4.8 |
| State: | 4.3 |
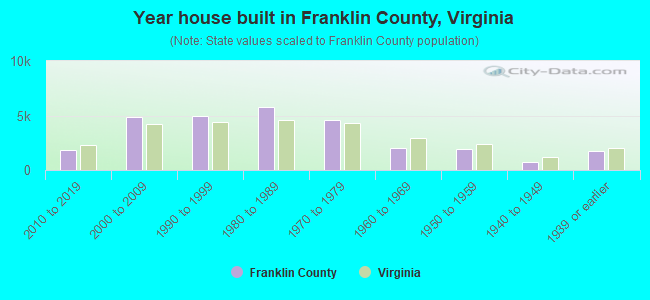
- Year house built in Franklin County, Virginia
- 732020 or later
- 1,9432010 to 2019
- 5,4012000 to 2009
- 4,6861990 to 1999
- 5,8861980 to 1989
- 4,2661970 to 1979
- 1,9741960 to 1969
- 1,7301950 to 1959
- 7501940 to 1949
- 1,6521939 or earlier
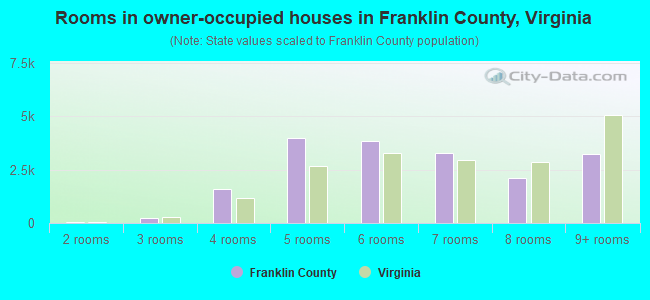
- Rooms in owner-occupied houses in Franklin County, Virginia
- 251 room
- 552 rooms
- 2803 rooms
- 1,6354 rooms
- 3,8575 rooms
- 3,4736 rooms
- 3,1047 rooms
- 2,4118 rooms
- 3,3529+ rooms
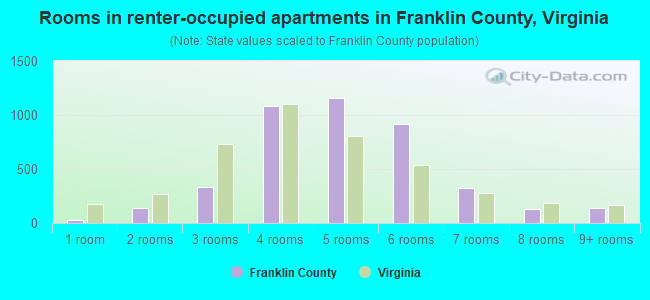
- Rooms in renter-occupied apartments in Franklin County, Virginia
- 381 room
- 1742 rooms
- 2563 rooms
- 1,1624 rooms
- 1,3315 rooms
- 8366 rooms
- 3027 rooms
- 988 rooms
- 1999+ rooms
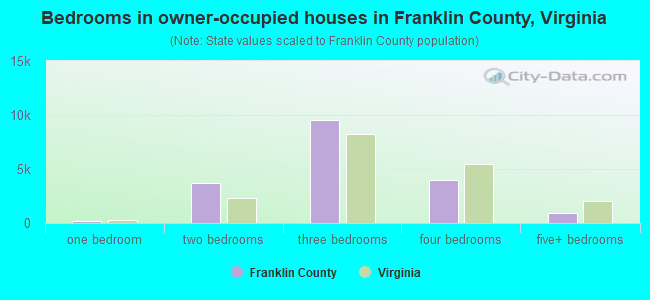
- Bedrooms in owner-occupied houses in Franklin County, Virginia
- 28no bedroom
- 1711 bedroom
- 3,4822 bedrooms
- 9,3803 bedrooms
- 4,1444 bedrooms
- 9525+ bedrooms
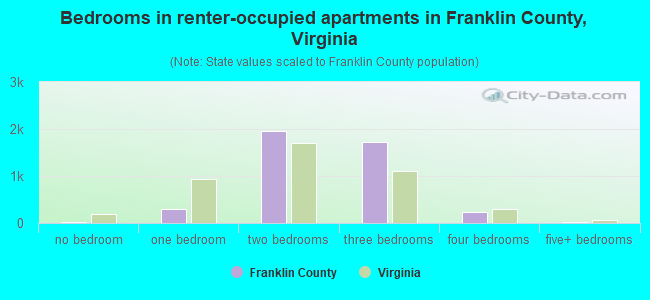
- Bedrooms in renter-occupied apartments in Franklin County, Virginia
- 64no bedroom
- 2691 bedroom
- 1,9182 bedrooms
- 1,8783 bedrooms
- 2764 bedrooms
- 05+ bedrooms
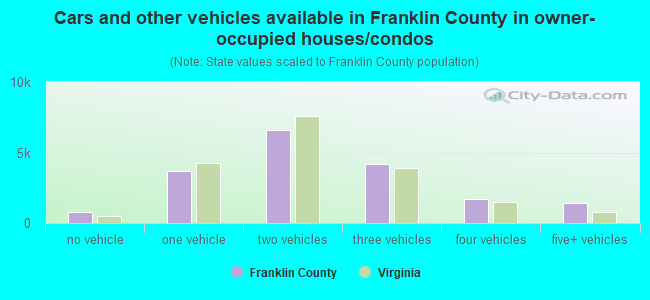
- Cars and other vehicles available in Franklin County in owner-occupied houses/condos
- 858no vehicle
- 3,4351 vehicle
- 6,7552 vehicles
- 4,0743 vehicles
- 1,6584 vehicles
- 1,4335+ vehicles
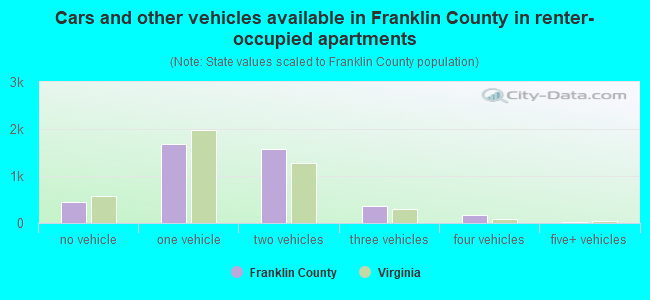
- Cars and other vehicles available in Franklin County in renter-occupied apartments
- 411no vehicle
- 1,5971 vehicle
- 1,7272 vehicles
- 4203 vehicles
- 2164 vehicles
- 425+ vehicles
90.4% of Franklin County residents lived in the same house 1 years ago.
Out of people who lived in different houses, 30% lived in this county.
Out of people who lived in different counties, 59% lived in Virginia.
| Franklin County: | 90.4% |
| State average: | 86.6% |
Place of birth for U.S.-born residents:
- This state: 37,972
- Other state: 15,253
- Northeast: 4,802
- Midwest: 2,252
- South: 6,815
- West: 1,360
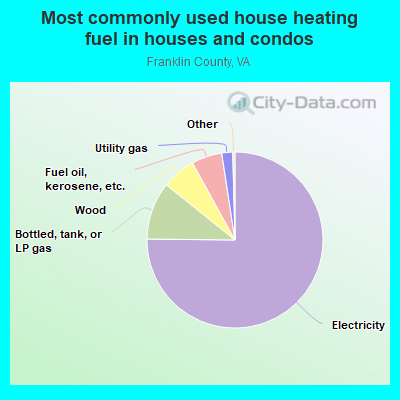
- 75.9%Electricity
- 9.6%Bottled, tank, or LP gas
- 6.2%Wood
- 6.0%Fuel oil, kerosene, etc.
- 1.8%Utility gas
- 0.5%No fuel used
- 80.4%Electricity
- 8.7%Fuel oil, kerosene, etc.
- 4.9%Bottled, tank, or LP gas
- 2.9%Wood
- 1.7%Utility gas
- 1.4%No fuel used
Private vs. public school enrollment:
| Here: | 22.7% |
| Virginia: | 13.2% |
| Here: | 12.4% |
| Virginia: | 10.2% |
| Here: | 43.9% |
| Virginia: | 18.7% |
Franklin County government finances - Expenditure in 2020:
- Assistance and Subsidies - Public Welfare, Federal Categorical Assistance Programs: $7,963,000
Public Welfare, Federal Categorical Assistance Programs: $5,262,000
- Bond Funds - Cash and Securities: $15,681,000
- Charges - Other: $13,425,000
Elementary and Secondary Education School Lunch: $1,652,000
Elementary and Secondary Education School Lunch: $1,522,000
Solid Waste Management: $1,489,000
Other: $1,388,000
Solid Waste Management: $690,000
Parks and Recreation: $365,000
Air Transportation: $240,000
Elementary and Secondary Education School Tuition and Transportation: $122,000
Sewerage: $115,000
Elementary and Secondary Education School Tuition and Transportation: $88,000
Parks and Recreation: $70,000
Sea and Inland Port Facilities: $27,000
Miscellaneous Commercial Activities: $4,000
- Construction - General - Other: $2,336,000
Elementary and Secondary Education: $1,545,000
Elementary and Secondary Education: $1,512,000
Air Transportation: $271,000
Solid Waste Management: $205,000
Water Utilities: $175,000
Parks and Recreation: $170,000
Libraries: $75,000
- Current Operations - Elementary and Secondary Education: $87,772,000
Elementary and Secondary Education: $87,568,000
Health - Other: $28,331,000
Police Protection: $8,521,000
Local Fire Protection: $6,590,000
Public Welfare - Other: $5,809,000
Solid Waste Management: $4,729,000
Police Protection: $4,305,000
Parks and Recreation: $3,939,000
Judicial and Legal Services: $3,902,000
Correctional Institutions: $3,775,000
General - Other: $3,713,000
Local Fire Protection: $3,372,000
Financial Administration: $3,027,000
Central Staff Services: $2,995,000
Judicial and Legal Services: $2,669,000
Central Staff Services: $2,540,000
Solid Waste Management: $2,427,000
Financial Administration: $2,169,000
General Public Buildings: $1,780,000
General - Other: $1,775,000
Libraries: $1,426,000
General Public Buildings: $1,404,000
Parks and Recreation: $1,116,000
Libraries: $981,000
Protective Inspection and Regulation - Other: $948,000
Health - Other: $711,000
Public Welfare - Other: $637,000
Protective Inspection and Regulation - Other: $483,000
Air Transportation: $143,000
Corrections - Other: $92,000
Natural Resources - Other: $89,000
Regular Highways: $25,000
Water Utilities: $8,000
- Federal Intergovernmental - Public Welfare: $2,416,000
Health and Hospitals: $492,000
Education: $206,000
Water Utilities: $150,000
Education: $80,000
Other: $56,000
General Local Government Support: $16,000
- General - Interest on Debt: $7,585,000
Interest on Debt: $1,294,000
- Intergovernmental to Local - Other - Elementary and Secondary Education: $4,187,000
Other - Elementary and Secondary Education: $2,325,000
Other - Correctional Institutions: $1,480,000
- Local Intergovernmental - Public Welfare: $4,142,000
Education: $2,881,000
Education: $2,624,000
Health and Hospitals: $1,905,000
Other: $261,000
Other: $164,000
General Local Government Support: $78,000
- Long Term Debt - Beginning Outstanding - Unspecified Public Purpose: $223,240,000
Outstanding Unspecified Public Purpose: $195,576,000
Beginning Outstanding - Unspecified Public Purpose: $29,042,000
Retired Unspecified Public Purpose: $27,664,000
Outstanding Unspecified Public Purpose: $26,184,000
Retired Unspecified Public Purpose: $2,858,000
- Miscellaneous - General Revenue - Other: $1,627,000
General Revenue - Other: $1,354,000
Interest Earnings: $1,085,000
Rents: $507,000
Fines and Forfeits: $126,000
Rents: $116,000
Donations From Private Sources: $53,000
Interest Earnings: $37,000
Sale of Property: $30,000
Sale of Property: $20,000
Fines and Forfeits: $18,000
Donations From Private Sources: $6,000
- Other Capital Outlay - Correctional Institutions: $4,841,000
Elementary and Secondary Education: $3,513,000
Elementary and Secondary Education: $2,268,000
General - Other: $1,767,000
Police Protection: $341,000
Financial Administration: $252,000
Solid Waste Management: $249,000
Local Fire Protection: $244,000
Health - Other: $104,000
General Public Building: $40,000
Protective Inspection and Regulation - Other: $16,000
Parks and Recreation: $12,000
- Other Funds - Cash and Securities: $48,242,000
Cash and Securities: $19,303,000
- Revenue - Water Utilities: $113,000
- Sinking Funds - Cash and Securities: $308,000
- State Intergovernmental - Education: $50,175,000
Education: $48,899,000
Health and Hospitals: $11,806,000
General Local Government Support: $6,391,000
Other: $6,206,000
Public Welfare: $4,700,000
General Local Government Support: $4,659,000
- Tax - Property: $71,858,000
Property: $56,110,000
General Sales and Gross Receipts: $5,660,000
General Sales and Gross Receipts: $4,706,000
Public Utilities Sales: $2,501,000
Motor Vehicle License: $1,411,000
Motor Vehicle License: $1,292,000
Other Selective Sales: $1,222,000
Occupation and Business License - Other: $1,199,000
Public Utilities Sales: $1,061,000
Other: $919,000
Other License: $428,000
Other License: $411,000
Occupation and Business License - Other: $6,000
- Total Salaries and Wages: $57,345,000
: $51,395,000
Franklin County government finances - Revenue in 2020:
- Assistance and Subsidies - Public Welfare, Federal Categorical Assistance Programs: $7,963,000
Public Welfare, Federal Categorical Assistance Programs: $5,262,000
- Bond Funds - Cash and Securities: $15,681,000
- Charges - Other: $13,425,000
Elementary and Secondary Education School Lunch: $1,652,000
Elementary and Secondary Education School Lunch: $1,522,000
Solid Waste Management: $1,489,000
Other: $1,388,000
Solid Waste Management: $690,000
Parks and Recreation: $365,000
Air Transportation: $240,000
Elementary and Secondary Education School Tuition and Transportation: $122,000
Sewerage: $115,000
Elementary and Secondary Education School Tuition and Transportation: $88,000
Parks and Recreation: $70,000
Sea and Inland Port Facilities: $27,000
Miscellaneous Commercial Activities: $4,000
- Construction - General - Other: $2,336,000
Elementary and Secondary Education: $1,545,000
Elementary and Secondary Education: $1,512,000
Air Transportation: $271,000
Solid Waste Management: $205,000
Water Utilities: $175,000
Parks and Recreation: $170,000
Libraries: $75,000
- Current Operations - Elementary and Secondary Education: $87,772,000
Elementary and Secondary Education: $87,568,000
Health - Other: $28,331,000
Police Protection: $8,521,000
Local Fire Protection: $6,590,000
Public Welfare - Other: $5,809,000
Solid Waste Management: $4,729,000
Police Protection: $4,305,000
Parks and Recreation: $3,939,000
Judicial and Legal Services: $3,902,000
Correctional Institutions: $3,775,000
General - Other: $3,713,000
Local Fire Protection: $3,372,000
Financial Administration: $3,027,000
Central Staff Services: $2,995,000
Judicial and Legal Services: $2,669,000
Central Staff Services: $2,540,000
Solid Waste Management: $2,427,000
Financial Administration: $2,169,000
General Public Buildings: $1,780,000
General - Other: $1,775,000
Libraries: $1,426,000
General Public Buildings: $1,404,000
Parks and Recreation: $1,116,000
Libraries: $981,000
Protective Inspection and Regulation - Other: $948,000
Health - Other: $711,000
Public Welfare - Other: $637,000
Protective Inspection and Regulation - Other: $483,000
Air Transportation: $143,000
Corrections - Other: $92,000
Natural Resources - Other: $89,000
Regular Highways: $25,000
Water Utilities: $8,000
- Federal Intergovernmental - Public Welfare: $2,416,000
Health and Hospitals: $492,000
Education: $206,000
Water Utilities: $150,000
Education: $80,000
Other: $56,000
General Local Government Support: $16,000
- General - Interest on Debt: $7,585,000
Interest on Debt: $1,294,000
- Intergovernmental to Local - Other - Elementary and Secondary Education: $4,187,000
Other - Elementary and Secondary Education: $2,325,000
Other - Correctional Institutions: $1,480,000
- Local Intergovernmental - Public Welfare: $4,142,000
Education: $2,881,000
Education: $2,624,000
Health and Hospitals: $1,905,000
Other: $261,000
Other: $164,000
General Local Government Support: $78,000
- Long Term Debt - Beginning Outstanding - Unspecified Public Purpose: $223,240,000
Outstanding Unspecified Public Purpose: $195,576,000
Beginning Outstanding - Unspecified Public Purpose: $29,042,000
Retired Unspecified Public Purpose: $27,664,000
Outstanding Unspecified Public Purpose: $26,184,000
Retired Unspecified Public Purpose: $2,858,000
- Miscellaneous - General Revenue - Other: $1,627,000
General Revenue - Other: $1,354,000
Interest Earnings: $1,085,000
Rents: $507,000
Fines and Forfeits: $126,000
Rents: $116,000
Donations From Private Sources: $53,000
Interest Earnings: $37,000
Sale of Property: $30,000
Sale of Property: $20,000
Fines and Forfeits: $18,000
Donations From Private Sources: $6,000
- Other Capital Outlay - Correctional Institutions: $4,841,000
Elementary and Secondary Education: $3,513,000
Elementary and Secondary Education: $2,268,000
General - Other: $1,767,000
Police Protection: $341,000
Financial Administration: $252,000
Solid Waste Management: $249,000
Local Fire Protection: $244,000
Health - Other: $104,000
General Public Building: $40,000
Protective Inspection and Regulation - Other: $16,000
Parks and Recreation: $12,000
- Other Funds - Cash and Securities: $48,242,000
Cash and Securities: $19,303,000
- Revenue - Water Utilities: $113,000
- Sinking Funds - Cash and Securities: $308,000
- State Intergovernmental - Education: $50,175,000
Education: $48,899,000
Health and Hospitals: $11,806,000
General Local Government Support: $6,391,000
Other: $6,206,000
Public Welfare: $4,700,000
General Local Government Support: $4,659,000
- Tax - Property: $71,858,000
Property: $56,110,000
General Sales and Gross Receipts: $5,660,000
General Sales and Gross Receipts: $4,706,000
Public Utilities Sales: $2,501,000
Motor Vehicle License: $1,411,000
Motor Vehicle License: $1,292,000
Other Selective Sales: $1,222,000
Occupation and Business License - Other: $1,199,000
Public Utilities Sales: $1,061,000
Other: $919,000
Other License: $428,000
Other License: $411,000
Occupation and Business License - Other: $6,000
- Total Salaries and Wages: $57,345,000
: $51,395,000
Franklin County government finances - Debt in 2020:
- Assistance and Subsidies - Public Welfare, Federal Categorical Assistance Programs: $7,963,000
Public Welfare, Federal Categorical Assistance Programs: $5,262,000
- Bond Funds - Cash and Securities: $15,681,000
- Charges - Other: $13,425,000
Elementary and Secondary Education School Lunch: $1,652,000
Elementary and Secondary Education School Lunch: $1,522,000
Solid Waste Management: $1,489,000
Other: $1,388,000
Solid Waste Management: $690,000
Parks and Recreation: $365,000
Air Transportation: $240,000
Elementary and Secondary Education School Tuition and Transportation: $122,000
Sewerage: $115,000
Elementary and Secondary Education School Tuition and Transportation: $88,000
Parks and Recreation: $70,000
Sea and Inland Port Facilities: $27,000
Miscellaneous Commercial Activities: $4,000
- Construction - General - Other: $2,336,000
Elementary and Secondary Education: $1,545,000
Elementary and Secondary Education: $1,512,000
Air Transportation: $271,000
Solid Waste Management: $205,000
Water Utilities: $175,000
Parks and Recreation: $170,000
Libraries: $75,000
- Current Operations - Elementary and Secondary Education: $87,772,000
Elementary and Secondary Education: $87,568,000
Health - Other: $28,331,000
Police Protection: $8,521,000
Local Fire Protection: $6,590,000
Public Welfare - Other: $5,809,000
Solid Waste Management: $4,729,000
Police Protection: $4,305,000
Parks and Recreation: $3,939,000
Judicial and Legal Services: $3,902,000
Correctional Institutions: $3,775,000
General - Other: $3,713,000
Local Fire Protection: $3,372,000
Financial Administration: $3,027,000
Central Staff Services: $2,995,000
Judicial and Legal Services: $2,669,000
Central Staff Services: $2,540,000
Solid Waste Management: $2,427,000
Financial Administration: $2,169,000
General Public Buildings: $1,780,000
General - Other: $1,775,000
Libraries: $1,426,000
General Public Buildings: $1,404,000
Parks and Recreation: $1,116,000
Libraries: $981,000
Protective Inspection and Regulation - Other: $948,000
Health - Other: $711,000
Public Welfare - Other: $637,000
Protective Inspection and Regulation - Other: $483,000
Air Transportation: $143,000
Corrections - Other: $92,000
Natural Resources - Other: $89,000
Regular Highways: $25,000
Water Utilities: $8,000
- Federal Intergovernmental - Public Welfare: $2,416,000
Health and Hospitals: $492,000
Education: $206,000
Water Utilities: $150,000
Education: $80,000
Other: $56,000
General Local Government Support: $16,000
- General - Interest on Debt: $7,585,000
Interest on Debt: $1,294,000
- Intergovernmental to Local - Other - Elementary and Secondary Education: $4,187,000
Other - Elementary and Secondary Education: $2,325,000
Other - Correctional Institutions: $1,480,000
- Local Intergovernmental - Public Welfare: $4,142,000
Education: $2,881,000
Education: $2,624,000
Health and Hospitals: $1,905,000
Other: $261,000
Other: $164,000
General Local Government Support: $78,000
- Long Term Debt - Beginning Outstanding - Unspecified Public Purpose: $223,240,000
Outstanding Unspecified Public Purpose: $195,576,000
Beginning Outstanding - Unspecified Public Purpose: $29,042,000
Retired Unspecified Public Purpose: $27,664,000
Outstanding Unspecified Public Purpose: $26,184,000
Retired Unspecified Public Purpose: $2,858,000
- Miscellaneous - General Revenue - Other: $1,627,000
General Revenue - Other: $1,354,000
Interest Earnings: $1,085,000
Rents: $507,000
Fines and Forfeits: $126,000
Rents: $116,000
Donations From Private Sources: $53,000
Interest Earnings: $37,000
Sale of Property: $30,000
Sale of Property: $20,000
Fines and Forfeits: $18,000
Donations From Private Sources: $6,000
- Other Capital Outlay - Correctional Institutions: $4,841,000
Elementary and Secondary Education: $3,513,000
Elementary and Secondary Education: $2,268,000
General - Other: $1,767,000
Police Protection: $341,000
Financial Administration: $252,000
Solid Waste Management: $249,000
Local Fire Protection: $244,000
Health - Other: $104,000
General Public Building: $40,000
Protective Inspection and Regulation - Other: $16,000
Parks and Recreation: $12,000
- Other Funds - Cash and Securities: $48,242,000
Cash and Securities: $19,303,000
- Revenue - Water Utilities: $113,000
- Sinking Funds - Cash and Securities: $308,000
- State Intergovernmental - Education: $50,175,000
Education: $48,899,000
Health and Hospitals: $11,806,000
General Local Government Support: $6,391,000
Other: $6,206,000
Public Welfare: $4,700,000
General Local Government Support: $4,659,000
- Tax - Property: $71,858,000
Property: $56,110,000
General Sales and Gross Receipts: $5,660,000
General Sales and Gross Receipts: $4,706,000
Public Utilities Sales: $2,501,000
Motor Vehicle License: $1,411,000
Motor Vehicle License: $1,292,000
Other Selective Sales: $1,222,000
Occupation and Business License - Other: $1,199,000
Public Utilities Sales: $1,061,000
Other: $919,000
Other License: $428,000
Other License: $411,000
Occupation and Business License - Other: $6,000
- Total Salaries and Wages: $57,345,000
: $51,395,000
Franklin County government finances - Cash and Securities in 2020:
- Assistance and Subsidies - Public Welfare, Federal Categorical Assistance Programs: $7,963,000
Public Welfare, Federal Categorical Assistance Programs: $5,262,000
- Bond Funds - Cash and Securities: $15,681,000
- Charges - Other: $13,425,000
Elementary and Secondary Education School Lunch: $1,652,000
Elementary and Secondary Education School Lunch: $1,522,000
Solid Waste Management: $1,489,000
Other: $1,388,000
Solid Waste Management: $690,000
Parks and Recreation: $365,000
Air Transportation: $240,000
Elementary and Secondary Education School Tuition and Transportation: $122,000
Sewerage: $115,000
Elementary and Secondary Education School Tuition and Transportation: $88,000
Parks and Recreation: $70,000
Sea and Inland Port Facilities: $27,000
Miscellaneous Commercial Activities: $4,000
- Construction - General - Other: $2,336,000
Elementary and Secondary Education: $1,545,000
Elementary and Secondary Education: $1,512,000
Air Transportation: $271,000
Solid Waste Management: $205,000
Water Utilities: $175,000
Parks and Recreation: $170,000
Libraries: $75,000
- Current Operations - Elementary and Secondary Education: $87,772,000
Elementary and Secondary Education: $87,568,000
Health - Other: $28,331,000
Police Protection: $8,521,000
Local Fire Protection: $6,590,000
Public Welfare - Other: $5,809,000
Solid Waste Management: $4,729,000
Police Protection: $4,305,000
Parks and Recreation: $3,939,000
Judicial and Legal Services: $3,902,000
Correctional Institutions: $3,775,000
General - Other: $3,713,000
Local Fire Protection: $3,372,000
Financial Administration: $3,027,000
Central Staff Services: $2,995,000
Judicial and Legal Services: $2,669,000
Central Staff Services: $2,540,000
Solid Waste Management: $2,427,000
Financial Administration: $2,169,000
General Public Buildings: $1,780,000
General - Other: $1,775,000
Libraries: $1,426,000
General Public Buildings: $1,404,000
Parks and Recreation: $1,116,000
Libraries: $981,000
Protective Inspection and Regulation - Other: $948,000
Health - Other: $711,000
Public Welfare - Other: $637,000
Protective Inspection and Regulation - Other: $483,000
Air Transportation: $143,000
Corrections - Other: $92,000
Natural Resources - Other: $89,000
Regular Highways: $25,000
Water Utilities: $8,000
- Federal Intergovernmental - Public Welfare: $2,416,000
Health and Hospitals: $492,000
Education: $206,000
Water Utilities: $150,000
Education: $80,000
Other: $56,000
General Local Government Support: $16,000
- General - Interest on Debt: $7,585,000
Interest on Debt: $1,294,000
- Intergovernmental to Local - Other - Elementary and Secondary Education: $4,187,000
Other - Elementary and Secondary Education: $2,325,000
Other - Correctional Institutions: $1,480,000
- Local Intergovernmental - Public Welfare: $4,142,000
Education: $2,881,000
Education: $2,624,000
Health and Hospitals: $1,905,000
Other: $261,000
Other: $164,000
General Local Government Support: $78,000
- Long Term Debt - Beginning Outstanding - Unspecified Public Purpose: $223,240,000
Outstanding Unspecified Public Purpose: $195,576,000
Beginning Outstanding - Unspecified Public Purpose: $29,042,000
Retired Unspecified Public Purpose: $27,664,000
Outstanding Unspecified Public Purpose: $26,184,000
Retired Unspecified Public Purpose: $2,858,000
- Miscellaneous - General Revenue - Other: $1,627,000
General Revenue - Other: $1,354,000
Interest Earnings: $1,085,000
Rents: $507,000
Fines and Forfeits: $126,000
Rents: $116,000
Donations From Private Sources: $53,000
Interest Earnings: $37,000
Sale of Property: $30,000
Sale of Property: $20,000
Fines and Forfeits: $18,000
Donations From Private Sources: $6,000
- Other Capital Outlay - Correctional Institutions: $4,841,000
Elementary and Secondary Education: $3,513,000
Elementary and Secondary Education: $2,268,000
General - Other: $1,767,000
Police Protection: $341,000
Financial Administration: $252,000
Solid Waste Management: $249,000
Local Fire Protection: $244,000
Health - Other: $104,000
General Public Building: $40,000
Protective Inspection and Regulation - Other: $16,000
Parks and Recreation: $12,000
- Other Funds - Cash and Securities: $48,242,000
Cash and Securities: $19,303,000
- Revenue - Water Utilities: $113,000
- Sinking Funds - Cash and Securities: $308,000
- State Intergovernmental - Education: $50,175,000
Education: $48,899,000
Health and Hospitals: $11,806,000
General Local Government Support: $6,391,000
Other: $6,206,000
Public Welfare: $4,700,000
General Local Government Support: $4,659,000
- Tax - Property: $71,858,000
Property: $56,110,000
General Sales and Gross Receipts: $5,660,000
General Sales and Gross Receipts: $4,706,000
Public Utilities Sales: $2,501,000
Motor Vehicle License: $1,411,000
Motor Vehicle License: $1,292,000
Other Selective Sales: $1,222,000
Occupation and Business License - Other: $1,199,000
Public Utilities Sales: $1,061,000
Other: $919,000
Other License: $428,000
Other License: $411,000
Occupation and Business License - Other: $6,000
- Total Salaries and Wages: $57,345,000
: $51,395,000
Supplemental Security Income (SSI) in 2006:
- Total number of recipients: 520
- Number of aged recipients: 44
- Number of blind and disabled recipients: 476
- Number of recipients under 18: 100
- Number of recipients between 18 and 64: 306
- Number of recipients older than 64: 114
- Number of recipients also receiving OASDI: 178
- Amount of payments (thousands of dollars): 222
| Home Mortgage Disclosure Act Aggregated Statistics For Year 2009 (Based on 9 full tracts) | ||||||||||||||
| A) FHA, FSA/RHS & VA Home Purchase Loans | B) Conventional Home Purchase Loans | C) Refinancings | D) Home Improvement Loans | E) Loans on Dwellings For 5+ Families | F) Non-occupant Loans on < 5 Family Dwellings (A B C & D) | G) Loans On Manufactured Home Dwelling (A B C & D) | ||||||||
|---|---|---|---|---|---|---|---|---|---|---|---|---|---|---|
| Number | Average Value | Number | Average Value | Number | Average Value | Number | Average Value | Number | Average Value | Number | Average Value | Number | Average Value | |
| LOANS ORIGINATED | 143 | $150,140 | 301 | $228,870 | 1,518 | $204,336 | 122 | $70,836 | 3 | $571,667 | 405 | $288,012 | 126 | $86,389 |
| APPLICATIONS APPROVED, NOT ACCEPTED | 3 | $119,667 | 16 | $193,188 | 70 | $170,429 | 11 | $76,091 | 0 | $0 | 21 | $259,667 | 9 | $98,333 |
| APPLICATIONS DENIED | 39 | $125,897 | 36 | $226,583 | 449 | $176,811 | 48 | $69,562 | 1 | $206,000 | 59 | $240,932 | 78 | $84,423 |
| APPLICATIONS WITHDRAWN | 24 | $132,417 | 36 | $193,389 | 284 | $189,109 | 20 | $44,000 | 0 | $0 | 36 | $251,556 | 28 | $83,857 |
| FILES CLOSED FOR INCOMPLETENESS | 12 | $140,750 | 11 | $291,545 | 81 | $196,593 | 9 | $213,333 | 0 | $0 | 15 | $361,400 | 10 | $100,000 |
| Private Mortgage Insurance Companies Aggregated Statistics For Year 2009 (Based on 9 full tracts) | ||||||
| A) Conventional Home Purchase Loans | B) Refinancings | C) Non-occupant Loans on < 5 Family Dwellings (A & B) | ||||
|---|---|---|---|---|---|---|
| Number | Average Value | Number | Average Value | Number | Average Value | |
| LOANS ORIGINATED | 13 | $234,154 | 13 | $184,769 | 0 | $0 |
| APPLICATIONS APPROVED, NOT ACCEPTED | 7 | $236,000 | 3 | $240,000 | 2 | $175,500 |
| APPLICATIONS DENIED | 1 | $171,000 | 8 | $196,250 | 1 | $171,000 |
| APPLICATIONS WITHDRAWN | 0 | $0 | 4 | $181,750 | 0 | $0 |
| FILES CLOSED FOR INCOMPLETENESS | 1 | $228,000 | 0 | $0 | 0 | $0 |
| Most common first names in Franklin County, VA among deceased individuals | ||
| Name | Count | Lived (average) |
|---|---|---|
| James | 320 | 73.1 years |
| William | 300 | 74.5 years |
| John | 289 | 75.3 years |
| Mary | 286 | 79.4 years |
| George | 176 | 76.4 years |
| Robert | 163 | 72.5 years |
| Charles | 109 | 72.6 years |
| Thomas | 107 | 74.6 years |
| Walter | 96 | 75.2 years |
| Annie | 91 | 81.6 years |
| Most common last names in Franklin County, VA among deceased individuals | ||
| Last name | Count | Lived (average) |
|---|---|---|
| Hodges | 253 | 72.2 years |
| Smith | 140 | 74.9 years |
| Young | 125 | 75.5 years |
| Jones | 113 | 77.0 years |
| Hall | 112 | 73.5 years |
| Perdue | 107 | 75.2 years |
| Brown | 107 | 78.9 years |
| Martin | 97 | 75.0 years |
| Holland | 94 | 70.2 years |
| Robertson | 94 | 76.9 years |
| Businesses in Franklin County, VA | ||||
| Name | Count | Name | Count | |
|---|---|---|---|---|
| Advance Auto Parts | 2 | Kroger | 2 | |
| Applebee's | 1 | La-Z-Boy | 3 | |
| Arby's | 1 | Lane Furniture | 2 | |
| AutoZone | 1 | Little Caesars Pizza | 1 | |
| Burger King | 1 | Lowe's | 1 | |
| CVS | 3 | MasterBrand Cabinets | 2 | |
| Chevrolet | 1 | McDonald's | 1 | |
| Comfort Inn | 1 | Papa John's Pizza | 1 | |
| Curves | 2 | Pizza Hut | 1 | |
| Dairy Queen | 5 | Quiznos | 1 | |
| Decora Cabinetry | 2 | RadioShack | 2 | |
| Domino's Pizza | 1 | SAS Shoes | 1 | |
| FedEx | 5 | Subway | 6 | |
| Ford | 1 | U-Haul | 5 | |
| Goodwill | 1 | U.S. Cellular | 2 | |
| H&R Block | 2 | UPS | 6 | |
| Hardee's | 1 | Walgreens | 1 | |
| Holiday Inn | 1 | Walmart | 1 | |
| KFC | 1 | Wendy's | 2 | |
| Kincaid | 2 | YMCA | 1 | |