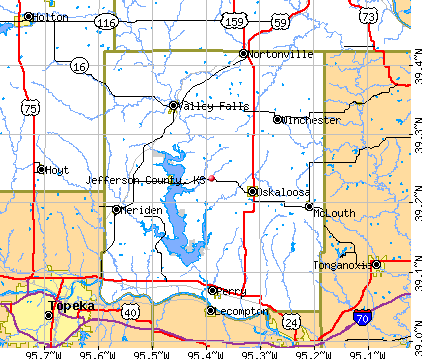
Jefferson County, Kansas (KS)
County owner-occupied free and clear houses and condos in 2010: 2,138
County owner-occupied houses and condos in 2000: 5,814
Renter-occupied apartments: 1,172 (it was 1,016 in 2000)
| % of renters here: | 15% |
| State: | 32% |
Land area: 536 sq. mi.
Water area: 20.8 sq. mi.
Population density: 34 people per square mile (low).
Industries providing employment: Educational, health and social services (24.4%), Construction (11.0%).
Type of workers:
- Private wage or salary: 69%
- Government: 24%
- Self-employed, not incorporated: 7%
- Unpaid family work: 0%
- OSM Map
- General Map
- Google Map
- MSN Map

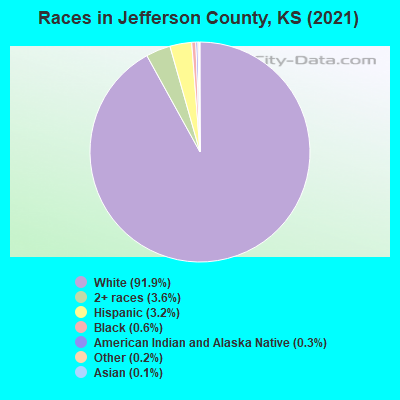
- 16,72991.5%White Non-Hispanic Alone
- 6813.7%Two or more races
- 6133.4%Hispanic or Latino
- 1140.6%Black Non-Hispanic Alone
- 800.4%American Indian and Alaska Native alone
- 430.2%Asian alone
- 200.1%Some other race alone
| Median resident age: | 43.8 years |
| Kansas median age: | 37.6 years |
| Males: 9,291 | |
| Females: 9,103 |

 | What can you tell me about Lincoln, KS? (7 replies) |
| Kansas: an economic disaster area (161 replies) |
| How Many Are Natives of Kansas? (31 replies) |
| Want to move to Kansas from San Diego, any tips on nice areas west of Kansas City, ruralish? (26 replies) |
| Looking to move to small town kansas (50 replies) |
| I want to live in rural Kansas (100 replies) |
| Jefferson County: | 2.0 people |
| Kansas: | 2 people |
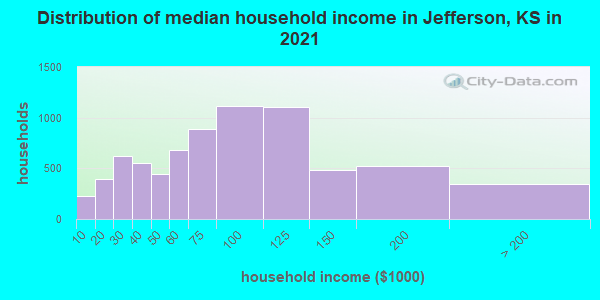
Estimated median household income in 2022: $73,683 ($45,535 in 1999)
| This county: | $73,683 |
| Kansas: | $68,925 |
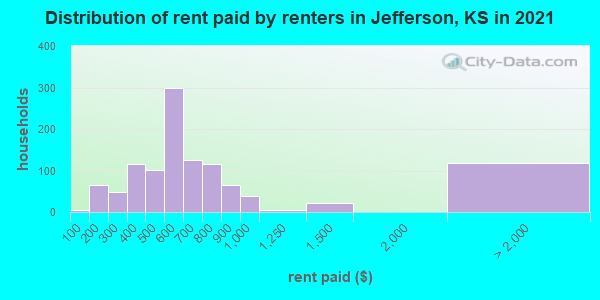
Median contract rent in 2022 for apartments: $606 (lower quartile is $486, upper quartile is $742)
| This county: | $606 |
| State: | $772 |
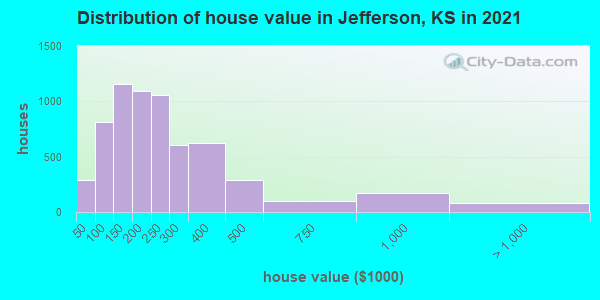
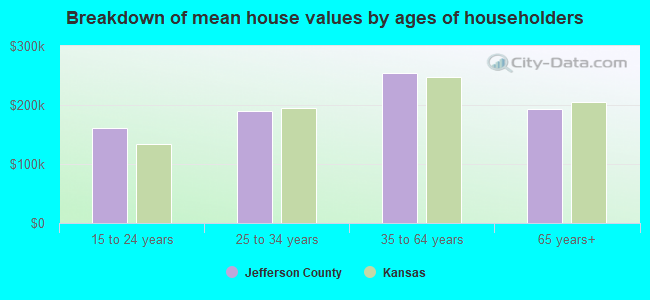
Estimated median house or condo value in 2022: $210,638 (it was $86,900 in 2000)
| Jefferson: | $210,638 |
| Kansas: | $206,600 |
Mean price in 2022:
Median monthly housing costs for homes and condos with a mortgage: $1,488Detached houses: $252,085
Here: $252,085 State: $264,181 Townhouses or other attached units: $274,377
Here: $274,377 State: $219,178 In 2-unit structures: $276,485
Here: $276,485 State: $190,919 Mobile homes: $113,066
Here: $113,066 State: $74,712
Median monthly housing costs for units without a mortgage: $618
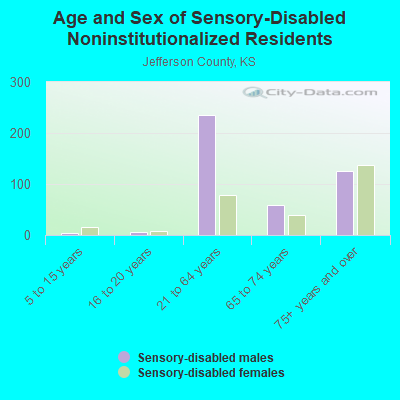
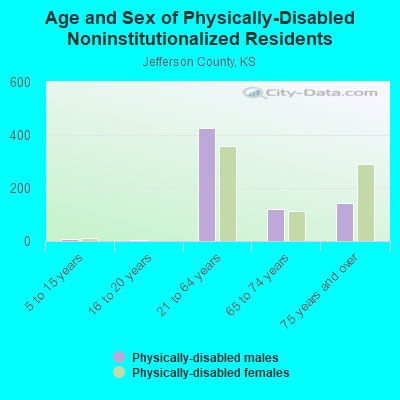
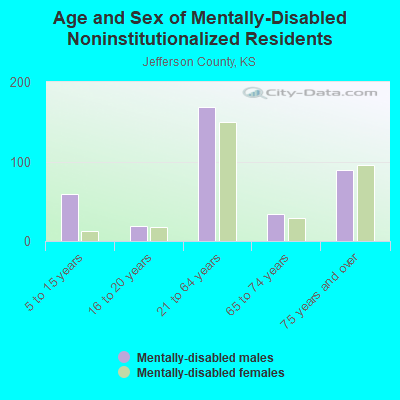
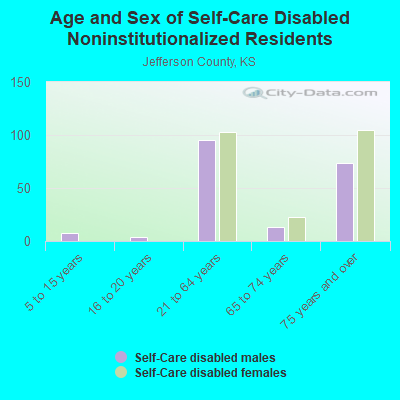
Institutionalized population: 234
Crime in 2021 (reported by the sheriff's office or county police, not the county total):
- Murders: 0
- Rapes: 3
- Robberies: 1
- Assaults: 35
- Burglaries: 106
- Thefts: 139
- Auto thefts: 28
Crime in 2020 (reported by the sheriff's office or county police, not the county total):
- Murders: 0
- Rapes: 6
- Robberies: 2
- Assaults: 40
- Burglaries: 78
- Thefts: 144
- Auto thefts: 37
Health of residents in Jefferson County based on CDC Behavioral Risk Factor Surveillance System Survey Questionnaires from 2013 to 2021:
General health status score of residents in this county from 1 (poor) to 5 (excellent) is 3.4. This is about average.70.8% of residents exercised in the past month. This is about average.
44.8% of residents smoked 100+ cigarettes in their lives. This is about average.
50.4% of adult residents drank alcohol in the past 30 days. This is less than average.
72.0% of residents visited a dentist within the past year. This is about average.
Average weight of males is 207 pounds. This is more than average.
Average weight of females is 171 pounds. This is more than average.
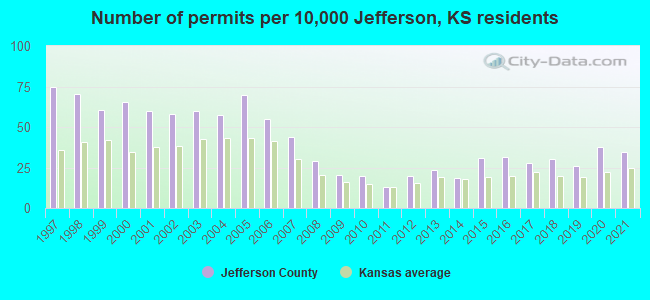
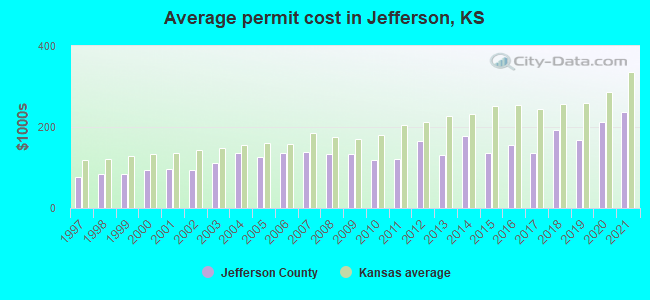
Single-family new house construction building permits:
- 2022: 69 buildings, average cost: $250,100
- 2021: 64 buildings, average cost: $236,700
- 2020: 69 buildings, average cost: $211,800
- 2019: 48 buildings, average cost: $168,600
- 2018: 56 buildings, average cost: $192,600
- 2017: 51 buildings, average cost: $136,400
- 2016: 58 buildings, average cost: $156,000
- 2015: 57 buildings, average cost: $137,300
- 2014: 34 buildings, average cost: $177,100
- 2013: 43 buildings, average cost: $130,700
- 2012: 36 buildings, average cost: $164,800
- 2011: 24 buildings, average cost: $119,700
- 2010: 36 buildings, average cost: $118,100
- 2009: 37 buildings, average cost: $132,900
- 2008: 53 buildings, average cost: $132,700
- 2007: 81 buildings, average cost: $138,300
- 2006: 101 buildings, average cost: $136,100
- 2005: 128 buildings, average cost: $124,700
- 2004: 106 buildings, average cost: $135,200
- 2003: 110 buildings, average cost: $111,400
- 2002: 107 buildings, average cost: $95,000
- 2001: 110 buildings, average cost: $96,500
- 2000: 121 buildings, average cost: $94,300
- 1999: 111 buildings, average cost: $85,300
- 1998: 130 buildings, average cost: $82,900
- 1997: 138 buildings, average cost: $76,700
Median real estate property taxes paid for housing units with mortgages in 2022: $2,556 (1.2%)
Median real estate property taxes paid for housing units with no mortgage in 2022: $2,539 (1.2%)
| Jefferson County: | 6.3% |
| Kansas: | 12.0% |
Median age of residents in 2022: 43.8 years old
(Males: 43.4 years old, Females: 43.9 years old)
(Median age for: White residents: 44.8 years old, Black residents: 46.6 years old, American Indian residents: 48.6 years old, Asian residents: 58.2 years old, Hispanic or Latino residents: 32.2 years old, Other race residents: 44.3 years old)
Area name: Topeka, KS MSA
Fair market rent in 2006 for a 1-bedroom apartment in Jefferson County is $464 a month.
Fair market rent for a 2-bedroom apartment is $568 a month.
Fair market rent for a 3-bedroom apartment is $720 a month.
Cities in this county include: Valley Falls, Oskaloosa, Perry, McLouth, Meriden, Nortonville, Winchester, Ozawkie, Grantville.
Notable locations in this county outside city limits:
Notable locations in Jefferson County: Wolf Creek Industrial Park (A), Camp Haven (B), Falcon Lakes Golf Course (C), Parallel Park (D), Highview Industrial Park (E), Burning Tree Golf Club (F), Eightmile House (G), Leavenworth County Timberlake Wastewater Treatment Plant (H), Leavenworth County Sewer District Number 3 Glenwood Estates (I), Leavenworth County Sewer District Number 1 (J), Easton Sewer Treatment Plant (K), Cal - Ann Farms (L), Brown School (M), J Larkin Industrial Park (N), Leavenworth State Fishing Lake and Wildlife Area (O), Tonganoxie Township Rural Fire Department (P), Stranger Township Volunteer Fire Department (Q), Sherman Township Fire Department Linwood Station 2 (R), Reno Township Fire Department (S), Leavenworth County Fire District 1 Station 2 (T). Display/hide their locations on the map
Shopping Center: Hillsdale Shopping Center (1). Display/hide its location on the map
Churches in Jefferson County include: Saint John's Lutheran Church (A), Round Prairie Community Church (B), Sacred Heart Catholic Church (C), High Prairie Church (D), Springdale Friends Church (E), Saint Joseph of the Valley Catholic Church (F), Bathel Church (G), Little Stranger Church (H), Emmanuel Baptist Church (I). Display/hide their locations on the map
Cemeteries: Saint Johns Cemetery (1), Evergreen Cemetery (2), Oak Hill Cemetery (3), Round Prairie Cemetery (4), Van Winkler Cemetery (5), Branch Comb Cemetery (6), Lenape Cemetery (7). Display/hide their locations on the map
Reservoirs: Yllier Lake (A), Valley Lakes (B), Happy Hollow Lake (C), Lake Stellamaris (D), State Lake (E), Flinner Lake (F). Display/hide their locations on the map
Creeks: Corral Creek (A), Threemile Creek (B), Fivemile Creek (C), Sevenmile Creek (D), Buckhorn Creek (E), Cramer Creek (F), Brush Creek (G), Prairie Creek (H), Dawson Creek (I). Display/hide their locations on the map
Parks in Jefferson County include: Leavenworth County State Park (1), Leavenworth State Fishing Lake and Wildlife Area (2). Display/hide their locations on the map
Neighboring counties: Doddridge County, West Virginia  , Hampshire County, West Virginia , Cooper County, Missouri , Jackson County, Indiana , Jackson County
  , Winchester city, Virginia .
| Here: | 1.8% |
| Kansas: | 2.0% |
Current college students: 491
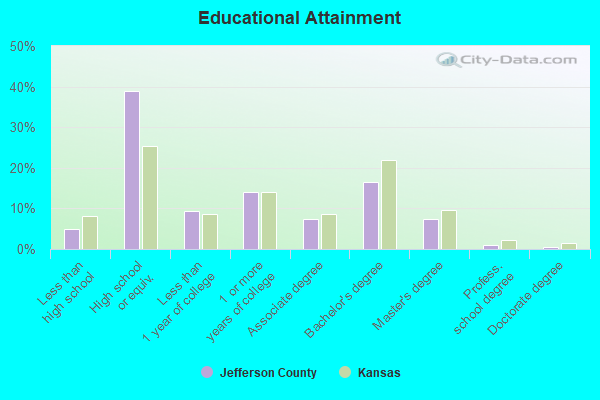
People 25 years of age or older with a high school degree or higher: 95.7%
People 25 years of age or older with a bachelor's degree or higher: 24.5%
Number of foreign born residents: 164 (40.1% naturalized citizens)
| Jefferson County: | 0.9% |
| Whole state: | 7.1% |
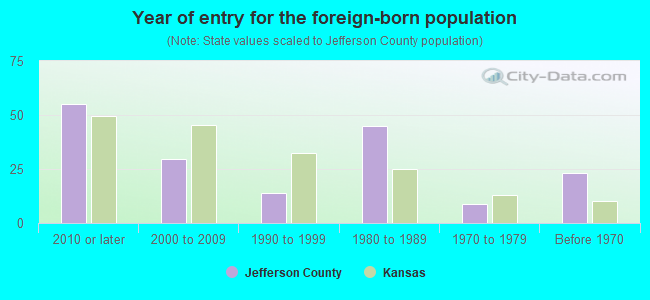
- Year of entry for the foreign-born population
- 572010 or later
- 302000 to 2009
- 221990 to 1999
- 451980 to 1989
- 91970 to 1979
- 23Before 1970
Mean travel time to work (commute): minutes
Percentage of county residents living and working in this county: 95.6%
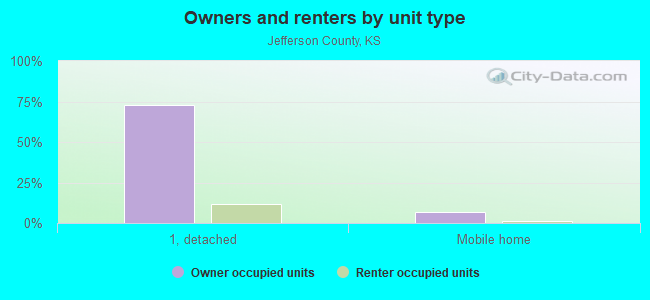
Housing units in structures:
- One, detached: 7,008
- One, attached: 40
- Two: 204
- 3 or 4: 151
- 5 to 9: 25
- 10 to 19: 36
- 20 or more: 16
- Mobile homes: 516
Housing units in Jefferson County with a mortgage: 3,665 (312 second mortgage, 0 home equity loan, 278 both second mortgage and home equity loan)
Houses without a mortgage: 129
| Here: | 2.3% with mortgage |
| State: | 97.8% with mortgage |
Religion statistics for Jefferson County
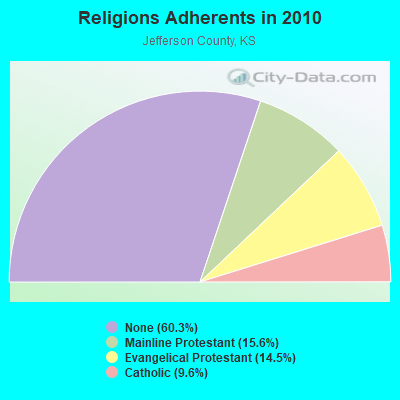
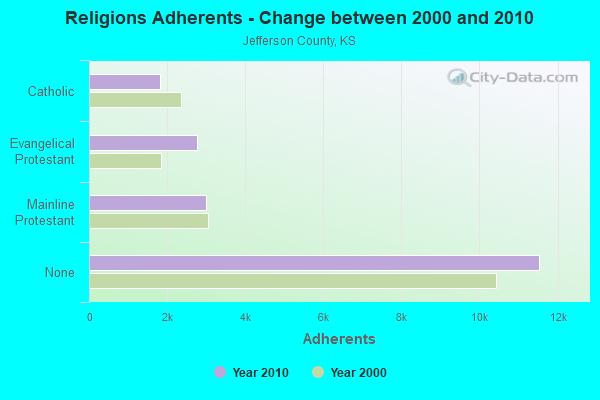
| Religion | Adherents | Congregations |
|---|---|---|
| Mainline Protestant | 2,988 | 13 |
| Evangelical Protestant | 2,770 | 20 |
| Catholic | 1,829 | 5 |
| Other | 3 | 1 |
| None | 11,536 | - |
Source: Clifford Grammich, Kirk Hadaway, Richard Houseal, Dale E.Jones, Alexei Krindatch, Richie Stanley and Richard H.Taylor. 2012. 2010 U.S.Religion Census: Religious Congregations & Membership Study. Association of Statisticians of American Religious Bodies. Jones, Dale E., et al. 2002. Congregations and Membership in the United States 2000. Nashville, TN: Glenmary Research Center.
Food Environment Statistics:
| Jefferson County: | 3.80 / 10,000 pop. |
| State: | 1.96 / 10,000 pop. |
| This county: | 1.08 / 10,000 pop. |
| Kansas: | 0.51 / 10,000 pop. |
| Jefferson County: | 7.05 / 10,000 pop. |
| Kansas: | 3.84 / 10,000 pop. |
| This county: | 4.88 / 10,000 pop. |
| State: | 7.33 / 10,000 pop. |
| Jefferson County: | 8.4% |
| Kansas: | 8.1% |
| Jefferson County: | 29.9% |
| State: | 27.9% |
| Here: | 11.9% |
| State: | 13.4% |
Agriculture in Jefferson County:
Average size of farms: 269 acresAverage value of agricultural products sold per farm: $33,463
Average value of crops sold per acre for harvested cropland: $100.87
The value of nursery, greenhouse, floriculture, and sod as a percentage of the total market value of agricultural products sold: 0.28%
The value of livestock, poultry, and their products as a percentage of the total market value of agricultural products sold: 62.66%
Average total farm production expenses per farm: $32,943
Harvested cropland as a percentage of land in farms: 46.09%
Irrigated harvested cropland as a percentage of land in farms: 1.64%
Average market value of all machinery and equipment per farm: $51,091
The percentage of farms operated by a family or individual: 93.85%
Average age of principal farm operators: 55 years
Average number of cattle and calves per 100 acres of all land in farms: 14.75
Milk cows as a percentage of all cattle and calves: 1.82%
Corn for grain: 36218 harvested acres
All wheat for grain: 3474 harvested acres
Soybeans for beans: 43812 harvested acres
Vegetables: 36 harvested acres
Land in orchards: 74 acres
Tornado activity:
Jefferson County historical area-adjusted tornado activity is significantly below Kansas state average. It is 1125674.4 times below overall U.S. average.Tornadoes in this county have caused 2 fatalities and 47 injuries recorded between 1950 and 2004.
On 4/12/1964, a category 3 (max. wind speeds 158-206 mph) tornado killed one person and injured 22 people and caused between $500,000 and $5,000,000 in damages.
Earthquake activity:
Jefferson County-area historical earthquake activity is significantly above Kansas state average. It is 527% greater than the overall U.S. average.On 9/3/2016 at 12:02:44, a magnitude 5.8 (5.8 MW, Depth: 3.5 mi, Class: Moderate, Intensity: VI - VII) earthquake occurred 211.7 miles away from Jefferson County center
On 11/6/2011 at 03:53:10, a magnitude 5.7 (5.7 MW, Depth: 3.2 mi) earthquake occurred 267.0 miles away from the county center
On 11/12/2014 at 21:40:00, a magnitude 4.9 (4.9 MW, Depth: 2.5 mi, Class: Light, Intensity: IV - V) earthquake occurred 181.9 miles away from the county center
On 11/7/2016 at 01:44:24, a magnitude 5.0 (5.0 MW, Depth: 2.8 mi) earthquake occurred 237.3 miles away from the county center
On 2/13/2016 at 17:07:06, a magnitude 5.1 (5.1 MW, Depth: 5.2 mi) earthquake occurred 262.4 miles away from Jefferson County center
On 1/19/2020 at 19:08:42, a magnitude 4.5 (4.5 MW, Depth: 3.1 mi) earthquake occurred 162.7 miles away from the county center
Magnitude types: moment magnitude (MW)
Most recent natural disasters:
- Kansas Covid-19 Pandemic, Incident Period: January 20, 2020, FEMA Id: 4504, Natural disaster type: Other
- Kansas Severe Storms, Straight-line Winds, Tornadoes, Flooding,landslides,and Mudslides, Incident Period: April 28, 2019, FEMA Id: 4449, Natural disaster type: Storm, Tornado, Mudslide, Landslide, Flood, Wind
- Kansas Severe Storms, Tornadoes, Straight-line Winds, and Flooding, Incident Period: May 04, 2015 to June 21, 2015, Major Disaster (Presidential) Declared DR-4230: July 20, 2015, FEMA Id: 4230, Natural disaster type: Storm, Tornado, Flood, Wind
- Kansas Severe Winter Storms and Snowstorm, Incident Period: December 22, 2009 to January 08, 2010, Major Disaster (Presidential) Declared DR-1885: March 09, 2010, FEMA Id: 1885, Natural disaster type: Snowstorm, Winter Storm
- Kansas Severe Winter Storms, Incident Period: December 06, 2007 to December 19, 2007, Major Disaster (Presidential) Declared DR-1741: February 01, 2008, FEMA Id: 1741, Natural disaster type: Winter Storm
- Kansas Severe Winter Storms, Incident Period: December 06, 2007 to December 19, 2007, Emergency Declared EM-3282: December 12, 2007, FEMA Id: 3282, Natural disaster type: Winter Storm
- Kansas Severe Storms and Flooding, Incident Period: October 01, 2005 to October 02, 2005, Major Disaster (Presidential) Declared DR-1615: November 15, 2005, FEMA Id: 1615, Natural disaster type: Storm, Flood
- Kansas Hurricane Katrina Evacuation, Incident Period: September 01, 2005 to October 01, 2005, Emergency Declared EM-3236: September 10, 2005, FEMA Id: 3236, Natural disaster type: Hurricane
- Kansas Severe Winter Storms, Heavy Rains, and Flooding, Incident Period: January 04, 2005 to January 06, 2005, Major Disaster (Presidential) Declared DR-1579: February 08, 2005, FEMA Id: 1579, Natural disaster type: Winter Storm, Flood, Heavy Rain
- Kansas Ice Storm, Incident Period: January 29, 2002 to February 15, 2002, Major Disaster (Presidential) Declared DR-1402: February 06, 2002, FEMA Id: 1402, Natural disaster type: Ice Storm
- 6 other natural disasters have been reported since 1953.
The number of natural disasters in Jefferson County (16) is near the US average (15).
Major Disasters (Presidential) Declared: 12
Emergencies Declared: 2
Causes of natural disasters: Floods: 9, Storms: 9, Tornadoes: 5, Winter Storms: 4, Winds: 2, Heavy Rain: 1, Hurricane: 1, Ice Storm: 1, Landslide: 1, Mudslide: 1, Snowstorm: 1, Other: 1 (Note: some incidents may be assigned to more than one category).
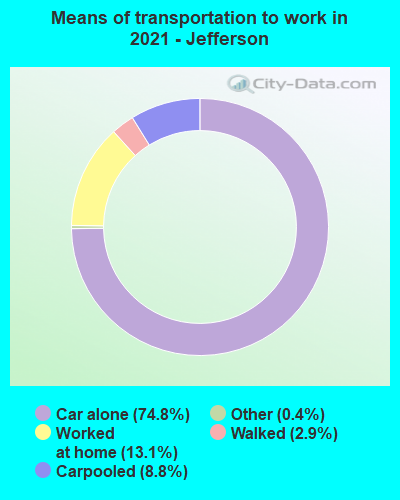
Means of transportation to work:
- Drove a car alone: 3,172 (68.6%)
- Carpooled: 431 (9.3%)
- Taxicab, motorcycle, or other means: 24 (0.5%)
- Walked: 145 (3.1%)
- Worked at home: 935 (20.2%)
- Health care and social assistance (19%)
- Educational services (15%)
- Public administration (9%)
- Professional, scientific, and technical services (8%)
- Finance and insurance (7%)
- Retail trade (6%)
- Other services, except public administration (4%)
- Health care and social assistance (21%)
- Educational services (17%)
- Public administration (10%)
- Professional, scientific, and technical services (9%)
- Finance and insurance (7%)
- Retail trade (7%)
- Other services, except public administration (5%)
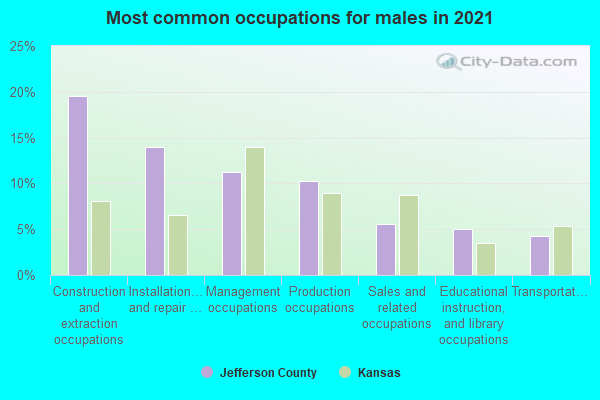
- Construction and extraction occupations (17%)
- Installation, maintenance, and repair occupations (15%)
- Production occupations (11%)
- Management occupations (10%)
- Sales and related occupations (6%)
- Educational instruction, and library occupations (5%)
- Transportation occupations (5%)
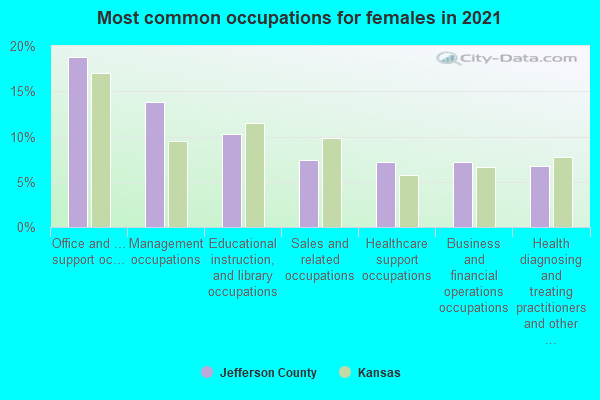
- Office and administrative support occupations (20%)
- Management occupations (12%)
- Educational instruction, and library occupations (11%)
- Healthcare support occupations (7%)
- Health diagnosing and treating practitioners and other technical occupations (6%)
- Sales and related occupations (6%)
- Health technologists and technicians (6%)
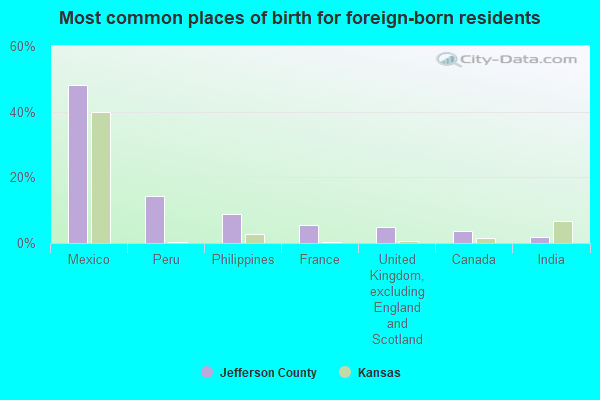
- Mexico (45%)
- Philippines (20%)
- Peru (10%)
- France (5%)
- Thailand (2%)
- China, excluding Hong Kong and Taiwan (2%)
- England (2%)
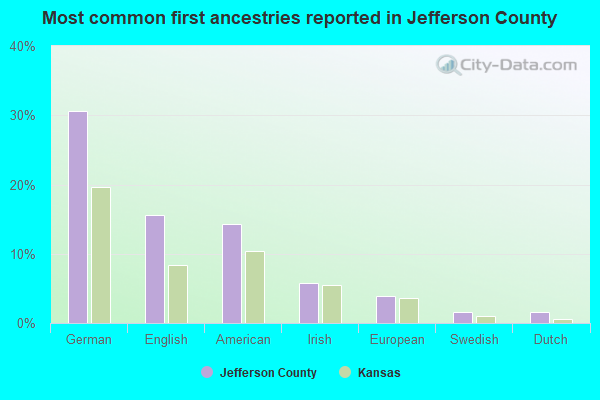
- German (25%)
- American (17%)
- English (15%)
- Irish (6%)
- European (5%)
- Italian (3%)
- Swedish (2%)
People in group quarters in Jefferson County, Kansas in 2010:
- 215 people in nursing facilities/skilled-nursing facilities
- 16 people in local jails and other municipal confinement facilities
- 3 people in group homes for juveniles (non-correctional)
People in group quarters in Jefferson County, Kansas in 2000:
- 200 people in nursing homes
- 48 people in local jails and other confinement facilities (including police lockups)
- 11 people in other noninstitutional group quarters
7.56% of this county's 2021 resident taxpayers lived in other counties in 2020 ($57,665 average adjusted gross income)
| Here: | 7.56% |
| Kansas average: | 6.64% |
10 or fewer of this county's residents moved from foreign countries.
6.06% relocated from other counties in Kansas ($43,665 average AGI)
1.50% relocated from other states ($14,000 average AGI)
Jefferson County: 1.50% Kansas average: 3.37%
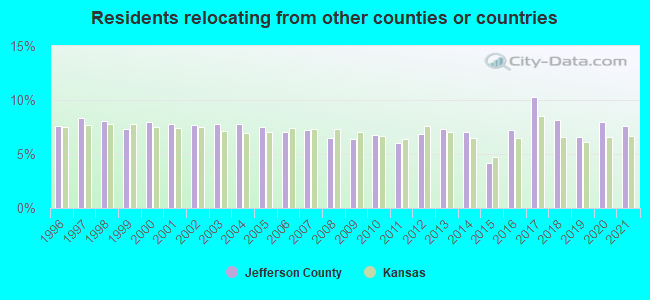
Top counties from which taxpayers relocated into this county between 2020 and 2021:
| from Shawnee County, KS | |
| from Douglas County, KS | |
| from Leavenworth County, KS | |
| from Johnson County, KS |
7.00% of this county's 2020 resident taxpayers moved to other counties in 2021 ($54,501 average adjusted gross income)
| Here: | 7.00% |
| Kansas average: | 6.88% |
10 or fewer of this county's residents moved to foreign countries.
5.39% relocated to other counties in Kansas ($40,608 average AGI)
1.61% relocated to other states ($13,893 average AGI)
Jefferson County: 1.61% Kansas average: 3.62%
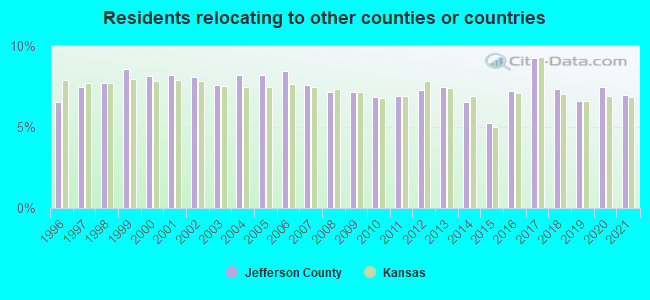
Top counties to which taxpayers relocated from this county between 2020 and 2021:
| to Shawnee County, KS | |
| to Douglas County, KS | |
| to Leavenworth County, KS | |
| to Johnson County, KS |
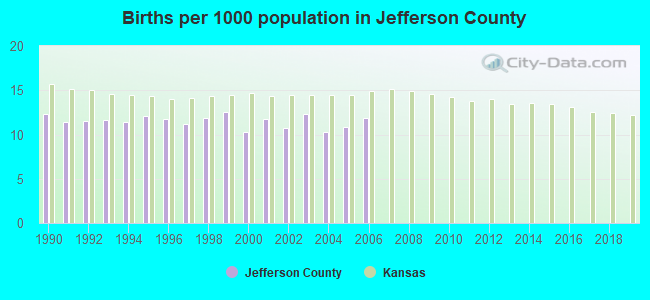
Births per 1000 population from 1990 to 1999: 11.8
Births per 1000 population from 2000 to 2006: 11.2
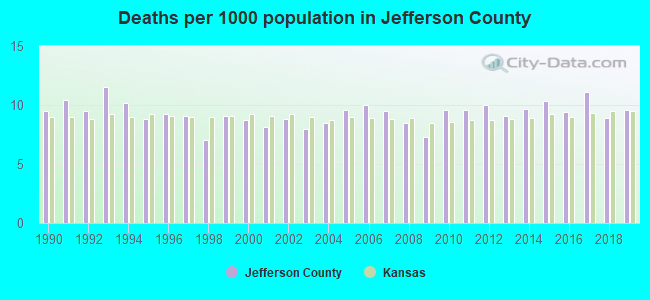
Deaths per 1000 population from 1990 to 1999: 9.4
Deaths per 1000 population from 2000 to 2009: 8.7
Deaths per 1000 population from 2010 to 2020: 9.8
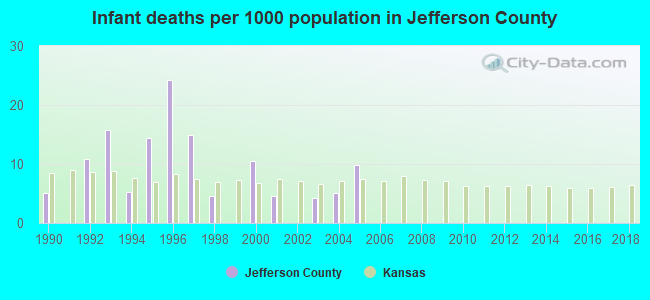
Infant deaths per 1000 live births from 1990 to 1999: 9.5
Infant deaths per 1000 live births from 2000 to 2006: 4.9
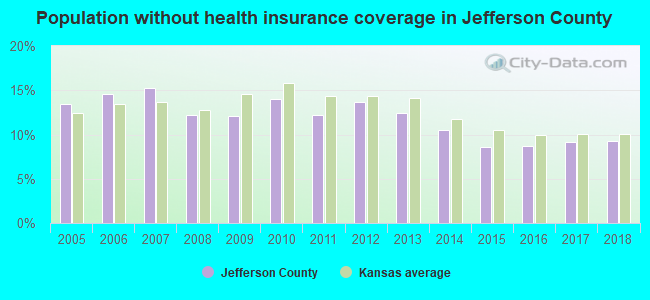
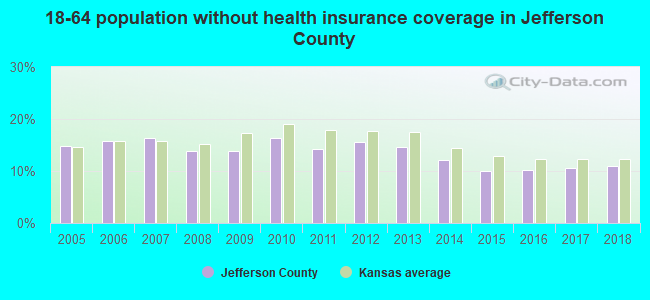
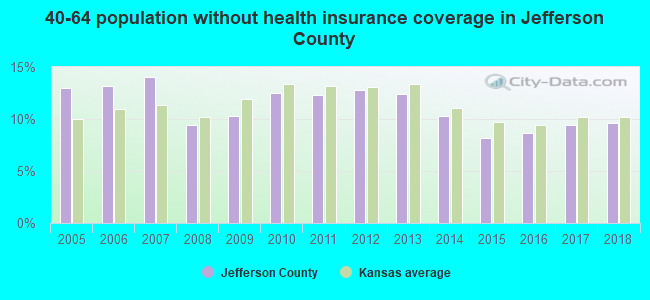
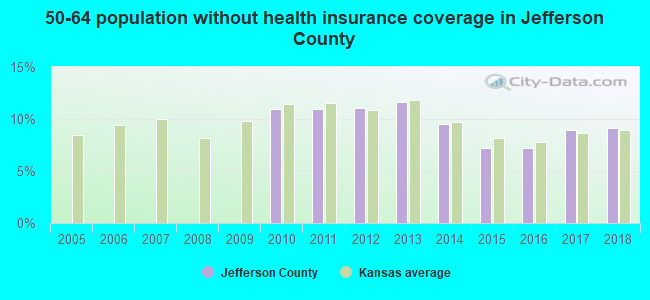
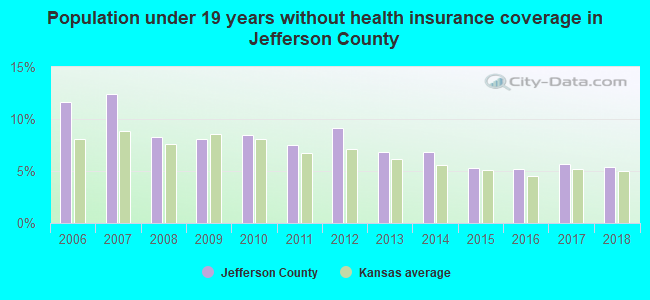
Persons under 19 years old without health insurance coverage in 2018: 5.4%
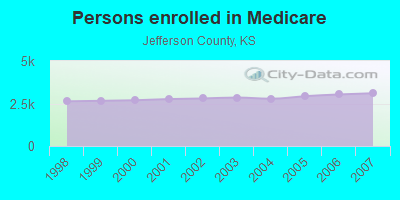
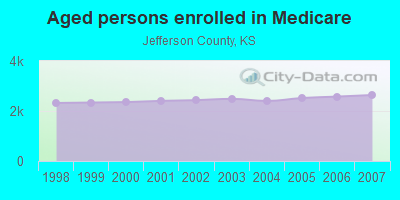
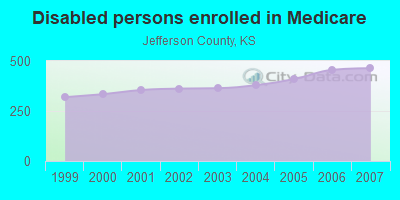
Persons enrolled in hospital insurance and/or supplemental medical insurance (Medicare) in July 1, 2007: 3,103 (2,639 aged, 464 disabled)
Children under 18 without health insurance coverage in 2007: 509 (12%)
Most common underlying causes of death in Jefferson County, Kansas in 1999 - 2019:
- Atherosclerotic heart disease (368)
- Bronchus or lung, unspecified - Malignant neoplasms (208)
- Chronic obstructive pulmonary disease, unspecified (102)
- Unspecified dementia (66)
- Alzheimer disease, unspecified (37)
- Acute myocardial infarction, unspecified (31)
- Congestive heart failure (31)
- Atherosclerotic cardiovascular disease, so described (12)
- Stroke, not specified as haemorrhage or infarction (10)
Population without health insurance coverage in 2000: 9%
Children under 18 without health insurance coverage in 2000: 6%
Short term general hospital admissions per 100,000 population in 2004: 312
Short term general hospital beds per 100,000 population in 2004: 397
Emergency room visits per 100,000 population in 2004: 1,428
General practice office based MDs per 100,000 population in 2005: 1,021
Medical specialist MDs per 100,000 population in 2005: 843
Dentists per 100,000 population in 1998: 21
Total births per 100,000 population, July 2005 - July 2006 : 16
Total deaths per 100,000 population, July 2005 - July 2006: 16
Limited-service eating places per 100,000 population in 2005 : 10
Household type by relationship:
Households: 18,394- Male householders: 3,694 (810 living alone), Female householders: 3,792 (1,072 living alone)
4,260 spouses (4,246 opposite-sex spouses), 470 unmarried partners, (430 opposite-sex unmarried partners), 5,096 children (4,771 natural, 79 adopted, 253 stepchildren), 219 grandchildren, 174 brothers or sisters, 133 parents, 9 foster children, 72 other relatives, 299 non-relatives
- In group quarters: 206
Size of family households: 2,712 2-persons, 987 3-persons, 809 4-persons, 338 5-persons, 191 6-persons, 51 7-or-more-persons.
Size of nonfamily households: 1,887 1-person, 435 2-persons, 43 3-persons, 17 4-persons, 2 5-persons.
3,309 married couples with children.
497 single-parent households (110 men, 387 women).
98.6% of residents of Jefferson speak English at home.
1.2% of residents speak Spanish at home (62% speak English very well, 30% speak English well, 8% speak English not well).
0.3% of residents speak other Indo-European language at home (83% speak English very well, 17% speak English well).
In fiscal year 2004:
Federal Government expenditure: $84,615,000 ($4,476 per capita)
Department of Defense expenditure: $4,178,000
Federal direct payments to individuals for retirement and disability: $48,151,000
Federal other direct payments to individuals: $15,499,000
Federal direct payments not to individuals: $5,100,000
Federal grants: $9,743,000
Federal procurement contracts: $2,282,000 ($1,446,000 Department of Defense)
Federal salaries and wages: $3,840,000 ($258,000 Department of Defense)
Federal Government direct loans: $575,000
Federal guaranteed/insured loans: $7,114,000
Federal Government insurance: $19,910,000
Population change from April 1, 2000 to July 1, 2005:
Births: 1,138| Here: | 60 per 1000 residents |
| State: | 75 per 1000 residents |
Deaths: 796
| Here: | 42 per 1000 residents |
| State: | 47 per 1000 residents |
Net international migration: +29
| Here: | +2 per 1000 residents |
| State: | +14 per 1000 residents |
Net internal migration: +331
| Here: | |
| State: |
Total withdrawal of fresh water for public supply: 1.62 millions of gallons per day (88% from ground, 12% from surface)
| Here: | 6.5 |
| State: | 6.9 |
| Here: | 5.6 |
| State: | 4.4 |
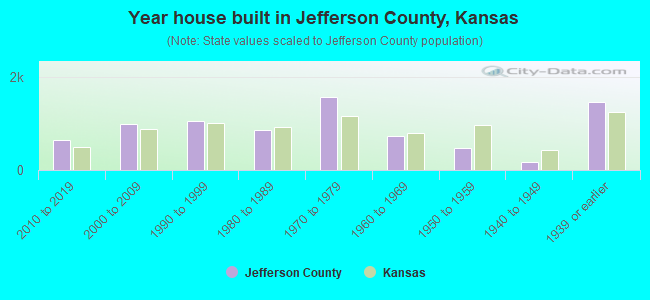
- Year house built in Jefferson County, Kansas
- 02020 or later
- 7252010 to 2019
- 1,0872000 to 2009
- 1,0361990 to 1999
- 8201980 to 1989
- 1,4861970 to 1979
- 7031960 to 1969
- 4761950 to 1959
- 2241940 to 1949
- 1,4431939 or earlier
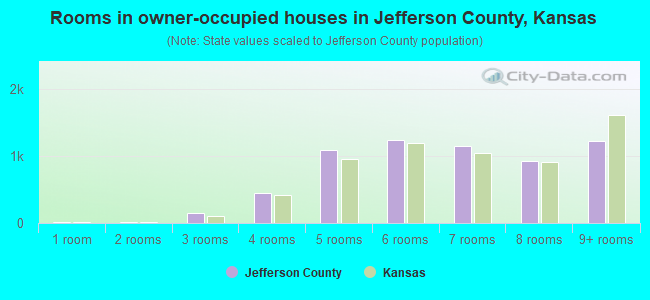
- Rooms in owner-occupied houses in Jefferson County, Kansas
- 261 room
- 82 rooms
- 1523 rooms
- 4354 rooms
- 1,1995 rooms
- 1,3976 rooms
- 1,1027 rooms
- 8478 rooms
- 1,2759+ rooms
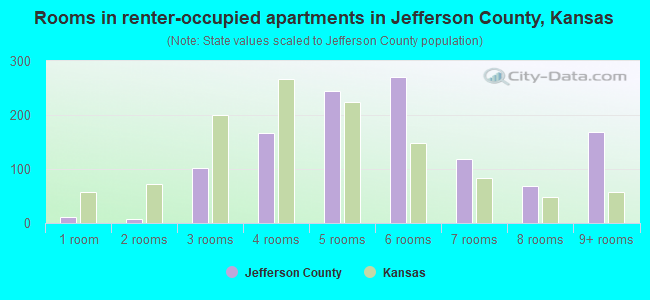
- Rooms in renter-occupied apartments in Jefferson County, Kansas
- 111 room
- 82 rooms
- 1243 rooms
- 1854 rooms
- 2035 rooms
- 2736 rooms
- 857 rooms
- 818 rooms
- 1319+ rooms
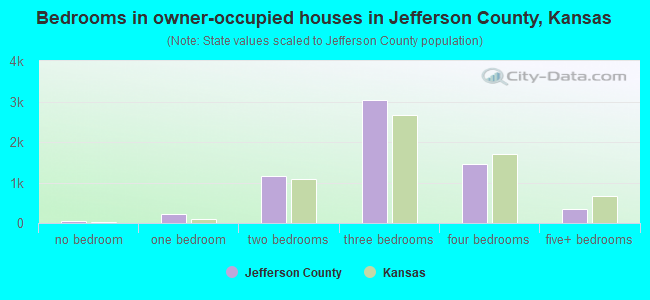
- Bedrooms in owner-occupied houses in Jefferson County, Kansas
- 48no bedroom
- 2301 bedroom
- 1,1122 bedrooms
- 3,3913 bedrooms
- 1,3204 bedrooms
- 3525+ bedrooms
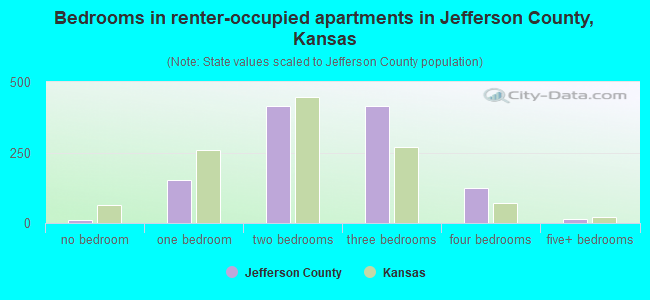
- Bedrooms in renter-occupied apartments in Jefferson County, Kansas
- 11no bedroom
- 1741 bedroom
- 4272 bedrooms
- 3143 bedrooms
- 1524 bedrooms
- 135+ bedrooms
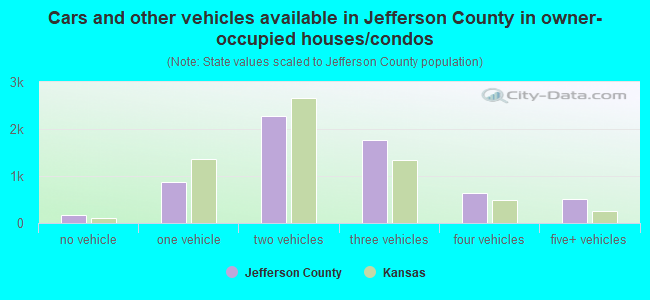
- Cars and other vehicles available in Jefferson County in owner-occupied houses/condos
- 182no vehicle
- 9271 vehicle
- 2,4232 vehicles
- 1,8293 vehicles
- 6354 vehicles
- 4285+ vehicles
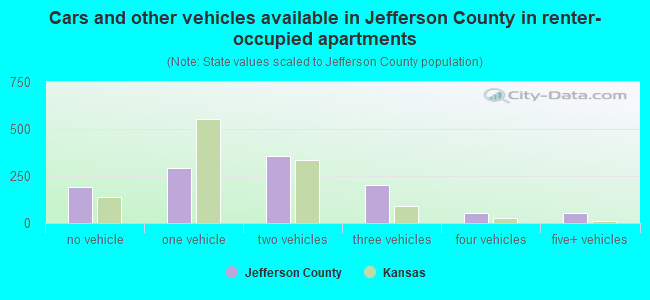
- Cars and other vehicles available in Jefferson County in renter-occupied apartments
- 179no vehicle
- 3311 vehicle
- 3642 vehicles
- 1743 vehicles
- 134 vehicles
- 365+ vehicles
92.8% of Jefferson County residents lived in the same house 1 years ago.
Out of people who lived in different houses, 27% lived in this county.
Out of people who lived in different counties, 81% lived in Kansas.
| Jefferson County: | 92.8% |
| State average: | 85.3% |
Place of birth for U.S.-born residents:
- This state: 14,190
- Other state: 3,951
- Northeast: 290
- Midwest: 1,874
- South: 936
- West: 853
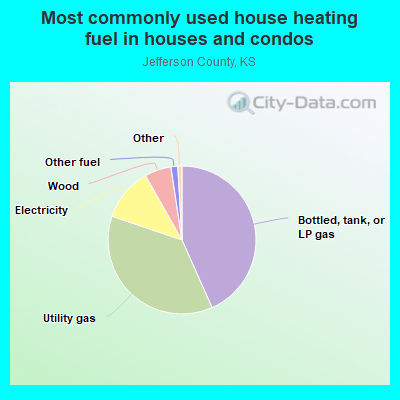
- 39.6%Bottled, tank, or LP gas
- 35.8%Utility gas
- 15.5%Electricity
- 5.6%Wood
- 2.5%Other fuel
- 0.4%Solar energy
- 0.4%Fuel oil, kerosene, etc.
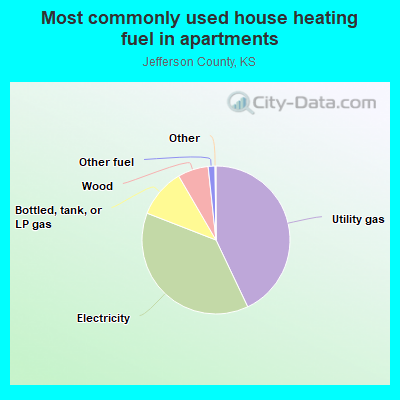
- 42.1%Utility gas
- 36.6%Electricity
- 12.1%Bottled, tank, or LP gas
- 7.4%Wood
- 1.9%Other fuel
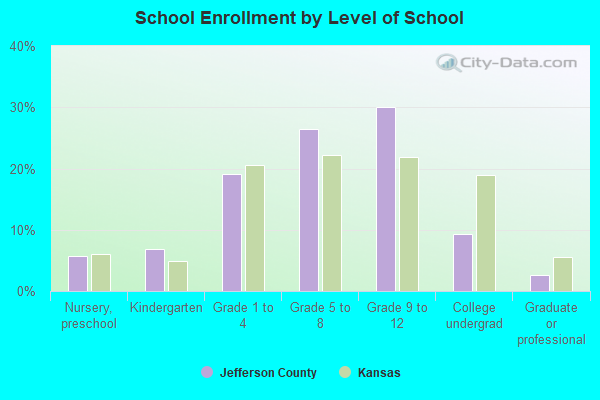
Private vs. public school enrollment:
| Here: | 21.6% |
| Kansas: | 14.1% |
| Here: | 3.8% |
| Kansas: | 10.8% |
| Here: | 21.7% |
| Kansas: | 15.4% |
Jefferson County government finances - Expenditure in 2017:
- Charges - Other: $3,978,000
- Construction - Regular Highways: $1,677,000
- Current Operations - Regular Highways: $5,988,000
Police Protection: $3,359,000
Health - Other: $2,185,000
Financial Administration: $1,318,000
General Public Buildings: $686,000
General - Other: $642,000
Judicial and Legal Services: $521,000
Central Staff Services: $485,000
- Federal Intergovernmental - Natural Resources: $132,000
- General - Interest on Debt: $184,000
- Long Term Debt - Beginning Outstanding - Unspecified Public Purpose: $4,607,000
Outstanding Unspecified Public Purpose: $4,607,000
- Miscellaneous - General Revenue - Other: $3,207,000
Interest Earnings: $26,000
- Other Funds - Cash and Securities: $8,475,000
- State Intergovernmental - Highways: $626,000
Public Welfare: $230,000
Health and Hospitals: $107,000
- Tax - Property: $12,637,000
General Sales and Gross Receipts: $1,076,000
Alcoholic Beverage License: $2,000
- Total Salaries and Wages: $7,023,000
Jefferson County government finances - Revenue in 2017:
- Charges - Other: $3,978,000
- Construction - Regular Highways: $1,677,000
- Current Operations - Regular Highways: $5,988,000
Police Protection: $3,359,000
Health - Other: $2,185,000
Financial Administration: $1,318,000
General Public Buildings: $686,000
General - Other: $642,000
Judicial and Legal Services: $521,000
Central Staff Services: $485,000
- Federal Intergovernmental - Natural Resources: $132,000
- General - Interest on Debt: $184,000
- Long Term Debt - Beginning Outstanding - Unspecified Public Purpose: $4,607,000
Outstanding Unspecified Public Purpose: $4,607,000
- Miscellaneous - General Revenue - Other: $3,207,000
Interest Earnings: $26,000
- Other Funds - Cash and Securities: $8,475,000
- State Intergovernmental - Highways: $626,000
Public Welfare: $230,000
Health and Hospitals: $107,000
- Tax - Property: $12,637,000
General Sales and Gross Receipts: $1,076,000
Alcoholic Beverage License: $2,000
- Total Salaries and Wages: $7,023,000
Jefferson County government finances - Debt in 2017:
- Charges - Other: $3,978,000
- Construction - Regular Highways: $1,677,000
- Current Operations - Regular Highways: $5,988,000
Police Protection: $3,359,000
Health - Other: $2,185,000
Financial Administration: $1,318,000
General Public Buildings: $686,000
General - Other: $642,000
Judicial and Legal Services: $521,000
Central Staff Services: $485,000
- Federal Intergovernmental - Natural Resources: $132,000
- General - Interest on Debt: $184,000
- Long Term Debt - Beginning Outstanding - Unspecified Public Purpose: $4,607,000
Outstanding Unspecified Public Purpose: $4,607,000
- Miscellaneous - General Revenue - Other: $3,207,000
Interest Earnings: $26,000
- Other Funds - Cash and Securities: $8,475,000
- State Intergovernmental - Highways: $626,000
Public Welfare: $230,000
Health and Hospitals: $107,000
- Tax - Property: $12,637,000
General Sales and Gross Receipts: $1,076,000
Alcoholic Beverage License: $2,000
- Total Salaries and Wages: $7,023,000
Jefferson County government finances - Cash and Securities in 2017:
- Charges - Other: $3,978,000
- Construction - Regular Highways: $1,677,000
- Current Operations - Regular Highways: $5,988,000
Police Protection: $3,359,000
Health - Other: $2,185,000
Financial Administration: $1,318,000
General Public Buildings: $686,000
General - Other: $642,000
Judicial and Legal Services: $521,000
Central Staff Services: $485,000
- Federal Intergovernmental - Natural Resources: $132,000
- General - Interest on Debt: $184,000
- Long Term Debt - Beginning Outstanding - Unspecified Public Purpose: $4,607,000
Outstanding Unspecified Public Purpose: $4,607,000
- Miscellaneous - General Revenue - Other: $3,207,000
Interest Earnings: $26,000
- Other Funds - Cash and Securities: $8,475,000
- State Intergovernmental - Highways: $626,000
Public Welfare: $230,000
Health and Hospitals: $107,000
- Tax - Property: $12,637,000
General Sales and Gross Receipts: $1,076,000
Alcoholic Beverage License: $2,000
- Total Salaries and Wages: $7,023,000
Supplemental Security Income (SSI) in 2006:
- Total number of recipients: 177
- Number of aged recipients: 14
- Number of blind and disabled recipients: 163
- Number of recipients under 18: 23
- Number of recipients between 18 and 64: 125
- Number of recipients older than 64: 29
- Number of recipients also receiving OASDI: 65
- Amount of payments (thousands of dollars): 85
| Most common first names in Jefferson County, KS among deceased individuals | ||
| Name | Count | Lived (average) |
|---|---|---|
| William | 136 | 74.4 years |
| John | 120 | 75.2 years |
| James | 93 | 76.0 years |
| Charles | 89 | 76.7 years |
| Mary | 81 | 77.7 years |
| George | 78 | 76.4 years |
| Robert | 72 | 70.1 years |
| Helen | 63 | 78.5 years |
| Dorothy | 51 | 80.3 years |
| Frank | 49 | 79.5 years |
| Most common last names in Jefferson County, KS among deceased individuals | ||
| Last name | Count | Lived (average) |
|---|---|---|
| Smith | 33 | 77.2 years |
| Brown | 30 | 76.4 years |
| Miller | 28 | 80.1 years |
| Edmonds | 27 | 84.5 years |
| Johnson | 24 | 80.7 years |
| Clark | 23 | 76.4 years |
| Davis | 23 | 80.1 years |
| Allen | 23 | 71.3 years |
| Meyer | 23 | 79.7 years |
| Noll | 23 | 81.1 years |
| Businesses in Jefferson County, KS | ||||
| Name | Count | Name | Count | |
|---|---|---|---|---|
| La-Z-Boy | 1 | Subway | 1 | |
| Nike | 1 | UPS | 1 | |