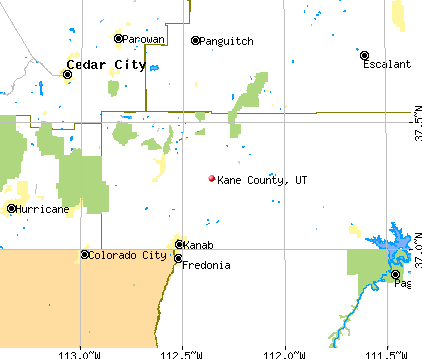
Kane County, Utah (UT)
County owner-occupied free and clear houses and condos in 2010: 891
County owner-occupied houses and condos in 2000: 1,746
Renter-occupied apartments: 737 (it was 491 in 2000)
| % of renters here: | 22% |
| State: | 30% |
Land area: 3992 sq. mi.
Water area: 116.5 sq. mi.
Population density: 2 people per square mile (very low).
Industries providing employment: Educational, health and social services (17.7%), Retail trade (11.7%), Arts, entertainment, recreation, accommodation and food services (10.9%).
Type of workers:
- Private wage or salary: 78%
- Government: 18%
- Self-employed, not incorporated: 4%
- Unpaid family work: 0%
- OSM Map
- General Map
- Google Map
- MSN Map

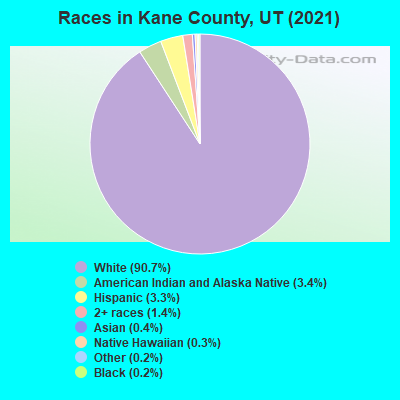
- 7,22590.8%White Non-Hispanic Alone
- 4495.6%Hispanic or Latino
- 1241.6%American Indian and Alaska Native alone
- 1161.5%Two or more races
- 140.2%Some other race alone
- 130.2%Black Non-Hispanic Alone
- 100.1%Asian alone
- 40.05%Native Hawaiian and Other
Pacific Islander alone
| Median resident age: | 43.9 years |
| Utah median age: | 32.1 years |
| Males: 4,015 | |
| Females: 4,029 |

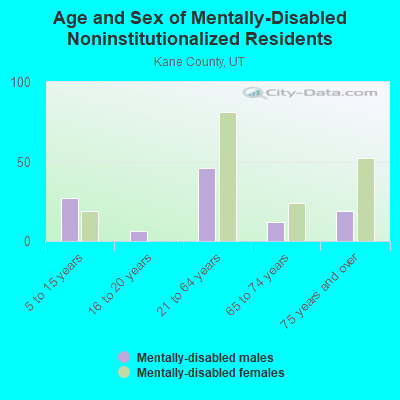
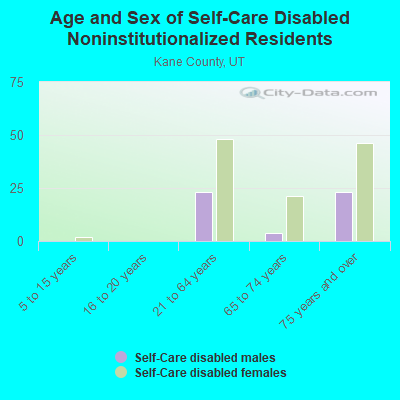
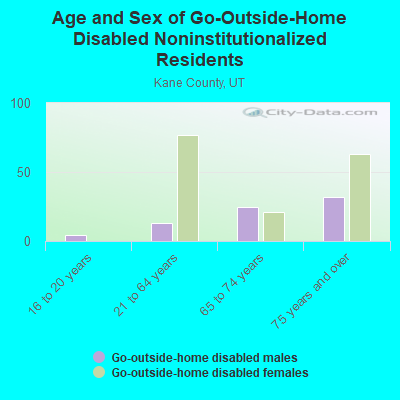
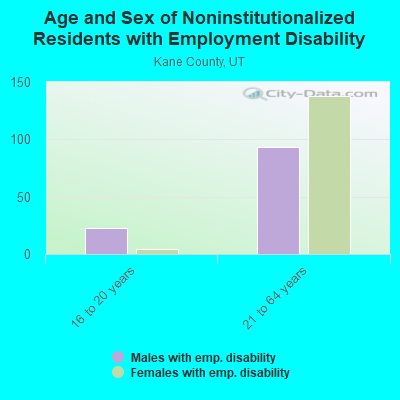
 | Living In Kanab with Disabilities? (6 replies) |
| Polygamists in Big Water UT (38 replies) |
| Should Utah Lighten Its Liquor Laws? (45 replies) |
| Medical care in Kanab (10 replies) |
| Kanab, Utah 2015 (6 replies) |
| Looking for Boomtown with no snow in Utah? (33 replies) |
| Kane County: | 2.0 people |
| Utah: | 3 people |
Estimated median household income in 2022: $72,218 ($34,247 in 1999)
| This county: | $72,218 |
| Utah: | $89,168 |
Median contract rent in 2022 for apartments: $1,051 (lower quartile is $682, upper quartile is $1,331)
| This county: | $1051 |
| State: | $1252 |
Estimated median house or condo value in 2022: $363,773 (it was $95,900 in 2000)
| Kane: | $363,773 |
| Utah: | $499,500 |
Median monthly housing costs for homes and condos with a mortgage: $1,413
Median monthly housing costs for units without a mortgage: $388
Institutionalized population: 100
Crime in 2021 (reported by the sheriff's office or county police, not the county total):
- Murders: 0
- Rapes: 2
- Robberies: 0
- Assaults: 26
- Burglaries: 3
- Thefts: 16
- Auto thefts: 2
Crime in 2020 (reported by the sheriff's office or county police, not the county total):
- Murders: 0
- Rapes: 4
- Robberies: 0
- Assaults: 14
- Burglaries: 3
- Thefts: 16
- Auto thefts: 1
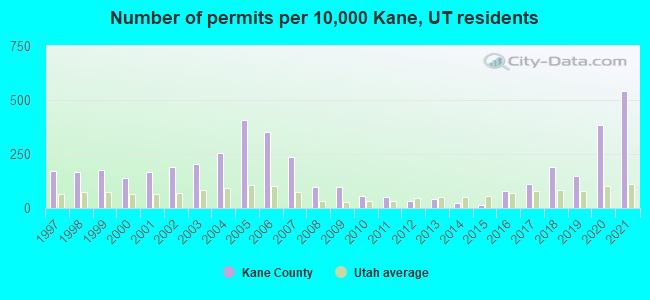
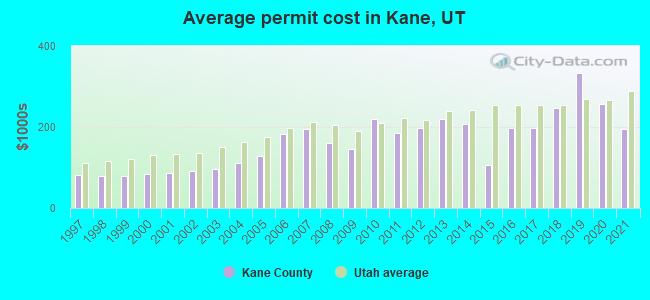
Single-family new house construction building permits:
- 2022: 203 buildings, average cost: $286,200
- 2021: 327 buildings, average cost: $194,100
- 2020: 231 buildings, average cost: $256,500
- 2019: 88 buildings, average cost: $334,000
- 2018: 115 buildings, average cost: $246,000
- 2017: 66 buildings, average cost: $198,100
- 2016: 49 buildings, average cost: $197,900
- 2015: 9 buildings, average cost: $106,100
- 2014: 15 buildings, average cost: $208,100
- 2013: 24 buildings, average cost: $218,900
- 2012: 19 buildings, average cost: $197,800
- 2011: 30 buildings, average cost: $184,800
- 2010: 33 buildings, average cost: $218,500
- 2009: 59 buildings, average cost: $146,400
- 2008: 60 buildings, average cost: $160,500
- 2007: 142 buildings, average cost: $194,900
- 2006: 213 buildings, average cost: $182,500
- 2005: 247 buildings, average cost: $128,200
- 2004: 153 buildings, average cost: $112,400
- 2003: 124 buildings, average cost: $95,900
- 2002: 116 buildings, average cost: $90,600
- 2001: 100 buildings, average cost: $87,400
- 2000: 83 buildings, average cost: $84,600
- 1999: 107 buildings, average cost: $78,400
- 1998: 100 buildings, average cost: $79,000
- 1997: 102 buildings, average cost: $80,900
Median real estate property taxes paid for housing units with mortgages in 2022: $1,392 (0.4%)
Median real estate property taxes paid for housing units with no mortgage in 2022: $1,489 (0.4%)
| Kane County: | 12.4% |
| Utah: | 8.2% |
Median age of residents in 2022: 43.9 years old
(Males: 42.8 years old, Females: 44.7 years old)
(Median age for: White residents: 44.6 years old, Black residents: 30.3 years old, American Indian residents: 44.3 years old, Asian residents: 35.2 years old, Hispanic or Latino residents: 34.9 years old, Other race residents: 23.7 years old)
Fair market rent in 2006 for a 1-bedroom apartment in Kane County is $483 a month.
Fair market rent for a 2-bedroom apartment is $591 a month.
Fair market rent for a 3-bedroom apartment is $837 a month.
Cities in this county include: Kanab, Orderville, Big Water, Glendale, Alton.
Neighboring counties: Dade County, Missouri  , San Francisco County, California
  , Jasper County, Missouri , Hart County, Kentucky , Marion County, Kentucky .
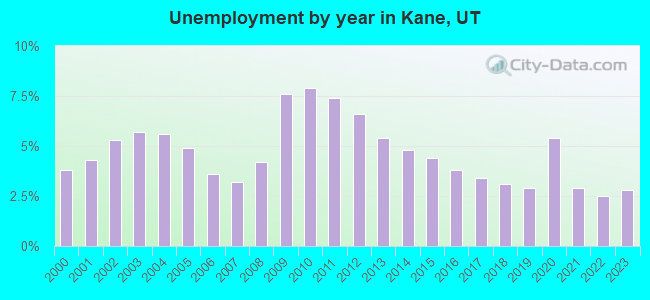
| Here: | 3.3% |
| Utah: | 2.5% |
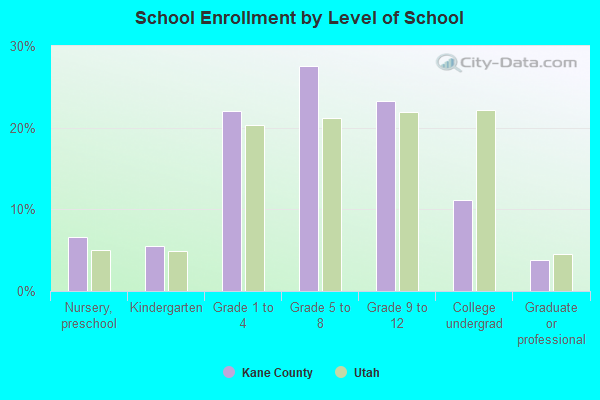
Current college students: 243
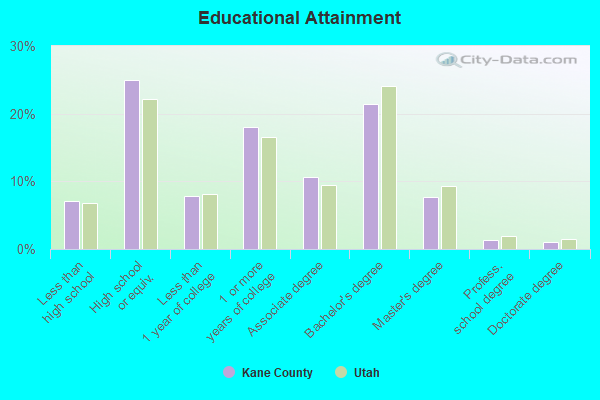
People 25 years of age or older with a high school degree or higher: 94.4%
People 25 years of age or older with a bachelor's degree or higher: 32.4%
Number of foreign born residents: 184 (70.0% naturalized citizens)
| Kane County: | 2.3% |
| Whole state: | 8.6% |
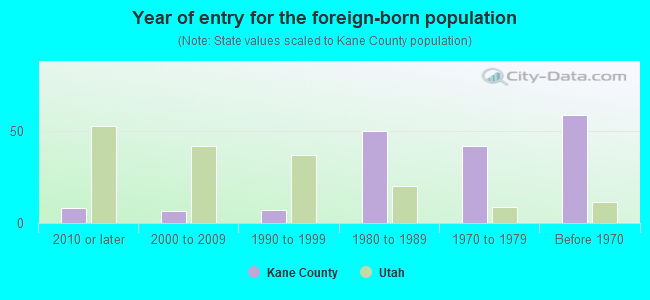
- Year of entry for the foreign-born population
- 792010 or later
- 262000 to 2009
- 71990 to 1999
- 501980 to 1989
- 421970 to 1979
- 59Before 1970
Mean travel time to work (commute): minutes
Percentage of county residents living and working in this county: 92.2%
Housing units in structures:
- One, detached: 5,425
- One, attached: 148
- Two: 71
- 5 to 9: 46
- 10 to 19: 95
- 20 or more: 9
- Mobile homes: 571
- Boats, RVs, vans, etc.: 35
Housing units in Kane County with a mortgage: 1,514 (126 second mortgage, 0 home equity loan, 140 both second mortgage and home equity loan)
Houses without a mortgage: 0
| Here: | 100.0% with mortgage |
| State: | 97.7% with mortgage |
Religion statistics for Kane County
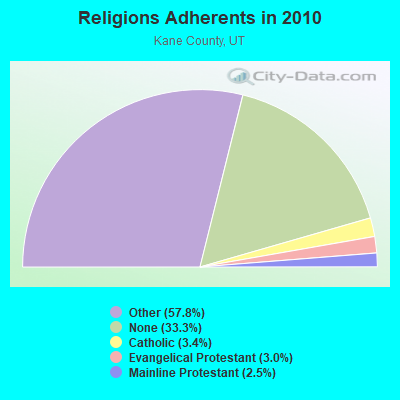
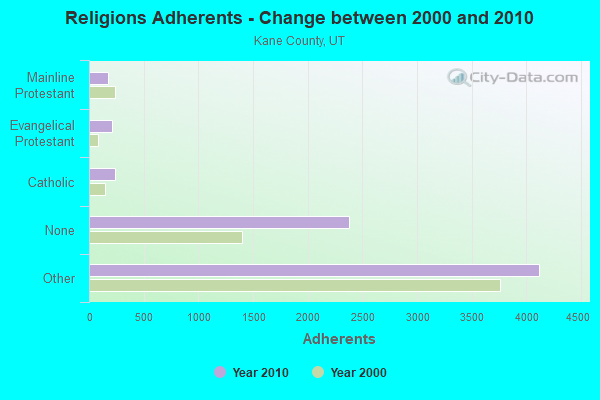
| Religion | Adherents | Congregations |
|---|---|---|
| Other | 4,119 | 14 |
| Catholic | 242 | 2 |
| Evangelical Protestant | 213 | 4 |
| Mainline Protestant | 176 | 4 |
| None | 2,375 | - |
Source: Clifford Grammich, Kirk Hadaway, Richard Houseal, Dale E.Jones, Alexei Krindatch, Richie Stanley and Richard H.Taylor. 2012. 2010 U.S.Religion Census: Religious Congregations & Membership Study. Association of Statisticians of American Religious Bodies. Jones, Dale E., et al. 2002. Congregations and Membership in the United States 2000. Nashville, TN: Glenmary Research Center.
Food Environment Statistics:
| Kane County: | 3.07 / 10,000 pop. |
| State: | 1.37 / 10,000 pop. |
| This county: | 3.07 / 10,000 pop. |
| Utah: | 0.41 / 10,000 pop. |
| Kane County: | 13.83 / 10,000 pop. |
| Utah: | 2.82 / 10,000 pop. |
| This county: | 19.98 / 10,000 pop. |
| State: | 5.09 / 10,000 pop. |
| Kane County: | 8.7% |
| Utah: | 6.3% |
| Kane County: | 23.1% |
| State: | 23.6% |
Agriculture in Kane County:
Average size of farms: 1190 acresAverage value of agricultural products sold per farm: $25,841
Average total farm production expenses per farm: $26,885
Harvested cropland as a percentage of land in farms: 1.38%
Irrigated harvested cropland as a percentage of land in farms: 87.83%
Average market value of all machinery and equipment per farm: $43,600
The percentage of farms operated by a family or individual: 85.50%
Average age of principal farm operators: 59 years
Average number of cattle and calves per 100 acres of all land in farms: 5.08
Milk cows as a percentage of all cattle and calves: 0.05%
Land in orchards: 25 acres
Earthquake activity:
Kane County-area historical earthquake activity is significantly above Utah state average. It is 3274% greater than the overall U.S. average.On 6/28/1992 at 11:57:34, a magnitude 7.6 (6.2 MB, 7.6 MS, 7.3 MW, Depth: 0.7 mi, Class: Major, Intensity: VIII - XII) earthquake occurred 317.1 miles away from Kane County center, causing 3 deaths (1 shaking deaths, 2 other deaths) and 400 injuries, causing $100,000,000 total damage and $40,000,000 insured losses
On 10/16/1999 at 09:46:44, a magnitude 7.4 (6.3 MB, 7.4 MS, 7.2 MW, 7.3 ML) earthquake occurred 297.6 miles away from the county center
On 10/3/1915 at 06:52:48, a magnitude 7.6 (7.6 UK) earthquake occurred 355.2 miles away from the county center
On 7/21/1952 at 11:52:14, a magnitude 7.7 (7.7 UK) earthquake occurred 402.7 miles away from the county center, causing $50,000,000 total damage
On 12/21/1932 at 06:10:09, a magnitude 7.2 (7.2 UK) earthquake occurred 323.7 miles away from Kane County center
On 5/19/1940 at 04:36:40, a magnitude 7.2 (7.2 UK) earthquake occurred 337.8 miles away from the county center, causing $33,000,000 total damage
Magnitude types: body-wave magnitude (MB), local magnitude (ML), surface-wave magnitude (MS), moment magnitude (MW)
Most recent natural disasters:
- Utah Covid-19 Pandemic, Incident Period: January 20, 2020, FEMA Id: 4525, Natural disaster type: Other
- Utah Shingle Fire, Incident Period: July 02, 2012, Fire Management Assistance Declared: July 02, 2012, FEMA Id: 2994, Natural disaster type: Fire
- Utah Severe Winter Storms and Flooding, Incident Period: December 20, 2010 to December 24, 2010, Major Disaster (Presidential) Declared DR-1955: February 11, 2011, FEMA Id: 1955, Natural disaster type: Winter Storm, Flood
- Utah Hurricane Katrina Evacuation, Incident Period: August 29, 2005 to October 01, 2005, Emergency Declared EM-3223: September 05, 2005, FEMA Id: 3223, Natural disaster type: Hurricane
- Utah Flood and Landslide, Incident Period: April 28, 2005 to June 29, 2005, Major Disaster (Presidential) Declared DR-1598: August 01, 2005, FEMA Id: 1598, Natural disaster type: Landslide, Flood
- Utah Severe Storms and Flooding, Incident Period: January 08, 2005 to January 12, 2005, Major Disaster (Presidential) Declared DR-1576: February 01, 2005, FEMA Id: 1576, Natural disaster type: Storm, Flood
- Utah Drought, Incident Period: January 20, 1977, Emergency Declared EM-3024: January 20, 1977, FEMA Id: 3024, Natural disaster type: Drought
The number of natural disasters in Kane County (7) is smaller than the US average (15).
Major Disasters (Presidential) Declared: 3
Emergencies Declared: 2
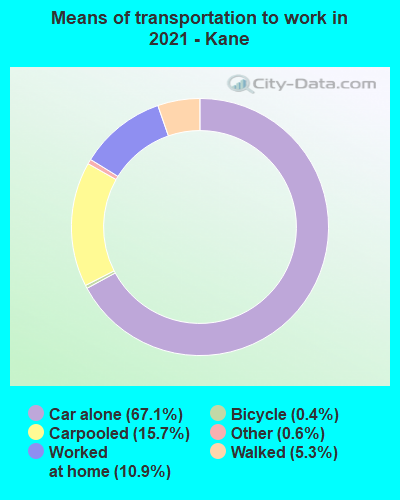
Means of transportation to work:
- Drove a car alone: 2,813 (65.2%)
- Carpooled: 646 (15.0%)
- Taxicab, motorcycle, or other means: 61 (1.4%)
- Bicycle: 28 (0.6%)
- Walked: 98 (2.3%)
- Worked at home: 667 (15.5%)
- Other services, except public administration (28%)
- Educational services (20%)
- Accommodation and food services (10%)
- Retail trade (8%)
- Finance and insurance (7%)
- Professional, scientific, and technical services (6%)
- Public administration (5%)
- Other services, except public administration (26%)
- Educational services (19%)
- Accommodation and food services (9%)
- Retail trade (7%)
- Finance and insurance (7%)
- Professional, scientific, and technical services (6%)
- Public administration (5%)
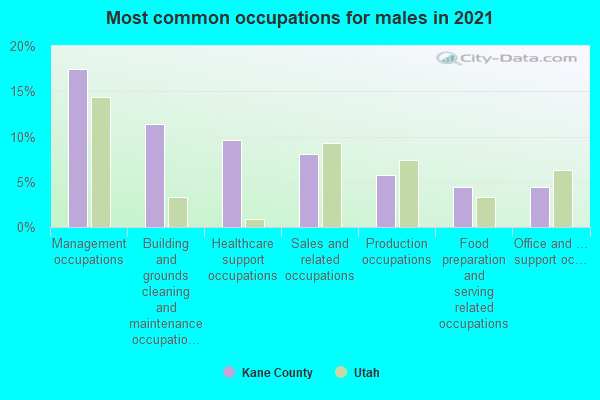
- Management occupations (20%)
- Production occupations (8%)
- Healthcare support occupations (8%)
- Food preparation and serving related occupations (7%)
- Sales and related occupations (7%)
- Personal care and service occupations (7%)
- Installation, maintenance, and repair occupations (5%)
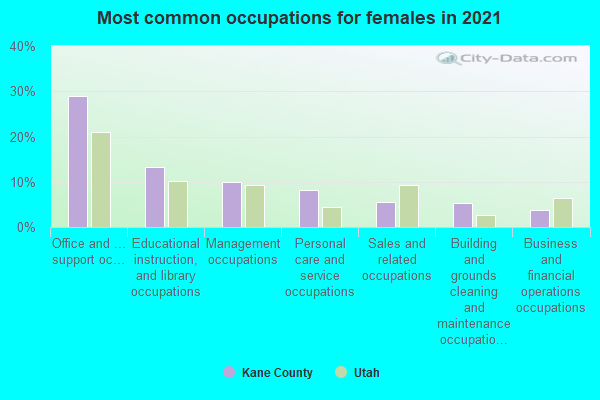
- Office and administrative support occupations (25%)
- Educational instruction, and library occupations (13%)
- Personal care and service occupations (11%)
- Management occupations (10%)
- Sales and related occupations (8%)
- Business and financial operations occupations (6%)
- Food preparation and serving related occupations (4%)
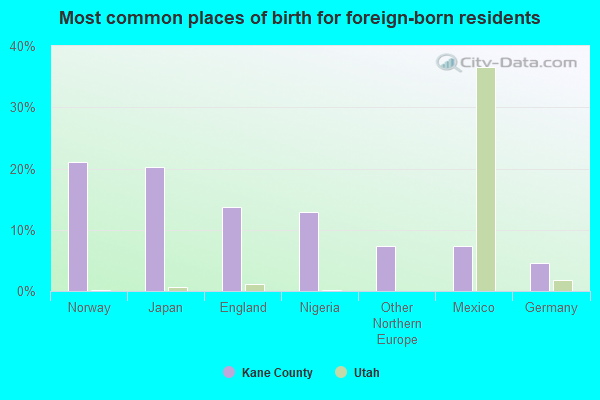
- Brazil (24%)
- Norway (15%)
- Other Eastern Asia (11%)
- England (11%)
- Other Northern Europe (9%)
- Turkey (8%)
- Japan (8%)
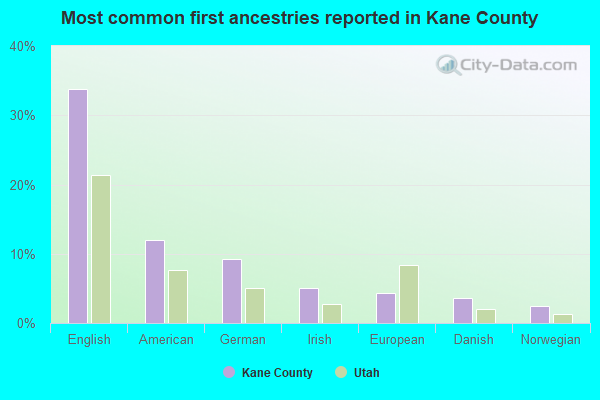
- English (38%)
- American (9%)
- German (8%)
- European (6%)
- Irish (5%)
- Lebanese (3%)
- Danish (3%)

People in group quarters in Kane County, Utah in 2010:
- 64 people in residential schools for people with disabilities
- 22 people in local jails and other municipal confinement facilities
- 14 people in nursing facilities/skilled-nursing facilities
People in group quarters in Kane County, Utah in 2000:
- 26 people in other workers' dormitories
- 22 people in mental (psychiatric) hospitals or wards
- 8 people in nursing homes
- 6 people in local jails and other confinement facilities (including police lockups)
- 5 people in other nonhousehold living situations
12.45% of this county's 2021 resident taxpayers lived in other counties in 2020 ($66,314 average adjusted gross income)
| Here: | 12.45% |
| Utah average: | 7.95% |
10 or fewer of this county's residents moved from foreign countries.
4.36% relocated from other counties in Utah ($21,279 average AGI)
8.10% relocated from other states ($45,033 average AGI)
Kane County: 8.10% Utah average: 3.91%
Top counties from which taxpayers relocated into this county between 2020 and 2021:
| from Washington County, UT | |
| from Coconino County, AZ | |
| from Salt Lake County, UT | |
| from Clark County, NV |
9.47% of this county's 2020 resident taxpayers moved to other counties in 2021 ($48,654 average adjusted gross income)
| Here: | 9.47% |
| Utah average: | 7.39% |
10 or fewer of this county's residents moved to foreign countries.
4.26% relocated to other counties in Utah ($23,364 average AGI)
5.21% relocated to other states ($25,290 average AGI)
Kane County: 5.21% Utah average: 3.34%
Top counties to which taxpayers relocated from this county between 2020 and 2021:
| to Washington County, UT | |
| to Coconino County, AZ | |
| to Iron County, UT |
Births per 1000 population from 1990 to 1999: 14.8
Births per 1000 population from 2000 to 2006: 14.5
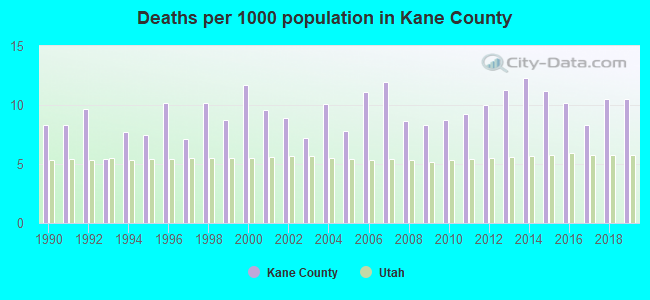
Deaths per 1000 population from 1990 to 1999: 8.3
Deaths per 1000 population from 2000 to 2009: 9.5
Deaths per 1000 population from 2010 to 2020: 10.1
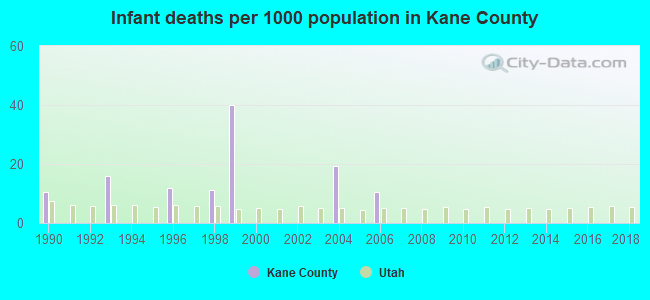
Infant deaths per 1000 live births from 1990 to 1999: 9.0
Infant deaths per 1000 live births from 2000 to 2006: 4.3
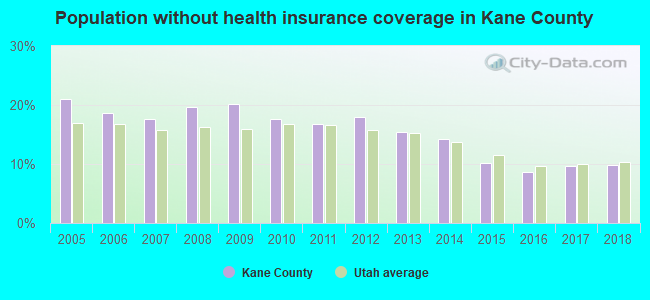
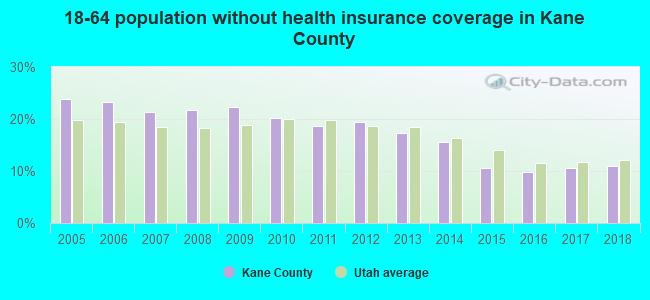
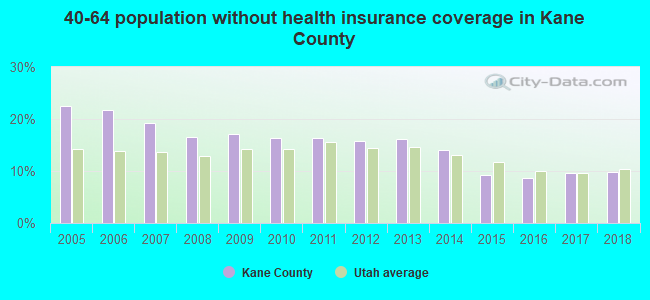
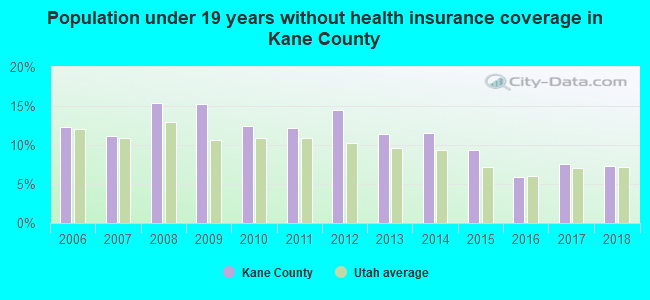
Persons under 19 years old without health insurance coverage in 2018: 7.3%
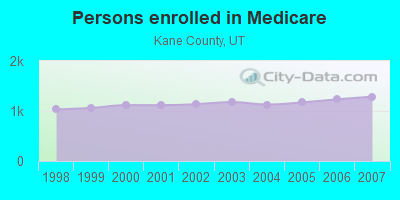
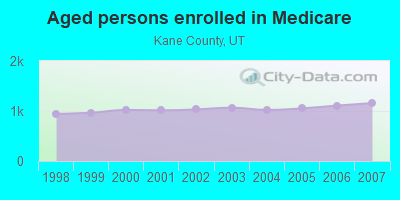
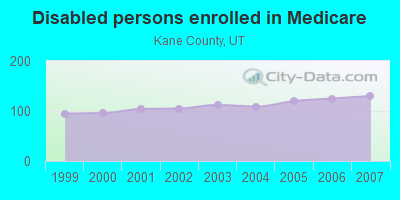
Persons enrolled in hospital insurance and/or supplemental medical insurance (Medicare) in July 1, 2007: 1,288 (1,158 aged, 130 disabled)
Children under 18 without health insurance coverage in 2007: 150 (9%)
Most common underlying causes of death in Kane County, Utah in 1999 - 2019:
- Unspecified dementia (10)
Population without health insurance coverage in 2000: 19%
Children under 18 without health insurance coverage in 2000: 19%
Short term general hospital admissions per 100,000 population in 2004: 5,908
Short term general hospital beds per 100,000 population in 2004: 615
Emergency room visits per 100,000 population in 2004: 45,257
General practice office based MDs per 100,000 population in 2005: 2,015
Medical specialist MDs per 100,000 population in 2005: 984
Dentists per 100,000 population in 1998: 16
Total births per 100,000 population, July 2005 - July 2006 : 16
Total deaths per 100,000 population, July 2005 - July 2006: 161
Limited-service eating places per 100,000 population in 2005 : 16
Household type by relationship:
Households: 8,044- Male householders: 1,563 (518 living alone), Female householders: 1,870 (639 living alone)
1,708 spouses (1,704 opposite-sex spouses), 167 unmarried partners, (167 opposite-sex unmarried partners), 1,977 children (1,874 natural, 74 adopted, 25 stepchildren), 58 grandchildren, 38 brothers or sisters, 153 parents, 0 foster children, 13 other relatives, 292 non-relatives
- In group quarters: 269
Size of family households: 1,143 2-persons, 397 3-persons, 183 4-persons, 205 5-persons, 81 6-persons, 33 7-or-more-persons.
Size of nonfamily households: 1,159 1-person, 118 2-persons, 88 3-persons, 23 4-persons.
1,351 married couples with children.
252 single-parent households (3 men, 249 women).
97.5% of residents of Kane speak English at home.
1.4% of residents speak Spanish at home (80% speak English very well, 4% speak English well, 16% don't speak English at all).
0.5% of residents speak other Indo-European language at home (100% speak English very well).
0.7% of residents speak Asian or Pacific Island language at home (91% speak English very well, 9% speak English well).
0.2% of residents speak other language at home (50% speak English very well, 50% speak English not well).
In fiscal year 2004:
Federal Government expenditure: $38,162,000 ($6,177 per capita)
Department of Defense expenditure: $911,000
Federal direct payments to individuals for retirement and disability: $18,410,000
Federal other direct payments to individuals: $6,250,000
Federal direct payments not to individuals: $154,000
Federal grants: $6,349,000
Federal procurement contracts: $2,213,000 ($-95,000 Department of Defense)
Federal salaries and wages: $4,786,000 ($0,000 Department of Defense)
Federal Government direct loans: $4,797,000
Federal guaranteed/insured loans: $1,684,000
Federal Government insurance: $1,771,000
Population change from April 1, 2000 to July 1, 2005:
Births: 388| Here: | 63 per 1000 residents |
| State: | 103 per 1000 residents |
Deaths: 273
| Here: | 44 per 1000 residents |
| State: | 28 per 1000 residents |
Net international migration: +10
| Here: | +2 per 1000 residents |
| State: | +20 per 1000 residents |
Net internal migration: +46
| Here: | |
| State: |
Total withdrawal of fresh water for public supply: 2.40 millions of gallons per day (all from ground)
| Here: | 6.0 |
| State: | 7.6 |
| Here: | 4.1 |
| State: | 4.3 |
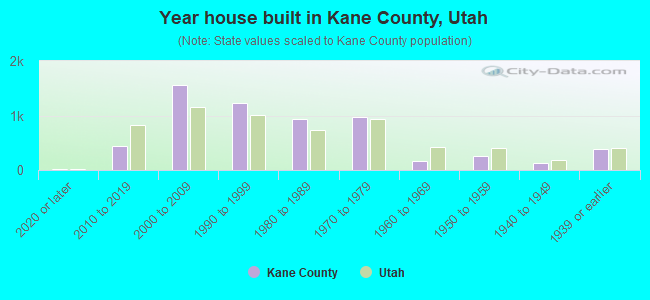
- Year house built in Kane County, Utah
- 522020 or later
- 5862010 to 2019
- 1,5392000 to 2009
- 1,3021990 to 1999
- 8791980 to 1989
- 1,0321970 to 1979
- 1611960 to 1969
- 2171950 to 1959
- 711940 to 1949
- 3261939 or earlier

- Rooms in owner-occupied houses in Kane County, Utah
- 01 room
- 1212 rooms
- 523 rooms
- 5534 rooms
- 4345 rooms
- 4136 rooms
- 3017 rooms
- 3328 rooms
- 5209+ rooms
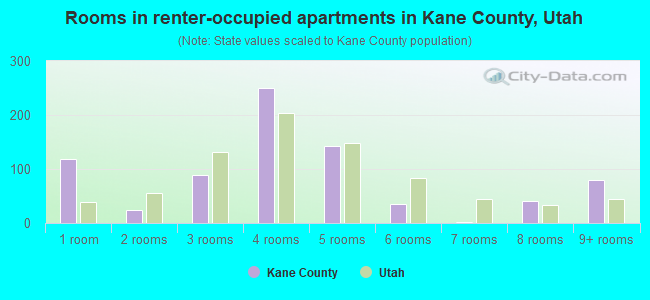
- Rooms in renter-occupied apartments in Kane County, Utah
- 951 room
- 142 rooms
- 983 rooms
- 2904 rooms
- 1215 rooms
- 256 rooms
- 07 rooms
- 618 rooms
- 419+ rooms
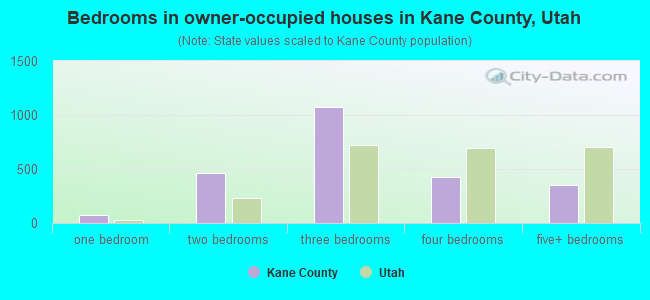
- Bedrooms in owner-occupied houses in Kane County, Utah
- 19no bedroom
- 1361 bedroom
- 5372 bedrooms
- 1,1623 bedrooms
- 4124 bedrooms
- 4065+ bedrooms
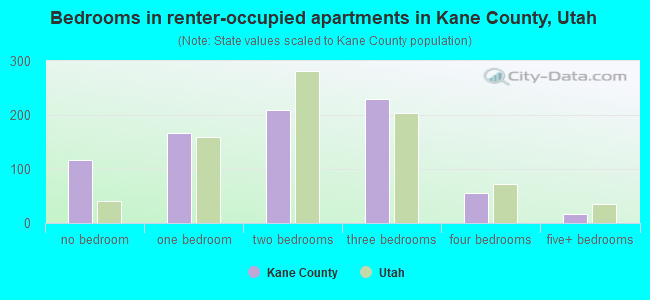
- Bedrooms in renter-occupied apartments in Kane County, Utah
- 95no bedroom
- 1481 bedroom
- 2092 bedrooms
- 2053 bedrooms
- 704 bedrooms
- 195+ bedrooms
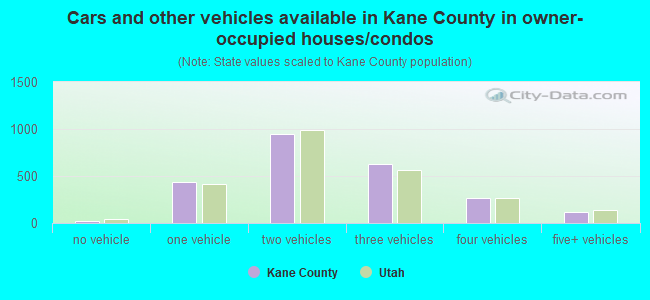
- Cars and other vehicles available in Kane County in owner-occupied houses/condos
- 24no vehicle
- 5671 vehicle
- 9952 vehicles
- 7153 vehicles
- 2414 vehicles
- 1485+ vehicles
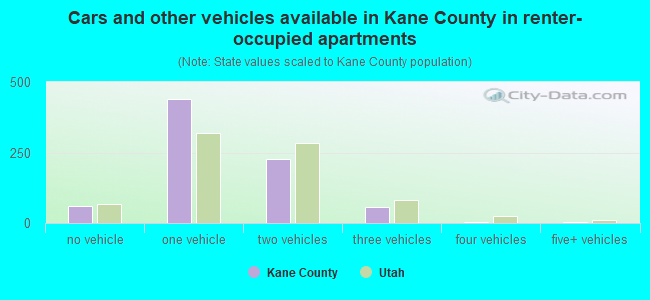
- Cars and other vehicles available in Kane County in renter-occupied apartments
- 126no vehicle
- 3151 vehicle
- 2302 vehicles
- 623 vehicles
- 44 vehicles
- 45+ vehicles
86.4% of Kane County residents lived in the same house 1 years ago.
Out of people who lived in different houses, 21% lived in this county.
Out of people who lived in different counties, 31% lived in Utah.
| Kane County: | 86.4% |
| State average: | 85.7% |
Place of birth for U.S.-born residents:
- This state: 4,013
- Other state: 3,823
- Northeast: 671
- Midwest: 693
- South: 523
- West: 1,972
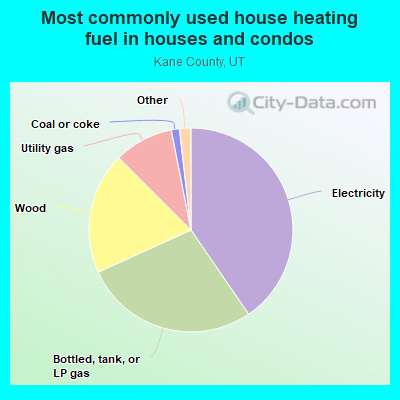
- 47.8%Electricity
- 22.4%Bottled, tank, or LP gas
- 18.1%Wood
- 8.0%Utility gas
- 1.1%Other fuel
- 1.0%Fuel oil, kerosene, etc.
- 0.8%No fuel used
- 0.7%Coal or coke
- 0.2%Solar energy
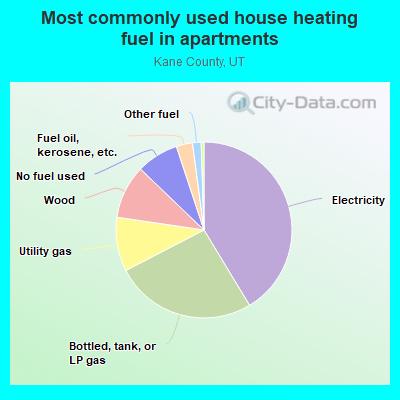
- 37.6%Bottled, tank, or LP gas
- 35.7%Electricity
- 10.7%No fuel used
- 9.1%Wood
- 3.9%Utility gas
- 1.5%Other fuel
- 1.4%Fuel oil, kerosene, etc.
Private vs. public school enrollment:
| Here: | 2.7% |
| Utah: | 7.2% |
| Here: | 0.8% |
| Utah: | 5.3% |
| Here: | 60.8% |
| Utah: | 26.7% |
Kane County government finances - Expenditure in 2020:
- Bond Funds - Cash and Securities: $2,265,000
Cash and Securities: $2,215,000
- Charges - Hospital Public: $10,016,000
Hospital Public: $9,955,000
Other: $2,431,000
Other: $1,524,000
Solid Waste Management: $1,360,000
Solid Waste Management: $1,067,000
Sewerage: $76,000
Parks and Recreation: $45,000
Parks and Recreation: $1,000
- Construction - General - Other: $618,000
General Public Buildings: $91,000
Parks and Recreation: $50,000
General - Other: $17,000
Parks and Recreation: $6,000
Solid Waste Management: $2,000
Local Fire Protection: $1,000
- Current Operations - Hospitals: $8,726,000
Hospitals: $8,572,000
Correctional Institutions: $8,000,000
Central Staff Services: $6,771,000
Regular Highways: $4,679,000
General - Other: $4,445,000
Police Protection: $3,380,000
Parks and Recreation: $3,370,000
Central Staff Services: $3,093,000
Health - Other: $2,964,000
Regular Highways: $2,893,000
Correctional Institutions: $2,367,000
Financial Administration: $1,992,000
Judicial and Legal Services: $1,982,000
General - Other: $1,902,000
Housing and Community Development: $1,875,000
Health - Other: $1,514,000
General Public Buildings: $1,394,000
Police Protection: $1,236,000
Public Welfare - Other: $1,035,000
Financial Administration: $954,000
Local Fire Protection: $944,000
Judicial and Legal Services: $874,000
Solid Waste Management: $838,000
Solid Waste Management: $699,000
Housing and Community Development: $595,000
Local Fire Protection: $587,000
Public Welfare - Other: $419,000
General Public Buildings: $404,000
Protective Inspection and Regulation - Other: $350,000
Water Utilities: $136,000
Elementary and Secondary Education: $133,000
Protective Inspection and Regulation - Other: $133,000
Parks and Recreation: $112,000
Water Utilities: $82,000
Sewerage: $54,000
Libraries: $34,000
Libraries: $33,000
- Federal Intergovernmental - Natural Resources: $1,249,000
Highways: $1,103,000
Other: $318,000
Other: $213,000
Highways: $176,000
Education: $122,000
Water Utilities: $40,000
- General - Interest on Debt: $538,000
Interest on Debt: $128,000
- Intergovernmental to Local - Other - General - Other: $40,000
Other - General - Other: $20,000
Other - Regular Highways: $10,000
- Intergovernmental to State - Regular Highways: $31,000
Regular Highways: $2,000
- Local Intergovernmental - Other: $970,000
Other: $956,000
Highways: $368,000
Highways: $328,000
General Local Government Support: $52,000
- Long Term Debt - Outstanding Unspecified Public Purpose: $25,288,000
Beginning Outstanding - Unspecified Public Purpose: $23,500,000
Issue, Unspecified Public Purpose: $2,630,000
Beginning Outstanding - Unspecified Public Purpose: $1,811,000
Outstanding Unspecified Public Purpose: $1,429,000
Retired Unspecified Public Purpose: $840,000
Retired Unspecified Public Purpose: $819,000
Issue, Unspecified Public Purpose: $438,000
Beginning Outstanding - Public Debt for Private Purpose: $194,000
Outstanding Nonguaranteed - Industrial Revenue: $194,000
- Miscellaneous - General Revenue - Other: $3,269,000
Donations From Private Sources: $1,904,000
Interest Earnings: $1,516,000
Rents: $973,000
General Revenue - Other: $771,000
Special Assessments: $362,000
Fines and Forfeits: $319,000
Interest Earnings: $304,000
Donations From Private Sources: $297,000
Rents: $125,000
Sale of Property: $55,000
Fines and Forfeits: $1,000
- Other Capital Outlay - General - Other: $2,351,000
Local Fire Protection: $1,056,000
Police Protection: $326,000
Correctional Institutions: $117,000
Police Protection: $72,000
Protective Inspection and Regulation - Other: $60,000
Financial Administration: $40,000
Correctional Institutions: $30,000
Parks and Recreation: $20,000
Local Fire Protection: $6,000
Public Welfare - Other: $3,000
Judicial and Legal Services: $1,000
General - Other: $1,000
- Other Funds - Cash and Securities: $40,795,000
Cash and Securities: $37,679,000
- Revenue - Water Utilities: $256,000
Water Utilities: $154,000
- Sinking Funds - Cash and Securities: $494,000
Cash and Securities: $277,000
- State Intergovernmental - Other: $7,360,000
Other: $3,405,000
Highways: $3,207,000
Highways: $1,807,000
General Local Government Support: $1,290,000
General Local Government Support: $24,000
- Tax - Property: $12,589,000
Other Selective Sales: $6,863,000
Property: $6,571,000
Other Selective Sales: $4,758,000
General Sales and Gross Receipts: $881,000
General Sales and Gross Receipts: $779,000
Other: $298,000
Other License: $227,000
Occupation and Business License - Other: $126,000
Public Utilities Sales: $60,000
Occupation and Business License - Other: $53,000
Motor Vehicle License: $5,000
Other License: $2,000
- Total Salaries and Wages: $17,459,000
: $10,461,000
- Water Utilities - Interest on Debt: $403,000
Interest on Debt: $7,000
Kane County government finances - Revenue in 2020:
- Bond Funds - Cash and Securities: $2,265,000
Cash and Securities: $2,215,000
- Charges - Hospital Public: $10,016,000
Hospital Public: $9,955,000
Other: $2,431,000
Other: $1,524,000
Solid Waste Management: $1,360,000
Solid Waste Management: $1,067,000
Sewerage: $76,000
Parks and Recreation: $45,000
Parks and Recreation: $1,000
- Construction - General - Other: $618,000
General Public Buildings: $91,000
Parks and Recreation: $50,000
General - Other: $17,000
Parks and Recreation: $6,000
Solid Waste Management: $2,000
Local Fire Protection: $1,000
- Current Operations - Hospitals: $8,726,000
Hospitals: $8,572,000
Correctional Institutions: $8,000,000
Central Staff Services: $6,771,000
Regular Highways: $4,679,000
General - Other: $4,445,000
Police Protection: $3,380,000
Parks and Recreation: $3,370,000
Central Staff Services: $3,093,000
Health - Other: $2,964,000
Regular Highways: $2,893,000
Correctional Institutions: $2,367,000
Financial Administration: $1,992,000
Judicial and Legal Services: $1,982,000
General - Other: $1,902,000
Housing and Community Development: $1,875,000
Health - Other: $1,514,000
General Public Buildings: $1,394,000
Police Protection: $1,236,000
Public Welfare - Other: $1,035,000
Financial Administration: $954,000
Local Fire Protection: $944,000
Judicial and Legal Services: $874,000
Solid Waste Management: $838,000
Solid Waste Management: $699,000
Housing and Community Development: $595,000
Local Fire Protection: $587,000
Public Welfare - Other: $419,000
General Public Buildings: $404,000
Protective Inspection and Regulation - Other: $350,000
Water Utilities: $136,000
Elementary and Secondary Education: $133,000
Protective Inspection and Regulation - Other: $133,000
Parks and Recreation: $112,000
Water Utilities: $82,000
Sewerage: $54,000
Libraries: $34,000
Libraries: $33,000
- Federal Intergovernmental - Natural Resources: $1,249,000
Highways: $1,103,000
Other: $318,000
Other: $213,000
Highways: $176,000
Education: $122,000
Water Utilities: $40,000
- General - Interest on Debt: $538,000
Interest on Debt: $128,000
- Intergovernmental to Local - Other - General - Other: $40,000
Other - General - Other: $20,000
Other - Regular Highways: $10,000
- Intergovernmental to State - Regular Highways: $31,000
Regular Highways: $2,000
- Local Intergovernmental - Other: $970,000
Other: $956,000
Highways: $368,000
Highways: $328,000
General Local Government Support: $52,000
- Long Term Debt - Outstanding Unspecified Public Purpose: $25,288,000
Beginning Outstanding - Unspecified Public Purpose: $23,500,000
Issue, Unspecified Public Purpose: $2,630,000
Beginning Outstanding - Unspecified Public Purpose: $1,811,000
Outstanding Unspecified Public Purpose: $1,429,000
Retired Unspecified Public Purpose: $840,000
Retired Unspecified Public Purpose: $819,000
Issue, Unspecified Public Purpose: $438,000
Beginning Outstanding - Public Debt for Private Purpose: $194,000
Outstanding Nonguaranteed - Industrial Revenue: $194,000
- Miscellaneous - General Revenue - Other: $3,269,000
Donations From Private Sources: $1,904,000
Interest Earnings: $1,516,000
Rents: $973,000
General Revenue - Other: $771,000
Special Assessments: $362,000
Fines and Forfeits: $319,000
Interest Earnings: $304,000
Donations From Private Sources: $297,000
Rents: $125,000
Sale of Property: $55,000
Fines and Forfeits: $1,000
- Other Capital Outlay - General - Other: $2,351,000
Local Fire Protection: $1,056,000
Police Protection: $326,000
Correctional Institutions: $117,000
Police Protection: $72,000
Protective Inspection and Regulation - Other: $60,000
Financial Administration: $40,000
Correctional Institutions: $30,000
Parks and Recreation: $20,000
Local Fire Protection: $6,000
Public Welfare - Other: $3,000
Judicial and Legal Services: $1,000
General - Other: $1,000
- Other Funds - Cash and Securities: $40,795,000
Cash and Securities: $37,679,000
- Revenue - Water Utilities: $256,000
Water Utilities: $154,000
- Sinking Funds - Cash and Securities: $494,000
Cash and Securities: $277,000
- State Intergovernmental - Other: $7,360,000
Other: $3,405,000
Highways: $3,207,000
Highways: $1,807,000
General Local Government Support: $1,290,000
General Local Government Support: $24,000
- Tax - Property: $12,589,000
Other Selective Sales: $6,863,000
Property: $6,571,000
Other Selective Sales: $4,758,000
General Sales and Gross Receipts: $881,000
General Sales and Gross Receipts: $779,000
Other: $298,000
Other License: $227,000
Occupation and Business License - Other: $126,000
Public Utilities Sales: $60,000
Occupation and Business License - Other: $53,000
Motor Vehicle License: $5,000
Other License: $2,000
- Total Salaries and Wages: $17,459,000
: $10,461,000
- Water Utilities - Interest on Debt: $403,000
Interest on Debt: $7,000
Kane County government finances - Debt in 2020:
- Bond Funds - Cash and Securities: $2,265,000
Cash and Securities: $2,215,000
- Charges - Hospital Public: $10,016,000
Hospital Public: $9,955,000
Other: $2,431,000
Other: $1,524,000
Solid Waste Management: $1,360,000
Solid Waste Management: $1,067,000
Sewerage: $76,000
Parks and Recreation: $45,000
Parks and Recreation: $1,000
- Construction - General - Other: $618,000
General Public Buildings: $91,000
Parks and Recreation: $50,000
General - Other: $17,000
Parks and Recreation: $6,000
Solid Waste Management: $2,000
Local Fire Protection: $1,000
- Current Operations - Hospitals: $8,726,000
Hospitals: $8,572,000
Correctional Institutions: $8,000,000
Central Staff Services: $6,771,000
Regular Highways: $4,679,000
General - Other: $4,445,000
Police Protection: $3,380,000
Parks and Recreation: $3,370,000
Central Staff Services: $3,093,000
Health - Other: $2,964,000
Regular Highways: $2,893,000
Correctional Institutions: $2,367,000
Financial Administration: $1,992,000
Judicial and Legal Services: $1,982,000
General - Other: $1,902,000
Housing and Community Development: $1,875,000
Health - Other: $1,514,000
General Public Buildings: $1,394,000
Police Protection: $1,236,000
Public Welfare - Other: $1,035,000
Financial Administration: $954,000
Local Fire Protection: $944,000
Judicial and Legal Services: $874,000
Solid Waste Management: $838,000
Solid Waste Management: $699,000
Housing and Community Development: $595,000
Local Fire Protection: $587,000
Public Welfare - Other: $419,000
General Public Buildings: $404,000
Protective Inspection and Regulation - Other: $350,000
Water Utilities: $136,000
Elementary and Secondary Education: $133,000
Protective Inspection and Regulation - Other: $133,000
Parks and Recreation: $112,000
Water Utilities: $82,000
Sewerage: $54,000
Libraries: $34,000
Libraries: $33,000
- Federal Intergovernmental - Natural Resources: $1,249,000
Highways: $1,103,000
Other: $318,000
Other: $213,000
Highways: $176,000
Education: $122,000
Water Utilities: $40,000
- General - Interest on Debt: $538,000
Interest on Debt: $128,000
- Intergovernmental to Local - Other - General - Other: $40,000
Other - General - Other: $20,000
Other - Regular Highways: $10,000
- Intergovernmental to State - Regular Highways: $31,000
Regular Highways: $2,000
- Local Intergovernmental - Other: $970,000
Other: $956,000
Highways: $368,000
Highways: $328,000
General Local Government Support: $52,000
- Long Term Debt - Outstanding Unspecified Public Purpose: $25,288,000
Beginning Outstanding - Unspecified Public Purpose: $23,500,000
Issue, Unspecified Public Purpose: $2,630,000
Beginning Outstanding - Unspecified Public Purpose: $1,811,000
Outstanding Unspecified Public Purpose: $1,429,000
Retired Unspecified Public Purpose: $840,000
Retired Unspecified Public Purpose: $819,000
Issue, Unspecified Public Purpose: $438,000
Beginning Outstanding - Public Debt for Private Purpose: $194,000
Outstanding Nonguaranteed - Industrial Revenue: $194,000
- Miscellaneous - General Revenue - Other: $3,269,000
Donations From Private Sources: $1,904,000
Interest Earnings: $1,516,000
Rents: $973,000
General Revenue - Other: $771,000
Special Assessments: $362,000
Fines and Forfeits: $319,000
Interest Earnings: $304,000
Donations From Private Sources: $297,000
Rents: $125,000
Sale of Property: $55,000
Fines and Forfeits: $1,000
- Other Capital Outlay - General - Other: $2,351,000
Local Fire Protection: $1,056,000
Police Protection: $326,000
Correctional Institutions: $117,000
Police Protection: $72,000
Protective Inspection and Regulation - Other: $60,000
Financial Administration: $40,000
Correctional Institutions: $30,000
Parks and Recreation: $20,000
Local Fire Protection: $6,000
Public Welfare - Other: $3,000
Judicial and Legal Services: $1,000
General - Other: $1,000
- Other Funds - Cash and Securities: $40,795,000
Cash and Securities: $37,679,000
- Revenue - Water Utilities: $256,000
Water Utilities: $154,000
- Sinking Funds - Cash and Securities: $494,000
Cash and Securities: $277,000
- State Intergovernmental - Other: $7,360,000
Other: $3,405,000
Highways: $3,207,000
Highways: $1,807,000
General Local Government Support: $1,290,000
General Local Government Support: $24,000
- Tax - Property: $12,589,000
Other Selective Sales: $6,863,000
Property: $6,571,000
Other Selective Sales: $4,758,000
General Sales and Gross Receipts: $881,000
General Sales and Gross Receipts: $779,000
Other: $298,000
Other License: $227,000
Occupation and Business License - Other: $126,000
Public Utilities Sales: $60,000
Occupation and Business License - Other: $53,000
Motor Vehicle License: $5,000
Other License: $2,000
- Total Salaries and Wages: $17,459,000
: $10,461,000
- Water Utilities - Interest on Debt: $403,000
Interest on Debt: $7,000
Kane County government finances - Cash and Securities in 2020:
- Bond Funds - Cash and Securities: $2,265,000
Cash and Securities: $2,215,000
- Charges - Hospital Public: $10,016,000
Hospital Public: $9,955,000
Other: $2,431,000
Other: $1,524,000
Solid Waste Management: $1,360,000
Solid Waste Management: $1,067,000
Sewerage: $76,000
Parks and Recreation: $45,000
Parks and Recreation: $1,000
- Construction - General - Other: $618,000
General Public Buildings: $91,000
Parks and Recreation: $50,000
General - Other: $17,000
Parks and Recreation: $6,000
Solid Waste Management: $2,000
Local Fire Protection: $1,000
- Current Operations - Hospitals: $8,726,000
Hospitals: $8,572,000
Correctional Institutions: $8,000,000
Central Staff Services: $6,771,000
Regular Highways: $4,679,000
General - Other: $4,445,000
Police Protection: $3,380,000
Parks and Recreation: $3,370,000
Central Staff Services: $3,093,000
Health - Other: $2,964,000
Regular Highways: $2,893,000
Correctional Institutions: $2,367,000
Financial Administration: $1,992,000
Judicial and Legal Services: $1,982,000
General - Other: $1,902,000
Housing and Community Development: $1,875,000
Health - Other: $1,514,000
General Public Buildings: $1,394,000
Police Protection: $1,236,000
Public Welfare - Other: $1,035,000
Financial Administration: $954,000
Local Fire Protection: $944,000
Judicial and Legal Services: $874,000
Solid Waste Management: $838,000
Solid Waste Management: $699,000
Housing and Community Development: $595,000
Local Fire Protection: $587,000
Public Welfare - Other: $419,000
General Public Buildings: $404,000
Protective Inspection and Regulation - Other: $350,000
Water Utilities: $136,000
Elementary and Secondary Education: $133,000
Protective Inspection and Regulation - Other: $133,000
Parks and Recreation: $112,000
Water Utilities: $82,000
Sewerage: $54,000
Libraries: $34,000
Libraries: $33,000
- Federal Intergovernmental - Natural Resources: $1,249,000
Highways: $1,103,000
Other: $318,000
Other: $213,000
Highways: $176,000
Education: $122,000
Water Utilities: $40,000
- General - Interest on Debt: $538,000
Interest on Debt: $128,000
- Intergovernmental to Local - Other - General - Other: $40,000
Other - General - Other: $20,000
Other - Regular Highways: $10,000
- Intergovernmental to State - Regular Highways: $31,000
Regular Highways: $2,000
- Local Intergovernmental - Other: $970,000
Other: $956,000
Highways: $368,000
Highways: $328,000
General Local Government Support: $52,000
- Long Term Debt - Outstanding Unspecified Public Purpose: $25,288,000
Beginning Outstanding - Unspecified Public Purpose: $23,500,000
Issue, Unspecified Public Purpose: $2,630,000
Beginning Outstanding - Unspecified Public Purpose: $1,811,000
Outstanding Unspecified Public Purpose: $1,429,000
Retired Unspecified Public Purpose: $840,000
Retired Unspecified Public Purpose: $819,000
Issue, Unspecified Public Purpose: $438,000
Beginning Outstanding - Public Debt for Private Purpose: $194,000
Outstanding Nonguaranteed - Industrial Revenue: $194,000
- Miscellaneous - General Revenue - Other: $3,269,000
Donations From Private Sources: $1,904,000
Interest Earnings: $1,516,000
Rents: $973,000
General Revenue - Other: $771,000
Special Assessments: $362,000
Fines and Forfeits: $319,000
Interest Earnings: $304,000
Donations From Private Sources: $297,000
Rents: $125,000
Sale of Property: $55,000
Fines and Forfeits: $1,000
- Other Capital Outlay - General - Other: $2,351,000
Local Fire Protection: $1,056,000
Police Protection: $326,000
Correctional Institutions: $117,000
Police Protection: $72,000
Protective Inspection and Regulation - Other: $60,000
Financial Administration: $40,000
Correctional Institutions: $30,000
Parks and Recreation: $20,000
Local Fire Protection: $6,000
Public Welfare - Other: $3,000
Judicial and Legal Services: $1,000
General - Other: $1,000
- Other Funds - Cash and Securities: $40,795,000
Cash and Securities: $37,679,000
- Revenue - Water Utilities: $256,000
Water Utilities: $154,000
- Sinking Funds - Cash and Securities: $494,000
Cash and Securities: $277,000
- State Intergovernmental - Other: $7,360,000
Other: $3,405,000
Highways: $3,207,000
Highways: $1,807,000
General Local Government Support: $1,290,000
General Local Government Support: $24,000
- Tax - Property: $12,589,000
Other Selective Sales: $6,863,000
Property: $6,571,000
Other Selective Sales: $4,758,000
General Sales and Gross Receipts: $881,000
General Sales and Gross Receipts: $779,000
Other: $298,000
Other License: $227,000
Occupation and Business License - Other: $126,000
Public Utilities Sales: $60,000
Occupation and Business License - Other: $53,000
Motor Vehicle License: $5,000
Other License: $2,000
- Total Salaries and Wages: $17,459,000
: $10,461,000
- Water Utilities - Interest on Debt: $403,000
Interest on Debt: $7,000
Supplemental Security Income (SSI) in 2006:
- Total number of recipients: 62
- Number of aged recipients: 4
- Number of blind and disabled recipients: 58
- Number of recipients under 18: 16
- Number of recipients between 18 and 64: 35
- Number of recipients older than 64: 11
- Number of recipients also receiving OASDI: 26
- Amount of payments (thousands of dollars): 26
| Most common first names in Kane County, UT among deceased individuals | ||
| Name | Count | Lived (average) |
|---|---|---|
| Charles | 19 | 73.5 years |
| William | 18 | 74.7 years |
| Robert | 17 | 76.8 years |
| George | 16 | 77.4 years |
| Donald | 14 | 72.6 years |
| John | 14 | 79.6 years |
| Joseph | 10 | 81.3 years |
| Mary | 10 | 82.0 years |
| Ruth | 10 | 81.6 years |
| Richard | 10 | 66.8 years |
| Most common last names in Kane County, UT among deceased individuals | ||
| Last name | Count | Lived (average) |
|---|---|---|
| Johnson | 31 | 80.2 years |
| Swapp | 25 | 77.2 years |
| Robinson | 21 | 79.1 years |
| Hamblin | 19 | 80.3 years |
| Brown | 17 | 79.3 years |
| Judd | 17 | 84.4 years |
| Spencer | 17 | 76.7 years |
| Heaton | 15 | 75.5 years |
| Chamberlain | 13 | 81.1 years |
| Anderson | 12 | 76.9 years |
| Businesses in Kane County, UT | ||||
| Name | Count | Name | Count | |
|---|---|---|---|---|
| Best Western | 2 | RadioShack | 1 | |
| Comfort Inn | 1 | Rodeway Inn | 1 | |
| FedEx | 1 | Subway | 2 | |
| H&R Block | 1 | True Value | 1 | |
| Holiday Inn | 1 | U-Haul | 1 | |
| McDonald's | 1 | UPS | 1 | |
| Pizza Hut | 1 | Wendy's | 1 | |