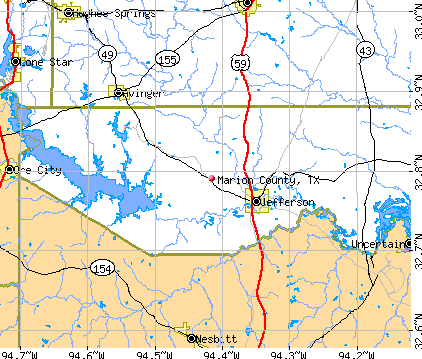
Marion County, Texas (TX)
County owner-occupied free and clear houses and condos in 2010: 2,232
County owner-occupied houses and condos in 2000: 3,783
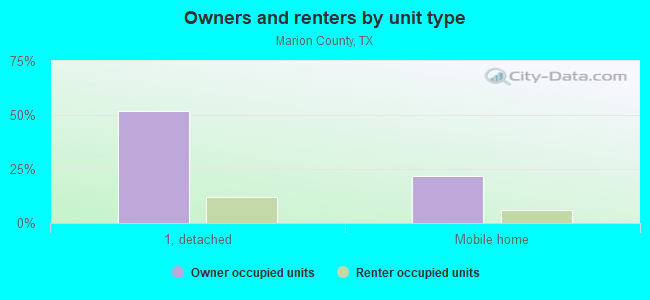
Renter-occupied apartments: 958 (it was 827 in 2000)
| % of renters here: | 18% |
| State: | 36% |
Land area: 381 sq. mi.
Water area: 39.2 sq. mi.
Population density: 26 people per square mile (low).
Industries providing employment: Educational, health and social services (23.0%), Retail trade (18.9%), Manufacturing (11.8%), Transportation and warehousing,and utilities (10.1%).
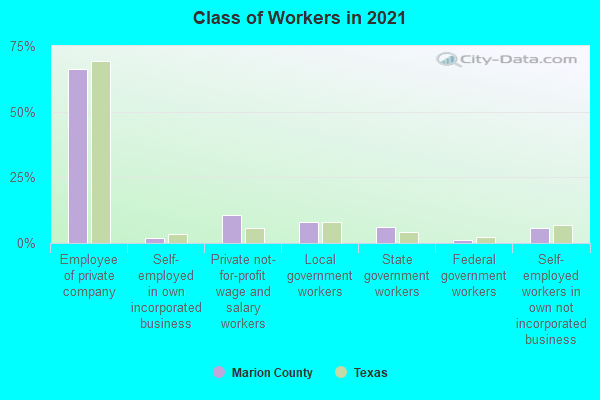
Type of workers:
- Private wage or salary: 81%
- Government: 12%
- Self-employed, not incorporated: 7%
- Unpaid family work: 0%
- OSM Map
- General Map
- Google Map
- MSN Map

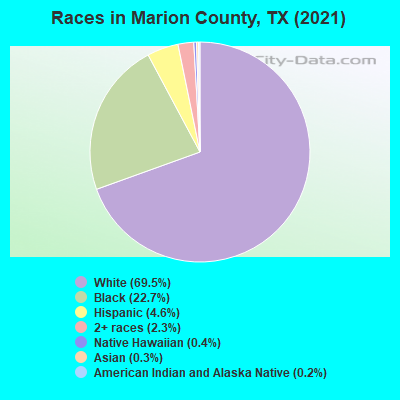
- 6,77769.6%White Non-Hispanic Alone
- 2,15322.1%Black Non-Hispanic Alone
- 4624.7%Hispanic or Latino
- 1972.0%Two or more races
- 670.7%American Indian and Alaska Native alone
- 620.6%Asian alone
- 170.2%Native Hawaiian and Other
Pacific Islander alone
| Median resident age: | 52.7 years |
| Texas median age: | 35.6 years |
| Males: 4,851 | |
| Females: 5,076 |

 | House Prices Are Going Up Because Everyone Is Moving Here (149 replies) |
| Really, Houston?? (419 replies) |
| I've never been so proud of this city (144 replies) |
| New County Population Estimates from the Census Bureau for Jluy 1, 2016 posted this morning about 9 A. M. (13 replies) |
| Truly southern Texas town (23 replies) |
| The Story Behind Manchaca Rd misspelling/pronunciation (19 replies) |
| Marion County: | 2.0 people |
| Texas: | 3 people |
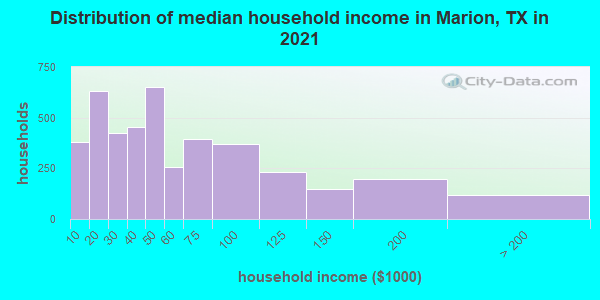
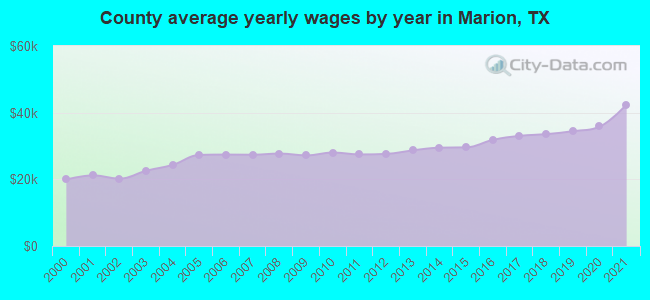
Estimated median household income in 2022: $47,546 ($25,347 in 1999)
| This county: | $47,546 |
| Texas: | $72,284 |
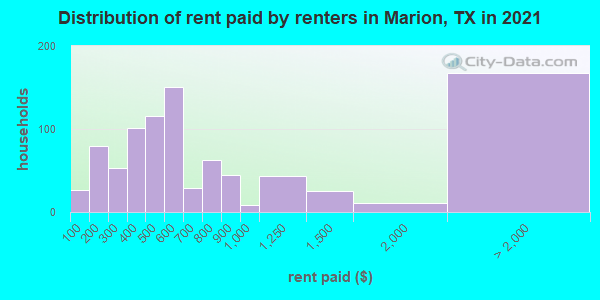
Median contract rent in 2022 for apartments: $559 (lower quartile is $375, upper quartile is $665)
| This county: | $559 |
| State: | $1117 |
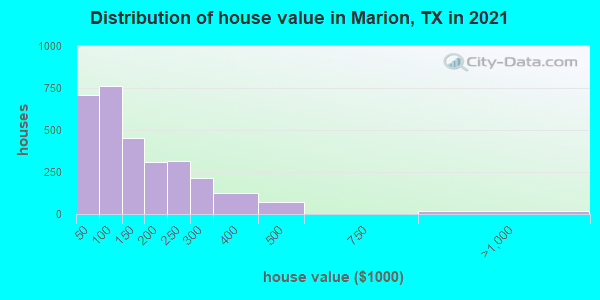
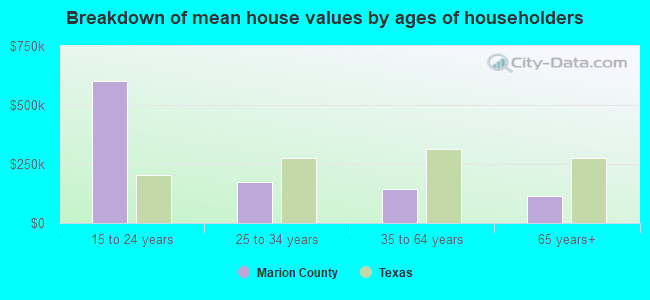
Estimated median house or condo value in 2022: $119,301 (it was $41,000 in 2000)
| Marion: | $119,301 |
| Texas: | $275,400 |
Median monthly housing costs for homes and condos with a mortgage: $1,190
Median monthly housing costs for units without a mortgage: $404
Institutionalized population: 167
Crime in 2021 (reported by the sheriff's office or county police, not the county total):
- Murders: 1
- Rapes: 1
- Robberies: 0
- Assaults: 33
- Burglaries: 40
- Thefts: 49
- Auto thefts: 10
Crime in 2020 (reported by the sheriff's office or county police, not the county total):
- Murders: 0
- Rapes: 2
- Robberies: 1
- Assaults: 13
- Burglaries: 35
- Thefts: 55
- Auto thefts: 10
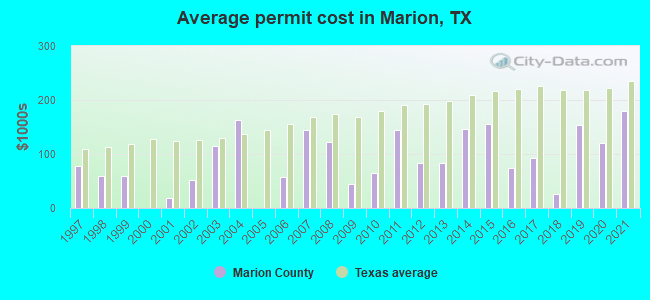
Single-family new house construction building permits:
- 2022: 5 buildings, average cost: $253,200
- 2021: 6 buildings, average cost: $178,700
- 2020: 11 buildings, average cost: $121,400
- 2019: 4 buildings, average cost: $152,500
- 2018: 1 building, cost: $25,500
- 2017: 2 buildings, average cost: $92,500
- 2016: 8 buildings, average cost: $75,000
- 2015: 1 building, cost: $156,000
- 2014: 2 buildings, average cost: $145,500
- 2013: 4 buildings, average cost: $82,500
- 2012: 4 buildings, average cost: $82,500
- 2011: 2 buildings, average cost: $145,000
- 2010: 5 buildings, average cost: $64,400
- 2009: 4 buildings, average cost: $45,000
- 2008: 3 buildings, average cost: $122,500
- 2007: 4 buildings, average cost: $143,800
- 2006: 7 buildings, average cost: $57,900
- 2005: 0 buildings
- 2004: 1 building, cost: $163,000
- 2003: 1 building, cost: $115,000
- 2002: 6 buildings, average cost: $51,800
- 2001: 1 building, cost: $17,500
- 2000: 0 buildings
- 1999: 1 building, cost: $60,000
- 1998: 2 buildings, average cost: $58,500
- 1997: 3 buildings, average cost: $78,300
Median real estate property taxes paid for housing units with mortgages in 2022: $1,352 (0.8%)
Median real estate property taxes paid for housing units with no mortgage in 2022: $686 (0.7%)
| Marion County: | 15.7% |
| Texas: | 14.0% |
Median age of residents in 2022: 52.7 years old
(Males: 52.4 years old, Females: 53.0 years old)
(Median age for: White residents: 53.4 years old, Black residents: 43.1 years old, American Indian residents: 35.4 years old, Asian residents: 50.6 years old, Hispanic or Latino residents: 59.5 years old, Other race residents: 59.0 years old)
Fair market rent in 2006 for a 1-bedroom apartment in Marion County is $406 a month.
Fair market rent for a 2-bedroom apartment is $499 a month.
Fair market rent for a 3-bedroom apartment is $681 a month.
Cities in this county include: Jefferson, Pine Harbor.
Neighboring counties: Camp County  , Lee County, Alabama
  , Ventura County, California
  , Ellis County , Palo Pinto County .
| Here: | 4.3% |
| Texas: | 3.5% |
Current college students: 238
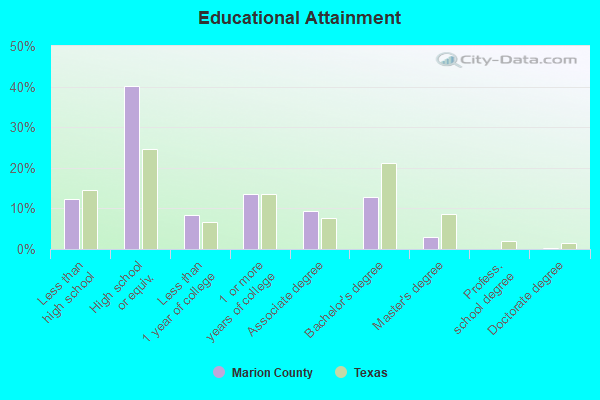
People 25 years of age or older with a high school degree or higher: 86.7%
People 25 years of age or older with a bachelor's degree or higher: 16.3%
Number of foreign born residents: 291 (60.9% naturalized citizens)
| Marion County: | 2.9% |
| Whole state: | 17.2% |
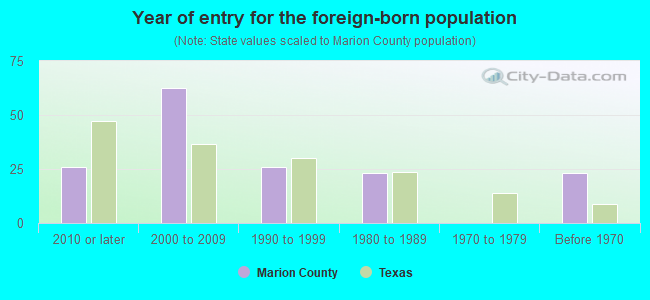
- Year of entry for the foreign-born population
- 232010 or later
- 802000 to 2009
- 111990 to 1999
- 231980 to 1989
- 01970 to 1979
- 23Before 1970
Mean travel time to work (commute): minutes
Percentage of county residents living and working in this county: 93.1%
Housing units in structures:
- One, detached: 3,845
- One, attached: 17
- Two: 87
- 3 or 4: 56
- 5 to 9: 48
- Mobile homes: 1,599
- Boats, RVs, vans, etc.: 105
Housing units in Marion County with a mortgage: 822 (25 second mortgage, 0 home equity loan, 8 both second mortgage and home equity loan)
Houses without a mortgage: 0
| Here: | 100.0% with mortgage |
| State: | 98.4% with mortgage |
Religion statistics for Marion County
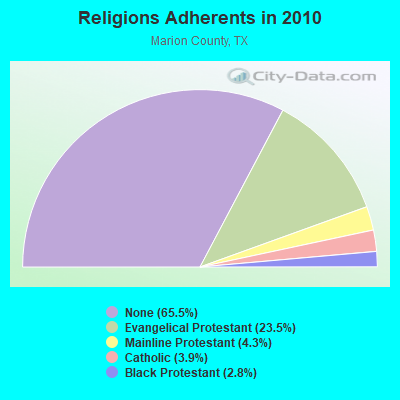
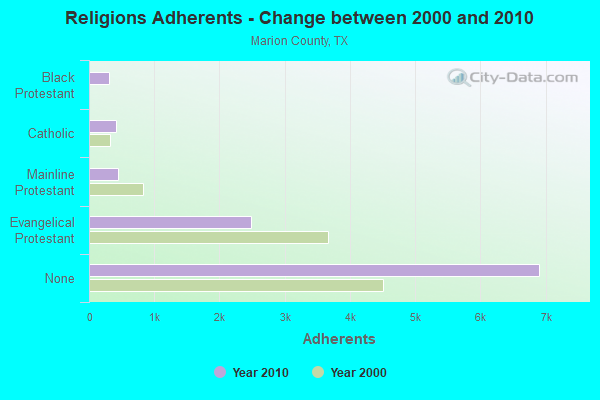
| Religion | Adherents | Congregations |
|---|---|---|
| Evangelical Protestant | 2,477 | 19 |
| Mainline Protestant | 451 | 8 |
| Catholic | 407 | 1 |
| Black Protestant | 300 | 3 |
| Other | 4 | 1 |
| None | 6,907 | - |
Source: Clifford Grammich, Kirk Hadaway, Richard Houseal, Dale E.Jones, Alexei Krindatch, Richie Stanley and Richard H.Taylor. 2012. 2010 U.S.Religion Census: Religious Congregations & Membership Study. Association of Statisticians of American Religious Bodies. Jones, Dale E., et al. 2002. Congregations and Membership in the United States 2000. Nashville, TN: Glenmary Research Center.
Food Environment Statistics:
| Marion County: | 0.94 / 10,000 pop. |
| State: | 1.47 / 10,000 pop. |
| This county: | 2.81 / 10,000 pop. |
| Texas: | 1.11 / 10,000 pop. |
| Marion County: | 6.55 / 10,000 pop. |
| Texas: | 3.95 / 10,000 pop. |
| This county: | 4.68 / 10,000 pop. |
| State: | 6.13 / 10,000 pop. |
| Marion County: | 12.2% |
| Texas: | 8.9% |
| Marion County: | 29.2% |
| State: | 26.6% |
| Here: | 15.1% |
| State: | 15.7% |
Agriculture in Marion County:
Average size of farms: 237 acresAverage value of agricultural products sold per farm: $16,218
Average value of crops sold per acre for harvested cropland: $103.52
The value of nursery, greenhouse, floriculture, and sod as a percentage of the total market value of agricultural products sold: 0.00%
The value of livestock, poultry, and their products as a percentage of the total market value of agricultural products sold: 81.79%
Average total farm production expenses per farm: $14,219
Harvested cropland as a percentage of land in farms: 12.06%
Irrigated harvested cropland as a percentage of land in farms: 1.20%
Average market value of all machinery and equipment per farm: $24,792
The percentage of farms operated by a family or individual: 94.84%
Average age of principal farm operators: 60 years
Average number of cattle and calves per 100 acres of all land in farms: 11.24
Vegetables: 20 harvested acres
Land in orchards: 49 acres
Earthquake activity:
Marion County-area historical earthquake activity is significantly above Texas state average. It is 403% greater than the overall U.S. average.On 11/6/2011 at 03:53:10, a magnitude 5.7 (5.7 MW, Depth: 3.2 mi, Class: Moderate, Intensity: VI - VII) earthquake occurred 232.5 miles away from Marion County center
On 5/17/2012 at 08:12:00, a magnitude 4.8 (4.8 MW, Depth: 3.1 mi, Class: Light, Intensity: IV - V) earthquake occurred 59.7 miles away from the county center
On 9/3/2016 at 12:02:44, a magnitude 5.8 (5.8 MW, Depth: 3.5 mi) earthquake occurred 289.3 miles away from the county center
On 9/2/2013 at 23:51:15, a magnitude 4.3 (4.3 MW, Depth: 2.9 mi) earthquake occurred 60.8 miles away from the county center
On 9/2/2013 at 21:52:38, a magnitude 4.2 (4.2 MW, Depth: 3.0 mi) earthquake occurred 57.3 miles away from Marion County center
On 1/25/2013 at 07:01:19, a magnitude 4.1 (4.1 MB, Depth: 3.1 mi) earthquake occurred 65.7 miles away from the county center
Magnitude types: body-wave magnitude (MB), moment magnitude (MW)
Most recent natural disasters:
- Texas Covid-19 Pandemic, Incident Period: January 20, 2020, FEMA Id: 4485, Natural disaster type: Other
- Texas Severe Storms, Tornadoes, and Flooding, Incident Period: March 07, 2016 to March 29, 2016, Major Disaster (Presidential) Declared DR-4266: March 19, 2016, FEMA Id: 4266, Natural disaster type: Storm, Tornado, Flood
- Texas Bear Creek Fire, Incident Period: September 04, 2011 to October 24, 2011, Fire Management Assistance Declared: September 06, 2011, FEMA Id: 2965, Natural disaster type: Fire
- Texas Wildfires, Incident Period: August 30, 2011 to December 31, 2011, Major Disaster (Presidential) Declared DR-4029: September 09, 2011, FEMA Id: 4029, Natural disaster type: Fire
- Texas Hurricane Ike, Incident Period: September 07, 2008 to October 02, 2008, Major Disaster (Presidential) Declared DR-1791: September 13, 2008, FEMA Id: 1791, Natural disaster type: Hurricane
- Texas Hurricane Rita, Incident Period: September 23, 2005 to October 14, 2005, Major Disaster (Presidential) Declared DR-1606: September 24, 2005, FEMA Id: 1606, Natural disaster type: Hurricane
- Texas Hurricane Rita, Incident Period: September 20, 2005 to October 14, 2005, Emergency Declared EM-3261: September 21, 2005, FEMA Id: 3261, Natural disaster type: Hurricane
- Texas Hurricane Katrina, Incident Period: August 29, 2005 to October 01, 2005, Emergency Declared EM-3216: September 02, 2005, FEMA Id: 3216, Natural disaster type: Hurricane
- Texas Severe Winter Storm, Incident Period: December 12, 2000 to January 15, 2001, Major Disaster (Presidential) Declared DR-1356: January 08, 2001, FEMA Id: 1356, Natural disaster type: Winter Storm
- Texas Extreme Fire Hazards, Incident Period: August 01, 1999 to December 10, 1999, Emergency Declared EM-3142: September 01, 1999, FEMA Id: 3142, Natural disaster type: Fire
- 4 other natural disasters have been reported since 1953.
The number of natural disasters in Marion County (14) is near the US average (15).
Major Disasters (Presidential) Declared: 8
Emergencies Declared: 4
Causes of natural disasters: Fires: 4, Floods: 4, Hurricanes: 4, Storms: 4, Tornadoes: 2, Winter Storm: 1, Other: 1 (Note: some incidents may be assigned to more than one category).
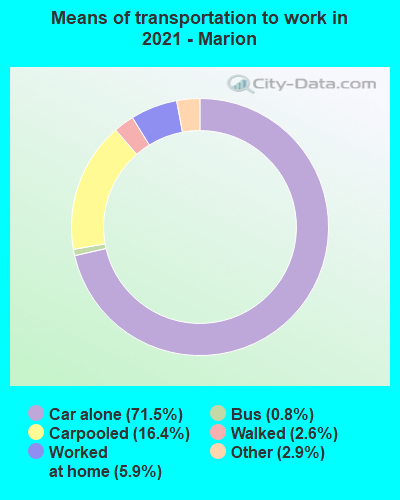
Means of transportation to work:
- Drove a car alone: 1,519 (70.9%)
- Carpooled: 376 (17.6%)
- Bus: 9 (0.4%)
- Taxicab, motorcycle, or other means: 94 (4.4%)
- Walked: 26 (1.2%)
- Worked at home: 72 (3.4%)
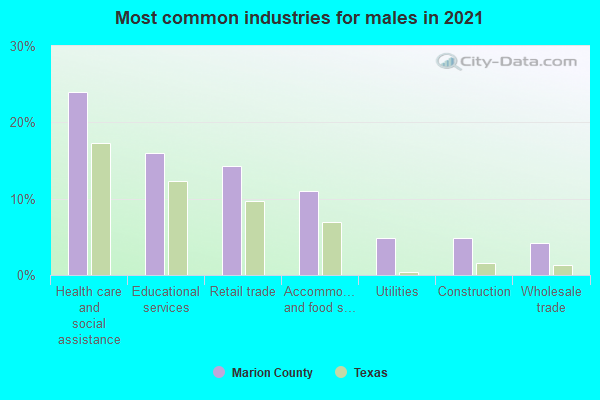
- Health care and social assistance (27%)
- Retail trade (17%)
- Educational services (14%)
- Accommodation and food services (10%)
- Utilities (6%)
- Public administration (5%)
- Wholesale trade (4%)
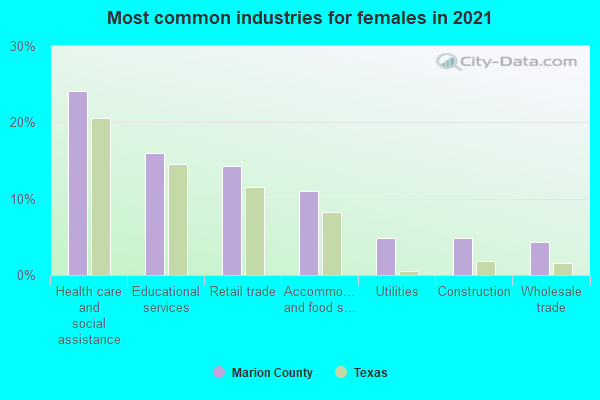
- Health care and social assistance (25%)
- Retail trade (16%)
- Educational services (13%)
- Accommodation and food services (10%)
- Utilities (5%)
- Public administration (4%)
- Wholesale trade (4%)
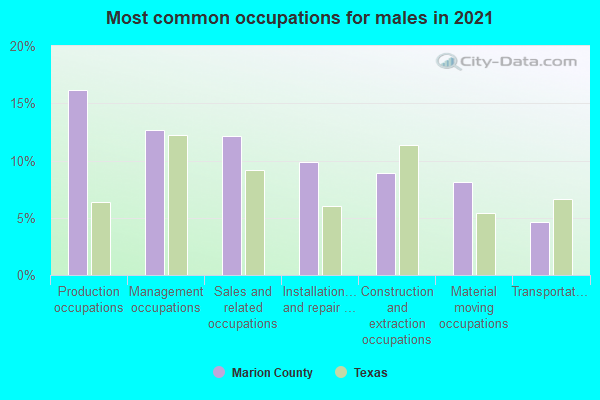
- Sales and related occupations (15%)
- Production occupations (13%)
- Management occupations (11%)
- Construction and extraction occupations (10%)
- Material moving occupations (9%)
- Installation, maintenance, and repair occupations (8%)
- Transportation occupations (7%)
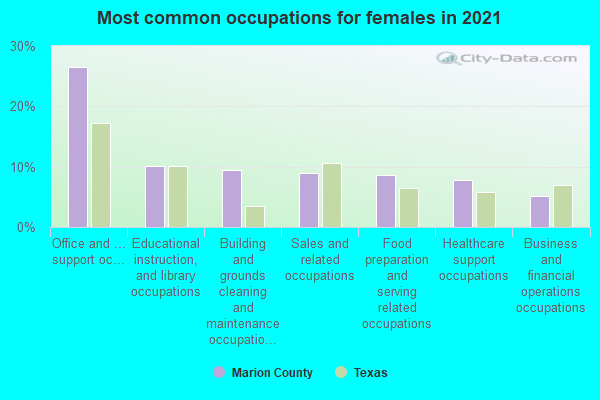
- Office and administrative support occupations (24%)
- Healthcare support occupations (12%)
- Building and grounds cleaning and maintenance occupations (9%)
- Educational instruction, and library occupations (8%)
- Sales and related occupations (8%)
- Food preparation and serving related occupations (6%)
- Management occupations (6%)
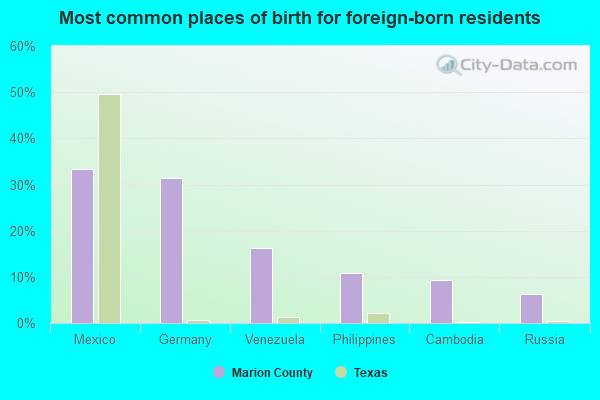
- Mexico (47%)
- Germany (16%)
- Venezuela (13%)
- Philippines (10%)
- India (6%)
- Russia (4%)
- Ukraine (2%)
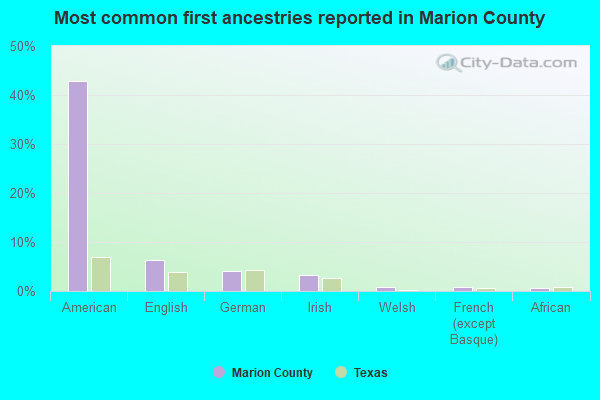
- American (46%)
- English (10%)
- German (4%)
- Irish (3%)
- Welsh (1%)
- African (1%)
- Czech (1%)
65 people in local jails and other municipal confinement facilities
68 people in nursing homes
21 people in local jails and other confinement facilities (including police lockups)
9.86% of this county's 2021 resident taxpayers lived in other counties in 2020 ($44,134 average adjusted gross income)
| Here: | 9.86% |
| Texas average: | 8.12% |
10 or fewer of this county's residents moved from foreign countries.
7.81% relocated from other counties in Texas ($31,884 average AGI)
2.05% relocated from other states ($12,249 average AGI)
Marion County: 2.05% Texas average: 2.83%

Top counties from which taxpayers relocated into this county between 2020 and 2021:
| from Harrison County, TX | |
| from Gregg County, TX | |
| from Upshur County, TX | |
| from Dallas County, TX | |
| from Cass County, TX |
9.30% of this county's 2020 resident taxpayers moved to other counties in 2021 ($39,060 average adjusted gross income)
| Here: | 9.30% |
| Texas average: | 7.40% |
10 or fewer of this county's residents moved to foreign countries.
7.45% relocated to other counties in Texas ($30,782 average AGI)
1.85% relocated to other states ($8,278 average AGI)
Marion County: 1.85% Texas average: 2.08%
Top counties to which taxpayers relocated from this county between 2020 and 2021:
| to Harrison County, TX | |
| to Gregg County, TX | |
| to Cass County, TX | |
| to Upshur County, TX |
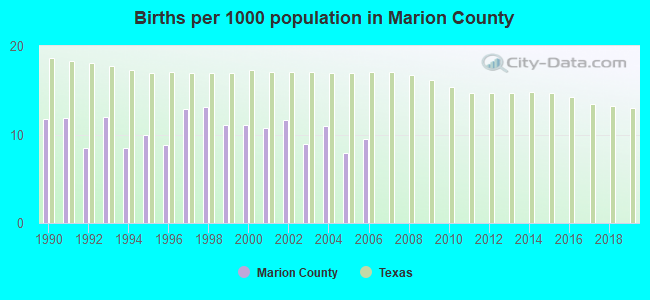
Births per 1000 population from 1990 to 1999: 10.9
Births per 1000 population from 2000 to 2006: 10.1
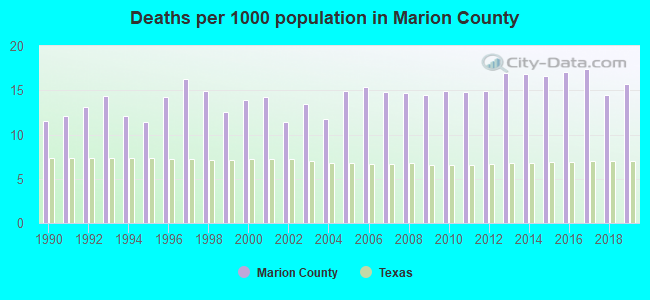
Deaths per 1000 population from 1990 to 1999: 13.2
Deaths per 1000 population from 2000 to 2009: 13.9
Deaths per 1000 population from 2010 to 2020: 16.2
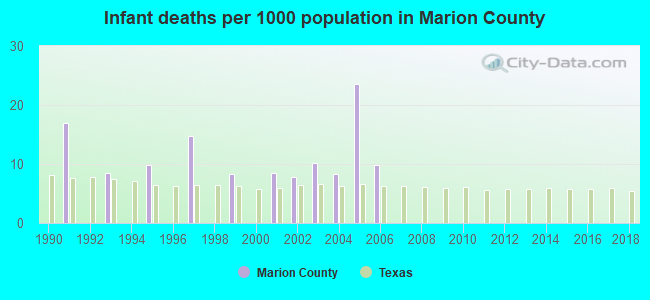
Infant deaths per 1000 live births from 1990 to 1999: 5.8
Infant deaths per 1000 live births from 2000 to 2006: 9.7
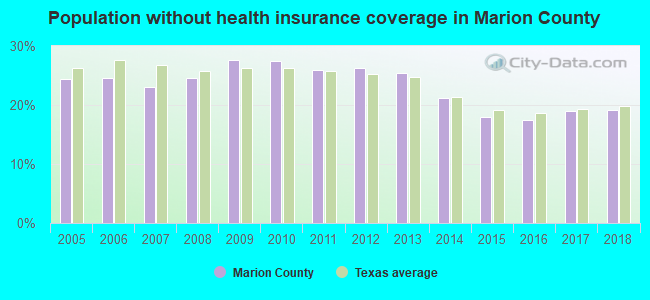
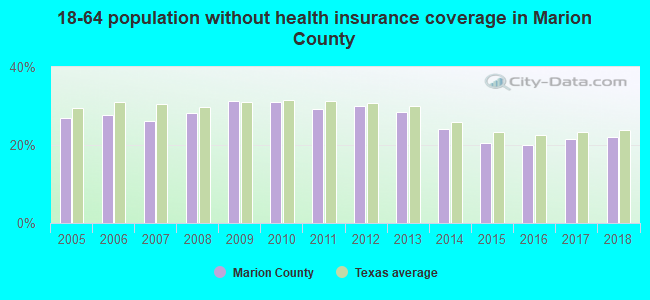
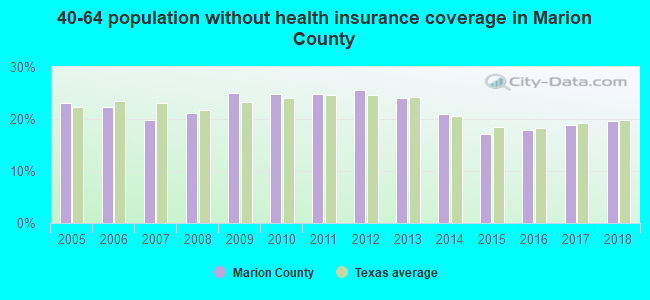
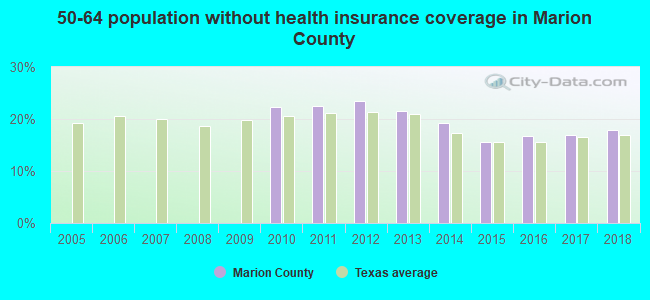
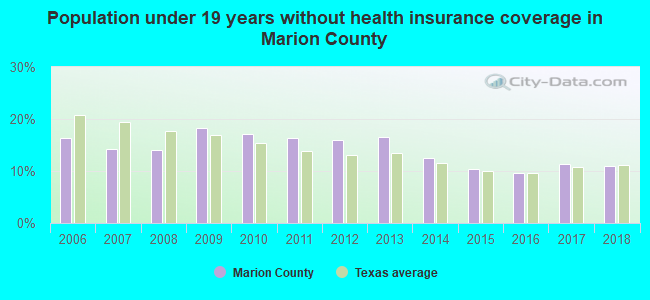
Persons under 19 years old without health insurance coverage in 2018: 11.0%
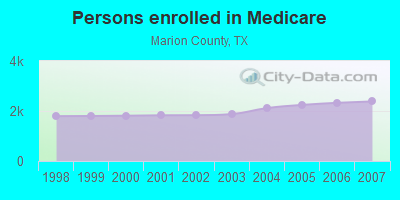
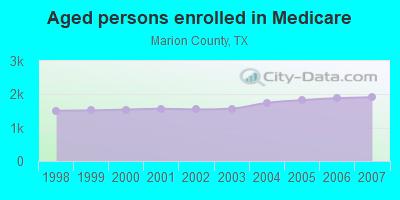
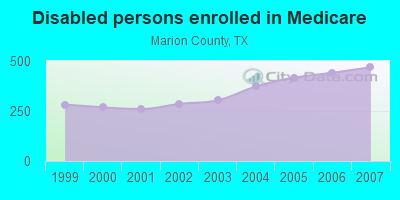
Persons enrolled in hospital insurance and/or supplemental medical insurance (Medicare) in July 1, 2007: 2,383 (1,914 aged, 469 disabled)
Children under 18 without health insurance coverage in 2007: 277 (13%)
Most common underlying causes of death in Marion County, Texas in 1999 - 2019:
- Acute myocardial infarction, unspecified (268)
- Bronchus or lung, unspecified - Malignant neoplasms (161)
- Chronic obstructive pulmonary disease, unspecified (149)
- Atherosclerotic heart disease (56)
- Alzheimer disease, unspecified (30)
- Other ill-defined and unspecified causes of mortality (20)
- Unspecified diabetes mellitus, without complications (12)
Population without health insurance coverage in 2000: 20%
Children under 18 without health insurance coverage in 2000: 17%
Medical specialist MDs per 100,000 population in 2005: 1,114
Dentists per 100,000 population in 1998: 46
Total births per 100,000 population, July 2005 - July 2006 : 9
Total deaths per 100,000 population, July 2005 - July 2006: 46
Crimes per 100,000 population in 1996: 1
Household type by relationship:
Households: 9,927- Male householders: 2,122 (786 living alone), Female householders: 2,119 (869 living alone)
1,724 spouses (1,724 opposite-sex spouses), 177 unmarried partners, (177 opposite-sex unmarried partners), 2,545 children (2,353 natural, 32 adopted, 159 stepchildren), 522 grandchildren, 131 brothers or sisters, 42 parents, 0 foster children, 287 other relatives, 184 non-relatives
- In group quarters: 103
Size of family households: 1,446 2-persons, 395 3-persons, 344 4-persons, 157 5-persons, 32 6-persons, 93 7-or-more-persons.
Size of nonfamily households: 1,655 1-person, 150 2-persons.
860 married couples with children.
346 single-parent households (78 men, 268 women).
96.8% of residents of Marion speak English at home.
2.6% of residents speak Spanish at home (40% speak English very well, 19% speak English well, 8% speak English not well, 33% don't speak English at all).
0.4% of residents speak other Indo-European language at home (100% speak English very well).
0.7% of residents speak Asian or Pacific Island language at home (73% speak English very well, 27% speak English not well).
In fiscal year 2004:
Federal Government expenditure: $79,093,000 ($7,116 per capita)
Department of Defense expenditure: $6,121,000
Federal direct payments to individuals for retirement and disability: $31,194,000
Federal other direct payments to individuals: $14,476,000
Federal direct payments not to individuals: $139,000
Federal grants: $27,016,000
Federal procurement contracts: $3,606,000 ($3,242,000 Department of Defense)
Federal salaries and wages: $2,661,000 ($1,279,000 Department of Defense)
Federal Government direct loans: $69,000
Federal guaranteed/insured loans: $972,000
Federal Government insurance: $2,377,000
Population change from April 1, 2000 to July 1, 2005:
Births: 601| Here: | 55 per 1000 residents |
| State: | 85 per 1000 residents |
Deaths: 742
| Here: | 68 per 1000 residents |
| State: | 35 per 1000 residents |
Net international migration: +21
| Here: | +2 per 1000 residents |
| State: | +29 per 1000 residents |
Net internal migration: +172
| Here: | +16 per 1000 residents |
| State: | +10 per 1000 residents |
Total withdrawal of fresh water for public supply: 1.76 millions of gallons per day (20% from ground, 80% from surface)
| Here: | 5.6 |
| State: | 6.3 |
| Here: | 4.3 |
| State: | 4.0 |
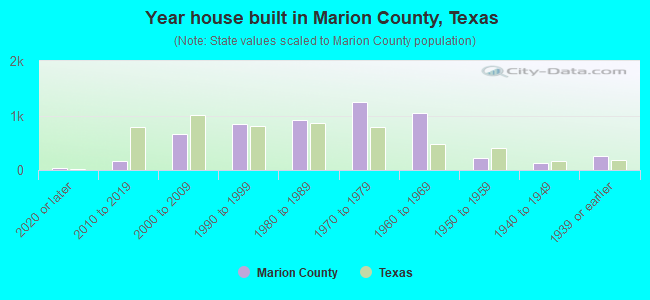
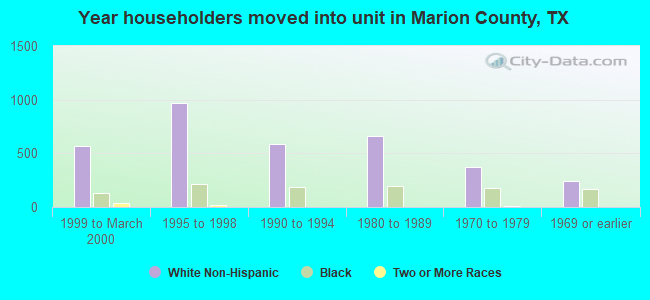
- Year house built in Marion County, Texas
- 602020 or later
- 3162010 to 2019
- 7232000 to 2009
- 8981990 to 1999
- 8881980 to 1989
- 1,0471970 to 1979
- 8951960 to 1969
- 2321950 to 1959
- 1721940 to 1949
- 2501939 or earlier
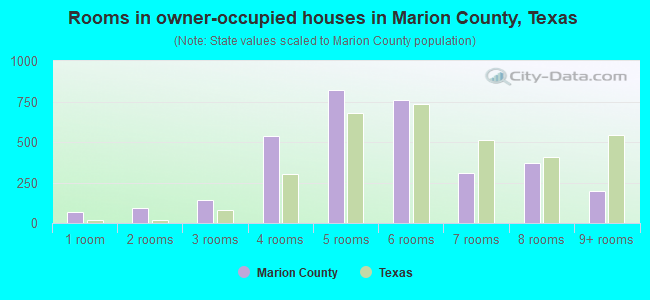
- Rooms in owner-occupied houses in Marion County, Texas
- 851 room
- 1072 rooms
- 1653 rooms
- 4204 rooms
- 8415 rooms
- 8326 rooms
- 2707 rooms
- 3538 rooms
- 2489+ rooms
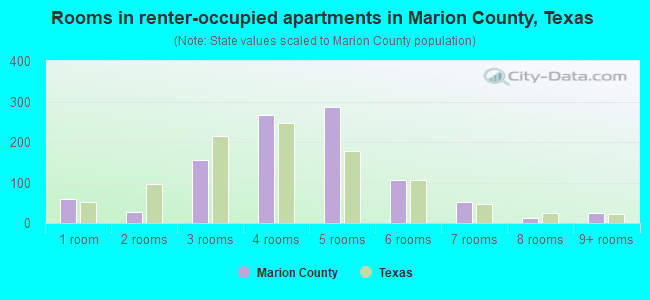
- Rooms in renter-occupied apartments in Marion County, Texas
- 541 room
- 822 rooms
- 1003 rooms
- 2684 rooms
- 2675 rooms
- 946 rooms
- 577 rooms
- 198 rooms
- 09+ rooms
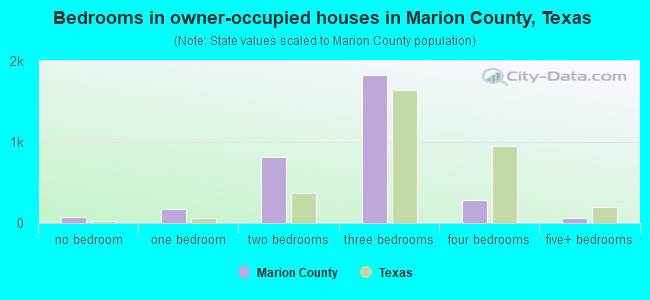
- Bedrooms in owner-occupied houses in Marion County, Texas
- 99no bedroom
- 1641 bedroom
- 8192 bedrooms
- 1,8043 bedrooms
- 3134 bedrooms
- 915+ bedrooms
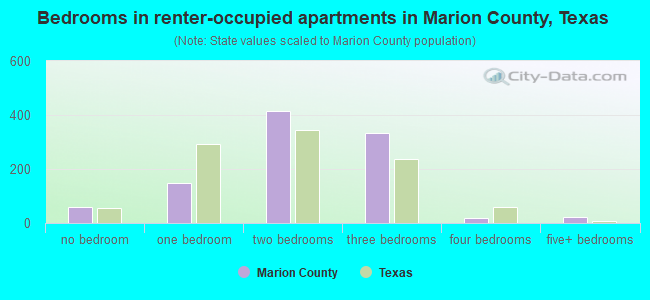
- Bedrooms in renter-occupied apartments in Marion County, Texas
- 54no bedroom
- 1611 bedroom
- 3472 bedrooms
- 3633 bedrooms
- 164 bedrooms
- 05+ bedrooms
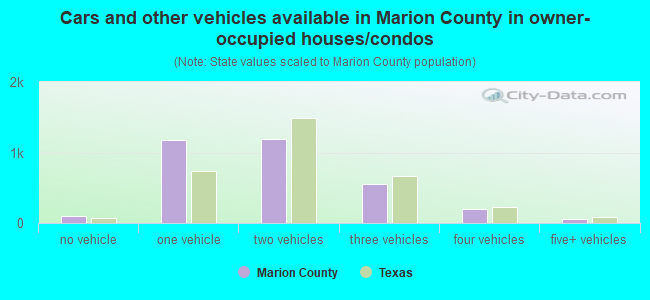
- Cars and other vehicles available in Marion County in owner-occupied houses/condos
- 100no vehicle
- 1,1541 vehicle
- 1,2482 vehicles
- 5613 vehicles
- 1964 vehicles
- 505+ vehicles
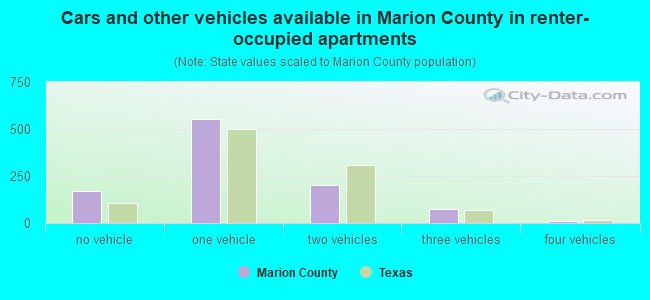
- Cars and other vehicles available in Marion County in renter-occupied apartments
- 115no vehicle
- 6161 vehicle
- 1822 vehicles
- 333 vehicles
- 94 vehicles
- 05+ vehicles
89.7% of Marion County residents lived in the same house 1 years ago.
Out of people who lived in different houses, 22% lived in this county.
Out of people who lived in different counties, 93% lived in Texas.
| Marion County: | 89.7% |
| State average: | 85.7% |
Place of birth for U.S.-born residents:
- This state: 6,314
- Other state: 3,217
- Northeast: 283
- Midwest: 1,179
- South: 1,111
- West: 629
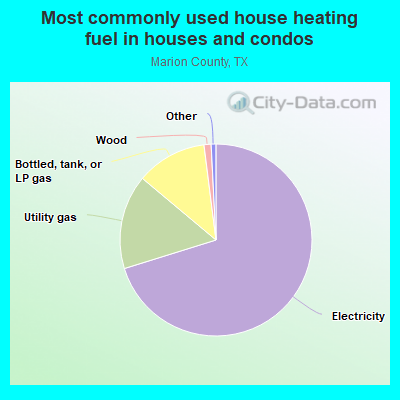
- 73.1%Electricity
- 14.2%Utility gas
- 11.0%Bottled, tank, or LP gas
- 1.4%Wood
- 0.3%No fuel used
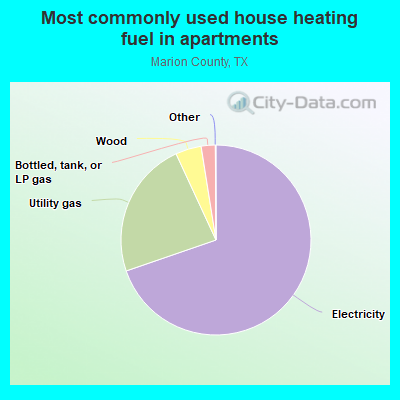
- 66.6%Electricity
- 26.0%Utility gas
- 4.1%Wood
- 3.2%Bottled, tank, or LP gas
Private vs. public school enrollment:
| Here: | 8.9% |
| Texas: | 8.8% |
| Here: | 0.0% |
| Texas: | 8.0% |
| Here: | 35.4% |
| Texas: | 16.2% |
Marion County government finances - Expenditure in 2017:
- Charges - Other: $384,000
Solid Waste Management: $19,000
Regular Highways: $12,000
Air Transportation: $1,000
- Current Operations - Police Protection: $1,549,000
Regular Highways: $1,442,000
Judicial and Legal Services: $870,000
Financial Administration: $519,000
Central Staff Services: $498,000
General Public Buildings: $293,000
Solid Waste Management: $135,000
Correctional Institutions: $96,000
Local Fire Protection: $58,000
Corrections - Other: $56,000
Air Transportation: $24,000
Libraries: $7,000
Health - Other: $4,000
Public Welfare, Vendor Payments for Other Purposes: $3,000
Natural Resources - Other: $3,000
- Federal Intergovernmental - General Local Government Support: $60,000
- Intergovernmental to Local - Other - Financial Administration: $137,000
- Local Intergovernmental - Other: $89,000
- Miscellaneous - Fines and Forfeits: $174,000
Interest Earnings: $67,000
Rents: $16,000
Donations From Private Sources: $6,000
Royalties: $1,000
- Other Capital Outlay - Central Staff Services: $110,000
Police Protection: $50,000
Judicial and Legal Services: $24,000
Financial Administration: $9,000
- Other Funds - Cash and Securities: $4,212,000
- State Intergovernmental - Other: $77,000
Highways: $23,000
General Local Government Support: $17,000
- Tax - Property: $3,698,000
Motor Vehicle License: $631,000
General Sales and Gross Receipts: $297,000
Alcoholic Beverage License: $4,000
- Total Salaries and Wages: $1,788,000
Marion County government finances - Revenue in 2017:
- Charges - Other: $384,000
Solid Waste Management: $19,000
Regular Highways: $12,000
Air Transportation: $1,000
- Current Operations - Police Protection: $1,549,000
Regular Highways: $1,442,000
Judicial and Legal Services: $870,000
Financial Administration: $519,000
Central Staff Services: $498,000
General Public Buildings: $293,000
Solid Waste Management: $135,000
Correctional Institutions: $96,000
Local Fire Protection: $58,000
Corrections - Other: $56,000
Air Transportation: $24,000
Libraries: $7,000
Health - Other: $4,000
Public Welfare, Vendor Payments for Other Purposes: $3,000
Natural Resources - Other: $3,000
- Federal Intergovernmental - General Local Government Support: $60,000
- Intergovernmental to Local - Other - Financial Administration: $137,000
- Local Intergovernmental - Other: $89,000
- Miscellaneous - Fines and Forfeits: $174,000
Interest Earnings: $67,000
Rents: $16,000
Donations From Private Sources: $6,000
Royalties: $1,000
- Other Capital Outlay - Central Staff Services: $110,000
Police Protection: $50,000
Judicial and Legal Services: $24,000
Financial Administration: $9,000
- Other Funds - Cash and Securities: $4,212,000
- State Intergovernmental - Other: $77,000
Highways: $23,000
General Local Government Support: $17,000
- Tax - Property: $3,698,000
Motor Vehicle License: $631,000
General Sales and Gross Receipts: $297,000
Alcoholic Beverage License: $4,000
- Total Salaries and Wages: $1,788,000
Marion County government finances - Debt in 2017:
- Charges - Other: $384,000
Solid Waste Management: $19,000
Regular Highways: $12,000
Air Transportation: $1,000
- Current Operations - Police Protection: $1,549,000
Regular Highways: $1,442,000
Judicial and Legal Services: $870,000
Financial Administration: $519,000
Central Staff Services: $498,000
General Public Buildings: $293,000
Solid Waste Management: $135,000
Correctional Institutions: $96,000
Local Fire Protection: $58,000
Corrections - Other: $56,000
Air Transportation: $24,000
Libraries: $7,000
Health - Other: $4,000
Public Welfare, Vendor Payments for Other Purposes: $3,000
Natural Resources - Other: $3,000
- Federal Intergovernmental - General Local Government Support: $60,000
- Intergovernmental to Local - Other - Financial Administration: $137,000
- Local Intergovernmental - Other: $89,000
- Miscellaneous - Fines and Forfeits: $174,000
Interest Earnings: $67,000
Rents: $16,000
Donations From Private Sources: $6,000
Royalties: $1,000
- Other Capital Outlay - Central Staff Services: $110,000
Police Protection: $50,000
Judicial and Legal Services: $24,000
Financial Administration: $9,000
- Other Funds - Cash and Securities: $4,212,000
- State Intergovernmental - Other: $77,000
Highways: $23,000
General Local Government Support: $17,000
- Tax - Property: $3,698,000
Motor Vehicle License: $631,000
General Sales and Gross Receipts: $297,000
Alcoholic Beverage License: $4,000
- Total Salaries and Wages: $1,788,000
Marion County government finances - Cash and Securities in 2017:
- Charges - Other: $384,000
Solid Waste Management: $19,000
Regular Highways: $12,000
Air Transportation: $1,000
- Current Operations - Police Protection: $1,549,000
Regular Highways: $1,442,000
Judicial and Legal Services: $870,000
Financial Administration: $519,000
Central Staff Services: $498,000
General Public Buildings: $293,000
Solid Waste Management: $135,000
Correctional Institutions: $96,000
Local Fire Protection: $58,000
Corrections - Other: $56,000
Air Transportation: $24,000
Libraries: $7,000
Health - Other: $4,000
Public Welfare, Vendor Payments for Other Purposes: $3,000
Natural Resources - Other: $3,000
- Federal Intergovernmental - General Local Government Support: $60,000
- Intergovernmental to Local - Other - Financial Administration: $137,000
- Local Intergovernmental - Other: $89,000
- Miscellaneous - Fines and Forfeits: $174,000
Interest Earnings: $67,000
Rents: $16,000
Donations From Private Sources: $6,000
Royalties: $1,000
- Other Capital Outlay - Central Staff Services: $110,000
Police Protection: $50,000
Judicial and Legal Services: $24,000
Financial Administration: $9,000
- Other Funds - Cash and Securities: $4,212,000
- State Intergovernmental - Other: $77,000
Highways: $23,000
General Local Government Support: $17,000
- Tax - Property: $3,698,000
Motor Vehicle License: $631,000
General Sales and Gross Receipts: $297,000
Alcoholic Beverage License: $4,000
- Total Salaries and Wages: $1,788,000
Supplemental Security Income (SSI) in 2006:
- Total number of recipients: 468
- Number of aged recipients: 81
- Number of blind and disabled recipients: 387
- Number of recipients under 18: 33
- Number of recipients between 18 and 64: 280
- Number of recipients older than 64: 155
- Number of recipients also receiving OASDI: 208
- Amount of payments (thousands of dollars): 188
| Most common first names in Marion County, TX among deceased individuals | ||
| Name | Count | Lived (average) |
|---|---|---|
| James | 100 | 73.2 years |
| William | 73 | 73.6 years |
| Mary | 70 | 77.1 years |
| John | 64 | 75.1 years |
| Charles | 47 | 72.3 years |
| Robert | 46 | 70.6 years |
| Willie | 39 | 76.0 years |
| George | 38 | 75.0 years |
| Annie | 32 | 85.0 years |
| Thomas | 30 | 72.2 years |
| Most common last names in Marion County, TX among deceased individuals | ||
| Last name | Count | Lived (average) |
|---|---|---|
| Smith | 92 | 72.3 years |
| Williams | 66 | 76.8 years |
| Johnson | 49 | 76.7 years |
| Davis | 37 | 76.2 years |
| Jones | 34 | 77.6 years |
| Moore | 31 | 68.9 years |
| Wilson | 30 | 78.1 years |
| Brown | 29 | 75.0 years |
| Allen | 29 | 72.2 years |
| Jackson | 29 | 78.4 years |
| Businesses in Marion County, TX | ||||
| Name | Count | Name | Count | |
|---|---|---|---|---|
| Chevrolet | 1 | Nike | 1 | |
| Dairy Queen | 1 | SONIC Drive-In | 1 | |
| FedEx | 1 | U-Haul | 1 | |
| H&R Block | 1 | UPS | 1 | |
| McDonald's | 1 | |||
Marion County on our top lists:
- #64 on the list of "Top 101 counties with the highest number of deaths per 1000 residents 2007-2013"