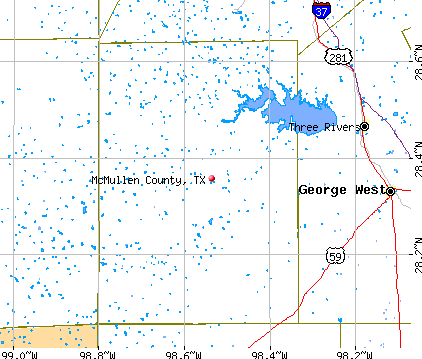
McMullen County, Texas (TX)
County owner-occupied free and clear houses and condos in 2010: 200
County owner-occupied houses and condos in 2000: 287
Renter-occupied apartments: 56 (it was 68 in 2000)
| % of renters here: | 19% |
| State: | 36% |
Land area: 1113 sq. mi.
Water area: 29.6 sq. mi.
Population density: 1 people per square mile (very low).
Industries providing employment: Agriculture,forestry,fishing and hunting, and mining (19.8%), Educational, health and social services (17.3%), Public administration (14.5%), Professional, scientific, management, administrative, and waste management services (13.7%), Transportation and warehousing,and utilities (10.5%).
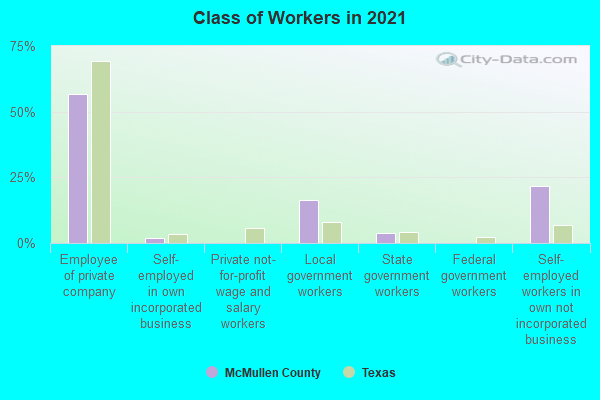
Type of workers:
- Private wage or salary: 50%
- Government: 31%
- Self-employed, not incorporated: 19%
- Unpaid family work: 0%
- OSM Map
- General Map
- Google Map
- MSN Map

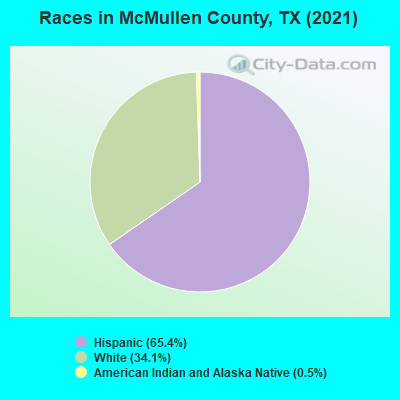
- 41761.2%Hispanic or Latino
- 25837.9%White Non-Hispanic Alone
- 50.7%American Indian and Alaska Native alone
- 10.1%Two or more races
| Median resident age: | 36.9 years |
| Texas median age: | 35.6 years |
| Males: 304 | |
| Females: 384 |


| McMullen County: | 2.0 people |
| Texas: | 3 people |
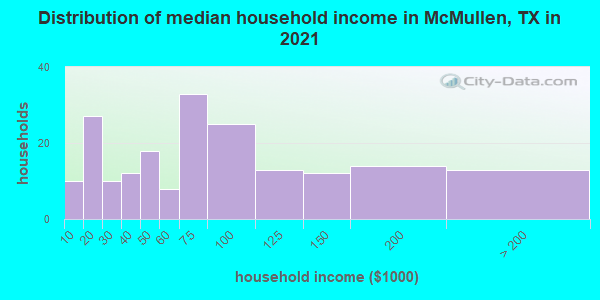
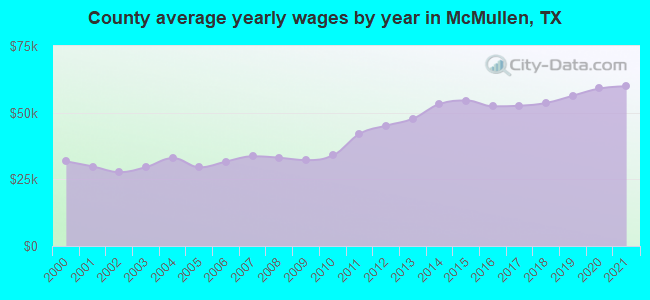
Estimated median household income in 2022: $59,692 ($32,500 in 1999)
| This county: | $59,692 |
| Texas: | $72,284 |
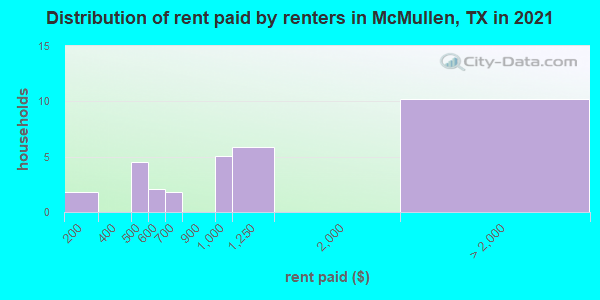
Median contract rent in 2022 for apartments: $511 (lower quartile is $455, upper quartile is $767)
| This county: | $511 |
| State: | $1117 |
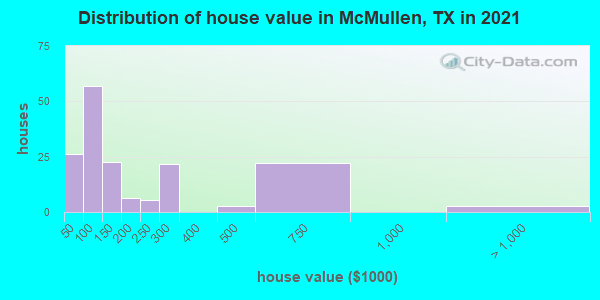
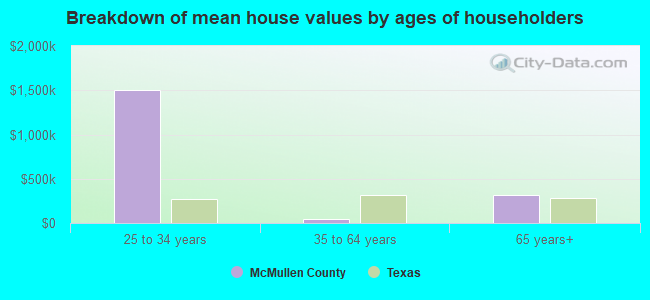
Estimated median house or condo value in 2022: $121,616 (it was $47,400 in 2000)
| McMullen: | $121,616 |
| Texas: | $275,400 |
Mean price in 2022:
Median monthly housing costs for homes and condos with a mortgage: $1,385Detached houses: $357,682
Here: $357,682 State: $369,058 Mobile homes: $196,570
Here: $196,570 State: $124,413
Median monthly housing costs for units without a mortgage: $491
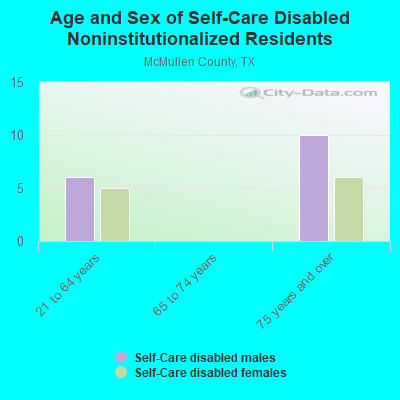
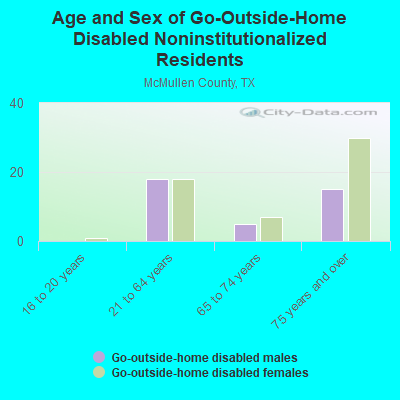
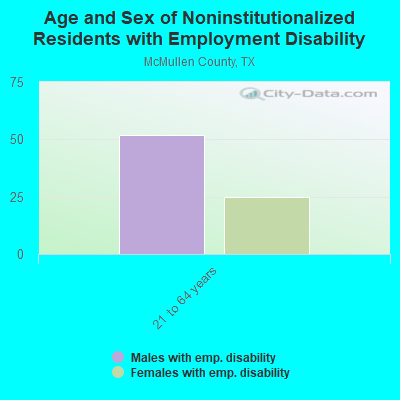
Institutionalized population: 0
Crime in 2020 (reported by the sheriff's office or county police, not the county total):
- Murders: 0
- Rapes: 0
- Robberies: 0
- Assaults: 0
- Burglaries: 4
- Thefts: 5
- Auto thefts: 0
Crime in 2019 (reported by the sheriff's office or county police, not the county total):
- Murders: 0
- Rapes: 0
- Robberies: 0
- Assaults: 0
- Burglaries: 1
- Thefts: 10
- Auto thefts: 1
Median real estate property taxes paid for housing units in 2000:
| McMullen County: | |
| Texas: |
| McMullen County: | 15.0% |
| Texas: | 14.0% |
Median age of residents in 2022: 36.9 years old
(Males: 39.9 years old, Females: 33.4 years old)
(Median age for: White residents: 54.6 years old, Hispanic or Latino residents: 32.4 years old, Other race residents: 38.7 years old)
Fair market rent in 2006 for a 1-bedroom apartment in McMullen County is $420 a month.
Fair market rent for a 2-bedroom apartment is $484 a month.
Fair market rent for a 3-bedroom apartment is $645 a month.
Cities in this county include: Tilden.
Notable locations in this county outside city limits:
Notable locations in McMullen County: Alders Camp Windmill (A), Lambert Ranch (B), Oak School (C), Roche Ranch (D), Rooke Ranch (E), Welder Ranch (F). Display/hide their locations on the map
Churches in McMullen County include: Saint Dennis Church (A), Trinity Lutheran Church (B), Mount Salem Church (C). Display/hide their locations on the map
Cemeteries: Nicholas Fagan Memorial Cemetery (1), Austwell Cemetery (2), Mount Calvary Cemetery (3), Heard Cemetery (4), O'Connor Cemetery (5), Oakwood Cemetery (6), Williams Cemetery (7). Display/hide their locations on the map
Lakes, reservoirs, and swamps: Big Bayou (A), Willow Lake (B), Twin Mott Lake (C), Duck Lake (D), Hamilton Lake (E), Lucas Lake (F), Horseshoe Lake (G), North Saint Nicholas Lake (H). Display/hide their locations on the map
Streams, rivers, and creeks: Blanco Creek (A), Willow Creek (B), Townsend Bayou (C), Spring Creek (D), Sous Creek (E), Papalote Creek (F), Mullens Bayou (G), Monkey Slough (H), Mission River (I). Display/hide their locations on the map
Park in McMullen County: Lions Park (1). Display/hide its location on the map
Neighboring counties: Bee County  , Calhoun County , Osceola County, Florida , Sumter County, Florida , Karnes County
  , Webb County
  .
.
| Here: | 1.4% |
| Texas: | 3.5% |
Current college students: 19
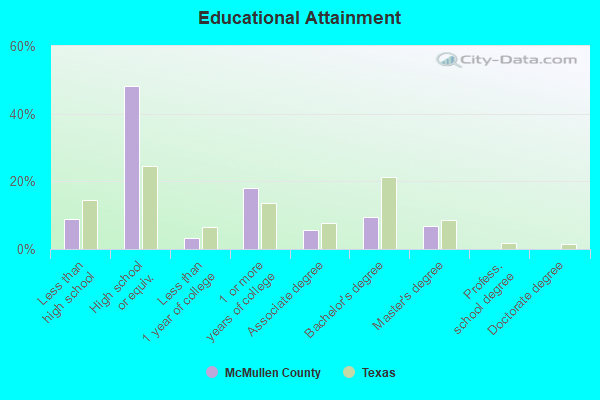
People 25 years of age or older with a high school degree or higher: 88.9%
People 25 years of age or older with a bachelor's degree or higher: 15.7%
Number of foreign born residents: 32 (10.3% naturalized citizens)
| McMullen County: | 4.7% |
| Whole state: | 17.2% |
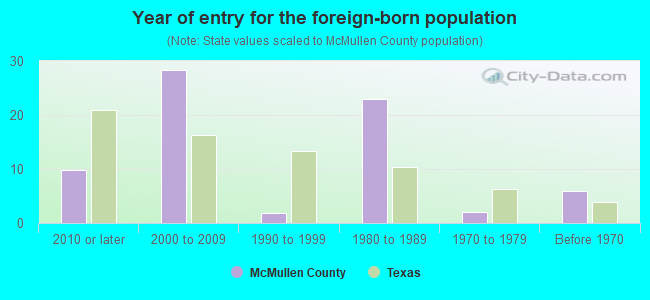
- Year of entry for the foreign-born population
- 02010 or later
- 222000 to 2009
- 31990 to 1999
- 231980 to 1989
- 21970 to 1979
- 6Before 1970
Mean travel time to work (commute): minutes
Percentage of county residents living and working in this county: 100.0%


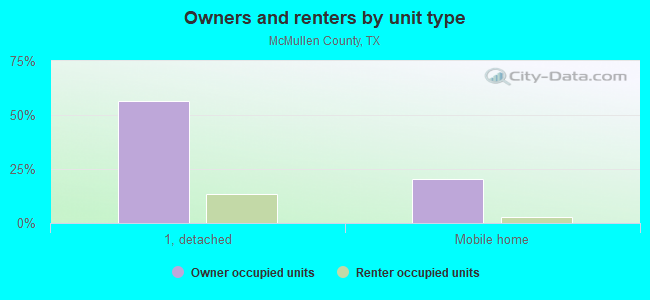
Housing units in structures:
- One, detached: 263
- One, attached: 2
- Mobile homes: 111
Housing units in McMullen County with a mortgage: 45 (0 second mortgage, 0 home equity loan, 0 both second mortgage and home equity loan)
Houses without a mortgage: 0
| Here: | 100.0% with mortgage |
| State: | 98.4% with mortgage |
Religion statistics for McMullen County
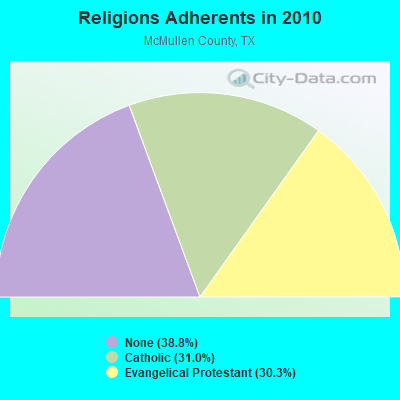
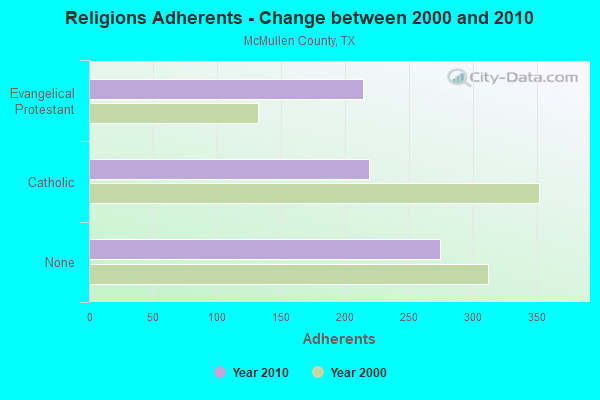
| Religion | Adherents | Congregations |
|---|---|---|
| Catholic | 219 | 1 |
| Evangelical Protestant | 214 | 1 |
| None | 274 | - |
Source: Clifford Grammich, Kirk Hadaway, Richard Houseal, Dale E.Jones, Alexei Krindatch, Richie Stanley and Richard H.Taylor. 2012. 2010 U.S.Religion Census: Religious Congregations & Membership Study. Association of Statisticians of American Religious Bodies. Jones, Dale E., et al. 2002. Congregations and Membership in the United States 2000. Nashville, TN: Glenmary Research Center.
Food Environment Statistics:
| McMullen County: | 11.47 / 10,000 pop. |
| State: | 1.47 / 10,000 pop. |
| McMullen County: | 22.94 / 10,000 pop. |
| Texas: | 3.95 / 10,000 pop. |
| This county: | 11.47 / 10,000 pop. |
| State: | 6.13 / 10,000 pop. |
| McMullen County: | 10.3% |
| Texas: | 8.9% |
| McMullen County: | 27.8% |
| State: | 26.6% |
Agriculture in McMullen County:
Average size of farms: 2677 acresAverage value of agricultural products sold per farm: $28,692
Average value of crops sold per acre for harvested cropland: $24.72
The value of livestock, poultry, and their products as a percentage of the total market value of agricultural products sold: 97.25%
Average total farm production expenses per farm: $44,493
Harvested cropland as a percentage of land in farms: 1.19%
Irrigated harvested cropland as a percentage of land in farms: 2.12%
Average market value of all machinery and equipment per farm: $41,900
The percentage of farms operated by a family or individual: 81.61%
Average age of principal farm operators: 59 years
Average number of cattle and calves per 100 acres of all land in farms: 4.43
All wheat for grain: 2401 harvested acres
Tornado activity:
McMullen County historical area-adjusted tornado activity is significantly below Texas state average. It is 8082864.3 times below overall U.S. average.Tornadoes in this county have caused 27 injuries recorded between 1950 and 2004.
On 10/22/1954, a category 3 (max. wind speeds 158-206 mph) tornado injured 25 people and caused between $50,000 and $500,000 in damages.
Earthquake activity:
McMullen County-area historical earthquake activity is significantly above Texas state average. It is 37% smaller than the overall U.S. average.On 10/20/2011 at 12:24:41, a magnitude 4.8 (4.8 MW, Depth: 3.1 mi, Class: Light, Intensity: IV - V) earthquake occurred 44.9 miles away from McMullen County center
On 4/9/1993 at 12:29:19, a magnitude 4.3 (4.1 MB, 4.3 LG, Depth: 3.1 mi) earthquake occurred 40.3 miles away from the county center
On 4/14/1995 at 00:32:56, a magnitude 5.7 (5.6 MB, 5.7 MS, 5.7 MW, Depth: 11.1 mi, Class: Moderate, Intensity: VI - VII) earthquake occurred 320.1 miles away from the county center
On 5/1/2018 at 16:28:56, a magnitude 4.0 (4.0 MW, Depth: 3.1 mi) earthquake occurred 52.3 miles away from the county center
On 4/7/2008 at 09:51:12, a magnitude 3.9 (3.9 MW, Depth: 3.1 mi, Class: Light, Intensity: II - III) earthquake occurred 49.5 miles away from McMullen County center
On 4/25/2010 at 02:10:42, a magnitude 3.9 (3.9 MB, Depth: 3.1 mi) earthquake occurred 61.6 miles away from the county center
Magnitude types: regional Lg-wave magnitude (LG), body-wave magnitude (MB), surface-wave magnitude (MS), moment magnitude (MW)
Most recent natural disasters:
- Texas Covid-19 Pandemic, Incident Period: January 20, 2020, FEMA Id: 4485, Natural disaster type: Other
- Texas Tropical Storm Alex, Incident Period: June 27, 2010 to August 14, 2010, Emergency Declared EM-3313: June 29, 2010, FEMA Id: 3313, Natural disaster type: Tropical Storm
- Texas Wildfires, Incident Period: March 14, 2008 to September 01, 2008, Emergency Declared EM-3284: March 14, 2008, FEMA Id: 3284, Natural disaster type: Fire
- Texas Hurricane Rita, Incident Period: September 23, 2005 to October 14, 2005, Major Disaster (Presidential) Declared DR-1606: September 24, 2005, FEMA Id: 1606, Natural disaster type: Hurricane
- Texas Hurricane Rita, Incident Period: September 20, 2005 to October 14, 2005, Emergency Declared EM-3261: September 21, 2005, FEMA Id: 3261, Natural disaster type: Hurricane
- Texas Hurricane Katrina, Incident Period: August 29, 2005 to October 01, 2005, Emergency Declared EM-3216: September 02, 2005, FEMA Id: 3216, Natural disaster type: Hurricane
- Texas Hurricane Claudette, Incident Period: July 15, 2003 to July 28, 2003, Major Disaster (Presidential) Declared DR-1479: July 17, 2003, FEMA Id: 1479, Natural disaster type: Hurricane
- Texas Severe Storms and Flooding, Incident Period: June 29, 2002 to July 31, 2002, Major Disaster (Presidential) Declared DR-1425: July 04, 2002, FEMA Id: 1425, Natural disaster type: Storm, Flood
- Texas Extreme Fire Hazard, Incident Period: August 30, 1993 to November 15, 1993, Emergency Declared EM-3113: September 10, 1993, FEMA Id: 3113, Natural disaster type: Fire
- Texas HURRICANE BEULAH, Incident Period: September 28, 1967, Major Disaster (Presidential) Declared DR-232: September 28, 1967, FEMA Id: 232, Natural disaster type: Hurricane
The number of natural disasters in McMullen County (10) is smaller than the US average (15).
Major Disasters (Presidential) Declared: 4
Emergencies Declared: 5

Means of transportation to work:
- Drove a car alone: 593 (76.8%)
- Carpooled: 57 (7.4%)
- Taxicab, motorcycle, or other means: 43 (5.6%)
- Walked: 8 (1.0%)
- Worked at home: 61 (7.9%)
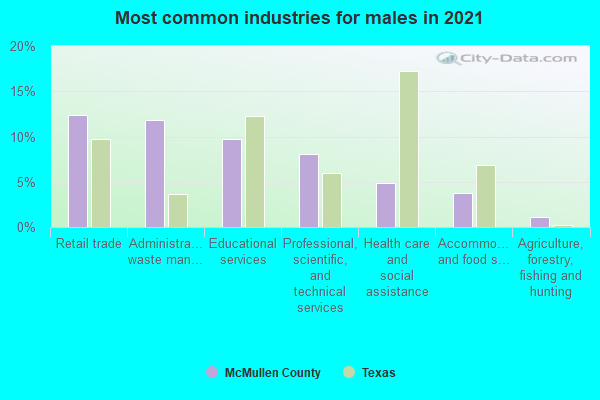
- Educational services (20%)
- Administrative and support and waste management services (14%)
- Retail trade (9%)
- Professional, scientific, and technical services (5%)
- Health care and social assistance (4%)
- Accommodation and food services (3%)
- Agriculture, forestry, fishing and hunting (2%)
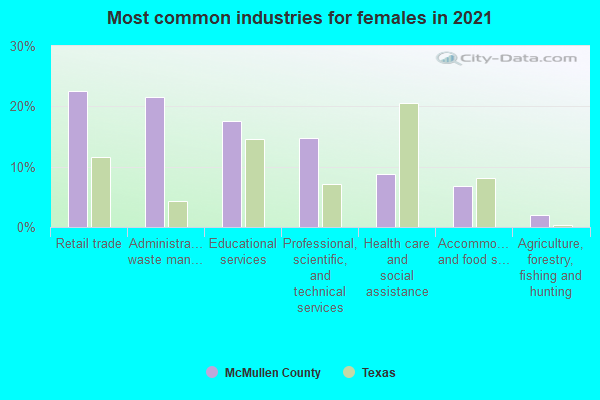
- Educational services (33%)
- Administrative and support and waste management services (24%)
- Retail trade (16%)
- Professional, scientific, and technical services (8%)
- Health care and social assistance (7%)
- Accommodation and food services (5%)
- Agriculture, forestry, fishing and hunting (4%)
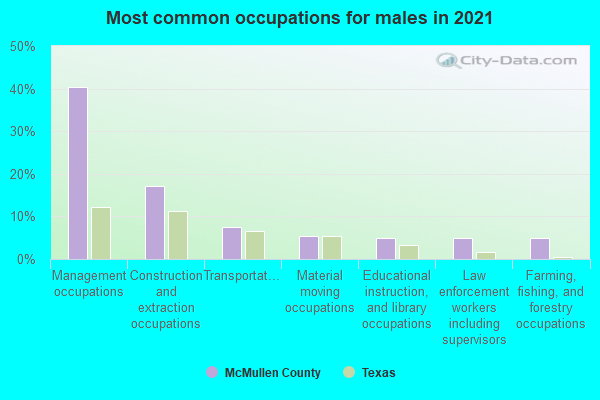
- Management occupations (38%)
- Construction and extraction occupations (19%)
- Transportation occupations (12%)
- Law enforcement workers including supervisors (8%)
- Farming, fishing, and forestry occupations (4%)
- Life, physical, and social science occupations (3%)
- Installation, maintenance, and repair occupations (3%)
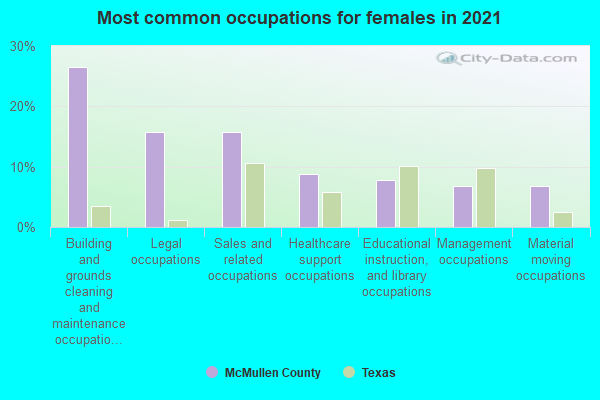
- Building and grounds cleaning and maintenance occupations (34%)
- Educational instruction, and library occupations (17%)
- Sales and related occupations (11%)
- Legal occupations (7%)
- Healthcare support occupations (7%)
- Office and administrative support occupations (7%)
- Food preparation and serving related occupations (5%)
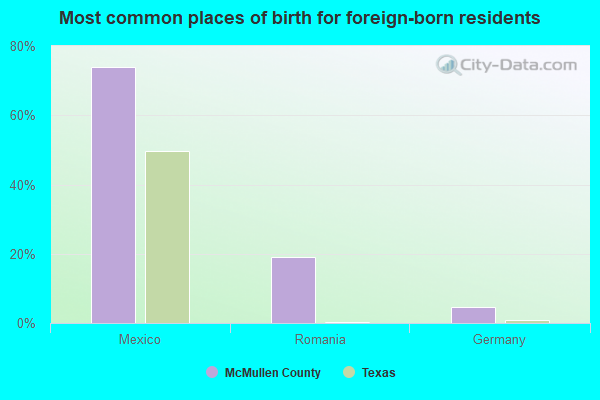
- Mexico (84%)
- Germany (6%)
- Ireland (0%)
- Norway (0%)
- Sweden (0%)
- United Kingdom, excluding England and Scotland (0%)
- England (0%)
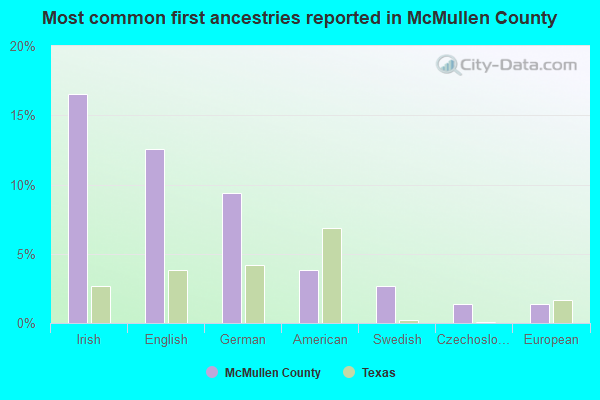
- Irish (18%)
- German (11%)
- English (7%)
- American (5%)
- European (2%)
- Swedish (2%)
- French (except Basque) (2%)
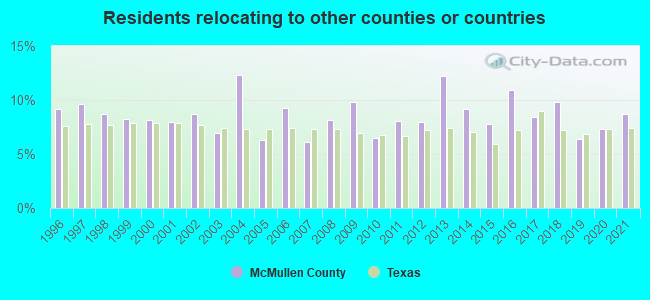
7.58% of this county's 2021 resident taxpayers lived in other counties in 2020 ($49,800 average adjusted gross income)
| Here: | 7.58% |
| Texas average: | 8.12% |
10 or fewer of this county's residents moved from foreign countries.
7.58% relocated from other counties in Texas ($49,800 average AGI)
10 or fewer of this county's residents relocated from other states.

8.68% of this county's 2020 resident taxpayers moved to other counties in 2021 ($103,621 average adjusted gross income)
| Here: | 8.68% |
| Texas average: | 7.40% |
10 or fewer of this county's residents moved to foreign countries.
8.68% relocated to other counties in Texas ($103,621 average AGI)
10 or fewer of this county's residents relocated to other states.
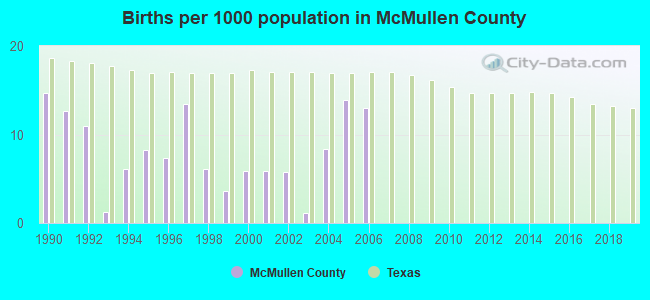
Births per 1000 population from 1990 to 1999: 8.4
Births per 1000 population from 2000 to 2006: 7.7
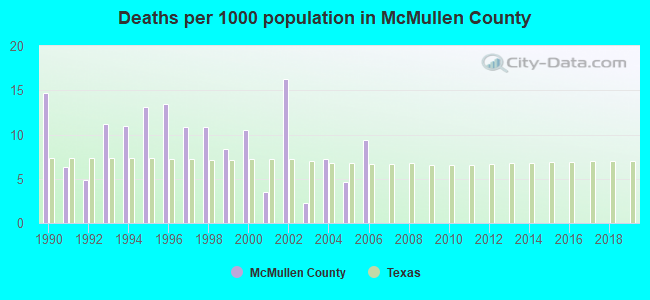
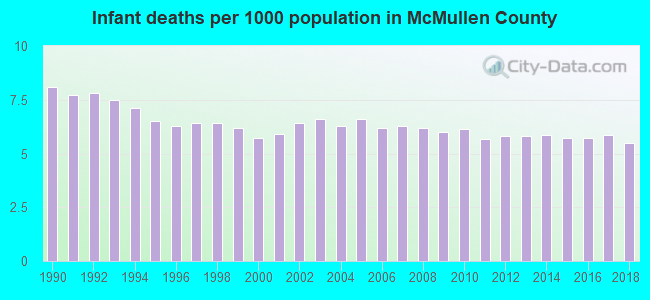
Deaths per 1000 population from 1990 to 1999: 10.5
Deaths per 1000 population from 2000 to 2009: 5.4
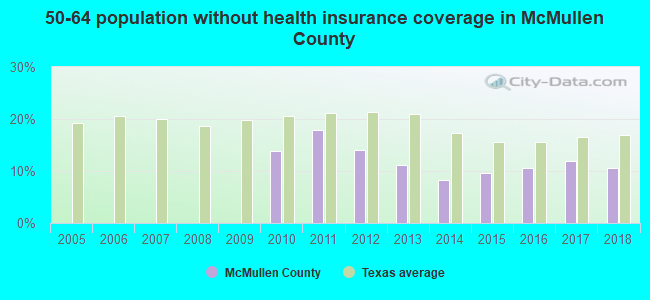
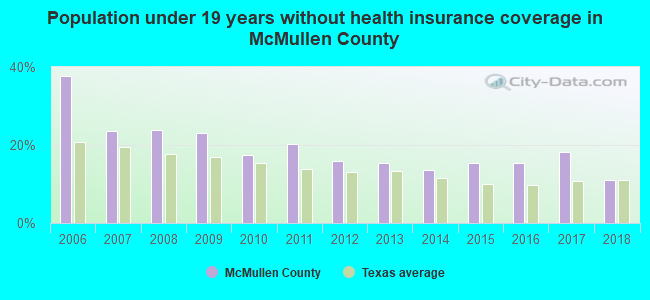
Persons under 19 years old without health insurance coverage in 2018: 11.0%
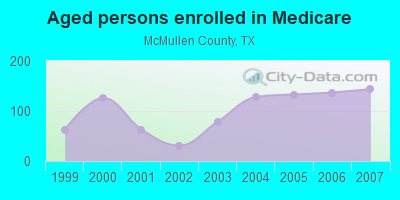
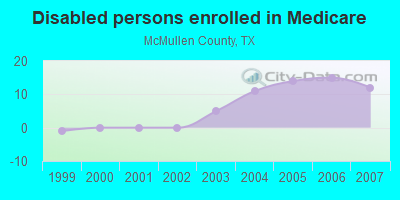
Persons enrolled in hospital insurance and/or supplemental medical insurance (Medicare) in July 1, 2007: 156 (144 aged, 12 disabled)
Children under 18 without health insurance coverage in 2007: 32 (23%)

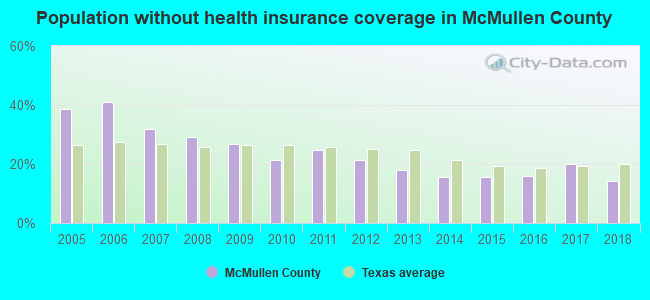
Population without health insurance coverage in 2000: 20%
Children under 18 without health insurance coverage in 2000: 22%
Medical specialist MDs per 100,000 population in 2005: 1,132
Household type by relationship:
Households: 688- Male householders: 101 (10 living alone), Female householders: 111 (39 living alone)
144 spouses (144 opposite-sex spouses), 1 unmarried partners, (1 opposite-sex unmarried partners), 225 children (217 natural, 0 adopted, 8 stepchildren), 20 grandchildren, 0 brothers or sisters, 0 parents, 0 foster children, 77 other relatives, 2 non-relatives
Size of family households: 60 2-persons, 73 3-persons, 6 4-persons, 13 5-persons, 2 6-persons, 7 7-or-more-persons.
Size of nonfamily households: 49 1-person, 1 2-persons.
106 married couples with children.
33 single-parent households (12 men, 21 women).
83.4% of residents of McMullen speak English at home.
16.6% of residents speak Spanish at home (84% speak English very well, 1% speak English well, 15% speak English not well).
In fiscal year 2004:
Federal Government expenditure: $3,586,000 ($4,204 per capita)
Department of Defense expenditure: $107,000
Federal direct payments to individuals for retirement and disability: $1,797,000
Federal other direct payments to individuals: $667,000
Federal direct payments not to individuals: $123,000
Federal grants: $702,000
Federal procurement contracts: $50,000 ($0,000 Department of Defense)
Federal salaries and wages: $247,000 ($0,000 Department of Defense)
Federal Government direct loans: $10,000
Federal guaranteed/insured loans: $128,000
Federal Government insurance: $1,165,000
Population change from April 1, 2000 to July 1, 2005:
Births: 18| Here: | 20 per 1000 residents |
| State: | 85 per 1000 residents |
Deaths: 29
| Here: | 33 per 1000 residents |
| State: | 35 per 1000 residents |
Net international migration: +4
| Here: | +5 per 1000 residents |
| State: | +29 per 1000 residents |
Net internal migration: +44
| Here: | +50 per 1000 residents |
| State: | +10 per 1000 residents |
Total withdrawal of fresh water for public supply: 0.51 millions of gallons per day (all from ground)
| Here: | 5.3 |
| State: | 6.3 |
| Here: | 5.2 |
| State: | 4.0 |
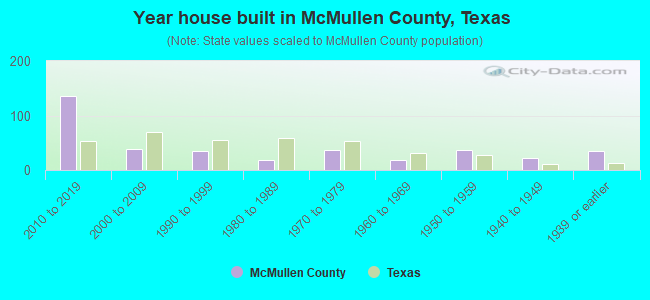
- Year house built in McMullen County, Texas
- 02020 or later
- 1192010 to 2019
- 432000 to 2009
- 321990 to 1999
- 341980 to 1989
- 381970 to 1979
- 291960 to 1969
- 391950 to 1959
- 111940 to 1949
- 381939 or earlier
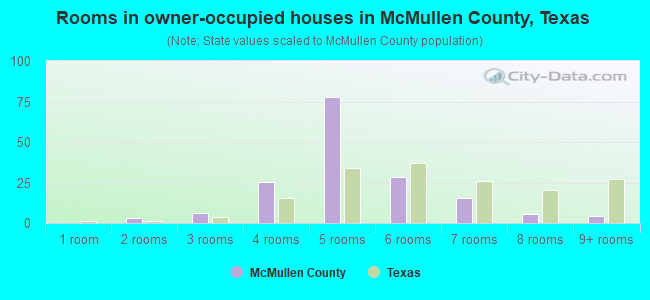
- Rooms in owner-occupied houses in McMullen County, Texas
- 01 room
- 02 rooms
- 73 rooms
- 234 rooms
- 775 rooms
- 306 rooms
- 397 rooms
- 38 rooms
- 49+ rooms
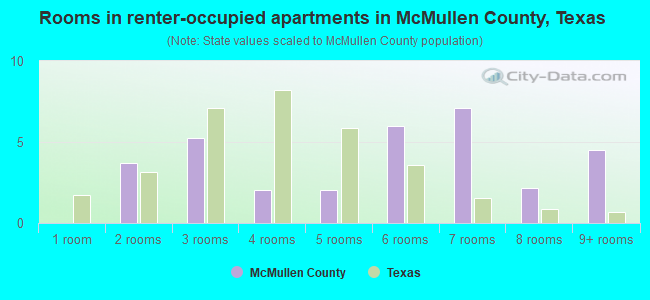
- Rooms in renter-occupied apartments in McMullen County, Texas
- 01 room
- 02 rooms
- 53 rooms
- 24 rooms
- 95 rooms
- 66 rooms
- 07 rooms
- 38 rooms
- 39+ rooms
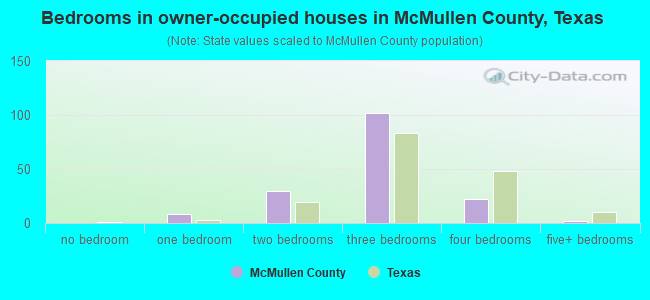
- Bedrooms in owner-occupied houses in McMullen County, Texas
- 0no bedroom
- 61 bedroom
- 282 bedrooms
- 1083 bedrooms
- 314 bedrooms
- 105+ bedrooms
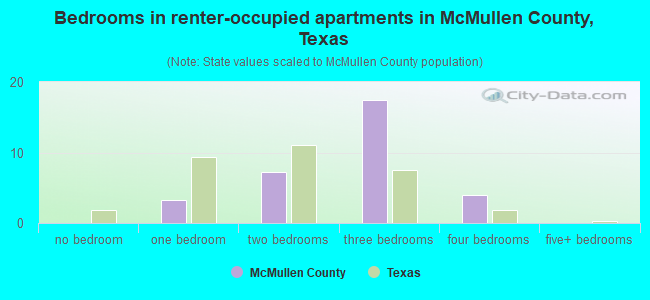
- Bedrooms in renter-occupied apartments in McMullen County, Texas
- 0no bedroom
- 01 bedroom
- 72 bedrooms
- 183 bedrooms
- 34 bedrooms
- 05+ bedrooms
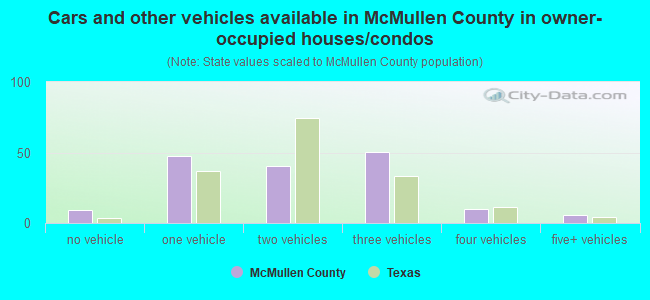
- Cars and other vehicles available in McMullen County in owner-occupied houses/condos
- 7no vehicle
- 561 vehicle
- 472 vehicles
- 563 vehicles
- 104 vehicles
- 95+ vehicles
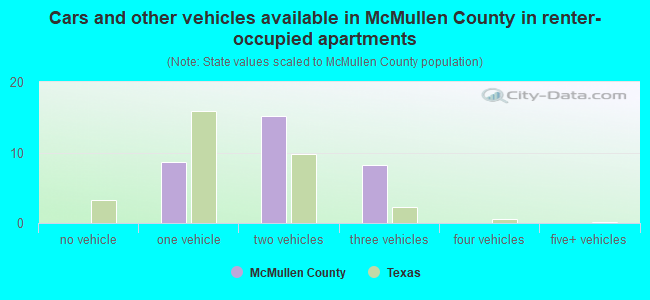
- Cars and other vehicles available in McMullen County in renter-occupied apartments
- 0no vehicle
- 101 vehicle
- 102 vehicles
- 93 vehicles
- 04 vehicles
- 05+ vehicles
97.3% of McMullen County residents lived in the same house 1 years ago.
Out of people who lived in different houses, 0% lived in this county.
Out of people who lived in different counties, 100% lived in Texas.
| McMullen County: | 97.3% |
| State average: | 85.7% |
Place of birth for U.S.-born residents:
- This state: 606
- Other state: 41
- Northeast: 0
- Midwest: 10
- South: 27
- West: 3
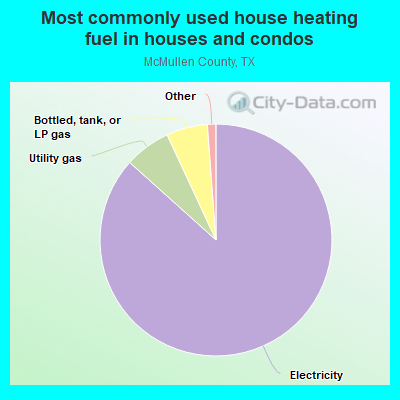
- 87.9%Electricity
- 9.2%Bottled, tank, or LP gas
- 2.9%Utility gas
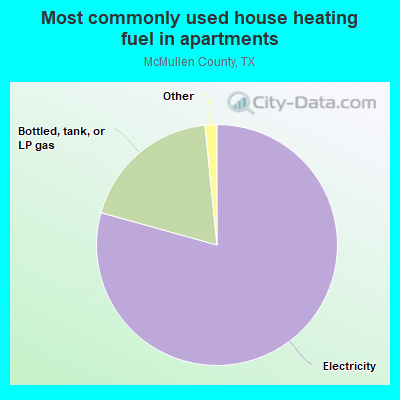
- 78.6%Electricity
- 21.4%Bottled, tank, or LP gas
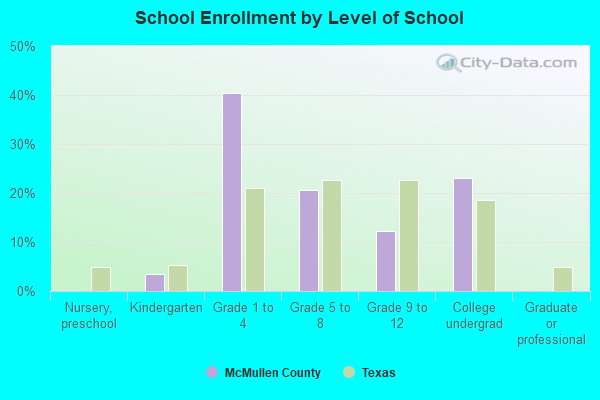
Private vs. public school enrollment:
| Here: | 0.0% |
| Texas: | 8.8% |
| Here: | 0.0% |
| Texas: | 8.0% |
| Here: | 16.7% |
| Texas: | 16.2% |
McMullen County government finances - Expenditure in 2017:
- Bond Funds - Cash and Securities: $4,000
- Charges - Other: $30,000
Regular Highways: $1,000
- Construction - Regular Highways: $17,000
General - Other: $6,000
- Current Operations - Correctional Institutions: $59,000
Judicial and Legal Services: $48,000
Corrections - Other: $39,000
Police Protection: $35,000
General - Other: $26,000
Regular Highways: $26,000
Financial Administration: $10,000
General Public Buildings: $5,000
Local Fire Protection: $3,000
Public Welfare, Vendor Payments for Medical Care: $2,000
Public Welfare - Other: $2,000
Central Staff Services: $2,000
Solid Waste Management: $1,000
Natural Resources - Other: $1,000
- Federal Intergovernmental - Other: $2,000
- General - Interest on Debt: $3,000
- Local Intergovernmental - Other: $3,000
- Long Term Debt - Beginning Outstanding - Unspecified Public Purpose: $92,000
Outstanding Unspecified Public Purpose: $80,000
Retired Unspecified Public Purpose: $12,000
- Miscellaneous - General Revenue - Other: $10,000
Fines and Forfeits: $5,000
Interest Earnings: $1,000
- Other Capital Outlay - General - Other: $4,000
Correctional Institutions: $1,000
Corrections - Other: $1,000
- Other Funds - Cash and Securities: $178,000
- Sinking Funds - Cash and Securities: $6,000
- State Intergovernmental - Other: $12,000
General Local Government Support: $2,000
- Tax - Property: $180,000
General Sales and Gross Receipts: $57,000
Motor Vehicle License: $11,000
Other Selective Sales: $7,000
McMullen County government finances - Revenue in 2017:
- Bond Funds - Cash and Securities: $4,000
- Charges - Other: $30,000
Regular Highways: $1,000
- Construction - Regular Highways: $17,000
General - Other: $6,000
- Current Operations - Correctional Institutions: $59,000
Judicial and Legal Services: $48,000
Corrections - Other: $39,000
Police Protection: $35,000
General - Other: $26,000
Regular Highways: $26,000
Financial Administration: $10,000
General Public Buildings: $5,000
Local Fire Protection: $3,000
Public Welfare, Vendor Payments for Medical Care: $2,000
Public Welfare - Other: $2,000
Central Staff Services: $2,000
Solid Waste Management: $1,000
Natural Resources - Other: $1,000
- Federal Intergovernmental - Other: $2,000
- General - Interest on Debt: $3,000
- Local Intergovernmental - Other: $3,000
- Long Term Debt - Beginning Outstanding - Unspecified Public Purpose: $92,000
Outstanding Unspecified Public Purpose: $80,000
Retired Unspecified Public Purpose: $12,000
- Miscellaneous - General Revenue - Other: $10,000
Fines and Forfeits: $5,000
Interest Earnings: $1,000
- Other Capital Outlay - General - Other: $4,000
Correctional Institutions: $1,000
Corrections - Other: $1,000
- Other Funds - Cash and Securities: $178,000
- Sinking Funds - Cash and Securities: $6,000
- State Intergovernmental - Other: $12,000
General Local Government Support: $2,000
- Tax - Property: $180,000
General Sales and Gross Receipts: $57,000
Motor Vehicle License: $11,000
Other Selective Sales: $7,000
McMullen County government finances - Debt in 2017:
- Bond Funds - Cash and Securities: $4,000
- Charges - Other: $30,000
Regular Highways: $1,000
- Construction - Regular Highways: $17,000
General - Other: $6,000
- Current Operations - Correctional Institutions: $59,000
Judicial and Legal Services: $48,000
Corrections - Other: $39,000
Police Protection: $35,000
General - Other: $26,000
Regular Highways: $26,000
Financial Administration: $10,000
General Public Buildings: $5,000
Local Fire Protection: $3,000
Public Welfare, Vendor Payments for Medical Care: $2,000
Public Welfare - Other: $2,000
Central Staff Services: $2,000
Solid Waste Management: $1,000
Natural Resources - Other: $1,000
- Federal Intergovernmental - Other: $2,000
- General - Interest on Debt: $3,000
- Local Intergovernmental - Other: $3,000
- Long Term Debt - Beginning Outstanding - Unspecified Public Purpose: $92,000
Outstanding Unspecified Public Purpose: $80,000
Retired Unspecified Public Purpose: $12,000
- Miscellaneous - General Revenue - Other: $10,000
Fines and Forfeits: $5,000
Interest Earnings: $1,000
- Other Capital Outlay - General - Other: $4,000
Correctional Institutions: $1,000
Corrections - Other: $1,000
- Other Funds - Cash and Securities: $178,000
- Sinking Funds - Cash and Securities: $6,000
- State Intergovernmental - Other: $12,000
General Local Government Support: $2,000
- Tax - Property: $180,000
General Sales and Gross Receipts: $57,000
Motor Vehicle License: $11,000
Other Selective Sales: $7,000
McMullen County government finances - Cash and Securities in 2017:
- Bond Funds - Cash and Securities: $4,000
- Charges - Other: $30,000
Regular Highways: $1,000
- Construction - Regular Highways: $17,000
General - Other: $6,000
- Current Operations - Correctional Institutions: $59,000
Judicial and Legal Services: $48,000
Corrections - Other: $39,000
Police Protection: $35,000
General - Other: $26,000
Regular Highways: $26,000
Financial Administration: $10,000
General Public Buildings: $5,000
Local Fire Protection: $3,000
Public Welfare, Vendor Payments for Medical Care: $2,000
Public Welfare - Other: $2,000
Central Staff Services: $2,000
Solid Waste Management: $1,000
Natural Resources - Other: $1,000
- Federal Intergovernmental - Other: $2,000
- General - Interest on Debt: $3,000
- Local Intergovernmental - Other: $3,000
- Long Term Debt - Beginning Outstanding - Unspecified Public Purpose: $92,000
Outstanding Unspecified Public Purpose: $80,000
Retired Unspecified Public Purpose: $12,000
- Miscellaneous - General Revenue - Other: $10,000
Fines and Forfeits: $5,000
Interest Earnings: $1,000
- Other Capital Outlay - General - Other: $4,000
Correctional Institutions: $1,000
Corrections - Other: $1,000
- Other Funds - Cash and Securities: $178,000
- Sinking Funds - Cash and Securities: $6,000
- State Intergovernmental - Other: $12,000
General Local Government Support: $2,000
- Tax - Property: $180,000
General Sales and Gross Receipts: $57,000
Motor Vehicle License: $11,000
Other Selective Sales: $7,000
Supplemental Security Income (SSI) in 2006:
- Total number of recipients: 16
- Number of aged recipients: 5
- Number of blind and disabled recipients: 11
- Number of recipients under 18: 0
- Number of recipients between 18 and 64: 10
- Number of recipients older than 64: 6
- Number of recipients also receiving OASDI: 9
- Amount of payments (thousands of dollars): 5
McMullen County on our top lists:
- #7 on the list of "Top 101 counties with the smallest number of people without health insurance coverage in 2000"
- #16 on the list of "Top 101 counties with the largest number of children under 18 without health insurance coverage in 2000"
- #63 on the list of "Top 101 counties with highest percentage of residents voting for Romney (Republican) in the 2012 Presidential Election"