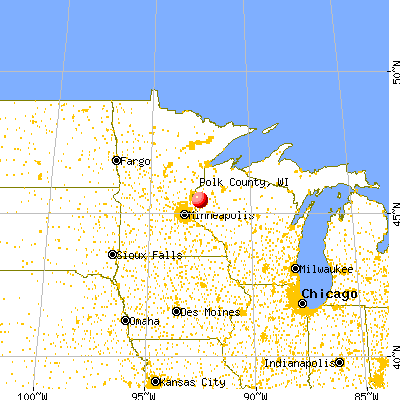
Polk County, Wisconsin (WI)
County owner-occupied free and clear houses and condos in 2010: 4,290
County owner-occupied houses and condos in 2000: 13,025
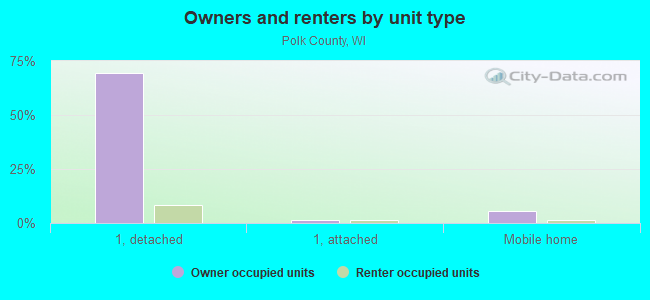
Renter-occupied apartments: 3,819 (it was 3,229 in 2000)
| % of renters here: | 20% |
| State: | 32% |
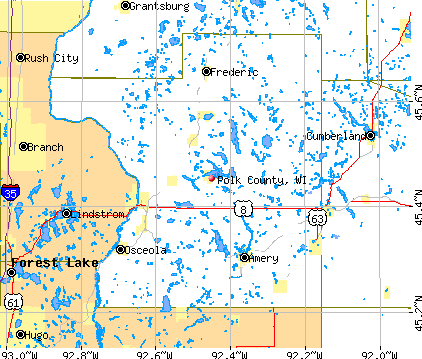
Land area: 917 sq. mi.
Water area: 39.0 sq. mi.
Population density: 49 people per square mile (average).
Industries providing employment: Manufacturing (25.4%), Educational, health and social services (21.2%).
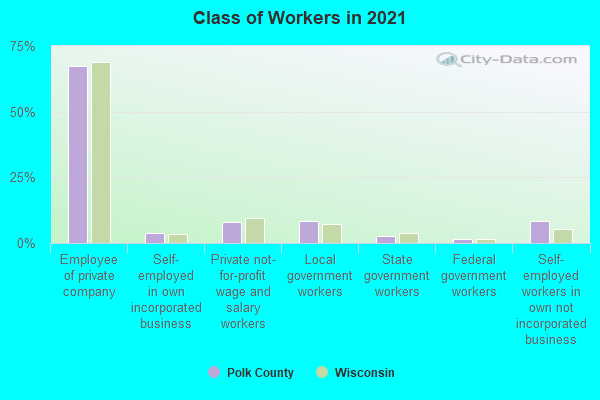
Type of workers:
- Private wage or salary: 80%
- Government: 12%
- Self-employed, not incorporated: 8%
- Unpaid family work: 0%
- OSM Map
- General Map
- Google Map
- MSN Map

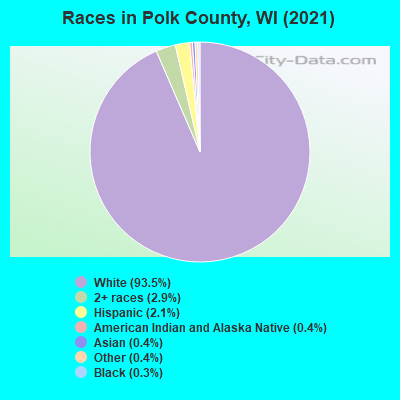
- 42,07493.4%White Non-Hispanic Alone
- 1,3393.0%Two or more races
- 9212.0%Hispanic or Latino
- 1870.4%American Indian and Alaska Native alone
- 1770.4%Asian alone
- 1700.4%Black Non-Hispanic Alone
- 1530.3%Some other race alone
- 170.04%Native Hawaiian and Other
Pacific Islander alone
| Median resident age: | 47.1 years |
| Wisconsin median age: | 40.4 years |
| Males: 23,105 | |
| Females: 22,102 |

 | Small cabins in Polk County? (1 reply) |
| What is it really like in Polk County? (4 replies) |
| Areas close to New Richmond WI (5 replies) |
| Polk County: | 2.0 people |
| Wisconsin: | 2 people |
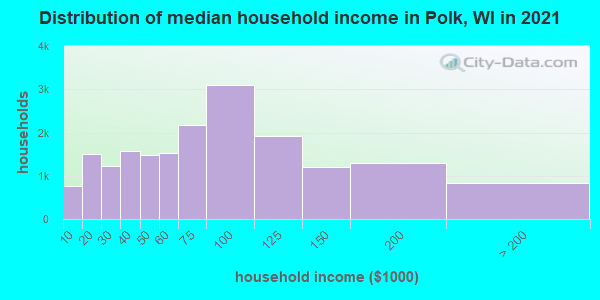
Estimated median household income in 2022: $72,646 ($41,183 in 1999)
| This county: | $72,646 |
| Wisconsin: | $70,996 |
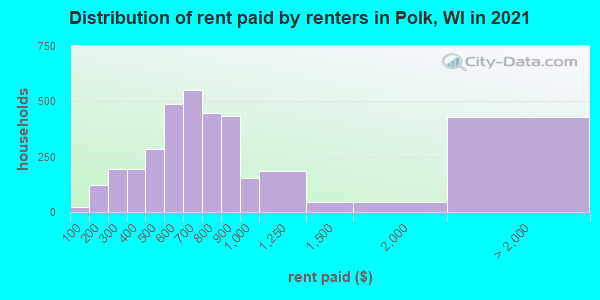
Median contract rent in 2022 for apartments: $730 (lower quartile is $518, upper quartile is $927)
| This county: | $730 |
| State: | $845 |
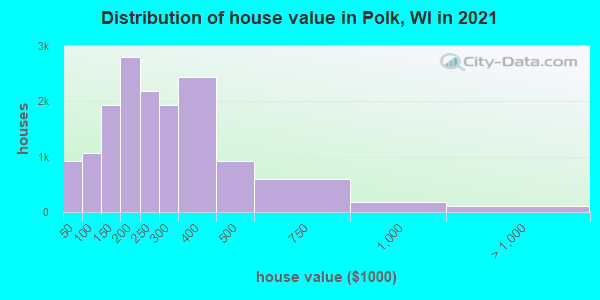
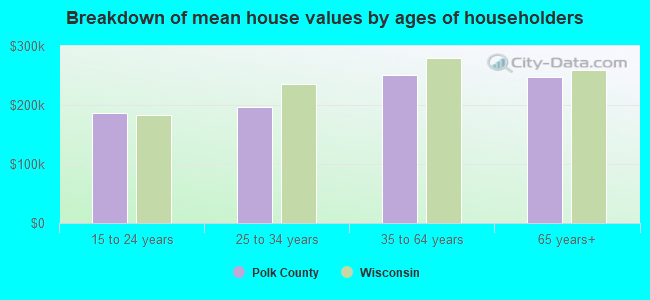
Estimated median house or condo value in 2022: $243,405 (it was $100,200 in 2000)
| Polk: | $243,405 |
| Wisconsin: | $252,800 |
Mean price in 2022:
Median monthly housing costs for homes and condos with a mortgage: $1,456Detached houses: $292,280
Here: $292,280 State: $308,468 Townhouses or other attached units: $273,047
Here: $273,047 State: $265,873 In 2-unit structures: $342,285
Here: $342,285 State: $203,667 In 3-to-4-unit structures: $199,123
Here: $199,123 State: $216,833 In 5-or-more-unit structures: $285,633
Here: $285,633 State: $280,537 Mobile homes: $95,707
Here: $95,707 State: $79,042 Occupied boats, RVs, vans, etc.: $119,484
Here: $119,484 State: $148,355
Median monthly housing costs for units without a mortgage: $589
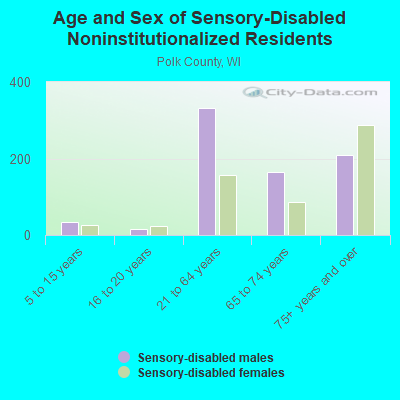
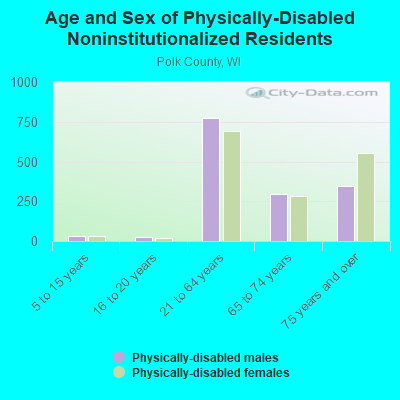
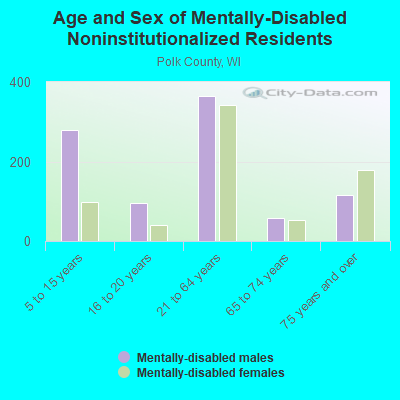
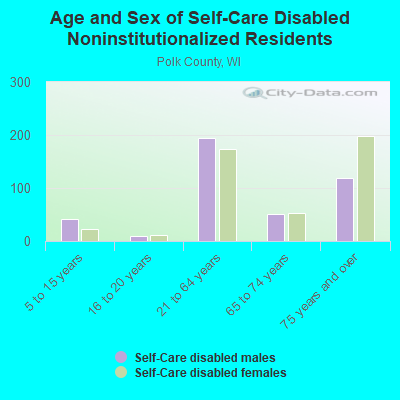
Institutionalized population: 412
Crime in 2021 (reported by the sheriff's office or county police, not the county total):
- Murders: 3
- Rapes: 6
- Robberies: 1
- Assaults: 38
- Burglaries: 24
- Thefts: 69
- Auto thefts: 9
Crime in 2020 (reported by the sheriff's office or county police, not the county total):
- Murders: 0
- Rapes: 5
- Robberies: 1
- Assaults: 24
- Burglaries: 56
- Thefts: 124
- Auto thefts: 22
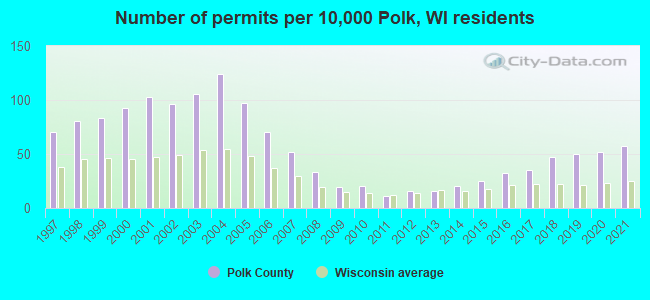
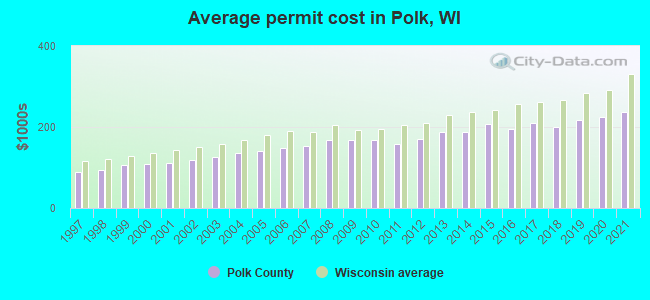
Single-family new house construction building permits:
- 2022: 206 buildings, average cost: $309,800
- 2021: 235 buildings, average cost: $236,000
- 2020: 214 buildings, average cost: $224,400
- 2019: 206 buildings, average cost: $217,400
- 2018: 195 buildings, average cost: $199,800
- 2017: 146 buildings, average cost: $208,700
- 2016: 131 buildings, average cost: $196,400
- 2015: 103 buildings, average cost: $206,600
- 2014: 83 buildings, average cost: $187,300
- 2013: 68 buildings, average cost: $187,800
- 2012: 68 buildings, average cost: $171,100
- 2011: 46 buildings, average cost: $158,800
- 2010: 83 buildings, average cost: $166,900
- 2009: 77 buildings, average cost: $168,900
- 2008: 136 buildings, average cost: $167,900
- 2007: 215 buildings, average cost: $153,700
- 2006: 289 buildings, average cost: $148,200
- 2005: 399 buildings, average cost: $140,300
- 2004: 512 buildings, average cost: $136,200
- 2003: 440 buildings, average cost: $127,000
- 2002: 398 buildings, average cost: $117,600
- 2001: 425 buildings, average cost: $110,000
- 2000: 385 buildings, average cost: $107,900
- 1999: 343 buildings, average cost: $106,800
- 1998: 336 buildings, average cost: $93,700
- 1997: 289 buildings, average cost: $89,000
Median real estate property taxes paid for housing units with mortgages in 2022: $2,803 (1.1%)
Median real estate property taxes paid for housing units with no mortgage in 2022: $2,741 (1.2%)
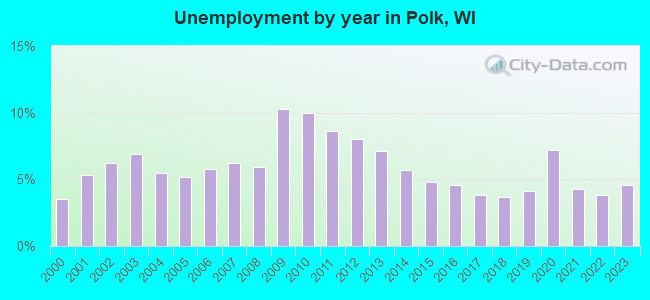
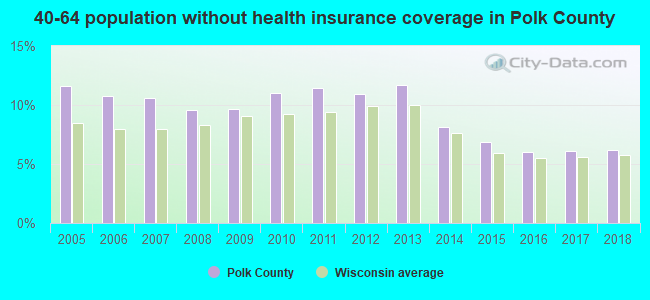
| Polk County: | 8.4% |
| Wisconsin: | 10.7% |
Median age of residents in 2022: 47.1 years old
(Males: 46.3 years old, Females: 47.9 years old)
(Median age for: White residents: 48.0 years old, Black residents: 37.5 years old, American Indian residents: 50.2 years old, Asian residents: 37.7 years old, Hispanic or Latino residents: 30.8 years old, Other race residents: 48.0 years old)
Fair market rent in 2006 for a 1-bedroom apartment in Polk County is $457 a month.
Fair market rent for a 2-bedroom apartment is $600 a month.
Fair market rent for a 3-bedroom apartment is $738 a month.
Cities in this county include: Amery, Alden, Osceola, St. Croix Falls, Garfield, Eureka, Frederic, Luck, Black Brook, Apple River.
Neighboring counties: Penobscot County, Maine  , Forest County , Multnomah County, Oregon
  , Tillamook County, Oregon , Park County, Montana , Langlade County .
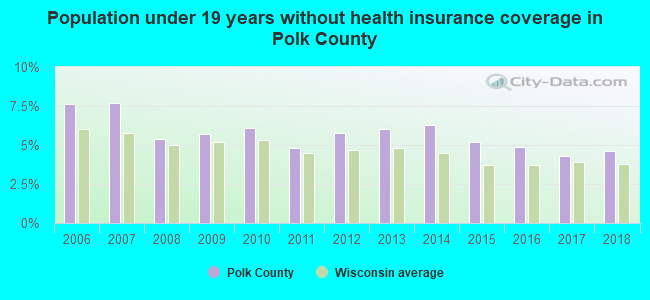
| Here: | 4.6% |
| Wisconsin: | 2.7% |
Current college students: 1,120
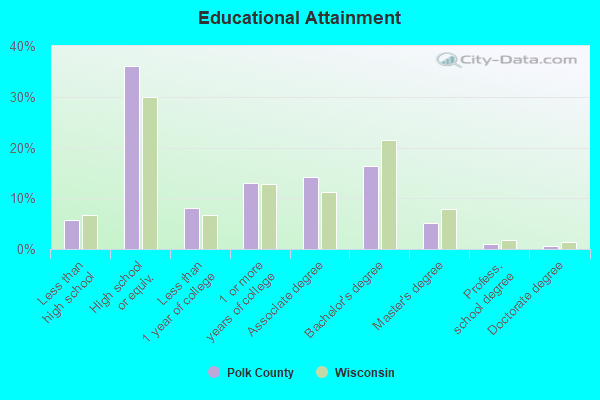
People 25 years of age or older with a high school degree or higher: 93.5%
People 25 years of age or older with a bachelor's degree or higher: 22.8%
Number of foreign born residents: 629 (63.2% naturalized citizens)
| Polk County: | 1.4% |
| Whole state: | 5.0% |
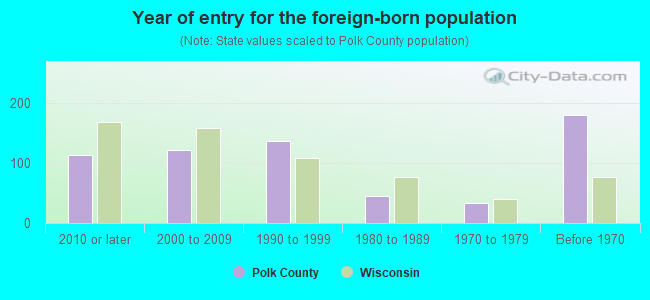
- Year of entry for the foreign-born population
- 1072010 or later
- 1252000 to 2009
- 1611990 to 1999
- 451980 to 1989
- 331970 to 1979
- 180Before 1970
Mean travel time to work (commute): minutes
Percentage of county residents living and working in this county: 80.5%
Housing units in structures:
- One, detached: 19,945
- One, attached: 592
- Two: 371
- 3 or 4: 507
- 5 to 9: 546
- 10 to 19: 301
- 20 or more: 592
- Mobile homes: 1,632
- Boats, RVs, vans, etc.: 42
Housing units in Polk County with a mortgage: 9,202 (1,256 second mortgage, 27 home equity loan, 1,038 both second mortgage and home equity loan)
Houses without a mortgage: 367
| Here: | 2.4% with mortgage |
| State: | 96.6% with mortgage |
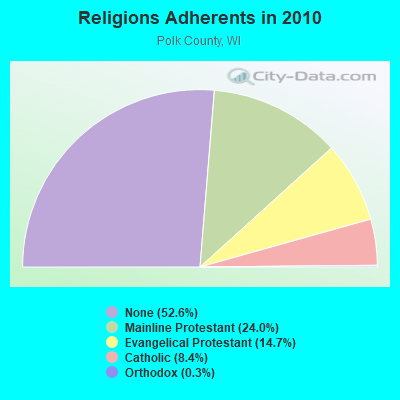
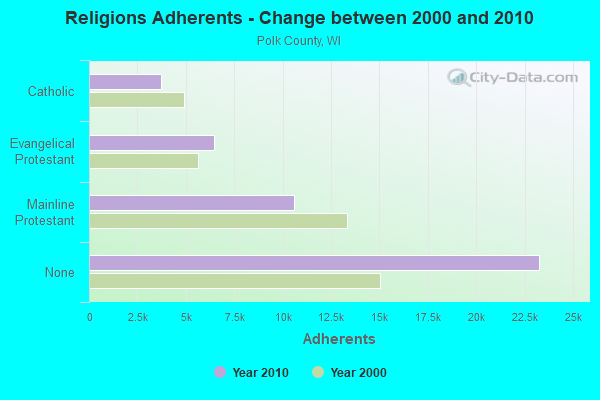
Religion statistics for Polk County
| Religion | Adherents | Congregations |
|---|---|---|
| Mainline Protestant | 10,596 | 37 |
| Evangelical Protestant | 6,480 | 39 |
| Catholic | 3,716 | 5 |
| Orthodox | 130 | 1 |
| Other | 15 | 3 |
| None | 23,268 | - |
Source: Clifford Grammich, Kirk Hadaway, Richard Houseal, Dale E.Jones, Alexei Krindatch, Richie Stanley and Richard H.Taylor. 2012. 2010 U.S.Religion Census: Religious Congregations & Membership Study. Association of Statisticians of American Religious Bodies. Jones, Dale E., et al. 2002. Congregations and Membership in the United States 2000. Nashville, TN: Glenmary Research Center.
Food Environment Statistics:
| Polk County: | 2.49 / 10,000 pop. |
| State: | 1.86 / 10,000 pop. |
| This county: | 0.23 / 10,000 pop. |
| Wisconsin: | 0.38 / 10,000 pop. |
| Polk County: | 5.65 / 10,000 pop. |
| Wisconsin: | 4.12 / 10,000 pop. |
| This county: | 8.37 / 10,000 pop. |
| State: | 8.64 / 10,000 pop. |
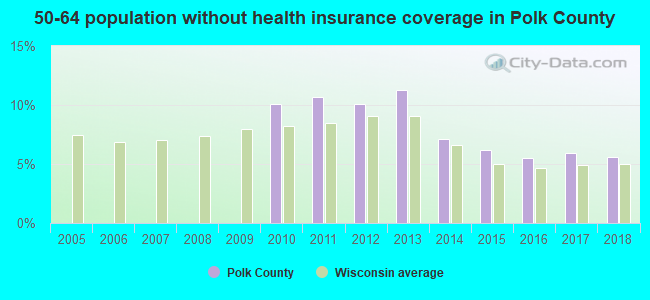
| Polk County: | 8.0% |
| Wisconsin: | 7.6% |
| Polk County: | 26.9% |
| State: | 27.5% |
| Here: | 9.1% |
| State: | 13.0% |
Agriculture in Polk County:
Average size of farms: 177 acresAverage value of agricultural products sold per farm: $43,696
Average value of crops sold per acre for harvested cropland: $134.79
The value of livestock, poultry, and their products as a percentage of the total market value of agricultural products sold: 73.19%
Average total farm production expenses per farm: $37,920
Harvested cropland as a percentage of land in farms: 49.23%
Average market value of all machinery and equipment per farm: $46,858
The percentage of farms operated by a family or individual: 92.95%
Average age of principal farm operators: 54 years
Average number of cattle and calves per 100 acres of all land in farms: 16.65
Milk cows as a percentage of all cattle and calves: 36.47%
Corn for grain: 49293 harvested acres
All wheat for grain: 1704 harvested acres
Soybeans for beans: 20794 harvested acres
Vegetables: 2,373 harvested acres
Land in orchards: 183 acres
Earthquake activity:
Polk County-area historical earthquake activity is significantly above Wisconsin state average. It is 62% smaller than the overall U.S. average.On 7/9/1975 at 14:54:15, a magnitude 4.6 (4.6 MB, Class: Light, Intensity: IV - V) earthquake occurred 174.4 miles away from Polk County center
On 6/5/1993 at 01:24:53, a magnitude 4.1 (4.1 LG, Depth: 6.2 mi) earthquake occurred 186.6 miles away from the county center
On 3/4/1983 at 06:32:18, a magnitude 4.6 (4.4 MB, 4.6 LG, 4.4 ML) earthquake occurred 351.7 miles away from the county center
On 2/7/2020 at 18:30:28, a magnitude 3.3 (3.3 ML, Class: Light, Intensity: II - III) earthquake occurred 140.8 miles away from the county center
On 10/20/1995 at 15:57:18, a magnitude 3.7 (3.7 LG, Depth: 3.1 mi) earthquake occurred 214.7 miles away from Polk County center
On 1/9/2020 at 18:16:48, a magnitude 3.3 (3.3 MB) earthquake occurred 145.4 miles away from the county center
Magnitude types: regional Lg-wave magnitude (LG), body-wave magnitude (MB), local magnitude (ML)
Most recent natural disasters:
- Wisconsin Covid-19 Pandemic, Incident Period: January 20, 2020, Major Disaster (Presidential) Declared DR-4520-WI: April 4, 2020, FEMA Id: 4520, Natural disaster type: Other
- Wisconsin Severe Storms, Tornadoes, Straight-line Winds, And Flooding, Incident Period: July 18, 2019 - July 20, 2019, FEMA Id: 4459, Natural disaster type: Storm, Tornado, Flood, Wind
- Wisconsin Hurricane Katrina Evacuation, Incident Period: August 29, 2005 to October 01, 2005, Emergency Declared EM-3249: September 13, 2005, FEMA Id: 3249, Natural disaster type: Hurricane
- Wisconsin Severe Storms, Tornadoes and Flooding, Incident Period: September 02, 2002 to September 06, 2002, Major Disaster (Presidential) Declared DR-1432: September 10, 2002, FEMA Id: 1432, Natural disaster type: Storm, Tornado, Flood
- Wisconsin Flooding, Incident Period: April 10, 2001 to July 06, 2001, Major Disaster (Presidential) Declared DR-1369: May 11, 2001, FEMA Id: 1369, Natural disaster type: Flood
- Wisconsin Severe Storms, Tornadoes And Flooding, Incident Period: May 26, 2000 to July 19, 2000, Major Disaster (Presidential) Declared DR-1332: June 24, 2000, FEMA Id: 1332, Natural disaster type: Storm, Tornado, Flood
- Wisconsin Winds, Hail & Rain, Incident Period: August 05, 1977, Emergency Declared EM-3048: October 03, 1977, FEMA Id: 3048, Natural disaster type: Wind
- Wisconsin Drought, Incident Period: June 17, 1976, Emergency Declared EM-3014: June 17, 1976, FEMA Id: 3014, Natural disaster type: Drought
- Wisconsin TORNADOES, SEVERE STORMS, FLOODING, Incident Period: April 21, 1965, Major Disaster (Presidential) Declared DR-192: April 21, 1965, FEMA Id: 192, Natural disaster type: Storm, Tornado, Flood
The number of natural disasters in Polk County (9) is smaller than the US average (15).
Major Disasters (Presidential) Declared: 5
Emergencies Declared: 3
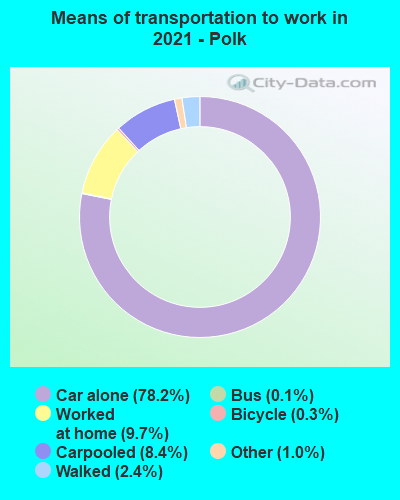
Means of transportation to work:
- Drove a car alone: 13,515 (74.2%)
- Carpooled: 1,539 (8.5%)
- Bus: 57 (0.3%)
- Taxicab, motorcycle, or other means: 213 (1.2%)
- Bicycle: 38 (0.2%)
- Walked: 406 (2.2%)
- Worked at home: 2,498 (13.7%)
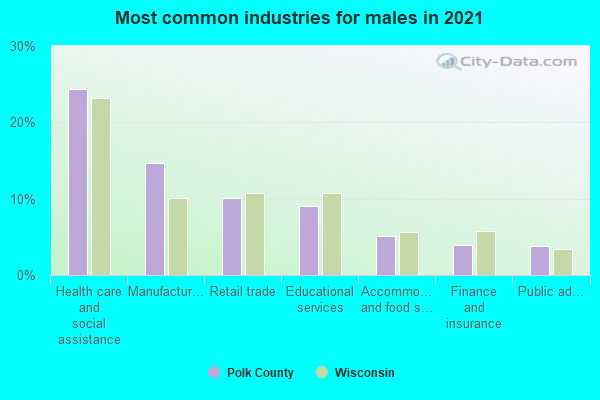
- Health care and social assistance (23%)
- Manufacturing (15%)
- Retail trade (10%)
- Educational services (9%)
- Accommodation and food services (5%)
- Finance and insurance (4%)
- Public administration (4%)
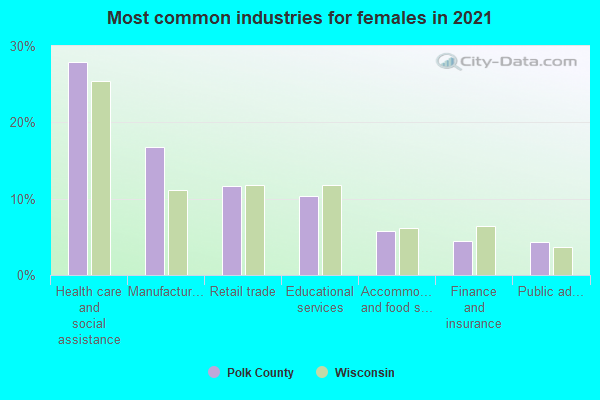
- Health care and social assistance (26%)
- Manufacturing (17%)
- Retail trade (11%)
- Educational services (11%)
- Accommodation and food services (6%)
- Finance and insurance (5%)
- Public administration (4%)
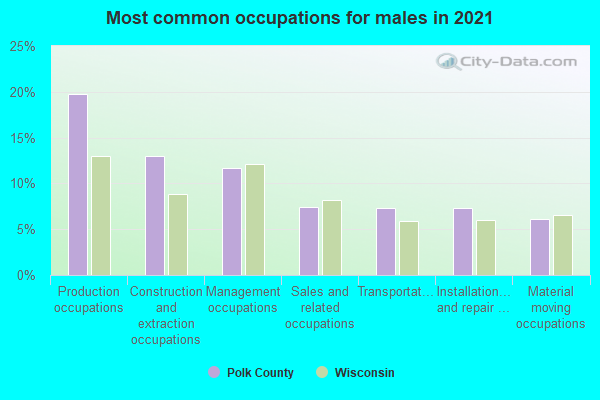
- Production occupations (19%)
- Construction and extraction occupations (13%)
- Management occupations (11%)
- Installation, maintenance, and repair occupations (8%)
- Sales and related occupations (7%)
- Transportation occupations (7%)
- Material moving occupations (6%)
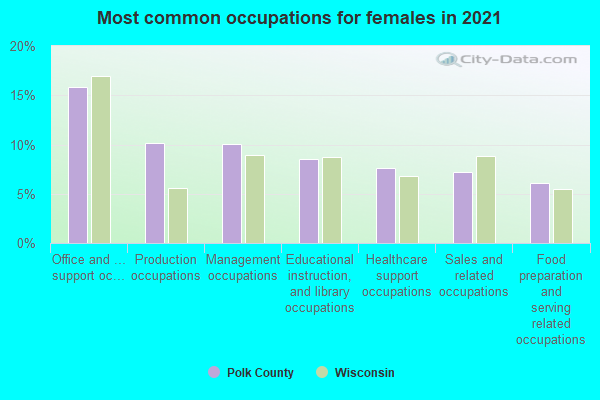
- Office and administrative support occupations (17%)
- Management occupations (11%)
- Production occupations (11%)
- Educational instruction, and library occupations (8%)
- Sales and related occupations (7%)
- Healthcare support occupations (7%)
- Food preparation and serving related occupations (6%)
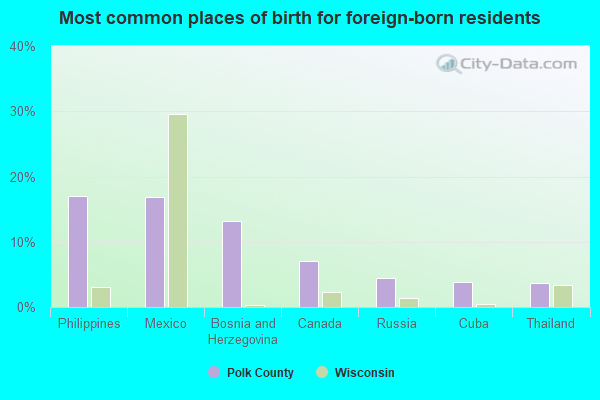
- Mexico (18%)
- Philippines (10%)
- Bosnia and Herzegovina (9%)
- Canada (7%)
- Germany (6%)
- Korea (4%)
- Japan (4%)
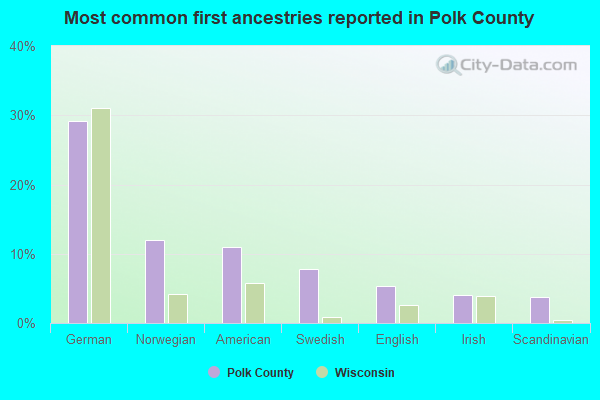
- German (31%)
- Norwegian (12%)
- American (11%)
- Swedish (7%)
- English (4%)
- Irish (4%)
- Scandinavian (3%)
People in group quarters in Polk County, Wisconsin in 2010:
- 308 people in nursing facilities/skilled-nursing facilities
- 71 people in local jails and other municipal confinement facilities
- 33 people in residential treatment centers for juveniles (non-correctional)
- 19 people in emergency and transitional shelters (with sleeping facilities) for people experiencing homelessness
- 17 people in group homes intended for adults
- 12 people in workers' group living quarters and job corps centers
People in group quarters in Polk County, Wisconsin in 2000:
- 476 people in nursing homes
- 47 people in local jails and other confinement facilities (including police lockups)
- 37 people in other noninstitutional group quarters
- 15 people in homes for abused, dependent, and neglected children
- 9 people in homes for the mentally retarded
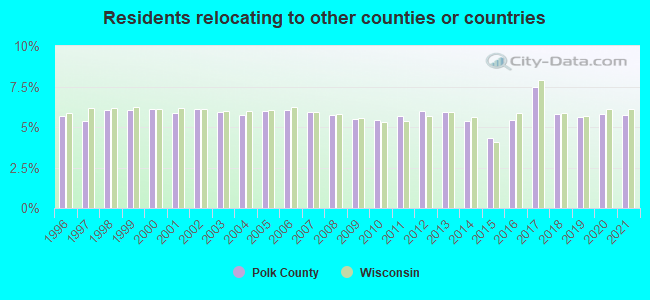
6.94% of this county's 2021 resident taxpayers lived in other counties in 2020 ($65,243 average adjusted gross income)
| Here: | 6.94% |
| Wisconsin average: | 6.07% |
10 or fewer of this county's residents moved from foreign countries.
2.92% relocated from other counties in Wisconsin ($22,886 average AGI)
4.01% relocated from other states ($42,357 average AGI)
Polk County: 4.01% Wisconsin average: 2.19%

Top counties from which taxpayers relocated into this county between 2020 and 2021:
| from St. Croix County, WI | |
| from Ramsey County, MN | |
| from Washington County, MN | |
| from Barron County, WI | |
| from Hennepin County, MN | |
| from Chisago County, MN | |
| from Burnett County, WI |
5.75% of this county's 2020 resident taxpayers moved to other counties in 2021 ($56,575 average adjusted gross income)
| Here: | 5.75% |
| Wisconsin average: | 6.10% |
10 or fewer of this county's residents moved to foreign countries.
2.92% relocated to other counties in Wisconsin ($25,326 average AGI)
2.83% relocated to other states ($31,249 average AGI)
Polk County: 2.83% Wisconsin average: 2.22%
Top counties to which taxpayers relocated from this county between 2020 and 2021:
| to St. Croix County, WI | |
| to Barron County, WI | |
| to Burnett County, WI | |
| to Hennepin County, MN | |
| to Washington County, MN | |
| to Chisago County, MN | |
| to Ramsey County, MN |
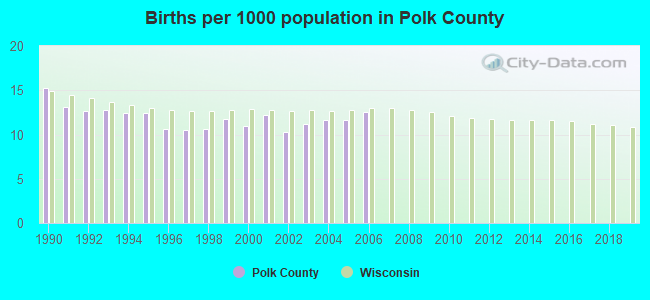
Births per 1000 population from 1990 to 1999: 12.2
Births per 1000 population from 2000 to 2006: 11.5
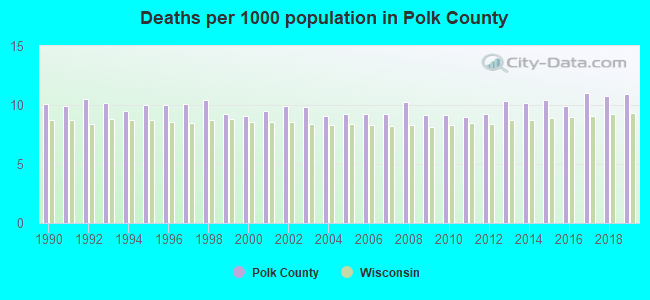
Deaths per 1000 population from 1990 to 1999: 10.0
Deaths per 1000 population from 2000 to 2009: 9.4
Deaths per 1000 population from 2010 to 2020: 10.2
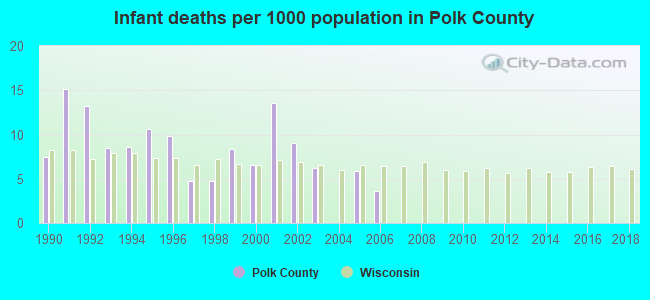
Infant deaths per 1000 live births from 1990 to 1999: 9.1
Infant deaths per 1000 live births from 2000 to 2006: 6.4
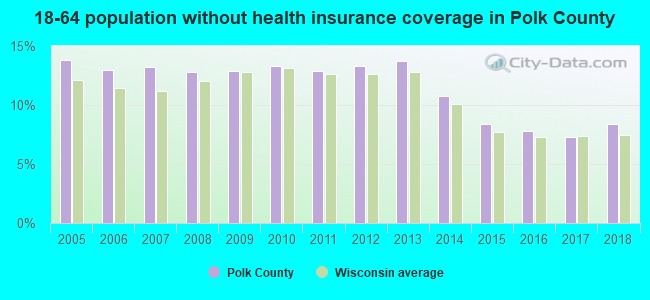
Persons under 19 years old without health insurance coverage in 2018: 4.6%
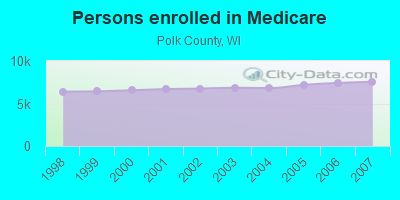
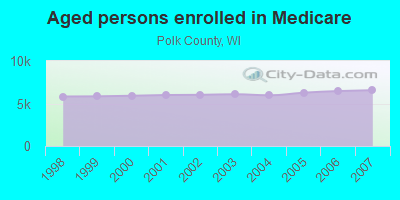
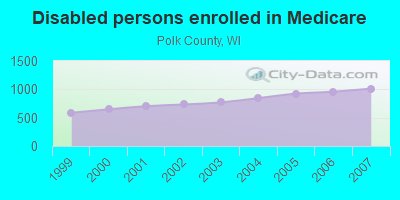
Persons enrolled in hospital insurance and/or supplemental medical insurance (Medicare) in July 1, 2007: 7,576 (6,564 aged, 1,012 disabled)
Children under 18 without health insurance coverage in 2007: 423 (4%)
Most common underlying causes of death in Polk County, Wisconsin in 1999 - 2019:
- Atherosclerotic heart disease (521)
- Bronchus or lung, unspecified - Malignant neoplasms (517)
- Acute myocardial infarction, unspecified (500)
- Unspecified dementia (367)
- Chronic obstructive pulmonary disease, unspecified (340)
- Alzheimer disease, unspecified (266)
- Stroke, not specified as haemorrhage or infarction (263)
- Congestive heart failure (109)
- Colon, unspecified - Malignant neoplasms (94)
- Pneumonia, unspecified (69)
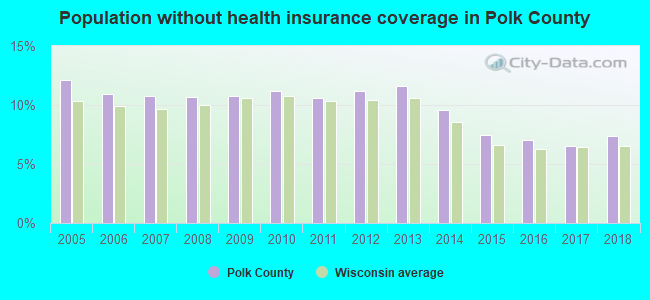
Population without health insurance coverage in 2000: 8%
Children under 18 without health insurance coverage in 2000: 6%
Short term general hospital admissions per 100,000 population in 2004: 9,267
Short term general hospital beds per 100,000 population in 2004: 212
Emergency room visits per 100,000 population in 2004: 26,931
General practice office based MDs per 100,000 population in 2005: 1,157
Medical specialist MDs per 100,000 population in 2005: 927
Dentists per 100,000 population in 1998: 5
Total births per 100,000 population, July 2005 - July 2006 : 41
Total deaths per 100,000 population, July 2005 - July 2006: 54
Limited-service eating places per 100,000 population in 2005 : 18
Suicides per 1,000,000 population from 2000 to 2006: 119.8. This is more than state average.
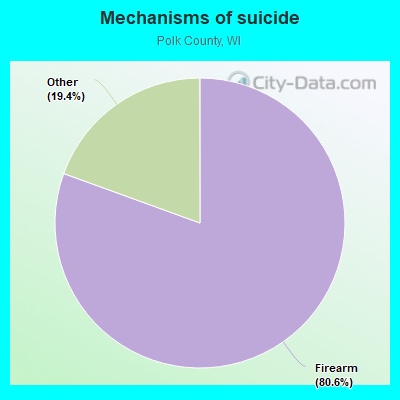
- Firearm - 96.5
- Other - 23.3
Household type by relationship:
Households: 45,207- Male householders: 9,573 (2,674 living alone), Female householders: 9,461 (2,511 living alone)
10,425 spouses (10,373 opposite-sex spouses), 1,525 unmarried partners, (1,521 opposite-sex unmarried partners), 11,467 children (10,602 natural, 236 adopted, 629 stepchildren), 459 grandchildren, 293 brothers or sisters, 399 parents, 22 foster children, 359 other relatives, 803 non-relatives
- In group quarters: 506
Size of family households: 7,135 2-persons, 2,306 3-persons, 1,905 4-persons, 899 5-persons, 316 6-persons, 168 7-or-more-persons.
Size of nonfamily households: 5,182 1-person, 961 2-persons, 65 3-persons, 35 4-persons, 7 6-persons, 10 7-or-more-persons.
6,099 married couples with children.
2,175 single-parent households (848 men, 1,327 women).
97.8% of residents of Polk speak English at home.
1.0% of residents speak Spanish at home (62% speak English very well, 21% speak English well, 17% speak English not well).
0.9% of residents speak other Indo-European language at home (80% speak English very well, 13% speak English well, 7% speak English not well).
0.3% of residents speak Asian or Pacific Island language at home (65% speak English very well, 28% speak English well, 7% speak English not well).
0.1% of residents speak other language at home (89% speak English very well, 7% speak English well, 4% speak English not well).
In fiscal year 2004:
Federal Government expenditure: $198,452,000 ($4,522 per capita)
Department of Defense expenditure: $12,432,000
Federal direct payments to individuals for retirement and disability: $98,033,000
Federal other direct payments to individuals: $37,863,000
Federal direct payments not to individuals: $5,713,000
Federal grants: $33,144,000
Federal procurement contracts: $15,378,000 ($9,773,000 Department of Defense)
Federal salaries and wages: $8,319,000 ($0,000 Department of Defense)
Federal Government direct loans: $2,275,000
Federal guaranteed/insured loans: $16,832,000
Federal Government insurance: $18,763,000
Population change from April 1, 2000 to July 1, 2005:
Births: 2,462| Here: | 56 per 1000 residents |
| State: | 65 per 1000 residents |
Deaths: 2,143
| Here: | 48 per 1000 residents |
| State: | 44 per 1000 residents |
Net international migration: +81
| Here: | +2 per 1000 residents |
| State: | +8 per 1000 residents |
Net internal migration: +2,651
| Here: | +60 per 1000 residents |
| State: | +3 per 1000 residents |
Total withdrawal of fresh water for public supply: 2.70 millions of gallons per day (all from ground)
| Here: | 6.4 |
| State: | 6.5 |
| Here: | 4.4 |
| State: | 4.1 |
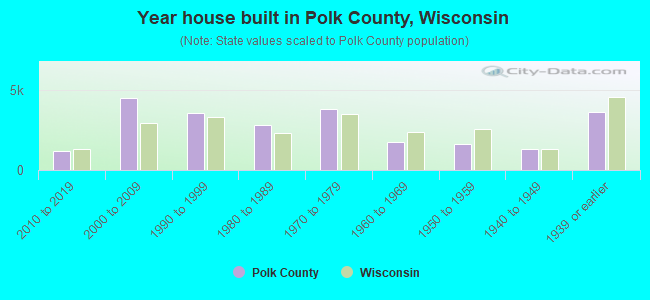
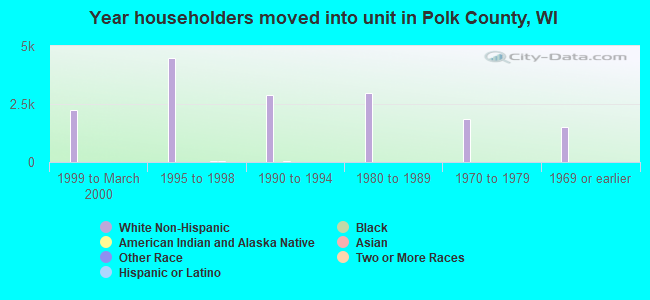
- Year house built in Polk County, Wisconsin
- 942020 or later
- 1,4112010 to 2019
- 4,4152000 to 2009
- 3,4481990 to 1999
- 2,8421980 to 1989
- 3,7401970 to 1979
- 1,7421960 to 1969
- 1,7451950 to 1959
- 1,1251940 to 1949
- 3,6801939 or earlier
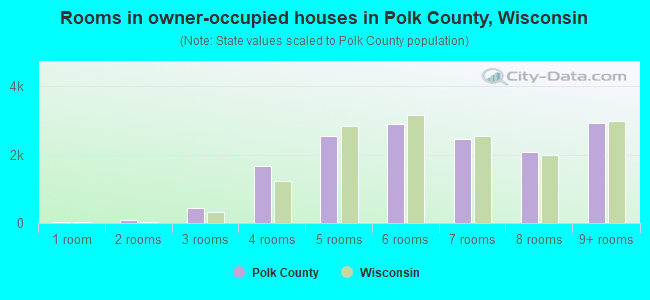
- Rooms in owner-occupied houses in Polk County, Wisconsin
- 591 room
- 1022 rooms
- 5183 rooms
- 1,9064 rooms
- 2,5105 rooms
- 3,0746 rooms
- 2,3697 rooms
- 1,9878 rooms
- 2,9499+ rooms
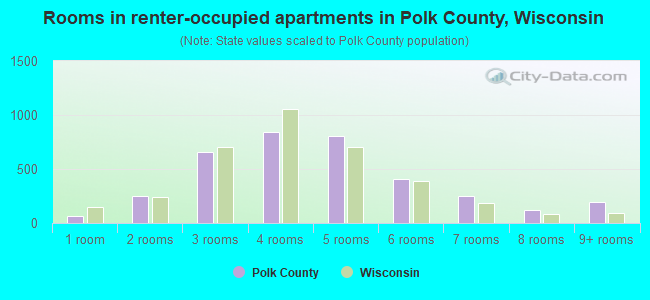
- Rooms in renter-occupied apartments in Polk County, Wisconsin
- 941 room
- 2152 rooms
- 7223 rooms
- 8084 rooms
- 8005 rooms
- 3906 rooms
- 2517 rooms
- 1528 rooms
- 2189+ rooms
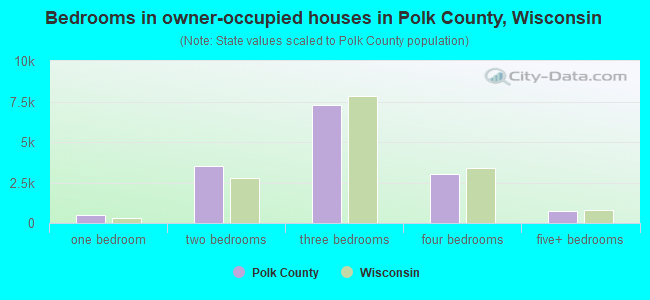
- Bedrooms in owner-occupied houses in Polk County, Wisconsin
- 74no bedroom
- 5121 bedroom
- 3,7372 bedrooms
- 7,2943 bedrooms
- 3,0354 bedrooms
- 7845+ bedrooms
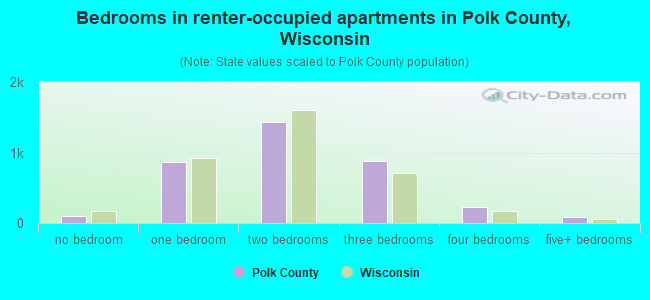
- Bedrooms in renter-occupied apartments in Polk County, Wisconsin
- 119no bedroom
- 8241 bedroom
- 1,5182 bedrooms
- 8473 bedrooms
- 2244 bedrooms
- 1045+ bedrooms
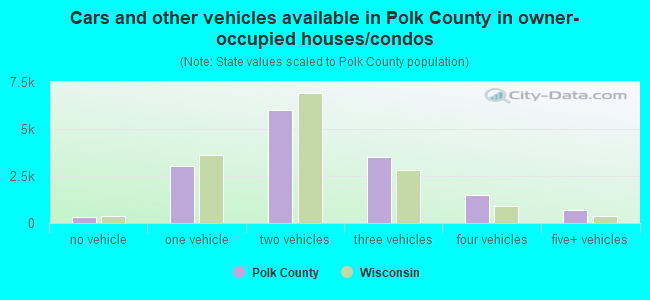
- Cars and other vehicles available in Polk County in owner-occupied houses/condos
- 289no vehicle
- 3,2581 vehicle
- 6,1972 vehicles
- 3,4153 vehicles
- 1,5454 vehicles
- 6555+ vehicles
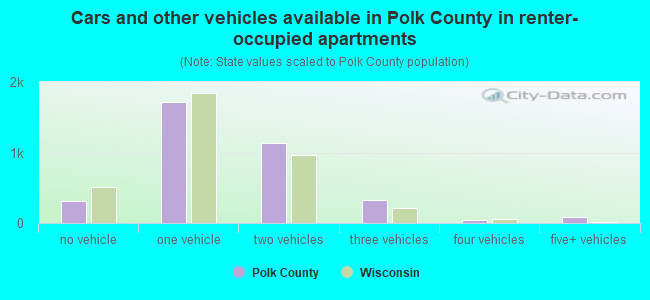
- Cars and other vehicles available in Polk County in renter-occupied apartments
- 340no vehicle
- 1,6341 vehicle
- 1,1482 vehicles
- 3653 vehicles
- 324 vehicles
- 1135+ vehicles
91.4% of Polk County residents lived in the same house 1 years ago.
Out of people who lived in different houses, 31% lived in this county.
Out of people who lived in different counties, 42% lived in Wisconsin.
| Polk County: | 91.4% |
| State average: | 87.7% |
Place of birth for U.S.-born residents:
- This state: 24,761
- Other state: 19,897
- Northeast: 581
- Midwest: 16,681
- South: 1,156
- West: 1,423
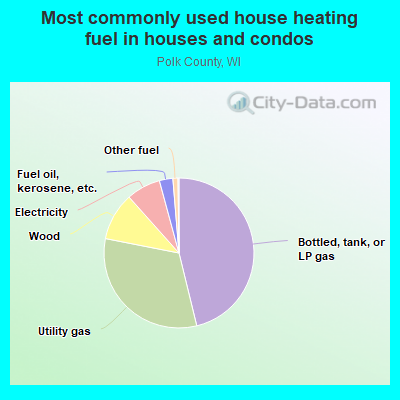
- 46.9%Bottled, tank, or LP gas
- 32.2%Utility gas
- 9.6%Wood
- 7.2%Electricity
- 2.9%Fuel oil, kerosene, etc.
- 1.0%Other fuel
- 0.2%No fuel used
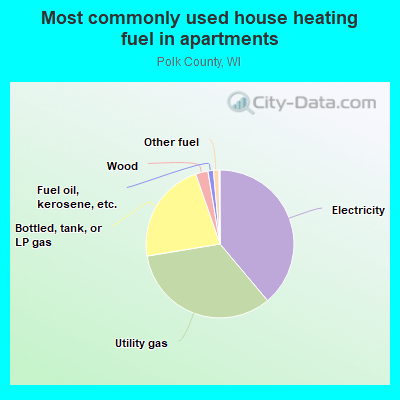
- 37.8%Electricity
- 33.3%Utility gas
- 22.1%Bottled, tank, or LP gas
- 2.4%Wood
- 2.1%Other fuel
- 1.4%Fuel oil, kerosene, etc.
- 0.8%No fuel used
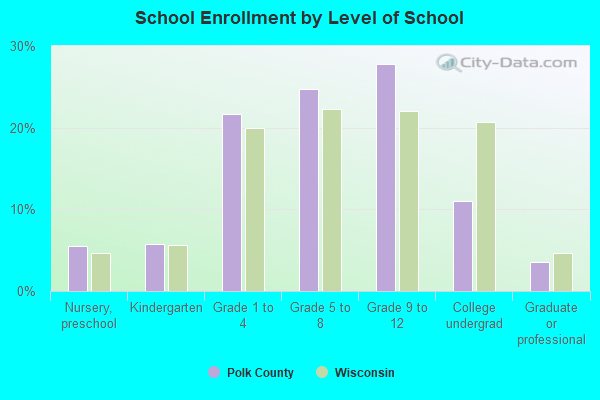
Private vs. public school enrollment:
| Here: | 12.6% |
| Wisconsin: | 16.7% |
| Here: | 9.0% |
| Wisconsin: | 12.5% |
| Here: | 18.0% |
| Wisconsin: | 17.5% |
Polk County government finances - Expenditure in 2017:
- Charges - Other: $9,935,000
Other: $8,772,000
Solid Waste Management: $273,000
Natural Resources - Other: $222,000
Solid Waste Management: $208,000
Natural Resources - Other: $177,000
Parks and Recreation: $22,000
Parks and Recreation: $14,000
- Construction - Regular Highways: $4,112,000
Regular Highways: $3,667,000
- Current Operations - Regular Highways: $9,649,000
Regular Highways: $8,957,000
Public Welfare Institutions: $8,132,000
Public Welfare Institutions: $7,238,000
Health - Other: $6,481,000
Police Protection: $5,923,000
Police Protection: $5,762,000
Hospitals: $5,732,000
Public Welfare - Other: $4,037,000
Hospitals: $3,683,000
Correctional Institutions: $3,191,000
General - Other: $2,932,000
Correctional Institutions: $2,831,000
Public Welfare - Other: $2,663,000
General - Other: $2,582,000
Health - Other: $2,333,000
Judicial and Legal Services: $2,322,000
Central Staff Services: $2,269,000
Central Staff Services: $2,256,000
Judicial and Legal Services: $1,956,000
Natural Resources - Other: $1,745,000
Natural Resources - Other: $1,638,000
Solid Waste Management: $1,384,000
General Public Buildings: $1,047,000
General Public Buildings: $938,000
Financial Administration: $912,000
Libraries: $882,000
Libraries: $671,000
Financial Administration: $601,000
Solid Waste Management: $585,000
Parks and Recreation: $338,000
Parks and Recreation: $274,000
Elementary and Secondary Education: $243,000
Elementary and Secondary Education: $226,000
- Federal Intergovernmental - Other: $49,000
Other: $42,000
- General - Interest on Debt: $536,000
Interest on Debt: $365,000
- Local Intergovernmental - Highways: $893,000
Highways: $766,000
Other: $641,000
Other: $367,000
Health and Hospitals: $1,000
- Long Term Debt - Beginning Outstanding - Unspecified Public Purpose: $14,764,000
Outstanding Unspecified Public Purpose: $12,306,000
Beginning Outstanding - Unspecified Public Purpose: $11,330,000
Outstanding Unspecified Public Purpose: $8,710,000
Retired Unspecified Public Purpose: $2,620,000
Retired Unspecified Public Purpose: $2,458,000
- Miscellaneous - Interest Earnings: $496,000
Rents: $301,000
Rents: $282,000
General Revenue - Other: $182,000
General Revenue - Other: $143,000
Fines and Forfeits: $132,000
Fines and Forfeits: $111,000
Sale of Property: $64,000
Sale of Property: $38,000
Donations From Private Sources: $9,000
Interest Earnings: $0
- Other Capital Outlay - Police Protection: $195,000
Police Protection: $186,000
- State Intergovernmental - Highways: $9,001,000
Highways: $8,739,000
Public Welfare: $6,093,000
Public Welfare: $4,559,000
Health and Hospitals: $4,510,000
Health and Hospitals: $2,049,000
Other: $1,386,000
General Local Government Support: $1,215,000
Other: $1,193,000
General Local Government Support: $1,138,000
Education: $964,000
Education: $812,000
Transit Utilities: $7,000
- Tax - Property: $22,545,000
Property: $21,810,000
General Sales and Gross Receipts: $3,785,000
General Sales and Gross Receipts: $3,095,000
Other License: $389,000
Other License: $353,000
Documentary and Stock Transfer: $161,000
Documentary and Stock Transfer: $138,000
Occupation and Business License - Other: $24,000
Occupation and Business License - Other: $20,000
Other: $15,000
Polk County government finances - Revenue in 2017:
- Charges - Other: $9,935,000
Other: $8,772,000
Solid Waste Management: $273,000
Natural Resources - Other: $222,000
Solid Waste Management: $208,000
Natural Resources - Other: $177,000
Parks and Recreation: $22,000
Parks and Recreation: $14,000
- Construction - Regular Highways: $4,112,000
Regular Highways: $3,667,000
- Current Operations - Regular Highways: $9,649,000
Regular Highways: $8,957,000
Public Welfare Institutions: $8,132,000
Public Welfare Institutions: $7,238,000
Health - Other: $6,481,000
Police Protection: $5,923,000
Police Protection: $5,762,000
Hospitals: $5,732,000
Public Welfare - Other: $4,037,000
Hospitals: $3,683,000
Correctional Institutions: $3,191,000
General - Other: $2,932,000
Correctional Institutions: $2,831,000
Public Welfare - Other: $2,663,000
General - Other: $2,582,000
Health - Other: $2,333,000
Judicial and Legal Services: $2,322,000
Central Staff Services: $2,269,000
Central Staff Services: $2,256,000
Judicial and Legal Services: $1,956,000
Natural Resources - Other: $1,745,000
Natural Resources - Other: $1,638,000
Solid Waste Management: $1,384,000
General Public Buildings: $1,047,000
General Public Buildings: $938,000
Financial Administration: $912,000
Libraries: $882,000
Libraries: $671,000
Financial Administration: $601,000
Solid Waste Management: $585,000
Parks and Recreation: $338,000
Parks and Recreation: $274,000
Elementary and Secondary Education: $243,000
Elementary and Secondary Education: $226,000
- Federal Intergovernmental - Other: $49,000
Other: $42,000
- General - Interest on Debt: $536,000
Interest on Debt: $365,000
- Local Intergovernmental - Highways: $893,000
Highways: $766,000
Other: $641,000
Other: $367,000
Health and Hospitals: $1,000
- Long Term Debt - Beginning Outstanding - Unspecified Public Purpose: $14,764,000
Outstanding Unspecified Public Purpose: $12,306,000
Beginning Outstanding - Unspecified Public Purpose: $11,330,000
Outstanding Unspecified Public Purpose: $8,710,000
Retired Unspecified Public Purpose: $2,620,000
Retired Unspecified Public Purpose: $2,458,000
- Miscellaneous - Interest Earnings: $496,000
Rents: $301,000
Rents: $282,000
General Revenue - Other: $182,000
General Revenue - Other: $143,000
Fines and Forfeits: $132,000
Fines and Forfeits: $111,000
Sale of Property: $64,000
Sale of Property: $38,000
Donations From Private Sources: $9,000
Interest Earnings: $0
- Other Capital Outlay - Police Protection: $195,000
Police Protection: $186,000
- State Intergovernmental - Highways: $9,001,000
Highways: $8,739,000
Public Welfare: $6,093,000
Public Welfare: $4,559,000
Health and Hospitals: $4,510,000
Health and Hospitals: $2,049,000
Other: $1,386,000
General Local Government Support: $1,215,000
Other: $1,193,000
General Local Government Support: $1,138,000
Education: $964,000
Education: $812,000
Transit Utilities: $7,000
- Tax - Property: $22,545,000
Property: $21,810,000
General Sales and Gross Receipts: $3,785,000
General Sales and Gross Receipts: $3,095,000
Other License: $389,000
Other License: $353,000
Documentary and Stock Transfer: $161,000
Documentary and Stock Transfer: $138,000
Occupation and Business License - Other: $24,000
Occupation and Business License - Other: $20,000
Other: $15,000
Polk County government finances - Debt in 2017:
- Charges - Other: $9,935,000
Other: $8,772,000
Solid Waste Management: $273,000
Natural Resources - Other: $222,000
Solid Waste Management: $208,000
Natural Resources - Other: $177,000
Parks and Recreation: $22,000
Parks and Recreation: $14,000
- Construction - Regular Highways: $4,112,000
Regular Highways: $3,667,000
- Current Operations - Regular Highways: $9,649,000
Regular Highways: $8,957,000
Public Welfare Institutions: $8,132,000
Public Welfare Institutions: $7,238,000
Health - Other: $6,481,000
Police Protection: $5,923,000
Police Protection: $5,762,000
Hospitals: $5,732,000
Public Welfare - Other: $4,037,000
Hospitals: $3,683,000
Correctional Institutions: $3,191,000
General - Other: $2,932,000
Correctional Institutions: $2,831,000
Public Welfare - Other: $2,663,000
General - Other: $2,582,000
Health - Other: $2,333,000
Judicial and Legal Services: $2,322,000
Central Staff Services: $2,269,000
Central Staff Services: $2,256,000
Judicial and Legal Services: $1,956,000
Natural Resources - Other: $1,745,000
Natural Resources - Other: $1,638,000
Solid Waste Management: $1,384,000
General Public Buildings: $1,047,000
General Public Buildings: $938,000
Financial Administration: $912,000
Libraries: $882,000
Libraries: $671,000
Financial Administration: $601,000
Solid Waste Management: $585,000
Parks and Recreation: $338,000
Parks and Recreation: $274,000
Elementary and Secondary Education: $243,000
Elementary and Secondary Education: $226,000
- Federal Intergovernmental - Other: $49,000
Other: $42,000
- General - Interest on Debt: $536,000
Interest on Debt: $365,000
- Local Intergovernmental - Highways: $893,000
Highways: $766,000
Other: $641,000
Other: $367,000
Health and Hospitals: $1,000
- Long Term Debt - Beginning Outstanding - Unspecified Public Purpose: $14,764,000
Outstanding Unspecified Public Purpose: $12,306,000
Beginning Outstanding - Unspecified Public Purpose: $11,330,000
Outstanding Unspecified Public Purpose: $8,710,000
Retired Unspecified Public Purpose: $2,620,000
Retired Unspecified Public Purpose: $2,458,000
- Miscellaneous - Interest Earnings: $496,000
Rents: $301,000
Rents: $282,000
General Revenue - Other: $182,000
General Revenue - Other: $143,000
Fines and Forfeits: $132,000
Fines and Forfeits: $111,000
Sale of Property: $64,000
Sale of Property: $38,000
Donations From Private Sources: $9,000
Interest Earnings: $0
- Other Capital Outlay - Police Protection: $195,000
Police Protection: $186,000
- State Intergovernmental - Highways: $9,001,000
Highways: $8,739,000
Public Welfare: $6,093,000
Public Welfare: $4,559,000
Health and Hospitals: $4,510,000
Health and Hospitals: $2,049,000
Other: $1,386,000
General Local Government Support: $1,215,000
Other: $1,193,000
General Local Government Support: $1,138,000
Education: $964,000
Education: $812,000
Transit Utilities: $7,000
- Tax - Property: $22,545,000
Property: $21,810,000
General Sales and Gross Receipts: $3,785,000
General Sales and Gross Receipts: $3,095,000
Other License: $389,000
Other License: $353,000
Documentary and Stock Transfer: $161,000
Documentary and Stock Transfer: $138,000
Occupation and Business License - Other: $24,000
Occupation and Business License - Other: $20,000
Other: $15,000
Polk County government finances - Cash and Securities in 2017:
- Charges - Other: $9,935,000
Other: $8,772,000
Solid Waste Management: $273,000
Natural Resources - Other: $222,000
Solid Waste Management: $208,000
Natural Resources - Other: $177,000
Parks and Recreation: $22,000
Parks and Recreation: $14,000
- Construction - Regular Highways: $4,112,000
Regular Highways: $3,667,000
- Current Operations - Regular Highways: $9,649,000
Regular Highways: $8,957,000
Public Welfare Institutions: $8,132,000
Public Welfare Institutions: $7,238,000
Health - Other: $6,481,000
Police Protection: $5,923,000
Police Protection: $5,762,000
Hospitals: $5,732,000
Public Welfare - Other: $4,037,000
Hospitals: $3,683,000
Correctional Institutions: $3,191,000
General - Other: $2,932,000
Correctional Institutions: $2,831,000
Public Welfare - Other: $2,663,000
General - Other: $2,582,000
Health - Other: $2,333,000
Judicial and Legal Services: $2,322,000
Central Staff Services: $2,269,000
Central Staff Services: $2,256,000
Judicial and Legal Services: $1,956,000
Natural Resources - Other: $1,745,000
Natural Resources - Other: $1,638,000
Solid Waste Management: $1,384,000
General Public Buildings: $1,047,000
General Public Buildings: $938,000
Financial Administration: $912,000
Libraries: $882,000
Libraries: $671,000
Financial Administration: $601,000
Solid Waste Management: $585,000
Parks and Recreation: $338,000
Parks and Recreation: $274,000
Elementary and Secondary Education: $243,000
Elementary and Secondary Education: $226,000
- Federal Intergovernmental - Other: $49,000
Other: $42,000
- General - Interest on Debt: $536,000
Interest on Debt: $365,000
- Local Intergovernmental - Highways: $893,000
Highways: $766,000
Other: $641,000
Other: $367,000
Health and Hospitals: $1,000
- Long Term Debt - Beginning Outstanding - Unspecified Public Purpose: $14,764,000
Outstanding Unspecified Public Purpose: $12,306,000
Beginning Outstanding - Unspecified Public Purpose: $11,330,000
Outstanding Unspecified Public Purpose: $8,710,000
Retired Unspecified Public Purpose: $2,620,000
Retired Unspecified Public Purpose: $2,458,000
- Miscellaneous - Interest Earnings: $496,000
Rents: $301,000
Rents: $282,000
General Revenue - Other: $182,000
General Revenue - Other: $143,000
Fines and Forfeits: $132,000
Fines and Forfeits: $111,000
Sale of Property: $64,000
Sale of Property: $38,000
Donations From Private Sources: $9,000
Interest Earnings: $0
- Other Capital Outlay - Police Protection: $195,000
Police Protection: $186,000
- State Intergovernmental - Highways: $9,001,000
Highways: $8,739,000
Public Welfare: $6,093,000
Public Welfare: $4,559,000
Health and Hospitals: $4,510,000
Health and Hospitals: $2,049,000
Other: $1,386,000
General Local Government Support: $1,215,000
Other: $1,193,000
General Local Government Support: $1,138,000
Education: $964,000
Education: $812,000
Transit Utilities: $7,000
- Tax - Property: $22,545,000
Property: $21,810,000
General Sales and Gross Receipts: $3,785,000
General Sales and Gross Receipts: $3,095,000
Other License: $389,000
Other License: $353,000
Documentary and Stock Transfer: $161,000
Documentary and Stock Transfer: $138,000
Occupation and Business License - Other: $24,000
Occupation and Business License - Other: $20,000
Other: $15,000
Supplemental Security Income (SSI) in 2006:
- Total number of recipients: 476
- Number of aged recipients: 60
- Number of blind and disabled recipients: 416
- Number of recipients under 18: 61
- Number of recipients between 18 and 64: 322
- Number of recipients older than 64: 93
- Number of recipients also receiving OASDI: 221
- Amount of payments (thousands of dollars): 179
| Most common first names in Polk County, WI among deceased individuals | ||
| Name | Count | Lived (average) |
|---|---|---|
| John | 287 | 76.4 years |
| William | 173 | 78.6 years |
| Robert | 168 | 72.6 years |
| Mary | 151 | 83.0 years |
| George | 131 | 79.3 years |
| Carl | 121 | 79.6 years |
| Donald | 114 | 70.9 years |
| Henry | 112 | 81.8 years |
| Arthur | 110 | 79.0 years |
| Helen | 106 | 81.5 years |
| Most common last names in Polk County, WI among deceased individuals | ||
| Last name | Count | Lived (average) |
|---|---|---|
| Johnson | 416 | 79.7 years |
| Anderson | 295 | 78.8 years |
| Peterson | 224 | 79.5 years |
| Nelson | 190 | 78.6 years |
| Olson | 176 | 81.0 years |
| Jensen | 116 | 79.7 years |
| Carlson | 115 | 78.9 years |
| Larson | 97 | 75.8 years |
| Hansen | 85 | 80.7 years |
| Erickson | 72 | 79.6 years |
| Businesses in Polk County, WI | ||||
| Name | Count | Name | Count | |
|---|---|---|---|---|
| Ace Hardware | 1 | MasterBrand Cabinets | 4 | |
| Alco Stores | 1 | McDonald's | 1 | |
| Chevrolet | 3 | Menards | 1 | |
| DHL | 1 | RadioShack | 3 | |
| Dairy Queen | 3 | Sears | 1 | |
| FedEx | 3 | Slumberland | 2 | |
| H&R Block | 2 | Subway | 5 | |
| Hardee's | 1 | T-Mobile | 1 | |
| Jimmy John's | 2 | True Value | 2 | |
| Jones New York | 1 | U-Haul | 2 | |
| KFC | 1 | UPS | 3 | |
| La-Z-Boy | 3 | Walmart | 1 | |
| Lane Furniture | 2 | YMCA | 1 | |