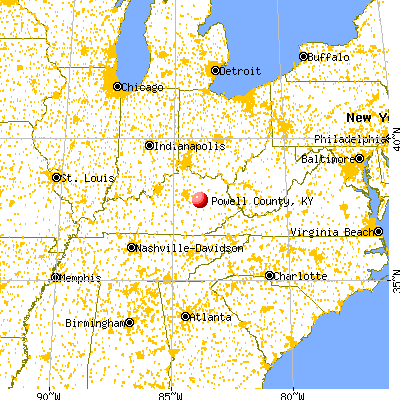
Powell County, Kentucky (KY)
County owner-occupied free and clear houses and condos in 2010: 1,485
County owner-occupied houses and condos in 2000: 3,734
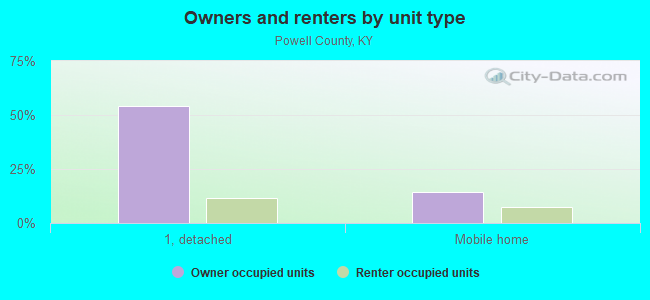
Renter-occupied apartments: 1,345 (it was 1,310 in 2000)
| % of renters here: | 26% |
| State: | 31% |
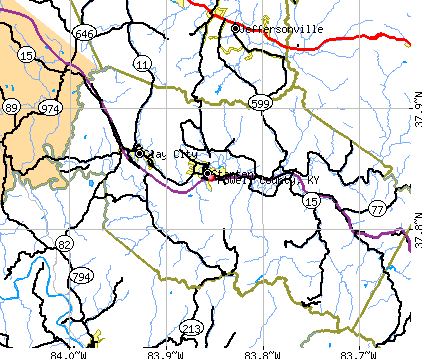
Land area: 180 sq. mi.
Water area: 0.1 sq. mi.
Population density: 73 people per square mile (average).
Industries providing employment: Educational, health and social services (17.1%), Manufacturing (17.1%), Retail trade (13.7%), Transportation and warehousing,and utilities (10.5%).
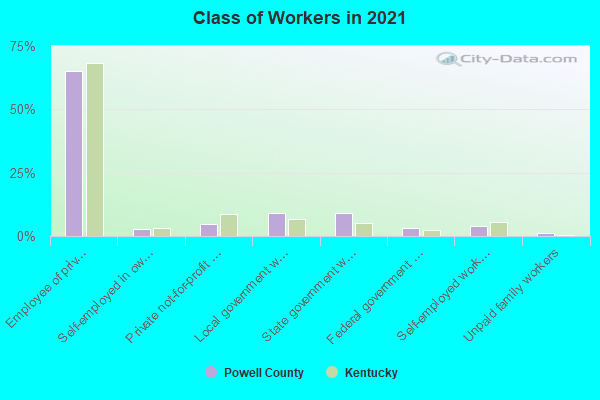
Type of workers:
- Private wage or salary: 75%
- Government: 19%
- Self-employed, not incorporated: 6%
- Unpaid family work: 1%
- OSM Map
- General Map
- Google Map
- MSN Map

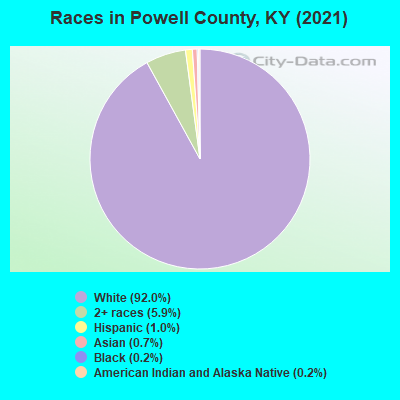
- 12,23693.1%White Non-Hispanic Alone
- 5444.1%Two or more races
- 2692.0%Hispanic or Latino
- 330.3%Black Non-Hispanic Alone
- 330.3%Some other race alone
- 250.2%American Indian and Alaska Native alone
| Median resident age: | 39.8 years |
| Kentucky median age: | 39.4 years |
| Males: 6,655 | |
| Females: 6,461 |

 | WARN act notices Ky Public records for layoff /plant closure (1 reply) |
| Memories of the Red River (2 replies) |
| Weekend Trip to Kentucky (10 replies) |
| Where are you from? (78 replies) |
| Some info on various towns (14 replies) |
| Areas near Mt. Sterling - schools? (1 reply) |
| Powell County: | 2.0 people |
| Kentucky: | 2 people |
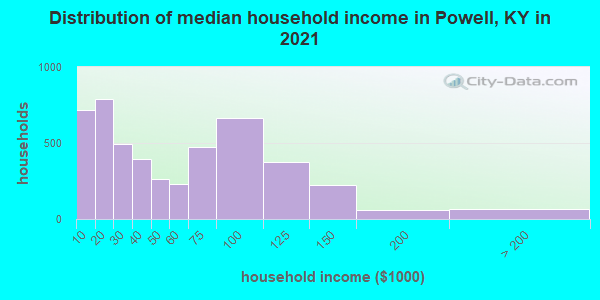
Estimated median household income in 2022: $37,877 ($25,515 in 1999)
| This county: | $37,877 |
| Kentucky: | $59,341 |
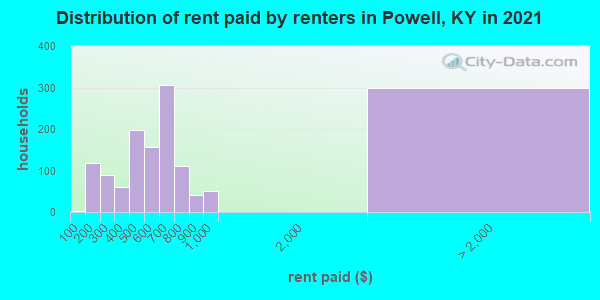
Median contract rent in 2022 for apartments: $498 (lower quartile is $377, upper quartile is $686)
| This county: | $498 |
| State: | $702 |
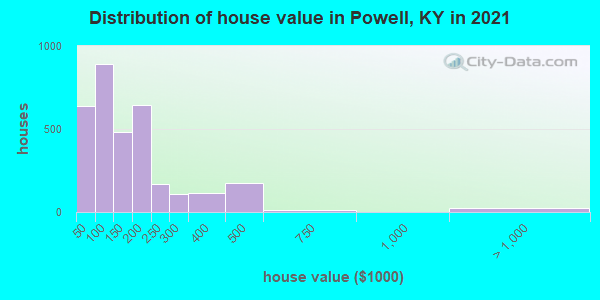
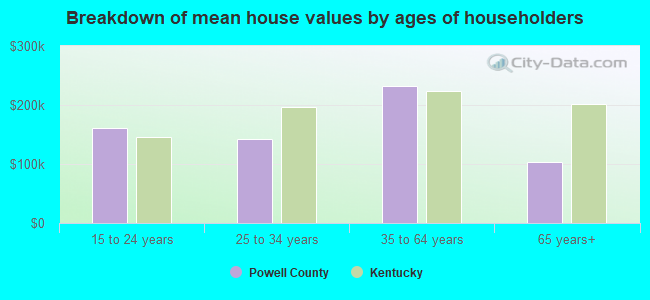
Estimated median house or condo value in 2022: $136,855 (it was $53,800 in 2000)
| Powell: | $136,855 |
| Kentucky: | $196,300 |
Median monthly housing costs for homes and condos with a mortgage: $977
Median monthly housing costs for units without a mortgage: $337
Institutionalized population: 185
Crime in 2021 (reported by the sheriff's office or county police, not the county total):
- Murders: 0
- Rapes: 0
- Robberies: 0
- Assaults: 0
- Burglaries: 1
- Thefts: 1
- Auto thefts: 2
Crime in 2020 (reported by the sheriff's office or county police, not the county total):
- Murders: 0
- Rapes: 0
- Robberies: 0
- Assaults: 0
- Burglaries: 3
- Thefts: 9
- Auto thefts: 6
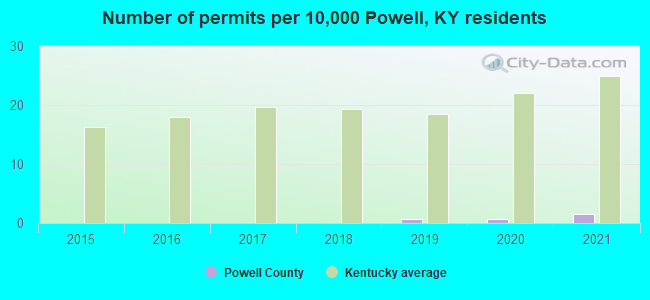
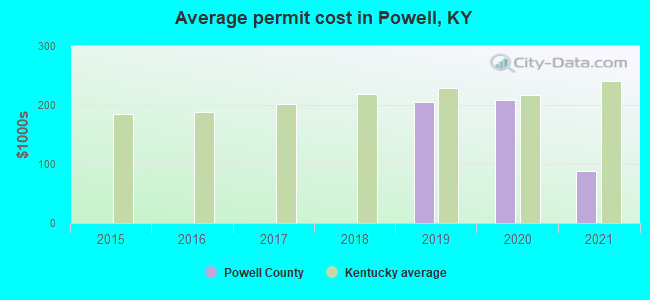
Single-family new house construction building permits:
- 2022: 2 buildings, average cost: $87,500
- 2021: 2 buildings, average cost: $87,500
- 2020: 1 building, cost: $209,100
- 2019: 1 building, cost: $204,900
- 2018: 0 buildings
- 2017: 0 buildings
- 2016: 0 buildings
- 2015: 0 buildings
Median real estate property taxes paid for housing units with mortgages in 2022: $920 (0.6%)
Median real estate property taxes paid for housing units with no mortgage in 2022: $637 (0.5%)
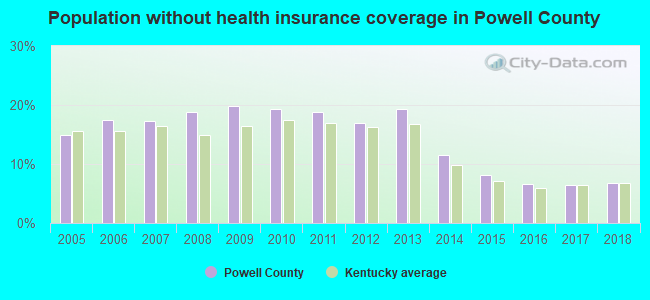
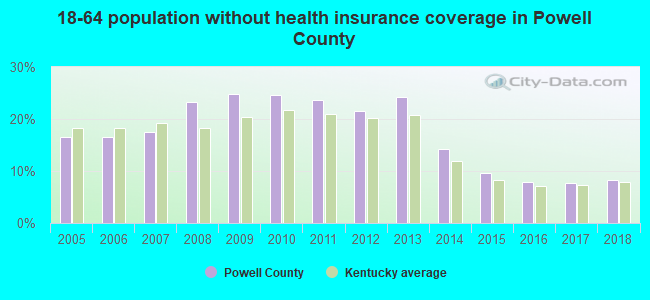
| Powell County: | 21.6% |
| Kentucky: | 16.5% |
Median age of residents in 2022: 39.8 years old
(Males: 40.1 years old, Females: 39.6 years old)
(Median age for: White residents: 40.1 years old, Black residents: 46.3 years old, Hispanic or Latino residents: 14.9 years old, Other race residents: 14.9 years old)
Fair market rent in 2006 for a 1-bedroom apartment in Powell County is $411 a month.
Fair market rent for a 2-bedroom apartment is $503 a month.
Fair market rent for a 3-bedroom apartment is $602 a month.
Notable locations in this county outside city limits:
Notable locations in Powell County: Ellis-Smeathere Ferry (A), Shorts Station (B), Haynes Station (C), Windridge Country Club (D), Owensboro Speedway (E), Moose Lake View Country Club (F), Fair Forest Camp (G), Daviess County Fire Department Yelvington (H), Daviess County Fire Department Thruston Philpot 1 (I), Daviess County Fire Department Masonville 2 (J), Daviess County Fire Department Sorgho (K), Daviess County Fire Department Mosleyville (L), Mount Saint Joseph Conference and Retreat Center (M), Daviess County Fire Department Airport Station (N), Daviess County Fire Department East Station (O), Daviess County Fire Department Utica (P), Daviess County Fire Department Saint Joseph (Q), Daviess County Fire Department Knottsville (R), Daviess County Fire Department Thruston Philpot 2 (S), Daviess County Fire Department Stanley (T). Display/hide their locations on the map
Churches in Powell County include: Friendly Grove Church (A), Friendship Church (B), Glenville Church (C), Greenbrier Church (D), Hopewell Church (E), Karns Grove Church (F), Little Flock Church (G), Macedonia Church (H), Mount Pleasant Cumberland Presbyterian Church (I). Display/hide their locations on the map
Cemeteries: McCain Cemetery (1), Travis Cemetery (2), Bryant Cemetery (3), Webber Cemetery (4), Pleasant Valley Cemetery (5), White Chapel Memorial Gardens (6), Cates Cemetery (7). Display/hide their locations on the map
Lakes and reservoirs: Miller Lake (A), Carpenters Lake (B), Kingfisher Lakes (C), Fish and Game Farm Lake (D), Windy Hollow Lakes (E). Display/hide their locations on the map
Streams, rivers, and creeks: Blackford Creek (A), Delaware Creek (B), Yellow Creek (C), Crooked Creek (D), Crane Pond Slough (E), VanBuren Creek (F), Cowhide Slough (G), Twomile Creek (H), Cash Creek (I). Display/hide their locations on the map
Neighboring counties: Caroline County, Virginia  , Raleigh County, West Virginia , Johnson County , Powhatan County, Virginia , Stanton County, Kansas
  , Washington County, Missouri .
| Here: | 4.0% |
| Kentucky: | 3.8% |
Current college students: 196
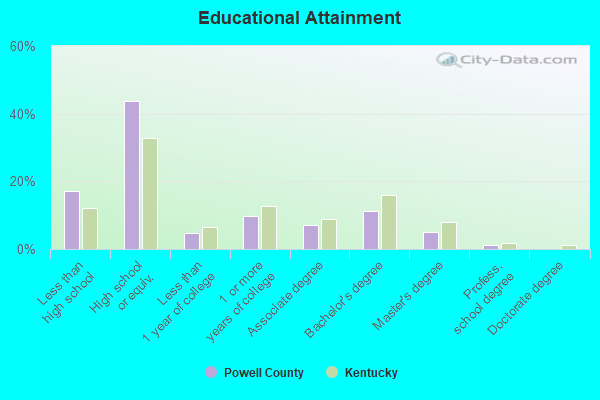
People 25 years of age or older with a high school degree or higher: 81.9%
People 25 years of age or older with a bachelor's degree or higher: 15.1%
Number of foreign born residents: 52 (105.1% naturalized citizens)
| Powell County: | 0.4% |
| Whole state: | 4.0% |
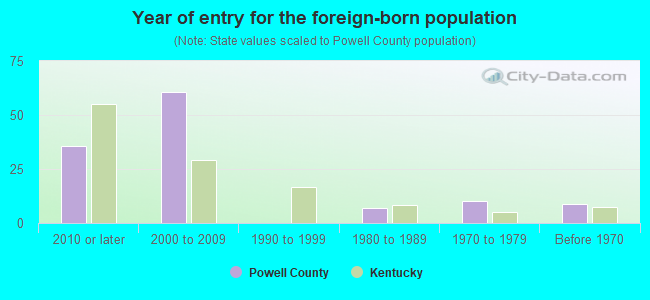
- Year of entry for the foreign-born population
- 02010 or later
- 442000 to 2009
- 01990 to 1999
- 71980 to 1989
- 101970 to 1979
- 9Before 1970
Mean travel time to work (commute): minutes
Percentage of county residents living and working in this county: 98.7%
Housing units in structures:
- One, detached: 3,636
- One, attached: 18
- Two: 76
- 3 or 4: 151
- 5 to 9: 255
- 10 to 19: 84
- 20 to 49: 16
- 50 or more: 18
- Mobile homes: 1,355
- Boats, RVs, vans, etc.: 56
Housing units in Powell County with a mortgage: 1,637 (68 second mortgage, 0 home equity loan, 64 both second mortgage and home equity loan)
Houses without a mortgage: 0
| Here: | 100.0% with mortgage |
| State: | 96.8% with mortgage |
Religion statistics for Powell County
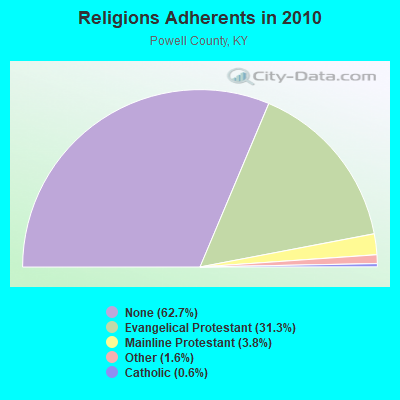
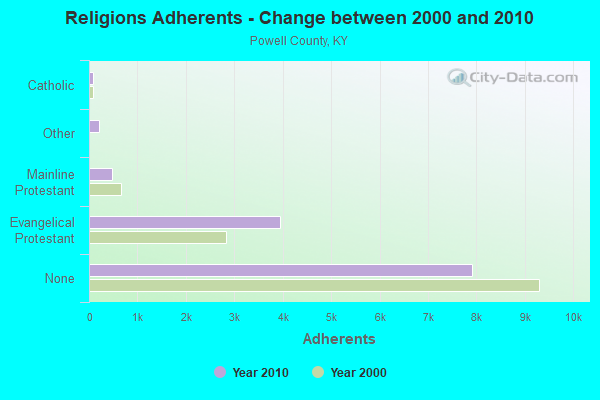
| Religion | Adherents | Congregations |
|---|---|---|
| Evangelical Protestant | 3,951 | 24 |
| Mainline Protestant | 479 | 4 |
| Other | 200 | 1 |
| Catholic | 78 | 1 |
| None | 7,905 | - |
Source: Clifford Grammich, Kirk Hadaway, Richard Houseal, Dale E.Jones, Alexei Krindatch, Richie Stanley and Richard H.Taylor. 2012. 2010 U.S.Religion Census: Religious Congregations & Membership Study. Association of Statisticians of American Religious Bodies. Jones, Dale E., et al. 2002. Congregations and Membership in the United States 2000. Nashville, TN: Glenmary Research Center.
Food Environment Statistics:
| Powell County: | 1.45 / 10,000 pop. |
| State: | 2.19 / 10,000 pop. |
| Powell County: | 10.14 / 10,000 pop. |
| Kentucky: | 4.36 / 10,000 pop. |
| This county: | 2.90 / 10,000 pop. |
| State: | 5.74 / 10,000 pop. |
| Powell County: | 12.5% |
| Kentucky: | 11.0% |
| Powell County: | 34.2% |
| State: | 30.0% |
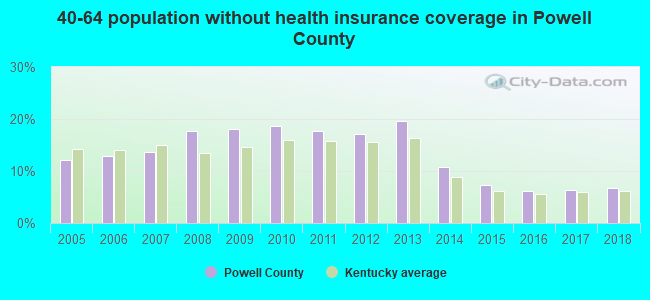
| Here: | 19.0% |
| State: | 15.9% |
Agriculture in Powell County:
Average size of farms: 157 acresAverage value of agricultural products sold per farm: $10,394
Average value of crops sold per acre for harvested cropland: $165.39
The value of livestock, poultry, and their products as a percentage of the total market value of agricultural products sold: 40.81%
Average total farm production expenses per farm: $10,084
Harvested cropland as a percentage of land in farms: 23.70%
Irrigated harvested cropland as a percentage of land in farms: 0.12%
Average market value of all machinery and equipment per farm: $25,442
The percentage of farms operated by a family or individual: 92.47%
Average age of principal farm operators: 55 years
Average number of cattle and calves per 100 acres of all land in farms: 6.70
Milk cows as a percentage of all cattle and calves: 0.32%
Corn for grain: 111 harvested acres
Soybeans for beans: 4031 harvested acres
Vegetables: 9 harvested acres
Tornado activity:
Powell County historical area-adjusted tornado activity is significantly below Kentucky state average. It is 686417.7 times below overall U.S. average.Tornadoes in this county have caused 32 injuries recorded between 1950 and 2004.
On 1/3/2000, a category 3 (max. wind speeds 158-206 mph) tornado injured 18 people and caused $64 million in damages.
Earthquake activity:
Powell County-area historical earthquake activity is significantly above Kentucky state average. It is 54% greater than the overall U.S. average.On 7/27/1980 at 18:52:21, a magnitude 5.2 (5.1 MB, 4.7 MS, 5.0 UK, 5.2 UK, Class: Moderate, Intensity: VI - VII) earthquake occurred 25.6 miles away from Powell County center
On 9/7/1988 at 02:28:09, a magnitude 4.6 (4.5 MB, 4.6 LG, Class: Light, Intensity: IV - V) earthquake occurred 20.9 miles away from the county center
On 4/18/2008 at 09:36:59, a magnitude 5.4 (5.1 MB, 4.8 MS, 5.4 MW, 5.2 MW) earthquake occurred 223.4 miles away from the county center
On 8/9/2020 at 12:07:37, a magnitude 5.1 (5.1 MW, Depth: 4.7 mi) earthquake occurred 179.1 miles away from the county center
On 8/23/2011 at 17:51:04, a magnitude 5.8 (5.8 MW, Depth: 3.7 mi) earthquake occurred 323.0 miles away from Powell County center
On 4/18/2008 at 09:36:59, a magnitude 5.2 (5.2 MW, Depth: 8.9 mi) earthquake occurred 223.4 miles away from the county center
Magnitude types: regional Lg-wave magnitude (LG), body-wave magnitude (MB), surface-wave magnitude (MS), moment magnitude (MW)
Most recent natural disasters:
- Kentucky Severe Storms, Flooding, Landslides, And Mudslides, Incident Period: February 3, 2020 - February 29, 2020, Major Disaster (Presidential) Declared DR-4540-KY: April 24, 2020, FEMA Id: 4540, Natural disaster type: Storm, Mudslide, Landslide, Flood
- Kentucky Covid-19 Pandemic, Incident Period: January 20, 2020, FEMA Id: 4497, Natural disaster type: Other
- Kentucky Severe Storms, Straight-line Winds, Flooding, Landslides, And Mudslides, Incident Period: February 6, 2019 - March 10, 2019, FEMA Id: 4428, Natural disaster type: Storm, Mudslide, Landslide, Flood, Wind
- Kentucky Severe Storms, Flooding, Landslides, And Mudslides, Incident Period: February 9, 2018 - February 14, 2018, FEMA Id: 4358, Natural disaster type: Storm, Mudslide, Landslide, Flood
- Kentucky Severe Winter Storm, Snowstorm, Flooding, Landslides, and Mudslides, Incident Period: March 03, 2015 to March 09, 2015, Major Disaster (Presidential) Declared DR-4218: May 12, 2015, FEMA Id: 4218, Natural disaster type: Snowstorm, Winter Storm, Mudslide, Landslide, Flood
- Kentucky Severe Winter Storms, Snowstorms, Flooding, Landslides, and Mudslides, Incident Period: February 15, 2015 to February 23, 2015, Major Disaster (Presidential) Declared DR-4216: April 30, 2015, FEMA Id: 4216, Natural disaster type: Snowstorm, Winter Storm, Mudslide, Landslide, Flood
- Kentucky Severe Storms, Flooding, Mudslides, and Tornadoes, Incident Period: May 01, 2010 to June 01, 2010, Major Disaster (Presidential) Declared DR-1912: May 11, 2010, FEMA Id: 1912, Natural disaster type: Storm, Tornado, Mudslide, Flood
- Kentucky Severe Winter Storm, Incident Period: January 27, 2009 to February 05, 2009, Emergency Declared EM-3302: January 28, 2009, FEMA Id: 3302, Natural disaster type: Winter Storm
- Kentucky Severe Winter Storm and Flooding, Incident Period: January 26, 2009 to February 13, 2009, Major Disaster (Presidential) Declared DR-1818: February 05, 2009, FEMA Id: 1818, Natural disaster type: Winter Storm, Flood
- Kentucky Hurricane Katrina Evacuation, Incident Period: August 29, 2005 to October 01, 2005, Emergency Declared EM-3231: September 10, 2005, FEMA Id: 3231, Natural disaster type: Hurricane
- 12 other natural disasters have been reported since 1953.
The number of natural disasters in Powell County (22) is greater than the US average (15).
Major Disasters (Presidential) Declared: 16
Emergencies Declared: 3
Causes of natural disasters: Floods: 14, Storms: 12, Mudslides: 7, Winter Storms: 7, Landslides: 5, Snowstorms: 2, Tornadoes: 2, Blizzard: 1, Freeze: 1, Hurricane: 1, Snow: 1, Snowfall: 1, Wind: 1, Other: 1 (Note: some incidents may be assigned to more than one category).
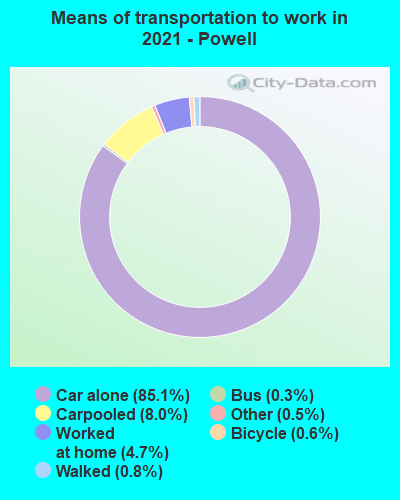
Means of transportation to work:
- Drove a car alone: 2,304 (81.6%)
- Carpooled: 181 (6.4%)
- Bus: 9 (0.3%)
- Taxicab, motorcycle, or other means: 21 (0.7%)
- Bicycle: 12 (0.4%)
- Walked: 29 (1.0%)
- Worked at home: 241 (8.5%)
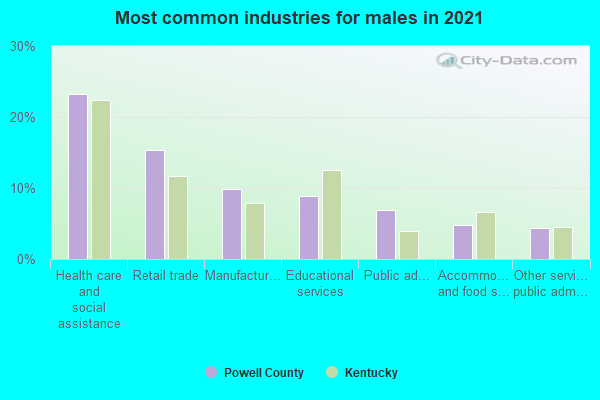
- Health care and social assistance (21%)
- Retail trade (13%)
- Manufacturing (11%)
- Educational services (10%)
- Public administration (7%)
- Other services, except public administration (5%)
- Accommodation and food services (5%)
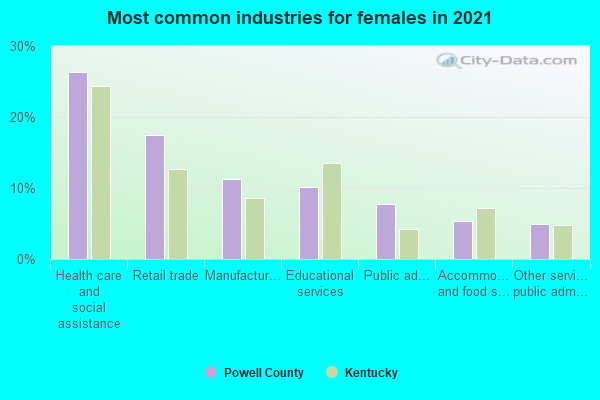
- Health care and social assistance (24%)
- Retail trade (14%)
- Manufacturing (12%)
- Educational services (11%)
- Public administration (8%)
- Other services, except public administration (6%)
- Accommodation and food services (6%)
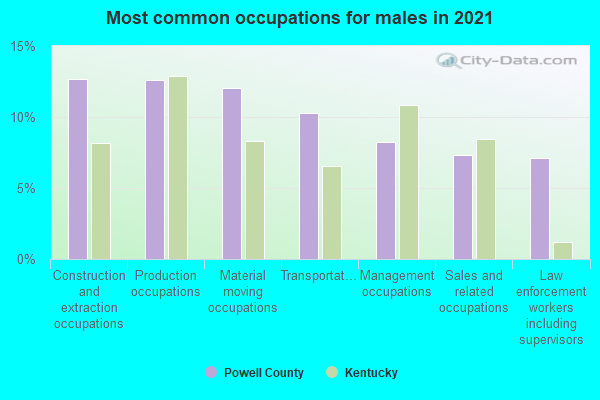
- Transportation occupations (17%)
- Production occupations (16%)
- Construction and extraction occupations (14%)
- Sales and related occupations (8%)
- Law enforcement workers including supervisors (8%)
- Management occupations (6%)
- Material moving occupations (4%)
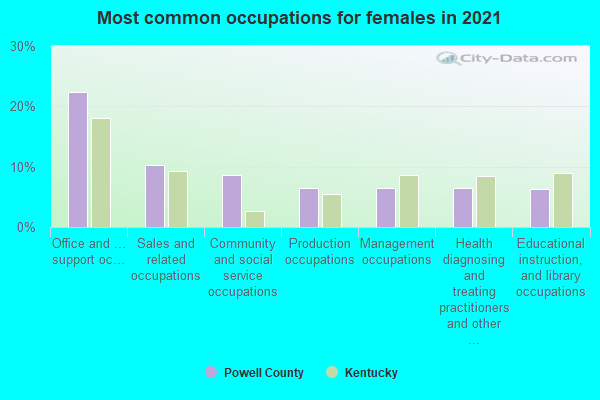
- Office and administrative support occupations (23%)
- Sales and related occupations (11%)
- Educational instruction, and library occupations (8%)
- Community and social service occupations (8%)
- Production occupations (7%)
- Management occupations (6%)
- Health diagnosing and treating practitioners and other technical occupations (6%)
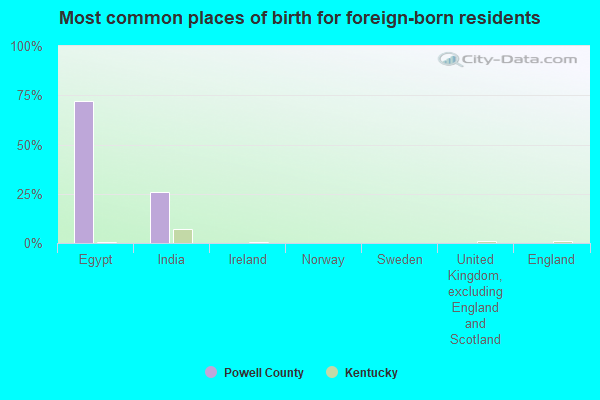
- Egypt (100%)
- Ireland (0%)
- Norway (0%)
- Sweden (0%)
- United Kingdom, excluding England and Scotland (0%)
- England (0%)
- Scotland (0%)
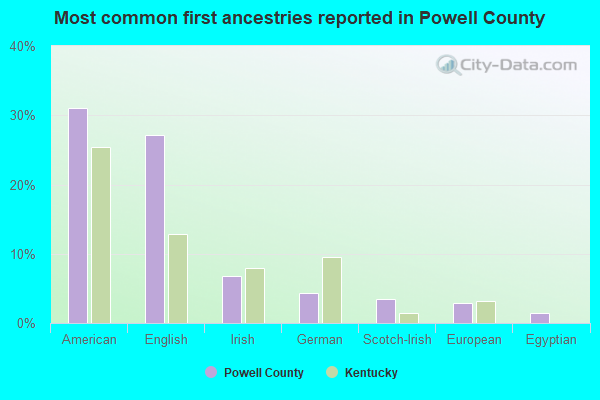
- English (31%)
- American (31%)
- Irish (5%)
- Scotch-Irish (4%)
- German (4%)
- Egyptian (2%)
- Italian (1%)
People in group quarters in Powell County, Kentucky in 2010:
- 109 people in local jails and other municipal confinement facilities
- 76 people in nursing facilities/skilled-nursing facilities
- 2 people in group homes intended for adults
People in group quarters in Powell County, Kentucky in 2000:
- 72 people in nursing homes
- 25 people in local jails and other confinement facilities (including police lockups)
- 16 people in other group homes
- 2 people in religious group quarters
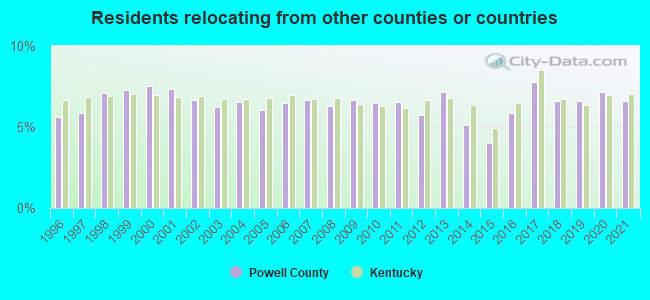
6.62% of this county's 2021 resident taxpayers lived in other counties in 2020 ($34,403 average adjusted gross income)
| Here: | 6.62% |
| Kentucky average: | 7.04% |
10 or fewer of this county's residents moved from foreign countries.
5.38% relocated from other counties in Kentucky ($27,691 average AGI)
1.24% relocated from other states ($6,712 average AGI)
Powell County: 1.24% Kentucky average: 2.87%
Top counties from which taxpayers relocated into this county between 2020 and 2021:
| from Clark County, KY | |
| from Montgomery County, KY | |
| from Fayette County, KY |
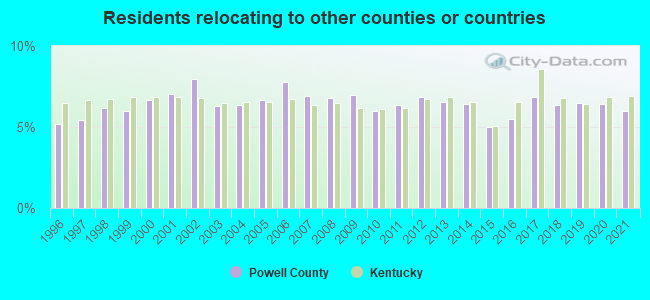
5.99% of this county's 2020 resident taxpayers moved to other counties in 2021 ($34,036 average adjusted gross income)
| Here: | 5.99% |
| Kentucky average: | 6.89% |
10 or fewer of this county's residents moved to foreign countries.
5.99% relocated to other counties in Kentucky ($34,036 average AGI)
10 or fewer of this county's residents relocated to other states.
Top counties to which taxpayers relocated from this county between 2020 and 2021:
| to Montgomery County, KY | |
| to Clark County, KY | |
| to Fayette County, KY | |
| to Estill County, KY | |
| to Madison County, KY |
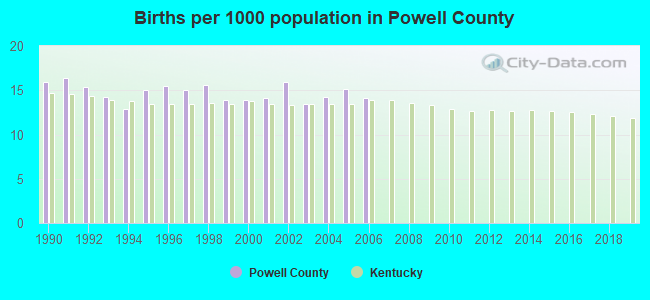
Births per 1000 population from 1990 to 1999: 15.0
Births per 1000 population from 2000 to 2006: 14.4
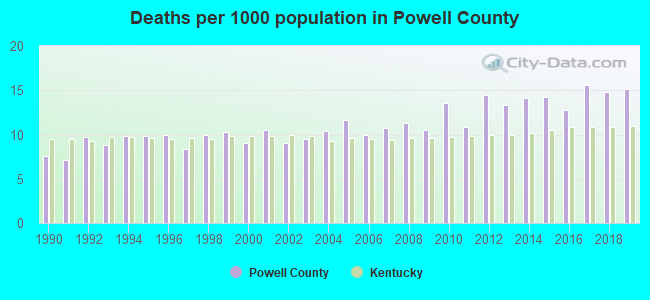
Deaths per 1000 population from 1990 to 1999: 9.1
Deaths per 1000 population from 2000 to 2009: 10.3
Deaths per 1000 population from 2010 to 2020: 14.0
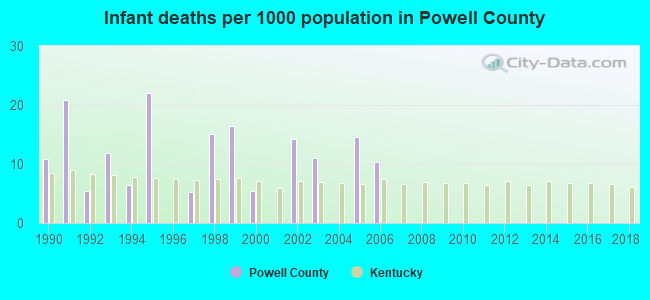
Infant deaths per 1000 live births from 1990 to 1999: 11.4
Infant deaths per 1000 live births from 2000 to 2006: 8.0
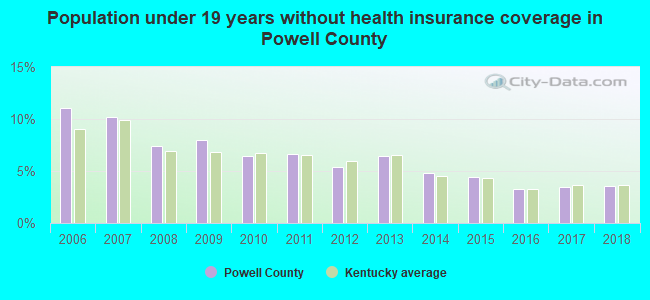
Persons under 19 years old without health insurance coverage in 2018: 3.6%

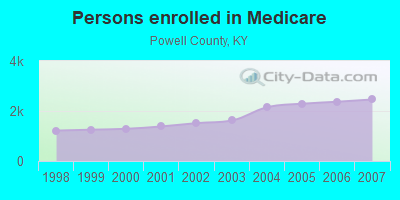
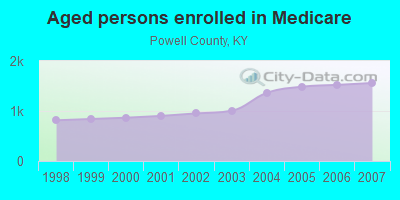
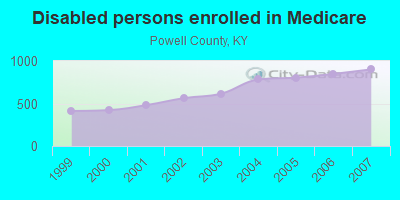
Persons enrolled in hospital insurance and/or supplemental medical insurance (Medicare) in July 1, 2007: 2,461 (1,560 aged, 901 disabled)
Children under 18 without health insurance coverage in 2007: 506 (16%)
Most common underlying causes of death in Powell County, Kentucky in 1999 - 2019:
- Acute myocardial infarction, unspecified (367)
- Bronchus or lung, unspecified - Malignant neoplasms (279)
- Chronic obstructive pulmonary disease, unspecified (74)
- Accidental poisoning by and exposure to other and unspecified drugs, medicaments and biological substances (15)
- Atherosclerotic heart disease (12)
- Alzheimer disease, unspecified (11)
- Cardiac arrest, unspecified (10)
- Stroke, not specified as haemorrhage or infarction (10)
Population without health insurance coverage in 2000: 16%
Children under 18 without health insurance coverage in 2000: 11%
Medical specialist MDs per 100,000 population in 2005: 964
Dentists per 100,000 population in 1998: 7
Total births per 100,000 population, July 2005 - July 2006 : 31
Total deaths per 100,000 population, July 2005 - July 2006: 73
Limited-service eating places per 100,000 population in 2005 : 7
EPA green book nonattainment status in 2004-2006: 1
Crimes per 100,000 population in 1996: 1
Household type by relationship:
Households: 13,116- Male householders: 2,289 (672 living alone), Female householders: 2,524 (748 living alone)
2,462 spouses (2,449 opposite-sex spouses), 193 unmarried partners, (193 opposite-sex unmarried partners), 3,591 children (3,422 natural, 71 adopted, 101 stepchildren), 866 grandchildren, 87 brothers or sisters, 63 parents, 38 foster children, 470 other relatives, 137 non-relatives
- In group quarters: 313
Size of family households: 1,500 2-persons, 828 3-persons, 684 4-persons, 314 5-persons, 28 6-persons, 12 7-or-more-persons.
Size of nonfamily households: 1,420 1-person, 31 2-persons.
1,482 married couples with children.
650 single-parent households (220 men, 430 women).
98.3% of residents of Powell speak English at home.
1.2% of residents speak Spanish at home (68% speak English very well, 30% speak English well, 2% speak English not well).
0.1% of residents speak Asian or Pacific Island language at home (100% speak English very well).
0.4% of residents speak other language at home (100% speak English very well).
In fiscal year 2004:
Federal Government expenditure: $62,124,000 ($4,563 per capita)
Department of Defense expenditure: $683,000
Federal direct payments to individuals for retirement and disability: $29,500,000
Federal other direct payments to individuals: $9,901,000
Federal direct payments not to individuals: $587,000
Federal grants: $19,567,000
Federal procurement contracts: $486,000 ($0,000 Department of Defense)
Federal salaries and wages: $2,083,000 ($0,000 Department of Defense)
Federal Government direct loans: $950,000
Federal guaranteed/insured loans: $1,336,000
Federal Government insurance: $5,868,000
Population change from April 1, 2000 to July 1, 2005:
Births: 974| Here: | 71 per 1000 residents |
| State: | 69 per 1000 residents |
Deaths: 666
| Here: | 49 per 1000 residents |
| State: | 50 per 1000 residents |
Net international migration: +2
| Here: | +0 per 1000 residents |
| State: | +7 per 1000 residents |
Net internal migration: +172
| Here: | +13 per 1000 residents |
| State: | +8 per 1000 residents |
Total withdrawal of fresh water for public supply: 1.12 millions of gallons per day (all from surface)
| Here: | 6.1 |
| State: | 6.4 |
| Here: | 4.6 |
| State: | 4.4 |
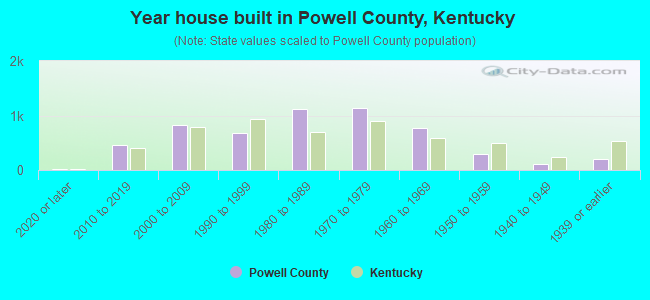
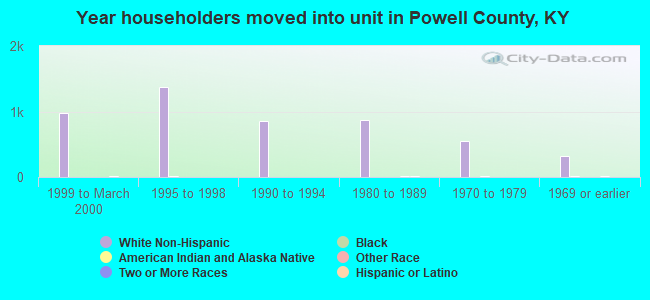
- Year house built in Powell County, Kentucky
- 72020 or later
- 4682010 to 2019
- 1,0212000 to 2009
- 7211990 to 1999
- 1,1511980 to 1989
- 1,0541970 to 1979
- 6811960 to 1969
- 2891950 to 1959
- 1091940 to 1949
- 1351939 or earlier
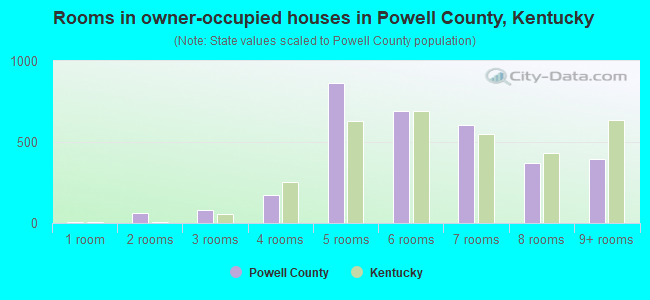
- Rooms in owner-occupied houses in Powell County, Kentucky
- 01 room
- 912 rooms
- 863 rooms
- 1654 rooms
- 9265 rooms
- 5816 rooms
- 7017 rooms
- 3528 rooms
- 3989+ rooms
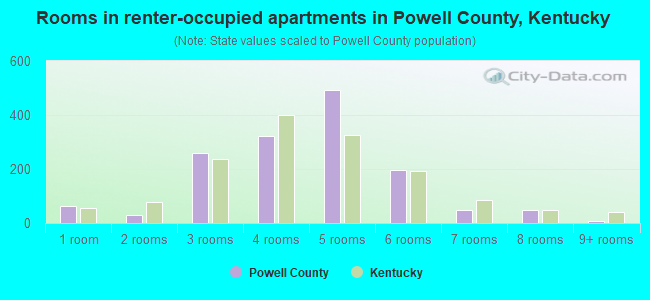
- Rooms in renter-occupied apartments in Powell County, Kentucky
- 441 room
- 342 rooms
- 2803 rooms
- 3584 rooms
- 4185 rooms
- 2066 rooms
- 427 rooms
- 538 rooms
- 559+ rooms
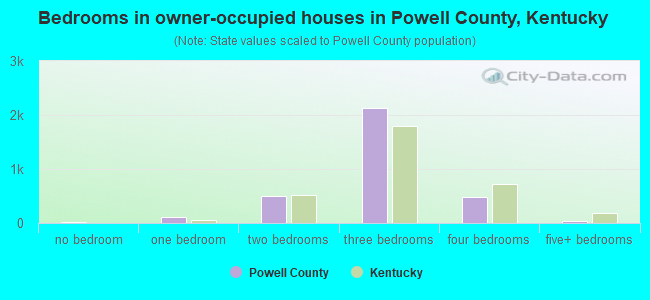
- Bedrooms in owner-occupied houses in Powell County, Kentucky
- 41no bedroom
- 981 bedroom
- 4322 bedrooms
- 2,1173 bedrooms
- 6194 bedrooms
- 205+ bedrooms
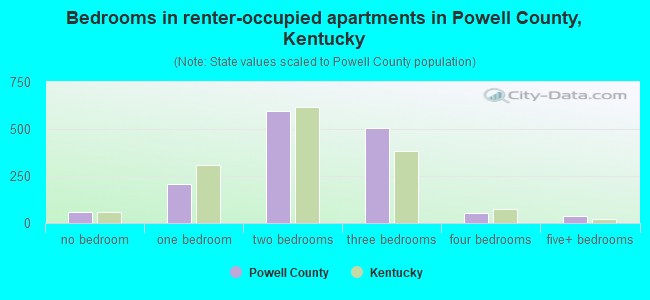
- Bedrooms in renter-occupied apartments in Powell County, Kentucky
- 47no bedroom
- 1981 bedroom
- 6472 bedrooms
- 4813 bedrooms
- 894 bedrooms
- 235+ bedrooms
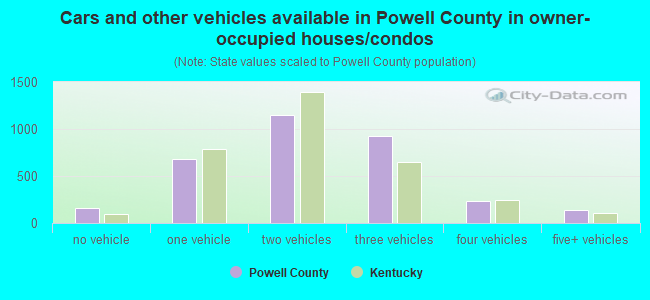
- Cars and other vehicles available in Powell County in owner-occupied houses/condos
- 112no vehicle
- 7451 vehicle
- 1,0802 vehicles
- 9053 vehicles
- 2744 vehicles
- 1755+ vehicles
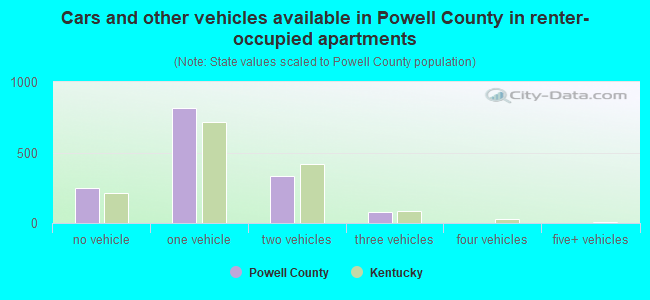
- Cars and other vehicles available in Powell County in renter-occupied apartments
- 276no vehicle
- 8041 vehicle
- 3262 vehicles
- 883 vehicles
- 134 vehicles
- 05+ vehicles
88.3% of Powell County residents lived in the same house 1 years ago.
Out of people who lived in different houses, 41% lived in this county.
Out of people who lived in different counties, 75% lived in Kentucky.
| Powell County: | 88.3% |
| State average: | 87.2% |
Place of birth for U.S.-born residents:
- This state: 10,187
- Other state: 2,798
- Northeast: 284
- Midwest: 1,220
- South: 1,007
- West: 290
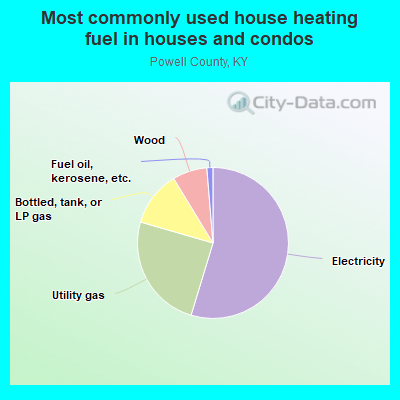
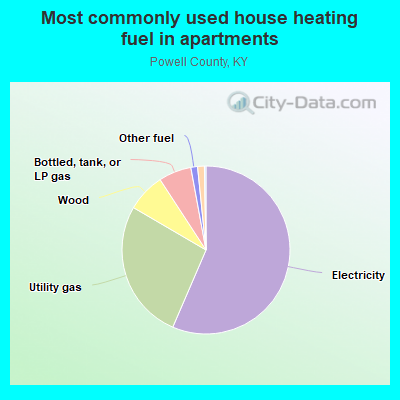
- 57.3%Electricity
- 24.2%Utility gas
- 9.8%Bottled, tank, or LP gas
- 7.4%Wood
- 1.1%Fuel oil, kerosene, etc.
- 0.2%Other fuel
- 58.1%Electricity
- 25.8%Utility gas
- 10.4%Bottled, tank, or LP gas
- 3.7%Wood
- 1.3%Other fuel
- 0.7%Fuel oil, kerosene, etc.
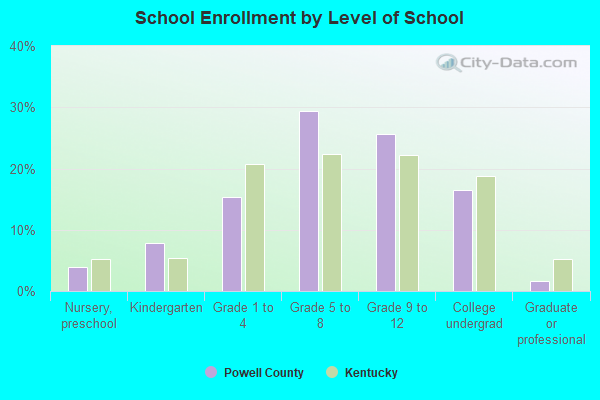
Private vs. public school enrollment:
| Here: | 3.3% |
| Kentucky: | 17.2% |
| Here: | 9.1% |
| Kentucky: | 15.2% |
| Here: | 5.1% |
| Kentucky: | 19.6% |
Powell County government finances - Expenditure in 2018:
- Bond Funds - Cash and Securities: $738,000
- Charges - Other: $977,000
Solid Waste Management: $117,000
Hospital Public: $39,000
- Construction - Correctional Institutions: $452,000
Parks and Recreation: $304,000
General - Other: $62,000
Regular Highways: $37,000
- Current Operations - General - Other: $2,252,000
Health - Other: $1,976,000
Correctional Institutions: $1,792,000
Regular Highways: $578,000
Central Staff Services: $558,000
Police Protection: $421,000
Solid Waste Management: $277,000
General Public Buildings: $137,000
Parks and Recreation: $122,000
Financial Administration: $102,000
Local Fire Protection: $68,000
Judicial and Legal Services: $63,000
Natural Resources - Other: $22,000
Public Welfare - Other: $7,000
Air Transportation: $6,000
- Federal Intergovernmental - Other: $804,000
Health and Hospitals: $268,000
- Intergovernmental to Local - Other - Correctional Institutions: $2,000
- Local Intergovernmental - Health and Hospitals: $300,000
Highways: $21,000
Other: $17,000
- Miscellaneous - General Revenue - Other: $259,000
Donations From Private Sources: $10,000
Interest Earnings: $1,000
- Other Capital Outlay - General - Other: $143,000
Health - Other: $25,000
- Other Funds - Cash and Securities: $1,207,000
- State Intergovernmental - Other: $2,930,000
Highways: $949,000
Health and Hospitals: $134,000
General Local Government Support: $41,000
- Tax - Individual Income: $1,064,000
Property: $556,000
Insurance Premiums Sales: $461,000
Public Utilities Sales: $163,000
Corporation License: $25,000
Documentary and Stock Transfer: $24,000
- Total Salaries and Wages: $3,350,000
Powell County government finances - Revenue in 2018:
- Bond Funds - Cash and Securities: $738,000
- Charges - Other: $977,000
Solid Waste Management: $117,000
Hospital Public: $39,000
- Construction - Correctional Institutions: $452,000
Parks and Recreation: $304,000
General - Other: $62,000
Regular Highways: $37,000
- Current Operations - General - Other: $2,252,000
Health - Other: $1,976,000
Correctional Institutions: $1,792,000
Regular Highways: $578,000
Central Staff Services: $558,000
Police Protection: $421,000
Solid Waste Management: $277,000
General Public Buildings: $137,000
Parks and Recreation: $122,000
Financial Administration: $102,000
Local Fire Protection: $68,000
Judicial and Legal Services: $63,000
Natural Resources - Other: $22,000
Public Welfare - Other: $7,000
Air Transportation: $6,000
- Federal Intergovernmental - Other: $804,000
Health and Hospitals: $268,000
- Intergovernmental to Local - Other - Correctional Institutions: $2,000
- Local Intergovernmental - Health and Hospitals: $300,000
Highways: $21,000
Other: $17,000
- Miscellaneous - General Revenue - Other: $259,000
Donations From Private Sources: $10,000
Interest Earnings: $1,000
- Other Capital Outlay - General - Other: $143,000
Health - Other: $25,000
- Other Funds - Cash and Securities: $1,207,000
- State Intergovernmental - Other: $2,930,000
Highways: $949,000
Health and Hospitals: $134,000
General Local Government Support: $41,000
- Tax - Individual Income: $1,064,000
Property: $556,000
Insurance Premiums Sales: $461,000
Public Utilities Sales: $163,000
Corporation License: $25,000
Documentary and Stock Transfer: $24,000
- Total Salaries and Wages: $3,350,000
Powell County government finances - Debt in 2018:
- Bond Funds - Cash and Securities: $738,000
- Charges - Other: $977,000
Solid Waste Management: $117,000
Hospital Public: $39,000
- Construction - Correctional Institutions: $452,000
Parks and Recreation: $304,000
General - Other: $62,000
Regular Highways: $37,000
- Current Operations - General - Other: $2,252,000
Health - Other: $1,976,000
Correctional Institutions: $1,792,000
Regular Highways: $578,000
Central Staff Services: $558,000
Police Protection: $421,000
Solid Waste Management: $277,000
General Public Buildings: $137,000
Parks and Recreation: $122,000
Financial Administration: $102,000
Local Fire Protection: $68,000
Judicial and Legal Services: $63,000
Natural Resources - Other: $22,000
Public Welfare - Other: $7,000
Air Transportation: $6,000
- Federal Intergovernmental - Other: $804,000
Health and Hospitals: $268,000
- Intergovernmental to Local - Other - Correctional Institutions: $2,000
- Local Intergovernmental - Health and Hospitals: $300,000
Highways: $21,000
Other: $17,000
- Miscellaneous - General Revenue - Other: $259,000
Donations From Private Sources: $10,000
Interest Earnings: $1,000
- Other Capital Outlay - General - Other: $143,000
Health - Other: $25,000
- Other Funds - Cash and Securities: $1,207,000
- State Intergovernmental - Other: $2,930,000
Highways: $949,000
Health and Hospitals: $134,000
General Local Government Support: $41,000
- Tax - Individual Income: $1,064,000
Property: $556,000
Insurance Premiums Sales: $461,000
Public Utilities Sales: $163,000
Corporation License: $25,000
Documentary and Stock Transfer: $24,000
- Total Salaries and Wages: $3,350,000
Powell County government finances - Cash and Securities in 2018:
- Bond Funds - Cash and Securities: $738,000
- Charges - Other: $977,000
Solid Waste Management: $117,000
Hospital Public: $39,000
- Construction - Correctional Institutions: $452,000
Parks and Recreation: $304,000
General - Other: $62,000
Regular Highways: $37,000
- Current Operations - General - Other: $2,252,000
Health - Other: $1,976,000
Correctional Institutions: $1,792,000
Regular Highways: $578,000
Central Staff Services: $558,000
Police Protection: $421,000
Solid Waste Management: $277,000
General Public Buildings: $137,000
Parks and Recreation: $122,000
Financial Administration: $102,000
Local Fire Protection: $68,000
Judicial and Legal Services: $63,000
Natural Resources - Other: $22,000
Public Welfare - Other: $7,000
Air Transportation: $6,000
- Federal Intergovernmental - Other: $804,000
Health and Hospitals: $268,000
- Intergovernmental to Local - Other - Correctional Institutions: $2,000
- Local Intergovernmental - Health and Hospitals: $300,000
Highways: $21,000
Other: $17,000
- Miscellaneous - General Revenue - Other: $259,000
Donations From Private Sources: $10,000
Interest Earnings: $1,000
- Other Capital Outlay - General - Other: $143,000
Health - Other: $25,000
- Other Funds - Cash and Securities: $1,207,000
- State Intergovernmental - Other: $2,930,000
Highways: $949,000
Health and Hospitals: $134,000
General Local Government Support: $41,000
- Tax - Individual Income: $1,064,000
Property: $556,000
Insurance Premiums Sales: $461,000
Public Utilities Sales: $163,000
Corporation License: $25,000
Documentary and Stock Transfer: $24,000
- Total Salaries and Wages: $3,350,000
Supplemental Security Income (SSI) in 2006:
- Total number of recipients: 1,111
- Number of aged recipients: 53
- Number of blind and disabled recipients: 1,058
- Number of recipients under 18: 141
- Number of recipients between 18 and 64: 779
- Number of recipients older than 64: 191
- Number of recipients also receiving OASDI: 388
- Amount of payments (thousands of dollars): 495
| Most common first names in Powell County, KY among deceased individuals | ||
| Name | Count | Lived (average) |
|---|---|---|
| James | 79 | 70.3 years |
| John | 74 | 77.0 years |
| William | 58 | 72.9 years |
| Mary | 49 | 77.4 years |
| Robert | 42 | 69.6 years |
| George | 42 | 73.5 years |
| Charles | 40 | 67.3 years |
| Anna | 22 | 76.1 years |
| Floyd | 19 | 73.1 years |
| Elizabeth | 18 | 73.6 years |
| Most common last names in Powell County, KY among deceased individuals | ||
| Last name | Count | Lived (average) |
|---|---|---|
| Hall | 77 | 72.6 years |
| Rogers | 63 | 73.2 years |
| Smith | 50 | 71.0 years |
| Townsend | 48 | 70.1 years |
| Baker | 42 | 72.9 years |
| Martin | 41 | 76.6 years |
| Spencer | 33 | 75.1 years |
| Morton | 31 | 77.3 years |
| Brewer | 30 | 75.8 years |
| Hatton | 30 | 74.3 years |
| Businesses in Powell County, KY | ||||
| Name | Count | Name | Count | |
|---|---|---|---|---|
| AT&T | 1 | Lane Furniture | 1 | |
| Ace Hardware | 1 | Little Caesars Pizza | 1 | |
| Advance Auto Parts | 1 | Long John Silver's | 1 | |
| Arby's | 1 | McDonald's | 1 | |
| Curves | 1 | Rite Aid | 1 | |
| Dairy Queen | 2 | Subway | 2 | |
| H&R Block | 1 | True Value | 2 | |
| Hardee's | 1 | U-Haul | 2 | |
| Kroger | 1 | UPS | 2 | |
Powell County on our top lists:
- #44 on the list of "Top 101 counties with the smallest number of people without health insurance coverage in 2000"