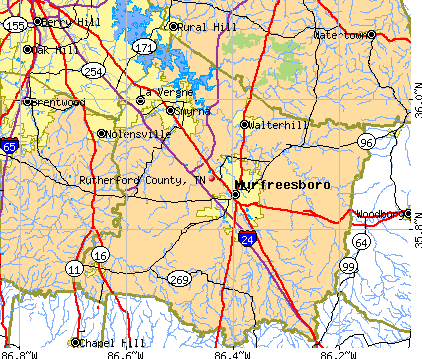
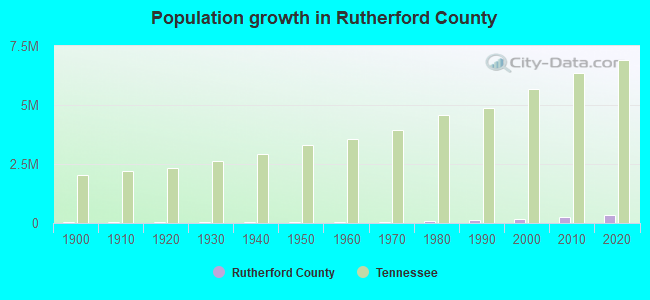
Rutherford County, Tennessee (TN)
County owner-occupied free and clear houses and condos in 2010: 13,442
County owner-occupied houses and condos in 2000: 46,408
Renter-occupied apartments: 30,783 (it was 20,035 in 2000)
| % of renters here: | 30% |
| State: | 32% |
Land area: 619 sq. mi.
Water area: 5.0 sq. mi.
Population density: 583 people per square mile (high).
Industries providing employment: Educational, health and social services (19.9%), Manufacturing (13.0%), Retail trade (12.2%), Professional, scientific, management, administrative, and waste management services (11.3%).
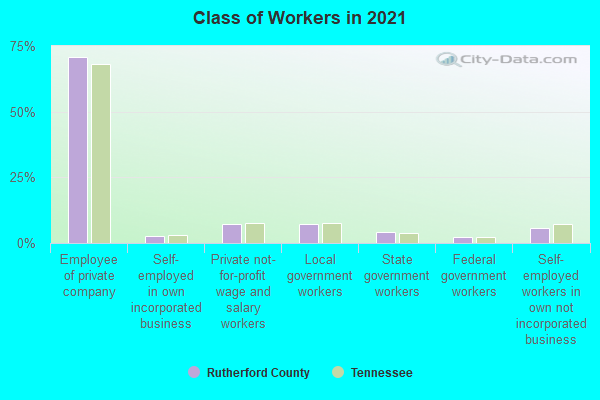
Type of workers:
- Private wage or salary: 81%
- Government: 13%
- Self-employed, not incorporated: 6%
- Unpaid family work: 0%
- OSM Map
- General Map
- Google Map
- MSN Map

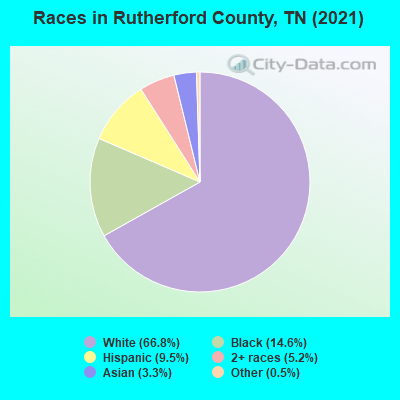
- 235,24565.2%White Non-Hispanic Alone
- 55,33315.3%Black Non-Hispanic Alone
- 36,02810.0%Hispanic or Latino
- 18,0545.0%Two or more races
- 14,0183.9%Asian alone
- 1,4040.4%Some other race alone
- 3070.09%Native Hawaiian and Other
Pacific Islander alone - 2300.06%American Indian and Alaska Native alone
| Median resident age: | 34.2 years |
| Tennessee median age: | 39.2 years |
| Males: 179,112 | |
| Females: 181,507 |

 | Rutherford County, TN asks parents not to eavesdrop on their children's classes (16 replies) |
| Tennessee's 2020 Census results (70 replies) |
| Nashville Has Elected a New Mayor (10 replies) |
| Is Columbia the next Franklin? (26 replies) |
| Mount Juliet versus Hendersonville (95 replies) |
| Murfreesboro decision 2 yrs (8 replies) |
| Rutherford County: | 2.0 people |
| Tennessee: | 2 people |
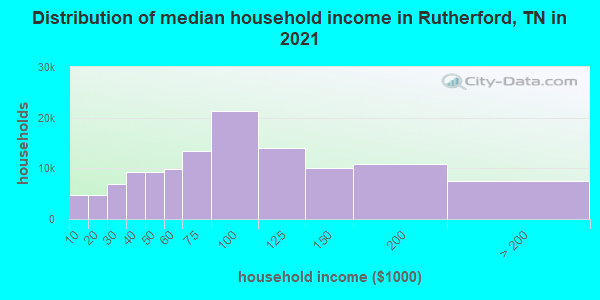
Estimated median household income in 2022: $76,857 ($46,312 in 1999)
| This county: | $76,857 |
| Tennessee: | $65,254 |
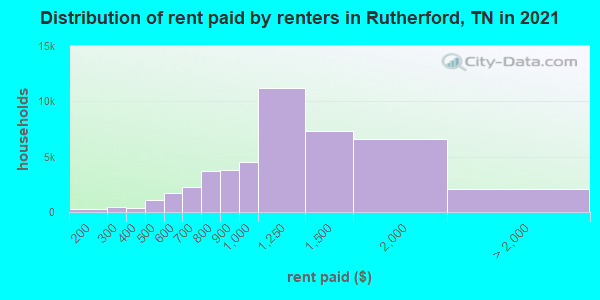
Median contract rent in 2022 for apartments: $1,178 (lower quartile is $901, upper quartile is $1,554)
| This county: | $1178 |
| State: | $884 |
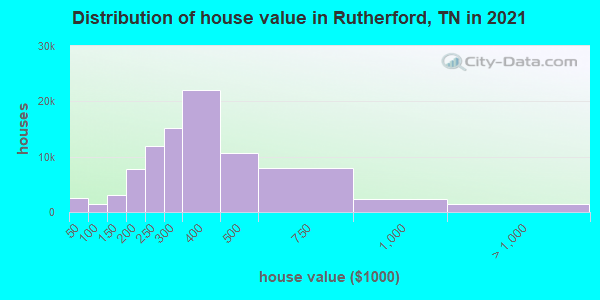
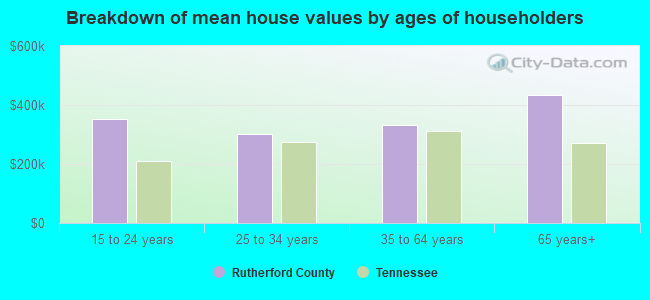
Estimated median house or condo value in 2022: $387,100 (it was $111,600 in 2000)
| Rutherford: | $387,100 |
| Tennessee: | $284,800 |
Mean price in 2022:
Median monthly housing costs for homes and condos with a mortgage: $1,599Detached houses: $354,893
Here: $354,893 State: $374,382 Townhouses or other attached units: $236,968
Here: $236,968 State: $354,101 In 2-unit structures: $193,937
Here: $193,937 State: $247,693 In 3-to-4-unit structures: $164,118
Here: $164,118 State: $239,060 In 5-or-more-unit structures: $167,285
Here: $167,285 State: $317,434 Mobile homes: $127,353
Here: $127,353 State: $101,421 Occupied boats, RVs, vans, etc.: $72,148
Here: $72,148 State: $142,822
Median monthly housing costs for units without a mortgage: $445
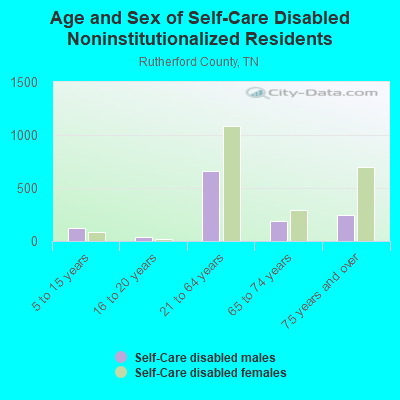
Institutionalized population: 1,988
Crime in 2021 (reported by the sheriff's office or county police, not the county total):
- Murders: 0
- Rapes: 29
- Robberies: 4
- Assaults: 208
- Burglaries: 84
- Thefts: 362
- Auto thefts: 71
Crime in 2020 (reported by the sheriff's office or county police, not the county total):
- Murders: 3
- Rapes: 22
- Robberies: 8
- Assaults: 186
- Burglaries: 122
- Thefts: 452
- Auto thefts: 74
Health of residents in Rutherford County based on CDC Behavioral Risk Factor Surveillance System Survey Questionnaires from 2013 to 2021:
General health status score of residents in this county from 1 (poor) to 5 (excellent) is 3.5. This is about average.69.9% of residents exercised in the past month. This is less than average.
42.1% of residents smoked 100+ cigarettes in their lives. This is about average.
48.0% of adult residents drank alcohol in the past 30 days. This is less than average.
65.5% of residents visited a dentist within the past year. This is less than average.
Average weight of males is 202 pounds. This is more than average.
Average weight of females is 168 pounds. This is more than average.
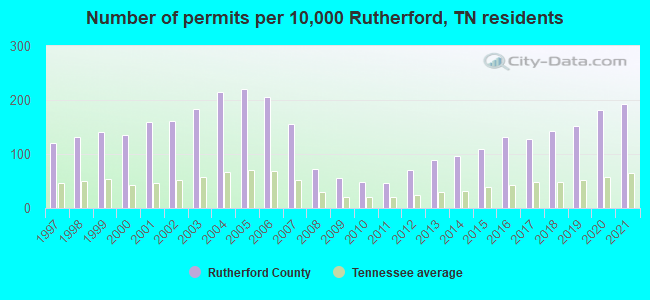
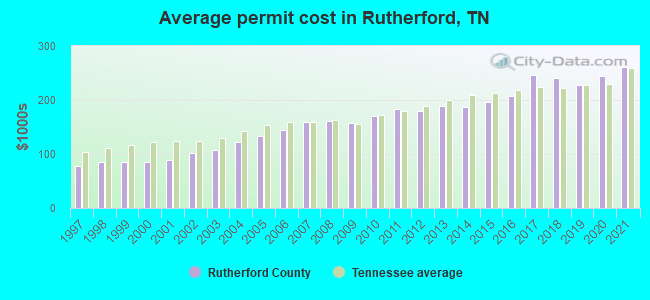
Single-family new house construction building permits:
- 2022: 2267 buildings, average cost: $314,600
- 2021: 3488 buildings, average cost: $260,500
- 2020: 3303 buildings, average cost: $243,700
- 2019: 2744 buildings, average cost: $227,500
- 2018: 2585 buildings, average cost: $240,500
- 2017: 2306 buildings, average cost: $245,600
- 2016: 2396 buildings, average cost: $207,700
- 2015: 2006 buildings, average cost: $195,900
- 2014: 1760 buildings, average cost: $186,800
- 2013: 1598 buildings, average cost: $188,900
- 2012: 1275 buildings, average cost: $180,100
- 2011: 858 buildings, average cost: $183,800
- 2010: 869 buildings, average cost: $170,200
- 2009: 995 buildings, average cost: $157,400
- 2008: 1331 buildings, average cost: $160,900
- 2007: 2817 buildings, average cost: $159,300
- 2006: 3733 buildings, average cost: $143,900
- 2005: 4006 buildings, average cost: $134,300
- 2004: 3899 buildings, average cost: $122,600
- 2003: 3330 buildings, average cost: $107,400
- 2002: 2938 buildings, average cost: $101,300
- 2001: 2895 buildings, average cost: $89,400
- 2000: 2456 buildings, average cost: $84,900
- 1999: 2557 buildings, average cost: $85,200
- 1998: 2386 buildings, average cost: $84,600
- 1997: 2194 buildings, average cost: $77,500
Median real estate property taxes paid for housing units with mortgages in 2022: $1,706 (0.4%)
Median real estate property taxes paid for housing units with no mortgage in 2022: $1,457 (0.4%)
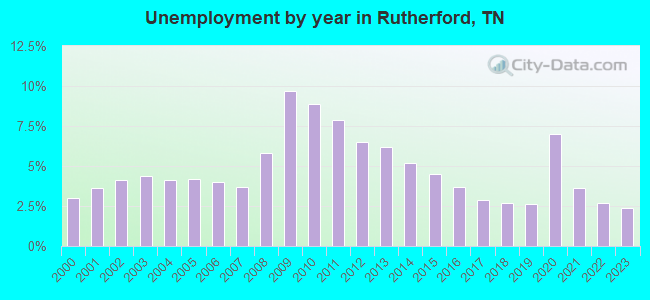
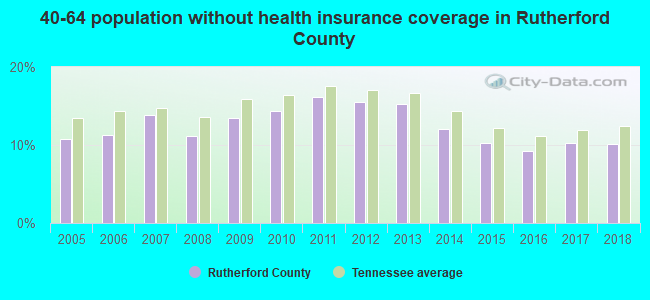
| Rutherford County: | 9.6% |
| Tennessee: | 13.3% |
Median age of residents in 2022: 34.2 years old
(Males: 33.5 years old, Females: 35.0 years old)
(Median age for: White residents: 38.1 years old, Black residents: 32.5 years old, American Indian residents: 39.3 years old, Asian residents: 32.3 years old, Hispanic or Latino residents: 24.8 years old, Other race residents: 28.7 years old)
Area name: Nashville-Davidson--Murfreesboro, TN HUD Metro FMR Area
Fair market rent in 2006 for a 1-bedroom apartment in Rutherford County is $579 a month.
Fair market rent for a 2-bedroom apartment is $666 a month.
Fair market rent for a 3-bedroom apartment is $864 a month.
Cities in this county include: Murfreesboro, Smyrna, La Vergne, Almaville, Lascassas, Christiana, Kittrell, Walterhill, Eagleville.
Neighboring counties: Adair County, Oklahoma  , Los Alamos County, New Mexico , Izard County, Arkansas , Henderson County , Martin County, North Carolina
  .
.
| Here: | 2.4% |
| Tennessee: | 3.0% |
Current college students: 16,117
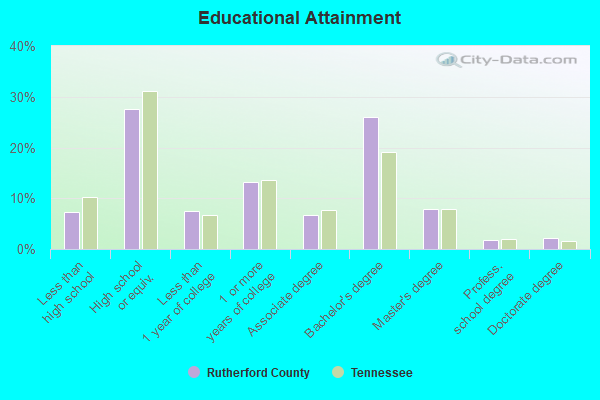
People 25 years of age or older with a high school degree or higher: 91.9%
People 25 years of age or older with a bachelor's degree or higher: 33.8%
Number of foreign born residents: 40,789 (43.8% naturalized citizens)
| Rutherford County: | 11.3% |
| Whole state: | 5.6% |
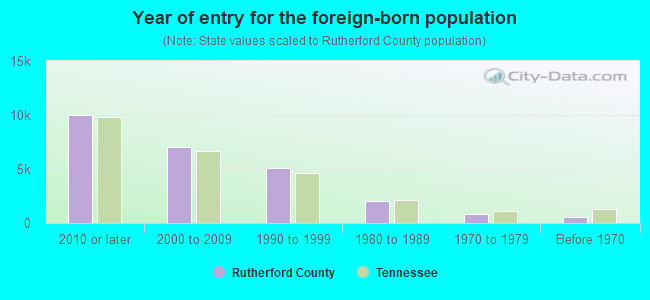
- Year of entry for the foreign-born population
- 13,1072010 or later
- 7,9232000 to 2009
- 5,0501990 to 1999
- 1,9981980 to 1989
- 7951970 to 1979
- 582Before 1970
Mean travel time to work (commute): minutes
Percentage of county residents living and working in this county: 98.4%
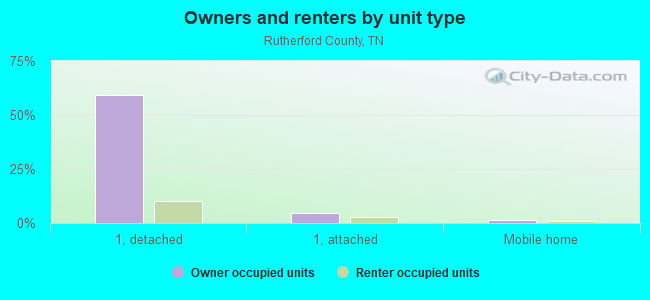
Housing units in structures:
- One, detached: 94,275
- One, attached: 10,210
- Two: 1,880
- 3 or 4: 3,221
- 5 to 9: 8,468
- 10 to 19: 6,305
- 20 to 49: 4,922
- 50 or more: 6,390
- Mobile homes: 3,669
Housing units in Rutherford County with a mortgage: 59,428 (7,506 second mortgage, 550 home equity loan, 5,718 both second mortgage and home equity loan)
Houses without a mortgage: 1,080
| Here: | 98.3% with mortgage |
| State: | 97.8% with mortgage |
Religion statistics for Rutherford County
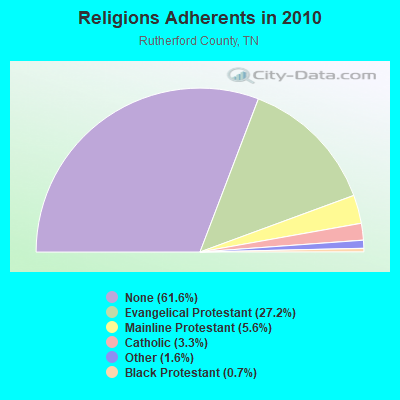
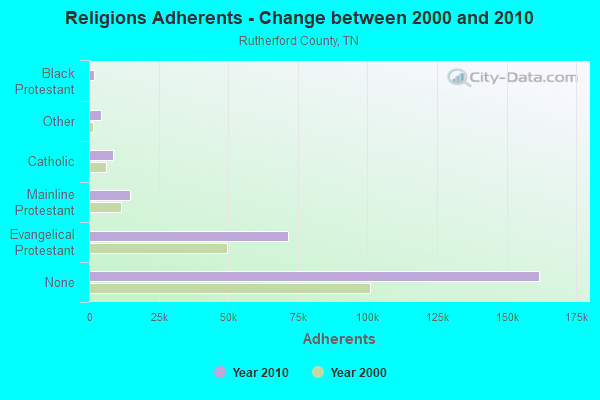
| Religion | Adherents | Congregations |
|---|---|---|
| Evangelical Protestant | 71,509 | 202 |
| Mainline Protestant | 14,802 | 43 |
| Catholic | 8,600 | 2 |
| Other | 4,135 | 17 |
| Black Protestant | 1,711 | 10 |
| Orthodox | 90 | 1 |
| None | 161,757 | - |
Source: Clifford Grammich, Kirk Hadaway, Richard Houseal, Dale E.Jones, Alexei Krindatch, Richie Stanley and Richard H.Taylor. 2012. 2010 U.S.Religion Census: Religious Congregations & Membership Study. Association of Statisticians of American Religious Bodies. Jones, Dale E., et al. 2002. Congregations and Membership in the United States 2000. Nashville, TN: Glenmary Research Center.
Food Environment Statistics:
| Rutherford County: | 1.16 / 10,000 pop. |
| State: | 1.99 / 10,000 pop. |
| Here: | 0.17 / 10,000 pop. |
| Tennessee: | 0.17 / 10,000 pop. |
| This county: | 0.37 / 10,000 pop. |
| Tennessee: | 0.65 / 10,000 pop. |
| Rutherford County: | 4.03 / 10,000 pop. |
| Tennessee: | 5.16 / 10,000 pop. |
| This county: | 6.48 / 10,000 pop. |
| State: | 6.56 / 10,000 pop. |
| Rutherford County: | 9.4% |
| Tennessee: | 11.4% |
| Rutherford County: | 30.9% |
| State: | 30.2% |
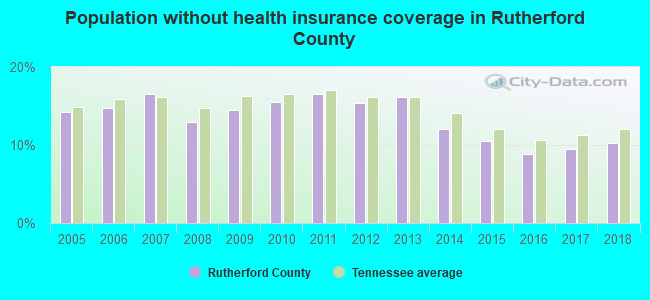
| Here: | 16.4% |
| State: | 13.5% |
Agriculture in Rutherford County:
Average size of farms: 101 acresAverage value of agricultural products sold per farm: $9,299
Average value of crops sold per acre for harvested cropland: $83.84
The value of nursery, greenhouse, floriculture, and sod as a percentage of the total market value of agricultural products sold: 5.28%
The value of livestock, poultry, and their products as a percentage of the total market value of agricultural products sold: 76.26%
Average total farm production expenses per farm: $11,435
Harvested cropland as a percentage of land in farms: 26.09%
Average market value of all machinery and equipment per farm: $27,240
The percentage of farms operated by a family or individual: 96.60%
Average age of principal farm operators: 56 years
Average number of cattle and calves per 100 acres of all land in farms: 18.55
Milk cows as a percentage of all cattle and calves: 4.36%
Corn for grain: 3901 harvested acres
All wheat for grain: 1359 harvested acres
Upland cotton: 1399 harvested acres
Soybeans for beans: 5611 harvested acres
Vegetables: 45 harvested acres
Land in orchards: 14 acres
Earthquake activity:
Rutherford County-area historical earthquake activity is significantly above Tennessee state average. It is 178% greater than the overall U.S. average.On 4/18/2008 at 09:36:59, a magnitude 5.4 (5.1 MB, 4.8 MS, 5.4 MW, 5.2 MW, Class: Moderate, Intensity: VI - VII) earthquake occurred 195.1 miles away from Rutherford County center
On 4/29/2003 at 08:59:39, a magnitude 4.9 (4.4 MB, 4.6 MW, 4.9 LG, Class: Light, Intensity: IV - V) earthquake occurred 106.1 miles away from the county center
On 4/18/2008 at 09:36:59, a magnitude 5.2 (5.2 MW, Depth: 8.9 mi) earthquake occurred 195.0 miles away from the county center
On 6/18/2002 at 17:37:15, a magnitude 5.0 (4.3 MB, 4.6 MW, 5.0 LG) earthquake occurred 163.6 miles away from the county center
On 7/27/1980 at 18:52:21, a magnitude 5.2 (5.1 MB, 4.7 MS, 5.0 UK, 5.2 UK) earthquake occurred 212.0 miles away from Rutherford County center
On 4/29/2003 at 08:59:39, a magnitude 4.6 (4.6 MW, Depth: 12.3 mi) earthquake occurred 106.1 miles away from the county center
Magnitude types: regional Lg-wave magnitude (LG), body-wave magnitude (MB), surface-wave magnitude (MS), moment magnitude (MW)
Most recent natural disasters:
- Tennessee Covid-19 Pandemic, Incident Period: January 20, 2020, FEMA Id: 4514, Natural disaster type: Other
- Tennessee Severe Storms, Flooding, Straight-Line Winds, and Tornadoes, Incident Period: April 30, 2010 to May 18, 2010, Major Disaster (Presidential) Declared DR-1909: May 04, 2010, FEMA Id: 1909, Natural disaster type: Storm, Tornado, Flood, Wind
- Tennessee Severe Storms, Tornadoes, and Flooding, Incident Period: April 10, 2009, Major Disaster (Presidential) Declared DR-1839: May 15, 2009, FEMA Id: 1839, Natural disaster type: Storm, Tornado, Flood
- Tennessee Hurricane Katrina Evacuation, Incident Period: August 29, 2005 to October 01, 2005, Emergency Declared EM-3217: September 05, 2005, FEMA Id: 3217, Natural disaster type: Hurricane
- Tennessee Severe Storms, Tornadoes and Flooding, Incident Period: May 04, 2003 to May 30, 2003, Major Disaster (Presidential) Declared DR-1464: May 08, 2003, FEMA Id: 1464, Natural disaster type: Storm, Tornado, Flood
- Tennessee Severe Storms, Tornadoes and Flooding, Incident Period: November 09, 2002 to November 12, 2002, Major Disaster (Presidential) Declared DR-1441: November 13, 2002, FEMA Id: 1441, Natural disaster type: Storm, Tornado, Flood
- Tennessee Ice Storm, Severe Winter Storm, Flash Flooding, Incident Period: February 09, 1994 to February 11, 1994, Major Disaster (Presidential) Declared DR-1010: February 28, 1994, FEMA Id: 1010, Natural disaster type: Ice Storm, Winter Storm, Flash Flood
- Tennessee Severe Snowfall, Winter Storm, Incident Period: March 13, 1993 to March 17, 1993, Emergency Declared EM-3095: March 14, 1993, FEMA Id: 3095, Natural disaster type: Winter Storm, Snowfall
- Tennessee SEVERE STORMS, TORNADOES, FLOODING, Incident Period: May 07, 1979, Major Disaster (Presidential) Declared DR-585: May 07, 1979, FEMA Id: 585, Natural disaster type: Storm, Tornado, Flood
- Tennessee SEVERE STORMS, FLOODING, Incident Period: March 22, 1975, Major Disaster (Presidential) Declared DR-459: March 22, 1975, FEMA Id: 459, Natural disaster type: Storm, Flood
- 2 other natural disasters have been reported since 1953.
The number of natural disasters in Rutherford County (12) is smaller than the US average (15).
Major Disasters (Presidential) Declared: 9
Emergencies Declared: 2
Causes of natural disasters: Floods: 7, Storms: 6, Tornadoes: 6, Winter Storms: 2, Flash Flood: 1, Heavy Rain: 1, Hurricane: 1, Ice Storm: 1, Snowfall: 1, Wind: 1, Other: 1 (Note: some incidents may be assigned to more than one category).
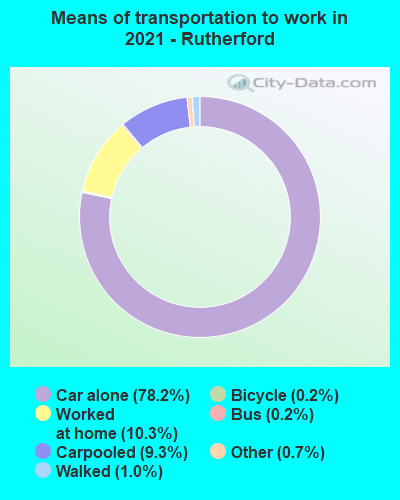
Means of transportation to work:
- Drove a car alone: 132,610 (71.2%)
- Carpooled: 21,401 (11.5%)
- Bus: 676 (0.4%)
- Taxicab, motorcycle, or other means: 1,899 (1.0%)
- Bicycle: 85 (0.0%)
- Walked: 1,800 (1.0%)
- Worked at home: 27,882 (15.0%)
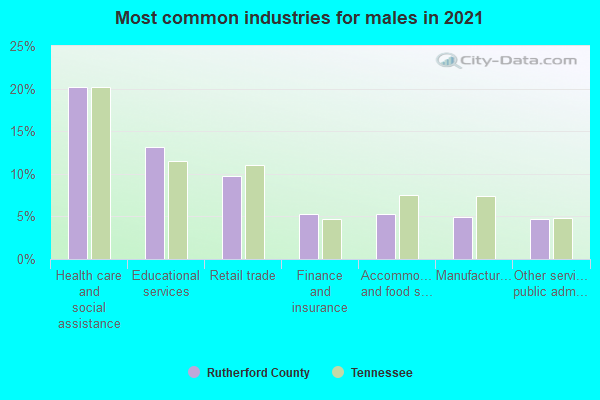
- Health care and social assistance (20%)
- Retail trade (11%)
- Educational services (9%)
- Accommodation and food services (7%)
- Finance and insurance (6%)
- Professional, scientific, and technical services (6%)
- Manufacturing (5%)
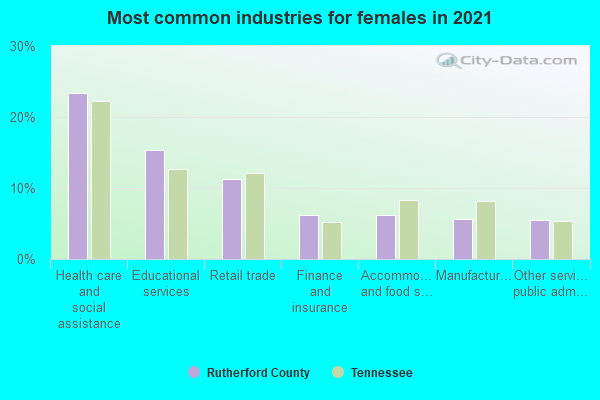
- Health care and social assistance (22%)
- Retail trade (12%)
- Educational services (10%)
- Accommodation and food services (8%)
- Finance and insurance (6%)
- Professional, scientific, and technical services (6%)
- Manufacturing (6%)
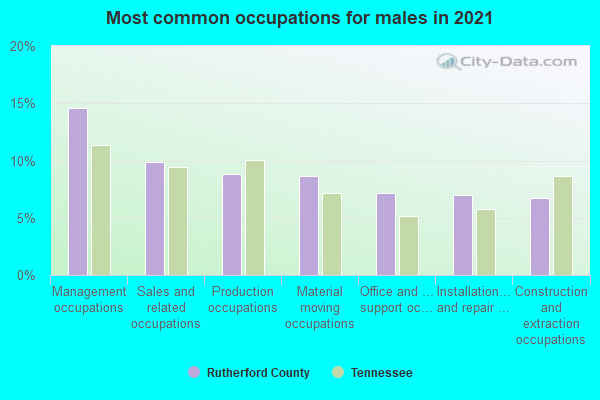
- Management occupations (11%)
- Production occupations (11%)
- Sales and related occupations (9%)
- Construction and extraction occupations (9%)
- Transportation occupations (8%)
- Material moving occupations (8%)
- Installation, maintenance, and repair occupations (6%)
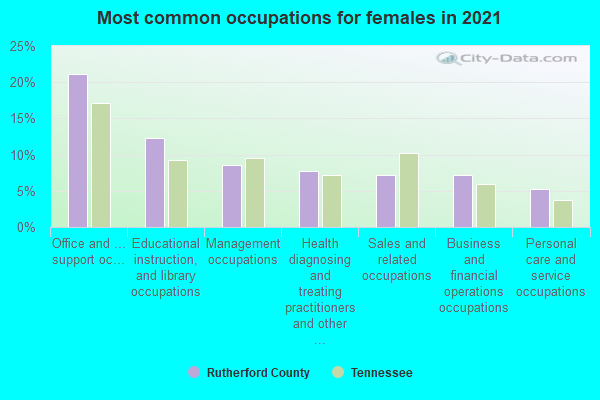
- Office and administrative support occupations (19%)
- Sales and related occupations (10%)
- Management occupations (10%)
- Educational instruction, and library occupations (8%)
- Business and financial operations occupations (7%)
- Health diagnosing and treating practitioners and other technical occupations (6%)
- Production occupations (6%)
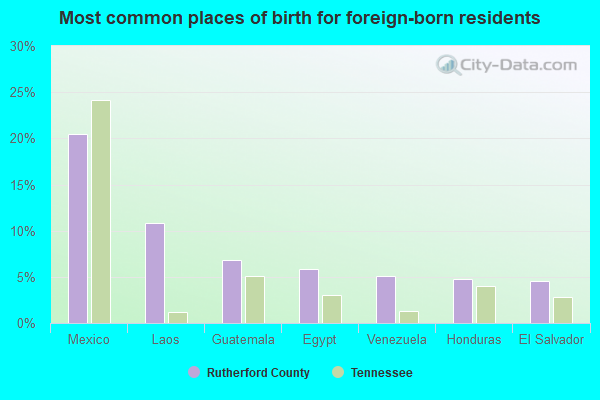
- Mexico (16%)
- Egypt (10%)
- Honduras (8%)
- Laos (7%)
- Venezuela (7%)
- Guatemala (5%)
- El Salvador (4%)
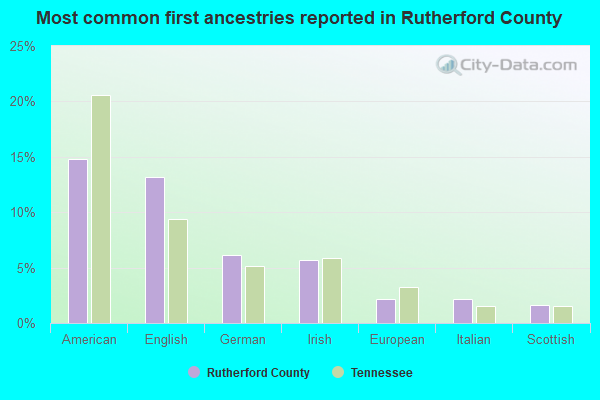
- American (15%)
- English (13%)
- Irish (6%)
- German (5%)
- European (2%)
- Italian (2%)
- Scottish (2%)
People in group quarters in Rutherford County, Tennessee in 2010:
- 2,923 people in college/university student housing
- 960 people in nursing facilities/skilled-nursing facilities
- 836 people in local jails and other municipal confinement facilities
- 138 people in residential schools for people with disabilities
- 117 people in group homes intended for adults
- 40 people in emergency and transitional shelters (with sleeping facilities) for people experiencing homelessness
- 32 people in residential treatment centers for juveniles (non-correctional)
- 23 people in other noninstitutional facilities
- 22 people in correctional facilities intended for juveniles
- 13 people in residential treatment centers for adults
- 5 people in workers' group living quarters and job corps centers
People in group quarters in Rutherford County, Tennessee in 2000:
- 3,260 people in college dormitories (includes college quarters off campus)
- 958 people in nursing homes
- 541 people in local jails and other confinement facilities (including police lockups)
- 345 people in wards in general hospitals for patients who have no usual home elsewhere
- 162 people in other noninstitutional group quarters
- 157 people in institutions for the blind
- 100 people in homes for the mentally retarded
- 92 people in other types of correctional institutions
- 38 people in other workers' dormitories
- 34 people in homes for the mentally ill
- 28 people in homes or halfway houses for drug/alcohol abuse
- 24 people in unknown juvenile institutions
- 19 people in other group homes
- 8 people in religious group quarters
- 4 people in other nonhousehold living situations
- 2 people in agriculture workers' dormitories on farms
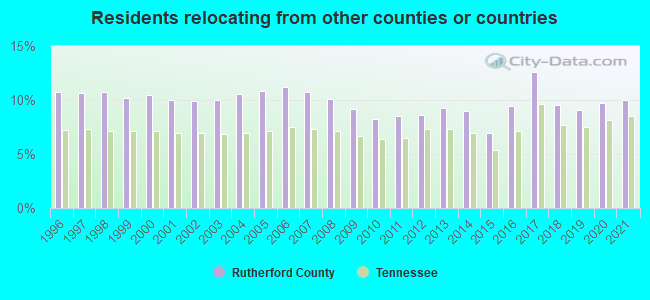
9.99% of this county's 2021 resident taxpayers lived in other counties in 2020 ($55,451 average adjusted gross income)
| Here: | 9.99% |
| Tennessee average: | 8.49% |
0.02% of residents moved from foreign countries ($78 average AGI)
Rutherford County: 0.02% Tennessee average: 0.02%
6.02% relocated from other counties in Tennessee ($30,116 average AGI)
3.95% relocated from other states ($25,257 average AGI)
Rutherford County: 3.95% Tennessee average: 4.34%
Top counties from which taxpayers relocated into this county between 2020 and 2021:
| from Davidson County, TN | |
| from Williamson County, TN | |
| from Wilson County, TN | |
| from Bedford County, TN | |
| from Sumner County, TN | |
| from Coffee County, TN | |
| from Shelby County, TN |
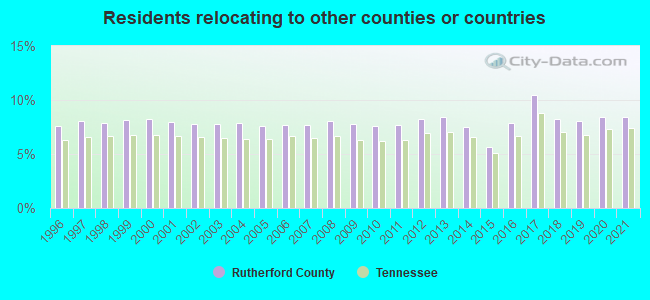
8.46% of this county's 2020 resident taxpayers moved to other counties in 2021 ($51,348 average adjusted gross income)
| Here: | 8.46% |
| Tennessee average: | 7.40% |
0.02% of residents moved to foreign countries ($159 average AGI)
Rutherford County: 0.02% Tennessee average: 0.01%
5.42% relocated to other counties in Tennessee ($31,747 average AGI)
3.02% relocated to other states ($19,442 average AGI)
Rutherford County: 3.02% Tennessee average: 3.20%
Top counties to which taxpayers relocated from this county between 2020 and 2021:
| to Davidson County, TN | |
| to Bedford County, TN | |
| to Wilson County, TN | |
| to Coffee County, TN | |
| to Williamson County, TN | |
| to Sumner County, TN | |
| to Montgomery County, TN |
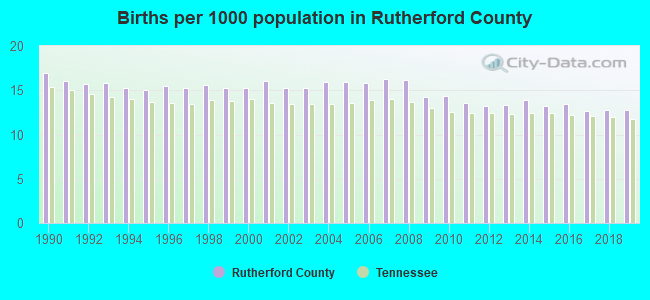
Births per 1000 population from 1990 to 1999: 15.6
Births per 1000 population from 2000 to 2009: 15.6
Births per 1000 population from 2010 to 2022: 11.2
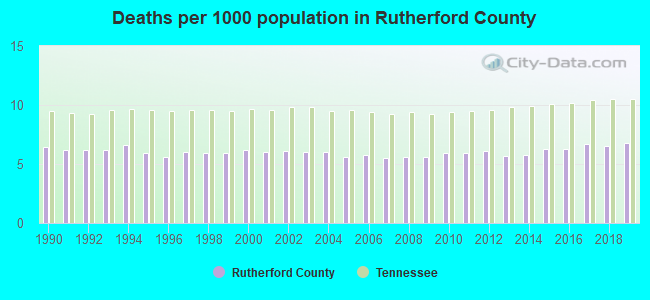
Deaths per 1000 population from 1990 to 1999: 6.1
Deaths per 1000 population from 2000 to 2009: 5.8
Deaths per 1000 population from 2010 to 2020: 6.3
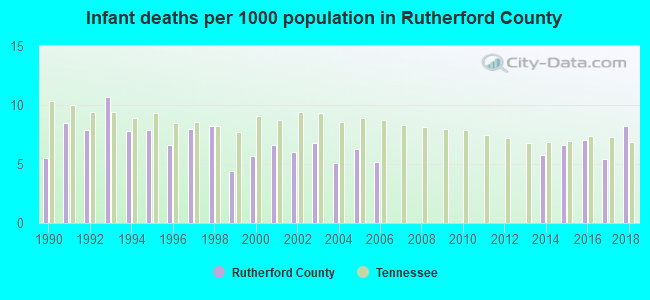
Infant deaths per 1000 live births from 1990 to 1999: 7.6
Infant deaths per 1000 live births from 2000 to 2009: 4.2
Infant deaths per 1000 live births from 2010 to 2021: 4.2
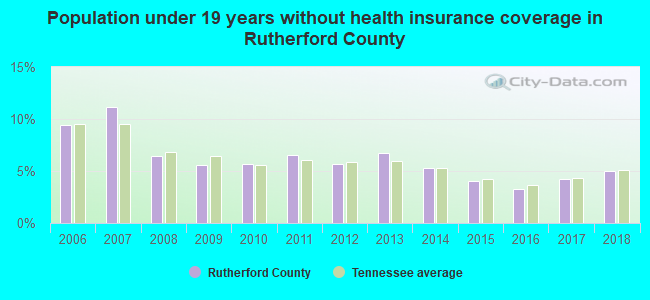
Persons under 19 years old without health insurance coverage in 2018: 5.0%

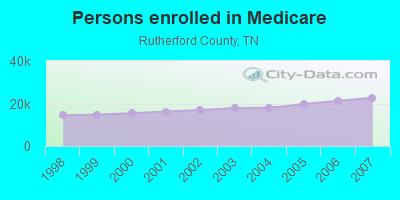
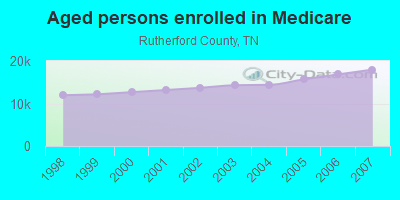
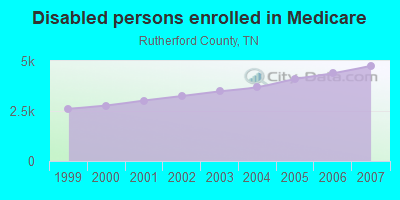
Persons enrolled in hospital insurance and/or supplemental medical insurance (Medicare) in July 1, 2007: 22,739 (17,980 aged, 4,759 disabled)
Children under 18 without health insurance coverage in 2007: 5,221 (7%)
Most common underlying causes of death in Rutherford County, Tennessee in 1999 - 2019:
- Bronchus or lung, unspecified - Malignant neoplasms (2,197)
- Acute myocardial infarction, unspecified (1,966)
- Atherosclerotic heart disease (1,946)
- Chronic obstructive pulmonary disease, unspecified (1,477)
- Alzheimer disease, unspecified (1,396)
- Atherosclerotic cardiovascular disease, so described (1,114)
- Stroke, not specified as haemorrhage or infarction (889)
- Unspecified dementia (682)
- Pneumonia, unspecified (655)
- Colon, unspecified - Malignant neoplasms (526)
Population without health insurance coverage in 2000: 10%
Children under 18 without health insurance coverage in 2000: 7%
Short term general hospital admissions per 100,000 population in 2004: 6,187
Short term general hospital beds per 100,000 population in 2004: 95
Emergency room visits per 100,000 population in 2004: 28,331
General practice office based MDs per 100,000 population in 2005: 1,568
Medical specialist MDs per 100,000 population in 2005: 596
Dentists per 100,000 population in 1998: 8
Total births per 100,000 population, July 2005 - July 2006 : 35
Total deaths per 100,000 population, July 2005 - July 2006: 76
Limited-service eating places per 100,000 population in 2005 : 6
Beer, wine & liquor stores per 100,000 population in 2005: 1
Homicides per 1,000,000 population from 2000 to 2006: 36.3. This is less than state average.
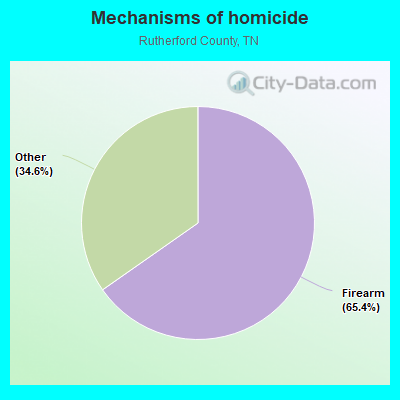
- Firearm - 23.7
- Other - 12.6
Suicides per 1,000,000 population from 2000 to 2006: 118.0. This is less than state average.
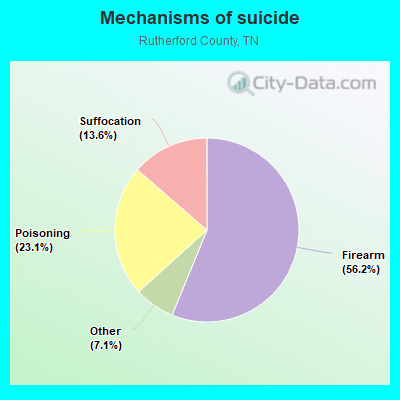
- Firearm - 66.3
- Poisoning - 27.2
- Suffocation - 16.1
- Other - 8.4
Household type by relationship:
Households: 360,619- Male householders: 65,876 (14,829 living alone), Female householders: 67,069 (15,505 living alone)
65,228 spouses (64,544 opposite-sex spouses), 12,817 unmarried partners, (12,144 opposite-sex unmarried partners), 108,314 children (101,156 natural, 2,465 adopted, 4,693 stepchildren), 9,314 grandchildren, 3,769 brothers or sisters, 3,183 parents, 0 foster children, 7,717 other relatives, 12,439 non-relatives
- In group quarters: 4,893
Size of family households: 38,795 2-persons, 22,794 3-persons, 17,037 4-persons, 10,238 5-persons, 2,629 6-persons, 1,942 7-or-more-persons.
Size of nonfamily households: 30,334 1-person, 7,076 2-persons, 696 3-persons, 1,105 4-persons, 252 5-persons, 47 7-or-more-persons.
52,053 married couples with children.
25,496 single-parent households (7,339 men, 18,157 women).
86.3% of residents of Rutherford speak English at home.
7.5% of residents speak Spanish at home (51% speak English very well, 23% speak English well, 18% speak English not well, 8% don't speak English at all).
1.4% of residents speak other Indo-European language at home (77% speak English very well, 13% speak English well, 2% speak English not well, 8% don't speak English at all).
2.9% of residents speak Asian or Pacific Island language at home (57% speak English very well, 20% speak English well, 19% speak English not well, 4% don't speak English at all).
2.1% of residents speak other language at home (64% speak English very well, 23% speak English well, 12% speak English not well, 1% don't speak English at all).
In fiscal year 2004:
Federal Government expenditure: $1,194,396,000 ($5,687 per capita)
Department of Defense expenditure: $55,117,000
Federal direct payments to individuals for retirement and disability: $333,571,000
Federal other direct payments to individuals: $128,996,000
Federal direct payments not to individuals: $1,515,000
Federal grants: $120,028,000
Federal procurement contracts: $503,099,000 ($4,479,000 Department of Defense)
Federal salaries and wages: $107,187,000 ($18,969,000 Department of Defense)
Federal Government direct loans: $859,000
Federal guaranteed/insured loans: $440,638,000
Federal Government insurance: $143,942,000
Population change from April 1, 2000 to July 1, 2005:
Births: 15,772| Here: | 72 per 1000 residents |
| State: | 69 per 1000 residents |
Deaths: 6,307
| Here: | 29 per 1000 residents |
| State: | 50 per 1000 residents |
Net international migration: +1,891
| Here: | +9 per 1000 residents |
| State: | +8 per 1000 residents |
Net internal migration: +25,304
| Here: | +116 per 1000 residents |
| State: | +18 per 1000 residents |
Total withdrawal of fresh water for public supply: 27.30 millions of gallons per day (all from surface)
| Here: | 6.5 |
| State: | 6.5 |
| Here: | 4.4 |
| State: | 4.4 |
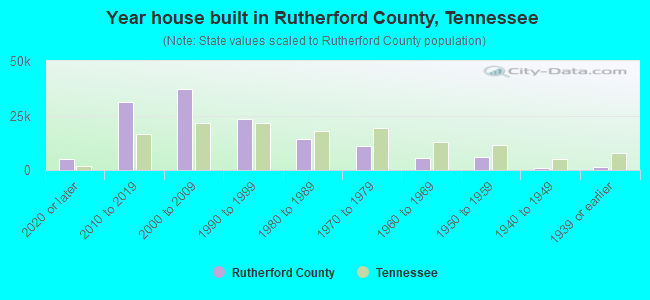
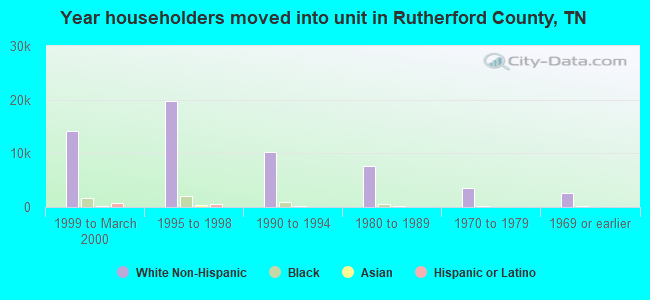
- Year house built in Rutherford County, Tennessee
- 9,4512020 or later
- 29,8302010 to 2019
- 31,5652000 to 2009
- 25,2761990 to 1999
- 18,6161980 to 1989
- 11,4931970 to 1979
- 4,8101960 to 1969
- 3,9671950 to 1959
- 1,7991940 to 1949
- 2,5331939 or earlier
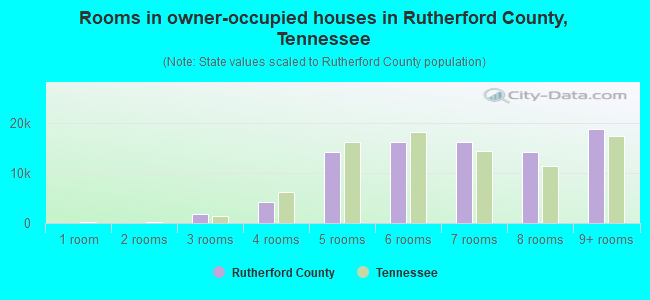
- Rooms in owner-occupied houses in Rutherford County, Tennessee
- 621 room
- 02 rooms
- 1,6783 rooms
- 6,3004 rooms
- 17,7675 rooms
- 16,7896 rooms
- 14,9587 rooms
- 12,2928 rooms
- 16,3419+ rooms
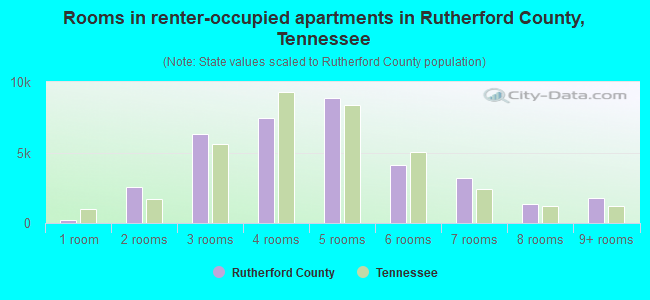
- Rooms in renter-occupied apartments in Rutherford County, Tennessee
- 1,4791 room
- 2,4612 rooms
- 8,0223 rooms
- 12,7634 rooms
- 9,3525 rooms
- 6,2926 rooms
- 3,3267 rooms
- 1,4248 rooms
- 1,6399+ rooms
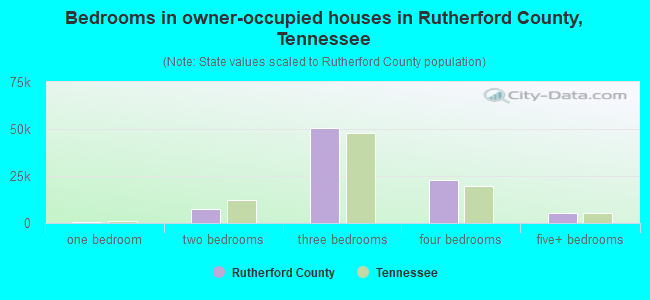
- Bedrooms in owner-occupied houses in Rutherford County, Tennessee
- 62no bedroom
- 1391 bedroom
- 8,1292 bedrooms
- 48,9233 bedrooms
- 23,8794 bedrooms
- 5,0555+ bedrooms
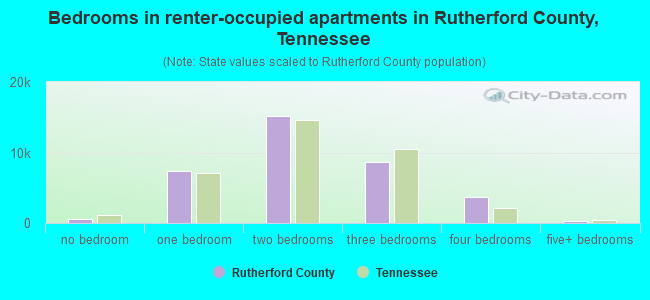
- Bedrooms in renter-occupied apartments in Rutherford County, Tennessee
- 1,749no bedroom
- 7,2411 bedroom
- 19,1372 bedrooms
- 15,4153 bedrooms
- 2,7324 bedrooms
- 4845+ bedrooms
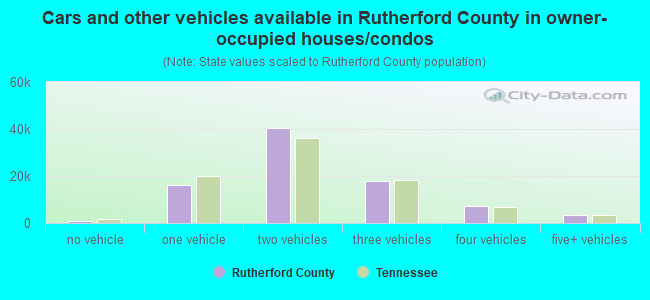
- Cars and other vehicles available in Rutherford County in owner-occupied houses/condos
- 1,126no vehicle
- 19,0721 vehicle
- 36,8032 vehicles
- 18,7813 vehicles
- 7,5584 vehicles
- 2,8475+ vehicles
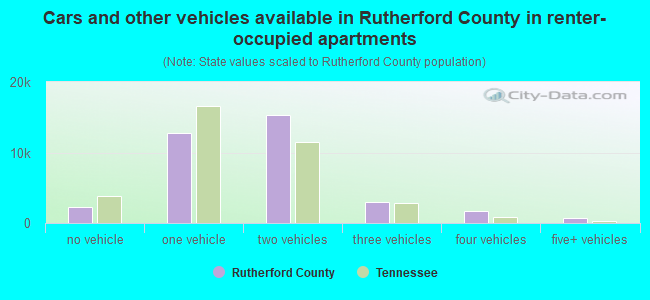
- Cars and other vehicles available in Rutherford County in renter-occupied apartments
- 2,771no vehicle
- 20,2911 vehicle
- 16,5372 vehicles
- 4,5813 vehicles
- 2,2504 vehicles
- 3285+ vehicles
83.7% of Rutherford County residents lived in the same house 1 years ago.
Out of people who lived in different houses, 31% lived in this county.
Out of people who lived in different counties, 64% lived in Tennessee.
| Rutherford County: | 83.7% |
| State average: | 87.0% |
Place of birth for U.S.-born residents:
- This state: 189,893
- Other state: 125,563
- Northeast: 18,159
- Midwest: 38,702
- South: 50,375
- West: 18,327
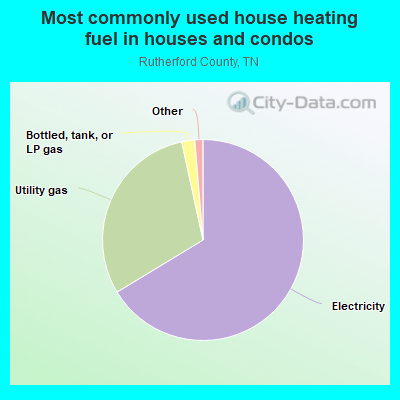
- 66.1%Electricity
- 30.5%Utility gas
- 2.0%Bottled, tank, or LP gas
- 0.6%No fuel used
- 0.6%Wood
- 0.2%Other fuel
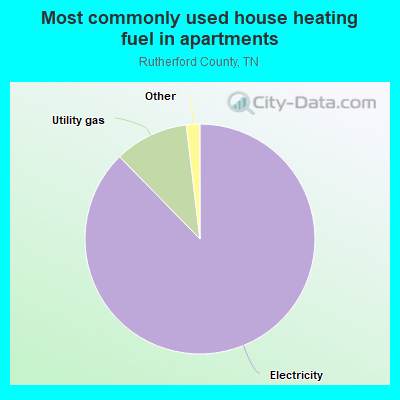
- 86.7%Electricity
- 11.6%Utility gas
- 0.7%No fuel used
- 0.6%Bottled, tank, or LP gas
- 0.3%Other fuel
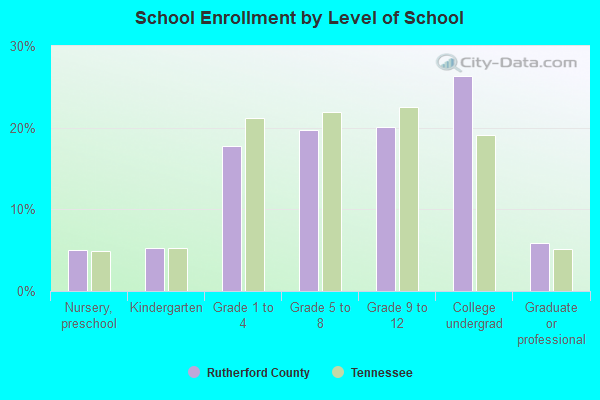
Private vs. public school enrollment:
| Here: | 9.4% |
| Tennessee: | 15.0% |
| Here: | 14.3% |
| Tennessee: | 16.2% |
| Here: | 13.8% |
| Tennessee: | 23.5% |
Rutherford County government finances - Expenditure in 2020:
- Bond Funds - Cash and Securities: $64,035,000
Cash and Securities: $28,416,000
- Charges - Other: $34,859,000
Other: $26,762,000
Elementary and Secondary Education - Other: $22,183,000
Elementary and Secondary Education - Other: $17,865,000
Elementary and Secondary Education School Lunch: $7,084,000
Elementary and Secondary Education School Lunch: $6,357,000
Solid Waste Management: $2,285,000
Solid Waste Management: $1,107,000
Elementary and Secondary Education School Tuition and Transportation: $69,000
Elementary and Secondary Education School Tuition and Transportation: $54,000
- Construction - Elementary and Secondary Education: $120,544,000
Judicial and Legal Services: $20,735,000
Elementary and Secondary Education: $19,264,000
Police Protection: $2,144,000
Regular Highways: $1,297,000
Central Staff Services: $1,241,000
Financial Administration: $704,000
Correctional Institutions: $258,000
Health - Other: $121,000
Health - Other: $89,000
Regular Highways: $46,000
Judicial and Legal Services: $18,000
Solid Waste Management: $11,000
- Current Operations - Elementary and Secondary Education: $444,853,000
Elementary and Secondary Education: $399,297,000
Police Protection: $26,283,000
Correctional Institutions: $25,308,000
Correctional Institutions: $23,837,000
Police Protection: $23,283,000
Health - Other: $19,479,000
Health - Other: $17,839,000
Judicial and Legal Services: $12,278,000
Central Staff Services: $12,216,000
Central Staff Services: $11,038,000
Judicial and Legal Services: $10,277,000
Financial Administration: $10,135,000
Public Welfare Institutions: $9,848,000
Public Welfare Institutions: $9,726,000
Regular Highways: $9,704,000
Financial Administration: $9,255,000
Regular Highways: $8,247,000
General - Other: $4,282,000
Solid Waste Management: $4,167,000
General - Other: $4,100,000
Solid Waste Management: $3,800,000
Local Fire Protection: $3,703,000
Local Fire Protection: $2,325,000
Libraries: $1,801,000
Corrections - Other: $1,788,000
Corrections - Other: $1,680,000
Libraries: $1,600,000
Natural Resources - Other: $1,120,000
Protective Inspection and Regulation - Other: $1,082,000
Natural Resources - Other: $1,031,000
Protective Inspection and Regulation - Other: $947,000
Public Welfare - Other: $829,000
Public Welfare - Other: $780,000
Parks and Recreation: $491,000
Parks and Recreation: $453,000
- Federal Intergovernmental - Other: $1,702,000
Education: $729,000
Education: $607,000
Other: $388,000
General Local Government Support: $9,000
General Local Government Support: $9,000
- General - Interest on Debt: $18,144,000
Interest on Debt: $17,057,000
- Intergovernmental to Local - Other - General - Other: $30,830,000
Other - General - Other: $2,003,000
- Local Intergovernmental - Other: $1,298,000
Other: $978,000
General Local Government Support: $198,000
General Local Government Support: $167,000
Education: $65,000
Education: $41,000
- Long Term Debt - Beginning Outstanding - Unspecified Public Purpose: $463,683,000
Outstanding Unspecified Public Purpose: $456,477,000
Outstanding Unspecified Public Purpose: $442,239,000
Beginning Outstanding - Unspecified Public Purpose: $404,592,000
Issue, Unspecified Public Purpose: $82,169,000
Retired Unspecified Public Purpose: $36,583,000
Retired Unspecified Public Purpose: $30,284,000
Beginning Outstanding - Public Debt for Private Purpose: $20,508,000
Outstanding Nonguaranteed - Industrial Revenue: $20,267,000
Beginning Outstanding - Public Debt for Private Purpose: $20,026,000
Outstanding Nonguaranteed - Industrial Revenue: $19,785,000
Issue, Unspecified Public Purpose: $15,139,000
Retired Nonguaranteed - Public Debt for Private Purpose: $241,000
Retired Nonguaranteed - Public Debt for Private Purpose: $241,000
- Miscellaneous - General Revenue - Other: $19,337,000
General Revenue - Other: $7,771,000
Interest Earnings: $6,522,000
Special Assessments: $5,807,000
Interest Earnings: $3,666,000
Fines and Forfeits: $2,559,000
Fines and Forfeits: $2,156,000
Donations From Private Sources: $344,000
Rents: $332,000
Rents: $310,000
Sale of Property: $288,000
Donations From Private Sources: $155,000
Sale of Property: $101,000
- Other Capital Outlay - Elementary and Secondary Education: $22,453,000
Elementary and Secondary Education: $14,975,000
Police Protection: $14,007,000
Central Staff Services: $2,747,000
Local Fire Protection: $2,188,000
Police Protection: $1,974,000
Judicial and Legal Services: $1,809,000
Local Fire Protection: $1,356,000
Health - Other: $728,000
Financial Administration: $712,000
Regular Highways: $669,000
Health - Other: $630,000
Regular Highways: $611,000
Financial Administration: $592,000
General - Other: $424,000
Correctional Institutions: $372,000
Central Staff Services: $342,000
Solid Waste Management: $300,000
General - Other: $262,000
Public Welfare Institutions: $161,000
Correctional Institutions: $155,000
Solid Waste Management: $66,000
Natural Resources - Other: $57,000
Judicial and Legal Services: $46,000
Protective Inspection and Regulation - Other: $44,000
Protective Inspection and Regulation - Other: $2,000
Natural Resources - Other: $1,000
- Other Funds - Cash and Securities: $235,734,000
Cash and Securities: $119,034,000
- Sinking Funds - Cash and Securities: $47,080,000
Cash and Securities: $28,251,000
- State Intergovernmental - Education: $260,986,000
Education: $243,711,000
General Local Government Support: $6,472,000
General Local Government Support: $6,452,000
Highways: $6,300,000
Highways: $5,369,000
Other: $3,432,000
Health and Hospitals: $2,327,000
Health and Hospitals: $2,066,000
Other: $1,830,000
Public Welfare: $365,000
Public Welfare: $235,000
Housing and Community Development: $155,000
- Tax - Property: $171,524,000
Property: $152,564,000
General Sales and Gross Receipts: $17,413,000
General Sales and Gross Receipts: $15,124,000
Other Selective Sales: $13,601,000
Other Selective Sales: $8,409,000
Motor Vehicle License: $8,389,000
Motor Vehicle License: $7,955,000
Other License: $1,600,000
Alcoholic Beverage Sales: $1,078,000
Other License: $1,035,000
Alcoholic Beverage Sales: $1,019,000
Public Utilities Sales: $990,000
Severance: $456,000
Severance: $445,000
- Total Salaries and Wages: $259,875,000
: $231,353,000
Rutherford County government finances - Revenue in 2020:
- Bond Funds - Cash and Securities: $64,035,000
Cash and Securities: $28,416,000
- Charges - Other: $34,859,000
Other: $26,762,000
Elementary and Secondary Education - Other: $22,183,000
Elementary and Secondary Education - Other: $17,865,000
Elementary and Secondary Education School Lunch: $7,084,000
Elementary and Secondary Education School Lunch: $6,357,000
Solid Waste Management: $2,285,000
Solid Waste Management: $1,107,000
Elementary and Secondary Education School Tuition and Transportation: $69,000
Elementary and Secondary Education School Tuition and Transportation: $54,000
- Construction - Elementary and Secondary Education: $120,544,000
Judicial and Legal Services: $20,735,000
Elementary and Secondary Education: $19,264,000
Police Protection: $2,144,000
Regular Highways: $1,297,000
Central Staff Services: $1,241,000
Financial Administration: $704,000
Correctional Institutions: $258,000
Health - Other: $121,000
Health - Other: $89,000
Regular Highways: $46,000
Judicial and Legal Services: $18,000
Solid Waste Management: $11,000
- Current Operations - Elementary and Secondary Education: $444,853,000
Elementary and Secondary Education: $399,297,000
Police Protection: $26,283,000
Correctional Institutions: $25,308,000
Correctional Institutions: $23,837,000
Police Protection: $23,283,000
Health - Other: $19,479,000
Health - Other: $17,839,000
Judicial and Legal Services: $12,278,000
Central Staff Services: $12,216,000
Central Staff Services: $11,038,000
Judicial and Legal Services: $10,277,000
Financial Administration: $10,135,000
Public Welfare Institutions: $9,848,000
Public Welfare Institutions: $9,726,000
Regular Highways: $9,704,000
Financial Administration: $9,255,000
Regular Highways: $8,247,000
General - Other: $4,282,000
Solid Waste Management: $4,167,000
General - Other: $4,100,000
Solid Waste Management: $3,800,000
Local Fire Protection: $3,703,000
Local Fire Protection: $2,325,000
Libraries: $1,801,000
Corrections - Other: $1,788,000
Corrections - Other: $1,680,000
Libraries: $1,600,000
Natural Resources - Other: $1,120,000
Protective Inspection and Regulation - Other: $1,082,000
Natural Resources - Other: $1,031,000
Protective Inspection and Regulation - Other: $947,000
Public Welfare - Other: $829,000
Public Welfare - Other: $780,000
Parks and Recreation: $491,000
Parks and Recreation: $453,000
- Federal Intergovernmental - Other: $1,702,000
Education: $729,000
Education: $607,000
Other: $388,000
General Local Government Support: $9,000
General Local Government Support: $9,000
- General - Interest on Debt: $18,144,000
Interest on Debt: $17,057,000
- Intergovernmental to Local - Other - General - Other: $30,830,000
Other - General - Other: $2,003,000
- Local Intergovernmental - Other: $1,298,000
Other: $978,000
General Local Government Support: $198,000
General Local Government Support: $167,000
Education: $65,000
Education: $41,000
- Long Term Debt - Beginning Outstanding - Unspecified Public Purpose: $463,683,000
Outstanding Unspecified Public Purpose: $456,477,000
Outstanding Unspecified Public Purpose: $442,239,000
Beginning Outstanding - Unspecified Public Purpose: $404,592,000
Issue, Unspecified Public Purpose: $82,169,000
Retired Unspecified Public Purpose: $36,583,000
Retired Unspecified Public Purpose: $30,284,000
Beginning Outstanding - Public Debt for Private Purpose: $20,508,000
Outstanding Nonguaranteed - Industrial Revenue: $20,267,000
Beginning Outstanding - Public Debt for Private Purpose: $20,026,000
Outstanding Nonguaranteed - Industrial Revenue: $19,785,000
Issue, Unspecified Public Purpose: $15,139,000
Retired Nonguaranteed - Public Debt for Private Purpose: $241,000
Retired Nonguaranteed - Public Debt for Private Purpose: $241,000
- Miscellaneous - General Revenue - Other: $19,337,000
General Revenue - Other: $7,771,000
Interest Earnings: $6,522,000
Special Assessments: $5,807,000
Interest Earnings: $3,666,000
Fines and Forfeits: $2,559,000
Fines and Forfeits: $2,156,000
Donations From Private Sources: $344,000
Rents: $332,000
Rents: $310,000
Sale of Property: $288,000
Donations From Private Sources: $155,000
Sale of Property: $101,000
- Other Capital Outlay - Elementary and Secondary Education: $22,453,000
Elementary and Secondary Education: $14,975,000
Police Protection: $14,007,000
Central Staff Services: $2,747,000
Local Fire Protection: $2,188,000
Police Protection: $1,974,000
Judicial and Legal Services: $1,809,000
Local Fire Protection: $1,356,000
Health - Other: $728,000
Financial Administration: $712,000
Regular Highways: $669,000
Health - Other: $630,000
Regular Highways: $611,000
Financial Administration: $592,000
General - Other: $424,000
Correctional Institutions: $372,000
Central Staff Services: $342,000
Solid Waste Management: $300,000
General - Other: $262,000
Public Welfare Institutions: $161,000
Correctional Institutions: $155,000
Solid Waste Management: $66,000
Natural Resources - Other: $57,000
Judicial and Legal Services: $46,000
Protective Inspection and Regulation - Other: $44,000
Protective Inspection and Regulation - Other: $2,000
Natural Resources - Other: $1,000
- Other Funds - Cash and Securities: $235,734,000
Cash and Securities: $119,034,000
- Sinking Funds - Cash and Securities: $47,080,000
Cash and Securities: $28,251,000
- State Intergovernmental - Education: $260,986,000
Education: $243,711,000
General Local Government Support: $6,472,000
General Local Government Support: $6,452,000
Highways: $6,300,000
Highways: $5,369,000
Other: $3,432,000
Health and Hospitals: $2,327,000
Health and Hospitals: $2,066,000
Other: $1,830,000
Public Welfare: $365,000
Public Welfare: $235,000
Housing and Community Development: $155,000
- Tax - Property: $171,524,000
Property: $152,564,000
General Sales and Gross Receipts: $17,413,000
General Sales and Gross Receipts: $15,124,000
Other Selective Sales: $13,601,000
Other Selective Sales: $8,409,000
Motor Vehicle License: $8,389,000
Motor Vehicle License: $7,955,000
Other License: $1,600,000
Alcoholic Beverage Sales: $1,078,000
Other License: $1,035,000
Alcoholic Beverage Sales: $1,019,000
Public Utilities Sales: $990,000
Severance: $456,000
Severance: $445,000
- Total Salaries and Wages: $259,875,000
: $231,353,000
Rutherford County government finances - Debt in 2020:
- Bond Funds - Cash and Securities: $64,035,000
Cash and Securities: $28,416,000
- Charges - Other: $34,859,000
Other: $26,762,000
Elementary and Secondary Education - Other: $22,183,000
Elementary and Secondary Education - Other: $17,865,000
Elementary and Secondary Education School Lunch: $7,084,000
Elementary and Secondary Education School Lunch: $6,357,000
Solid Waste Management: $2,285,000
Solid Waste Management: $1,107,000
Elementary and Secondary Education School Tuition and Transportation: $69,000
Elementary and Secondary Education School Tuition and Transportation: $54,000
- Construction - Elementary and Secondary Education: $120,544,000
Judicial and Legal Services: $20,735,000
Elementary and Secondary Education: $19,264,000
Police Protection: $2,144,000
Regular Highways: $1,297,000
Central Staff Services: $1,241,000
Financial Administration: $704,000
Correctional Institutions: $258,000
Health - Other: $121,000
Health - Other: $89,000
Regular Highways: $46,000
Judicial and Legal Services: $18,000
Solid Waste Management: $11,000
- Current Operations - Elementary and Secondary Education: $444,853,000
Elementary and Secondary Education: $399,297,000
Police Protection: $26,283,000
Correctional Institutions: $25,308,000
Correctional Institutions: $23,837,000
Police Protection: $23,283,000
Health - Other: $19,479,000
Health - Other: $17,839,000
Judicial and Legal Services: $12,278,000
Central Staff Services: $12,216,000
Central Staff Services: $11,038,000
Judicial and Legal Services: $10,277,000
Financial Administration: $10,135,000
Public Welfare Institutions: $9,848,000
Public Welfare Institutions: $9,726,000
Regular Highways: $9,704,000
Financial Administration: $9,255,000
Regular Highways: $8,247,000
General - Other: $4,282,000
Solid Waste Management: $4,167,000
General - Other: $4,100,000
Solid Waste Management: $3,800,000
Local Fire Protection: $3,703,000
Local Fire Protection: $2,325,000
Libraries: $1,801,000
Corrections - Other: $1,788,000
Corrections - Other: $1,680,000
Libraries: $1,600,000
Natural Resources - Other: $1,120,000
Protective Inspection and Regulation - Other: $1,082,000
Natural Resources - Other: $1,031,000
Protective Inspection and Regulation - Other: $947,000
Public Welfare - Other: $829,000
Public Welfare - Other: $780,000
Parks and Recreation: $491,000
Parks and Recreation: $453,000
- Federal Intergovernmental - Other: $1,702,000
Education: $729,000
Education: $607,000
Other: $388,000
General Local Government Support: $9,000
General Local Government Support: $9,000
- General - Interest on Debt: $18,144,000
Interest on Debt: $17,057,000
- Intergovernmental to Local - Other - General - Other: $30,830,000
Other - General - Other: $2,003,000
- Local Intergovernmental - Other: $1,298,000
Other: $978,000
General Local Government Support: $198,000
General Local Government Support: $167,000
Education: $65,000
Education: $41,000
- Long Term Debt - Beginning Outstanding - Unspecified Public Purpose: $463,683,000
Outstanding Unspecified Public Purpose: $456,477,000
Outstanding Unspecified Public Purpose: $442,239,000
Beginning Outstanding - Unspecified Public Purpose: $404,592,000
Issue, Unspecified Public Purpose: $82,169,000
Retired Unspecified Public Purpose: $36,583,000
Retired Unspecified Public Purpose: $30,284,000
Beginning Outstanding - Public Debt for Private Purpose: $20,508,000
Outstanding Nonguaranteed - Industrial Revenue: $20,267,000
Beginning Outstanding - Public Debt for Private Purpose: $20,026,000
Outstanding Nonguaranteed - Industrial Revenue: $19,785,000
Issue, Unspecified Public Purpose: $15,139,000
Retired Nonguaranteed - Public Debt for Private Purpose: $241,000
Retired Nonguaranteed - Public Debt for Private Purpose: $241,000
- Miscellaneous - General Revenue - Other: $19,337,000
General Revenue - Other: $7,771,000
Interest Earnings: $6,522,000
Special Assessments: $5,807,000
Interest Earnings: $3,666,000
Fines and Forfeits: $2,559,000
Fines and Forfeits: $2,156,000
Donations From Private Sources: $344,000
Rents: $332,000
Rents: $310,000
Sale of Property: $288,000
Donations From Private Sources: $155,000
Sale of Property: $101,000
- Other Capital Outlay - Elementary and Secondary Education: $22,453,000
Elementary and Secondary Education: $14,975,000
Police Protection: $14,007,000
Central Staff Services: $2,747,000
Local Fire Protection: $2,188,000
Police Protection: $1,974,000
Judicial and Legal Services: $1,809,000
Local Fire Protection: $1,356,000
Health - Other: $728,000
Financial Administration: $712,000
Regular Highways: $669,000
Health - Other: $630,000
Regular Highways: $611,000
Financial Administration: $592,000
General - Other: $424,000
Correctional Institutions: $372,000
Central Staff Services: $342,000
Solid Waste Management: $300,000
General - Other: $262,000
Public Welfare Institutions: $161,000
Correctional Institutions: $155,000
Solid Waste Management: $66,000
Natural Resources - Other: $57,000
Judicial and Legal Services: $46,000
Protective Inspection and Regulation - Other: $44,000
Protective Inspection and Regulation - Other: $2,000
Natural Resources - Other: $1,000
- Other Funds - Cash and Securities: $235,734,000
Cash and Securities: $119,034,000
- Sinking Funds - Cash and Securities: $47,080,000
Cash and Securities: $28,251,000
- State Intergovernmental - Education: $260,986,000
Education: $243,711,000
General Local Government Support: $6,472,000
General Local Government Support: $6,452,000
Highways: $6,300,000
Highways: $5,369,000
Other: $3,432,000
Health and Hospitals: $2,327,000
Health and Hospitals: $2,066,000
Other: $1,830,000
Public Welfare: $365,000
Public Welfare: $235,000
Housing and Community Development: $155,000
- Tax - Property: $171,524,000
Property: $152,564,000
General Sales and Gross Receipts: $17,413,000
General Sales and Gross Receipts: $15,124,000
Other Selective Sales: $13,601,000
Other Selective Sales: $8,409,000
Motor Vehicle License: $8,389,000
Motor Vehicle License: $7,955,000
Other License: $1,600,000
Alcoholic Beverage Sales: $1,078,000
Other License: $1,035,000
Alcoholic Beverage Sales: $1,019,000
Public Utilities Sales: $990,000
Severance: $456,000
Severance: $445,000
- Total Salaries and Wages: $259,875,000
: $231,353,000
Rutherford County government finances - Cash and Securities in 2020:
- Bond Funds - Cash and Securities: $64,035,000
Cash and Securities: $28,416,000
- Charges - Other: $34,859,000
Other: $26,762,000
Elementary and Secondary Education - Other: $22,183,000
Elementary and Secondary Education - Other: $17,865,000
Elementary and Secondary Education School Lunch: $7,084,000
Elementary and Secondary Education School Lunch: $6,357,000
Solid Waste Management: $2,285,000
Solid Waste Management: $1,107,000
Elementary and Secondary Education School Tuition and Transportation: $69,000
Elementary and Secondary Education School Tuition and Transportation: $54,000
- Construction - Elementary and Secondary Education: $120,544,000
Judicial and Legal Services: $20,735,000
Elementary and Secondary Education: $19,264,000
Police Protection: $2,144,000
Regular Highways: $1,297,000
Central Staff Services: $1,241,000
Financial Administration: $704,000
Correctional Institutions: $258,000
Health - Other: $121,000
Health - Other: $89,000
Regular Highways: $46,000
Judicial and Legal Services: $18,000
Solid Waste Management: $11,000
- Current Operations - Elementary and Secondary Education: $444,853,000
Elementary and Secondary Education: $399,297,000
Police Protection: $26,283,000
Correctional Institutions: $25,308,000
Correctional Institutions: $23,837,000
Police Protection: $23,283,000
Health - Other: $19,479,000
Health - Other: $17,839,000
Judicial and Legal Services: $12,278,000
Central Staff Services: $12,216,000
Central Staff Services: $11,038,000
Judicial and Legal Services: $10,277,000
Financial Administration: $10,135,000
Public Welfare Institutions: $9,848,000
Public Welfare Institutions: $9,726,000
Regular Highways: $9,704,000
Financial Administration: $9,255,000
Regular Highways: $8,247,000
General - Other: $4,282,000
Solid Waste Management: $4,167,000
General - Other: $4,100,000
Solid Waste Management: $3,800,000
Local Fire Protection: $3,703,000
Local Fire Protection: $2,325,000
Libraries: $1,801,000
Corrections - Other: $1,788,000
Corrections - Other: $1,680,000
Libraries: $1,600,000
Natural Resources - Other: $1,120,000
Protective Inspection and Regulation - Other: $1,082,000
Natural Resources - Other: $1,031,000
Protective Inspection and Regulation - Other: $947,000
Public Welfare - Other: $829,000
Public Welfare - Other: $780,000
Parks and Recreation: $491,000
Parks and Recreation: $453,000
- Federal Intergovernmental - Other: $1,702,000
Education: $729,000
Education: $607,000
Other: $388,000
General Local Government Support: $9,000
General Local Government Support: $9,000
- General - Interest on Debt: $18,144,000
Interest on Debt: $17,057,000
- Intergovernmental to Local - Other - General - Other: $30,830,000
Other - General - Other: $2,003,000
- Local Intergovernmental - Other: $1,298,000
Other: $978,000
General Local Government Support: $198,000
General Local Government Support: $167,000
Education: $65,000
Education: $41,000
- Long Term Debt - Beginning Outstanding - Unspecified Public Purpose: $463,683,000
Outstanding Unspecified Public Purpose: $456,477,000
Outstanding Unspecified Public Purpose: $442,239,000
Beginning Outstanding - Unspecified Public Purpose: $404,592,000
Issue, Unspecified Public Purpose: $82,169,000
Retired Unspecified Public Purpose: $36,583,000
Retired Unspecified Public Purpose: $30,284,000
Beginning Outstanding - Public Debt for Private Purpose: $20,508,000
Outstanding Nonguaranteed - Industrial Revenue: $20,267,000
Beginning Outstanding - Public Debt for Private Purpose: $20,026,000
Outstanding Nonguaranteed - Industrial Revenue: $19,785,000
Issue, Unspecified Public Purpose: $15,139,000
Retired Nonguaranteed - Public Debt for Private Purpose: $241,000
Retired Nonguaranteed - Public Debt for Private Purpose: $241,000
- Miscellaneous - General Revenue - Other: $19,337,000
General Revenue - Other: $7,771,000
Interest Earnings: $6,522,000
Special Assessments: $5,807,000
Interest Earnings: $3,666,000
Fines and Forfeits: $2,559,000
Fines and Forfeits: $2,156,000
Donations From Private Sources: $344,000
Rents: $332,000
Rents: $310,000
Sale of Property: $288,000
Donations From Private Sources: $155,000
Sale of Property: $101,000
- Other Capital Outlay - Elementary and Secondary Education: $22,453,000
Elementary and Secondary Education: $14,975,000
Police Protection: $14,007,000
Central Staff Services: $2,747,000
Local Fire Protection: $2,188,000
Police Protection: $1,974,000
Judicial and Legal Services: $1,809,000
Local Fire Protection: $1,356,000
Health - Other: $728,000
Financial Administration: $712,000
Regular Highways: $669,000
Health - Other: $630,000
Regular Highways: $611,000
Financial Administration: $592,000
General - Other: $424,000
Correctional Institutions: $372,000
Central Staff Services: $342,000
Solid Waste Management: $300,000
General - Other: $262,000
Public Welfare Institutions: $161,000
Correctional Institutions: $155,000
Solid Waste Management: $66,000
Natural Resources - Other: $57,000
Judicial and Legal Services: $46,000
Protective Inspection and Regulation - Other: $44,000
Protective Inspection and Regulation - Other: $2,000
Natural Resources - Other: $1,000
- Other Funds - Cash and Securities: $235,734,000
Cash and Securities: $119,034,000
- Sinking Funds - Cash and Securities: $47,080,000
Cash and Securities: $28,251,000
- State Intergovernmental - Education: $260,986,000
Education: $243,711,000
General Local Government Support: $6,472,000
General Local Government Support: $6,452,000
Highways: $6,300,000
Highways: $5,369,000
Other: $3,432,000
Health and Hospitals: $2,327,000
Health and Hospitals: $2,066,000
Other: $1,830,000
Public Welfare: $365,000
Public Welfare: $235,000
Housing and Community Development: $155,000
- Tax - Property: $171,524,000
Property: $152,564,000
General Sales and Gross Receipts: $17,413,000
General Sales and Gross Receipts: $15,124,000
Other Selective Sales: $13,601,000
Other Selective Sales: $8,409,000
Motor Vehicle License: $8,389,000
Motor Vehicle License: $7,955,000
Other License: $1,600,000
Alcoholic Beverage Sales: $1,078,000
Other License: $1,035,000
Alcoholic Beverage Sales: $1,019,000
Public Utilities Sales: $990,000
Severance: $456,000
Severance: $445,000
- Total Salaries and Wages: $259,875,000
: $231,353,000
Supplemental Security Income (SSI) in 2006:
- Total number of recipients: 2,720
- Number of aged recipients: 303
- Number of blind and disabled recipients: 2,417
- Number of recipients under 18: 514
- Number of recipients between 18 and 64: 1,645
- Number of recipients older than 64: 561
- Number of recipients also receiving OASDI: 972
- Amount of payments (thousands of dollars): 1,338
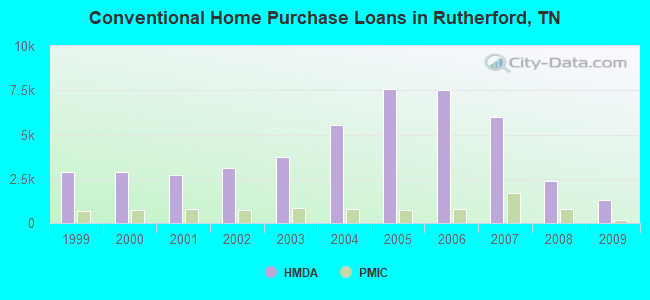
| Home Mortgage Disclosure Act Aggregated Statistics For Year 2009 (Based on 26 full tracts) | ||||||||||||||
| A) FHA, FSA/RHS & VA Home Purchase Loans | B) Conventional Home Purchase Loans | C) Refinancings | D) Home Improvement Loans | E) Loans on Dwellings For 5+ Families | F) Non-occupant Loans on < 5 Family Dwellings (A B C & D) | G) Loans On Manufactured Home Dwelling (A B C & D) | ||||||||
|---|---|---|---|---|---|---|---|---|---|---|---|---|---|---|
| Number | Average Value | Number | Average Value | Number | Average Value | Number | Average Value | Number | Average Value | Number | Average Value | Number | Average Value | |
| LOANS ORIGINATED | 2,553 | $145,675 | 1,308 | $148,753 | 6,277 | $159,549 | 252 | $66,167 | 7 | $708,143 | 553 | $119,107 | 35 | $71,800 |
| APPLICATIONS APPROVED, NOT ACCEPTED | 72 | $135,611 | 55 | $152,800 | 515 | $154,878 | 42 | $33,405 | 0 | $0 | 20 | $98,500 | 7 | $68,571 |
| APPLICATIONS DENIED | 266 | $141,135 | 177 | $127,062 | 1,932 | $155,506 | 238 | $35,714 | 0 | $0 | 111 | $100,072 | 38 | $70,447 |
| APPLICATIONS WITHDRAWN | 300 | $151,527 | 289 | $153,522 | 1,574 | $161,167 | 53 | $49,472 | 1 | $2,727,000 | 74 | $115,595 | 16 | $81,750 |
| FILES CLOSED FOR INCOMPLETENESS | 50 | $159,860 | 35 | $133,314 | 395 | $160,251 | 16 | $111,062 | 0 | $0 | 16 | $104,125 | 0 | $0 |
| Private Mortgage Insurance Companies Aggregated Statistics For Year 2009 (Based on 25 full tracts) | ||||||
| A) Conventional Home Purchase Loans | B) Refinancings | C) Non-occupant Loans on < 5 Family Dwellings (A & B) | ||||
|---|---|---|---|---|---|---|
| Number | Average Value | Number | Average Value | Number | Average Value | |
| LOANS ORIGINATED | 183 | $175,044 | 262 | $189,588 | 5 | $148,600 |
| APPLICATIONS APPROVED, NOT ACCEPTED | 58 | $175,466 | 94 | $187,596 | 8 | $128,875 |
| APPLICATIONS DENIED | 24 | $145,125 | 44 | $220,773 | 3 | $95,000 |
| APPLICATIONS WITHDRAWN | 11 | $170,364 | 17 | $178,824 | 2 | $163,000 |
| FILES CLOSED FOR INCOMPLETENESS | 7 | $122,143 | 13 | $214,231 | 4 | $140,000 |
| Most common first names in Rutherford County, TN among deceased individuals | ||
| Name | Count | Lived (average) |
|---|---|---|
| James | 878 | 70.6 years |
| Mary | 718 | 78.6 years |
| William | 666 | 72.6 years |
| John | 617 | 72.3 years |
| Robert | 476 | 69.5 years |
| Charles | 294 | 69.0 years |
| George | 268 | 74.0 years |
| Willie | 240 | 77.5 years |
| Thomas | 226 | 70.3 years |
| Margaret | 188 | 78.0 years |
| Most common last names in Rutherford County, TN among deceased individuals | ||
| Last name | Count | Lived (average) |
|---|---|---|
| Smith | 391 | 74.6 years |
| Jones | 224 | 74.6 years |
| Brown | 205 | 73.5 years |
| Johnson | 176 | 73.5 years |
| Williams | 170 | 74.6 years |
| Davis | 151 | 72.5 years |
| Taylor | 128 | 74.5 years |
| Miller | 115 | 76.4 years |
| Barrett | 114 | 74.7 years |
| Harris | 114 | 73.9 years |
| Businesses in Rutherford County, TN | ||||
| Name | Count | Name | Count | |
|---|---|---|---|---|
| ALDI | 1 | La Quinta | 1 | |
| AT&T | 3 | La-Z-Boy | 1 | |
| Academy Sports + Outdoors | 1 | Lane Bryant | 1 | |
| Ace Hardware | 2 | Lane Furniture | 2 | |
| Advance Auto Parts | 6 | LensCrafters | 1 | |
| Aeropostale | 1 | Little Caesars Pizza | 5 | |
| American Eagle Outfitters | 1 | Long John Silver's | 2 | |
| Ann Taylor | 1 | Lowe's | 2 | |
| Applebee's | 1 | Marshalls | 1 | |
| Arby's | 6 | Maurices | 1 | |
| Ashley Furniture | 1 | McDonald's | 13 | |
| AutoZone | 6 | Men's Wearhouse | 2 | |
| Barnes & Noble | 1 | Microtel | 1 | |
| Baskin-Robbins | 3 | Motel 6 | 1 | |
| Bath & Body Works | 2 | Motherhood Maternity | 1 | |
| Baymont Inn | 1 | New Balance | 2 | |
| Bed Bath & Beyond | 1 | New York & Co | 2 | |
| Best Western | 1 | Nike | 14 | |
| Blockbuster | 2 | Nissan | 1 | |
| Budget Car Rental | 1 | OfficeMax | 1 | |
| Buffalo Wild Wings | 2 | Old Navy | 1 | |
| Burger King | 4 | Olive Garden | 1 | |
| CVS | 7 | Outback | 1 | |
| Charlotte Russe | 1 | Outback Steakhouse | 1 | |
| Chevrolet | 1 | Pac Sun | 1 | |
| Chick-Fil-A | 3 | Panda Express | 2 | |
| Chico's | 1 | Panera Bread | 1 | |
| Chuck E. Cheese's | 1 | Papa John's Pizza | 2 | |
| Church's Chicken | 1 | Payless | 2 | |
| Clarion | 1 | Penske | 3 | |
| Coldwater Creek | 1 | PetSmart | 2 | |
| ColorTyme | 1 | Pier 1 Imports | 1 | |
| Comfort Inn | 1 | Pizza Hut | 6 | |
| Comfort Suites | 2 | Plato's Closet | 1 | |
| Cracker Barrel | 3 | Publix Super Markets | 6 | |
| Cricket Wireless | 11 | Quality | 1 | |
| Curves | 3 | Quiznos | 5 | |
| DHL | 1 | RadioShack | 3 | |
| Dairy Queen | 3 | Ramada | 2 | |
| Days Inn | 1 | Red Lobster | 1 | |
| Discount Tire | 3 | Red Robin | 2 | |
| Domino's Pizza | 5 | Red Roof Inn | 1 | |
| DressBarn | 2 | Rite Aid | 6 | |
| Dressbarn | 1 | Rodeway Inn | 1 | |
| Dunkin Donuts | 1 | Ruby Tuesday | 2 | |
| Econo Lodge | 1 | Rue21 | 2 | |
| Express | 1 | Ryan's Grill | 1 | |
| Fashion Bug | 1 | Ryder Rental & Truck Leasing | 1 | |
| FedEx | 29 | SAS Shoes | 2 | |
| Finish Line | 1 | SONIC Drive-In | 9 | |
| Firestone Complete Auto Care | 3 | Sam's Club | 1 | |
| Ford | 1 | Sears | 3 | |
| Forever 21 | 1 | Shoe Carnival | 1 | |
| GNC | 7 | Sleep Inn | 2 | |
| GameStop | 5 | Spencer Gifts | 1 | |
| Gap | 1 | Sprint Nextel | 3 | |
| Goodwill | 1 | Staples | 2 | |
| Gymboree | 1 | Starbucks | 7 | |
| H&R Block | 9 | Steak 'n Shake | 1 | |
| Hardee's | 5 | Subway | 21 | |
| Havertys Furniture | 1 | Super 8 | 2 | |
| Hilton | 3 | T-Mobile | 8 | |
| Hobby Lobby | 1 | T.G.I. Driday's | 1 | |
| Holiday Inn | 3 | T.J.Maxx | 1 | |
| Hollister Co. | 1 | Taco Bell | 8 | |
| Home Depot | 2 | Talbots | 1 | |
| Honda | 1 | Target | 2 | |
| Hot Topic | 1 | The Room Place | 1 | |
| Howard Johnson | 1 | Toyota | 1 | |
| Hyundai | 1 | Toys"R"Us | 2 | |
| IHOP | 2 | True Value | 1 | |
| JCPenney | 1 | U-Haul | 12 | |
| Jack In The Box | 2 | UPS | 26 | |
| JoS. A. Bank | 1 | Verizon Wireless | 2 | |
| Jones New York | 2 | Victoria's Secret | 1 | |
| Journeys | 1 | Volkswagen | 1 | |
| Justice | 2 | Waffle House | 6 | |
| KFC | 5 | Walgreens | 10 | |
| Kmart | 2 | Walmart | 3 | |
| Knights Inn | 1 | Wendy's | 5 | |
| Kohl's | 2 | White Castle | 1 | |
| Kroger | 9 | YMCA | 2 | |
Rutherford County on our top lists:
- #12 on the list of "Top 101 counties with the lowest percentage of residents relocating from foreign countries between 2010 and 2011 (pop. 50,000+)"
- #34 on the list of "Top 101 counties with the lowest percentage of residents relocating from foreign countries between 2010 and 2011"
- #70 on the list of "Top 101 counties with the lowest number of deaths per 1000 residents 2007-2013 (pop. 50,000+)"
- #89 on the list of "Top 101 counties with the largest number of people moving in compared to moving out (pop. 50,000+)"