Smyrna, Tennessee Submit your own pictures of this town and show them to the world
OSM Map
General Map
Google Map
MSN Map
OSM Map
General Map
Google Map
MSN Map
OSM Map
General Map
Google Map
MSN Map
OSM Map
General Map
Google Map
MSN Map
Please wait while loading the map...
Population in 2022: 56,516 (99% urban, 1% rural). Population change since 2000: +121.0%Males: 28,074 Females: 28,442
March 2022 cost of living index in Smyrna: 89.4 (less than average, U.S. average is 100) Percentage of residents living in poverty in 2022: 11.8%for White Non-Hispanic residents , 10.4% for Black residents , 27.0% for Hispanic or Latino residents , 6.8% for American Indian residents , 34.5% for other race residents , 17.4% for two or more races residents )
Profiles of local businesses
Business Search - 14 Million verified businesses
Data:
Median household income ($)
Median household income (% change since 2000)
Household income diversity
Ratio of average income to average house value (%)
Ratio of average income to average rent
Median household income ($) - White
Median household income ($) - Black or African American
Median household income ($) - Asian
Median household income ($) - Hispanic or Latino
Median household income ($) - American Indian and Alaska Native
Median household income ($) - Multirace
Median household income ($) - Other Race
Median household income for houses/condos with a mortgage ($)
Median household income for apartments without a mortgage ($)
Races - White alone (%)
Races - White alone (% change since 2000)
Races - Black alone (%)
Races - Black alone (% change since 2000)
Races - American Indian alone (%)
Races - American Indian alone (% change since 2000)
Races - Asian alone (%)
Races - Asian alone (% change since 2000)
Races - Hispanic (%)
Races - Hispanic (% change since 2000)
Races - Native Hawaiian and Other Pacific Islander alone (%)
Races - Native Hawaiian and Other Pacific Islander alone (% change since 2000)
Races - Two or more races (%)
Races - Two or more races (% change since 2000)
Races - Other race alone (%)
Races - Other race alone (% change since 2000)
Racial diversity
Unemployment (%)
Unemployment (% change since 2000)
Unemployment (%) - White
Unemployment (%) - Black or African American
Unemployment (%) - Asian
Unemployment (%) - Hispanic or Latino
Unemployment (%) - American Indian and Alaska Native
Unemployment (%) - Multirace
Unemployment (%) - Other Race
Population density (people per square mile)
Population - Males (%)
Population - Females (%)
Population - Males (%) - White
Population - Males (%) - Black or African American
Population - Males (%) - Asian
Population - Males (%) - Hispanic or Latino
Population - Males (%) - American Indian and Alaska Native
Population - Males (%) - Multirace
Population - Males (%) - Other Race
Population - Females (%) - White
Population - Females (%) - Black or African American
Population - Females (%) - Asian
Population - Females (%) - Hispanic or Latino
Population - Females (%) - American Indian and Alaska Native
Population - Females (%) - Multirace
Population - Females (%) - Other Race
Coronavirus confirmed cases (Apr 27, 2024)
Deaths caused by coronavirus (Apr 27, 2024)
Coronavirus confirmed cases (per 100k population) (Apr 27, 2024)
Deaths caused by coronavirus (per 100k population) (Apr 27, 2024)
Daily increase in number of cases (Apr 27, 2024)
Weekly increase in number of cases (Apr 27, 2024)
Cases doubled (in days) (Apr 27, 2024)
Hospitalized patients (Apr 18, 2022)
Negative test results (Apr 18, 2022)
Total test results (Apr 18, 2022)
COVID Vaccine doses distributed (per 100k population) (Sep 19, 2023)
COVID Vaccine doses administered (per 100k population) (Sep 19, 2023)
COVID Vaccine doses distributed (Sep 19, 2023)
COVID Vaccine doses administered (Sep 19, 2023)
Likely homosexual households (%)
Likely homosexual households (% change since 2000)
Likely homosexual households - Lesbian couples (%)
Likely homosexual households - Lesbian couples (% change since 2000)
Likely homosexual households - Gay men (%)
Likely homosexual households - Gay men (% change since 2000)
Cost of living index
Median gross rent ($)
Median contract rent ($)
Median monthly housing costs ($)
Median house or condo value ($)
Median house or condo value ($ change since 2000)
Mean house or condo value by units in structure - 1, detached ($)
Mean house or condo value by units in structure - 1, attached ($)
Mean house or condo value by units in structure - 2 ($)
Mean house or condo value by units in structure by units in structure - 3 or 4 ($)
Mean house or condo value by units in structure - 5 or more ($)
Mean house or condo value by units in structure - Boat, RV, van, etc. ($)
Mean house or condo value by units in structure - Mobile home ($)
Median house or condo value ($) - White
Median house or condo value ($) - Black or African American
Median house or condo value ($) - Asian
Median house or condo value ($) - Hispanic or Latino
Median house or condo value ($) - American Indian and Alaska Native
Median house or condo value ($) - Multirace
Median house or condo value ($) - Other Race
Median resident age
Resident age diversity
Median resident age - Males
Median resident age - Females
Median resident age - White
Median resident age - Black or African American
Median resident age - Asian
Median resident age - Hispanic or Latino
Median resident age - American Indian and Alaska Native
Median resident age - Multirace
Median resident age - Other Race
Median resident age - Males - White
Median resident age - Males - Black or African American
Median resident age - Males - Asian
Median resident age - Males - Hispanic or Latino
Median resident age - Males - American Indian and Alaska Native
Median resident age - Males - Multirace
Median resident age - Males - Other Race
Median resident age - Females - White
Median resident age - Females - Black or African American
Median resident age - Females - Asian
Median resident age - Females - Hispanic or Latino
Median resident age - Females - American Indian and Alaska Native
Median resident age - Females - Multirace
Median resident age - Females - Other Race
Commute - mean travel time to work (minutes)
Travel time to work - Less than 5 minutes (%)
Travel time to work - Less than 5 minutes (% change since 2000)
Travel time to work - 5 to 9 minutes (%)
Travel time to work - 5 to 9 minutes (% change since 2000)
Travel time to work - 10 to 19 minutes (%)
Travel time to work - 10 to 19 minutes (% change since 2000)
Travel time to work - 20 to 29 minutes (%)
Travel time to work - 20 to 29 minutes (% change since 2000)
Travel time to work - 30 to 39 minutes (%)
Travel time to work - 30 to 39 minutes (% change since 2000)
Travel time to work - 40 to 59 minutes (%)
Travel time to work - 40 to 59 minutes (% change since 2000)
Travel time to work - 60 to 89 minutes (%)
Travel time to work - 60 to 89 minutes (% change since 2000)
Travel time to work - 90 or more minutes (%)
Travel time to work - 90 or more minutes (% change since 2000)
Marital status - Never married (%)
Marital status - Now married (%)
Marital status - Separated (%)
Marital status - Widowed (%)
Marital status - Divorced (%)
Median family income ($)
Median family income (% change since 2000)
Median non-family income ($)
Median non-family income (% change since 2000)
Median per capita income ($)
Median per capita income (% change since 2000)
Median family income ($) - White
Median family income ($) - Black or African American
Median family income ($) - Asian
Median family income ($) - Hispanic or Latino
Median family income ($) - American Indian and Alaska Native
Median family income ($) - Multirace
Median family income ($) - Other Race
Median year house/condo built
Median year apartment built
Year house built - Built 2005 or later (%)
Year house built - Built 2000 to 2004 (%)
Year house built - Built 1990 to 1999 (%)
Year house built - Built 1980 to 1989 (%)
Year house built - Built 1970 to 1979 (%)
Year house built - Built 1960 to 1969 (%)
Year house built - Built 1950 to 1959 (%)
Year house built - Built 1940 to 1949 (%)
Year house built - Built 1939 or earlier (%)
Average household size
Household density (households per square mile)
Average household size - White
Average household size - Black or African American
Average household size - Asian
Average household size - Hispanic or Latino
Average household size - American Indian and Alaska Native
Average household size - Multirace
Average household size - Other Race
Occupied housing units (%)
Vacant housing units (%)
Owner occupied housing units (%)
Renter occupied housing units (%)
Vacancy status - For rent (%)
Vacancy status - For sale only (%)
Vacancy status - Rented or sold, not occupied (%)
Vacancy status - For seasonal, recreational, or occasional use (%)
Vacancy status - For migrant workers (%)
Vacancy status - Other vacant (%)
Residents with income below the poverty level (%)
Residents with income below 50% of the poverty level (%)
Children below poverty level (%)
Poor families by family type - Married-couple family (%)
Poor families by family type - Male, no wife present (%)
Poor families by family type - Female, no husband present (%)
Poverty status for native-born residents (%)
Poverty status for foreign-born residents (%)
Poverty among high school graduates not in families (%)
Poverty among people who did not graduate high school not in families (%)
Residents with income below the poverty level (%) - White
Residents with income below the poverty level (%) - Black or African American
Residents with income below the poverty level (%) - Asian
Residents with income below the poverty level (%) - Hispanic or Latino
Residents with income below the poverty level (%) - American Indian and Alaska Native
Residents with income below the poverty level (%) - Multirace
Residents with income below the poverty level (%) - Other Race
Air pollution - Air Quality Index (AQI)
Air pollution - CO
Air pollution - NO2
Air pollution - SO2
Air pollution - Ozone
Air pollution - PM10
Air pollution - PM25
Air pollution - Pb
Crime - Murders per 100,000 population
Crime - Rapes per 100,000 population
Crime - Robberies per 100,000 population
Crime - Assaults per 100,000 population
Crime - Burglaries per 100,000 population
Crime - Thefts per 100,000 population
Crime - Auto thefts per 100,000 population
Crime - Arson per 100,000 population
Crime - City-data.com crime index
Crime - Violent crime index
Crime - Property crime index
Crime - Murders per 100,000 population (5 year average)
Crime - Rapes per 100,000 population (5 year average)
Crime - Robberies per 100,000 population (5 year average)
Crime - Assaults per 100,000 population (5 year average)
Crime - Burglaries per 100,000 population (5 year average)
Crime - Thefts per 100,000 population (5 year average)
Crime - Auto thefts per 100,000 population (5 year average)
Crime - Arson per 100,000 population (5 year average)
Crime - City-data.com crime index (5 year average)
Crime - Violent crime index (5 year average)
Crime - Property crime index (5 year average)
1996 Presidential Elections Results (%) - Democratic Party (Clinton)
1996 Presidential Elections Results (%) - Republican Party (Dole)
1996 Presidential Elections Results (%) - Other
2000 Presidential Elections Results (%) - Democratic Party (Gore)
2000 Presidential Elections Results (%) - Republican Party (Bush)
2000 Presidential Elections Results (%) - Other
2004 Presidential Elections Results (%) - Democratic Party (Kerry)
2004 Presidential Elections Results (%) - Republican Party (Bush)
2004 Presidential Elections Results (%) - Other
2008 Presidential Elections Results (%) - Democratic Party (Obama)
2008 Presidential Elections Results (%) - Republican Party (McCain)
2008 Presidential Elections Results (%) - Other
2012 Presidential Elections Results (%) - Democratic Party (Obama)
2012 Presidential Elections Results (%) - Republican Party (Romney)
2012 Presidential Elections Results (%) - Other
2016 Presidential Elections Results (%) - Democratic Party (Clinton)
2016 Presidential Elections Results (%) - Republican Party (Trump)
2016 Presidential Elections Results (%) - Other
2020 Presidential Elections Results (%) - Democratic Party (Biden)
2020 Presidential Elections Results (%) - Republican Party (Trump)
2020 Presidential Elections Results (%) - Other
Ancestries Reported - Arab (%)
Ancestries Reported - Czech (%)
Ancestries Reported - Danish (%)
Ancestries Reported - Dutch (%)
Ancestries Reported - English (%)
Ancestries Reported - French (%)
Ancestries Reported - French Canadian (%)
Ancestries Reported - German (%)
Ancestries Reported - Greek (%)
Ancestries Reported - Hungarian (%)
Ancestries Reported - Irish (%)
Ancestries Reported - Italian (%)
Ancestries Reported - Lithuanian (%)
Ancestries Reported - Norwegian (%)
Ancestries Reported - Polish (%)
Ancestries Reported - Portuguese (%)
Ancestries Reported - Russian (%)
Ancestries Reported - Scotch-Irish (%)
Ancestries Reported - Scottish (%)
Ancestries Reported - Slovak (%)
Ancestries Reported - Subsaharan African (%)
Ancestries Reported - Swedish (%)
Ancestries Reported - Swiss (%)
Ancestries Reported - Ukrainian (%)
Ancestries Reported - United States (%)
Ancestries Reported - Welsh (%)
Ancestries Reported - West Indian (%)
Ancestries Reported - Other (%)
Educational Attainment - No schooling completed (%)
Educational Attainment - Less than high school (%)
Educational Attainment - High school or equivalent (%)
Educational Attainment - Less than 1 year of college (%)
Educational Attainment - 1 or more years of college (%)
Educational Attainment - Associate degree (%)
Educational Attainment - Bachelor's degree (%)
Educational Attainment - Master's degree (%)
Educational Attainment - Professional school degree (%)
Educational Attainment - Doctorate degree (%)
School Enrollment - Nursery, preschool (%)
School Enrollment - Kindergarten (%)
School Enrollment - Grade 1 to 4 (%)
School Enrollment - Grade 5 to 8 (%)
School Enrollment - Grade 9 to 12 (%)
School Enrollment - College undergrad (%)
School Enrollment - Graduate or professional (%)
School Enrollment - Not enrolled in school (%)
School enrollment - Public schools (%)
School enrollment - Private schools (%)
School enrollment - Not enrolled (%)
Median number of rooms in houses and condos
Median number of rooms in apartments
Housing units lacking complete plumbing facilities (%)
Housing units lacking complete kitchen facilities (%)
Density of houses
Urban houses (%)
Rural houses (%)
Households with people 60 years and over (%)
Households with people 65 years and over (%)
Households with people 75 years and over (%)
Households with one or more nonrelatives (%)
Households with no nonrelatives (%)
Population in households (%)
Family households (%)
Nonfamily households (%)
Population in families (%)
Family households with own children (%)
Median number of bedrooms in owner occupied houses
Mean number of bedrooms in owner occupied houses
Median number of bedrooms in renter occupied houses
Mean number of bedrooms in renter occupied houses
Median number of vehichles in owner occupied houses
Mean number of vehichles in owner occupied houses
Median number of vehichles in renter occupied houses
Mean number of vehichles in renter occupied houses
Mortgage status - with mortgage (%)
Mortgage status - with second mortgage (%)
Mortgage status - with home equity loan (%)
Mortgage status - with both second mortgage and home equity loan (%)
Mortgage status - without a mortgage (%)
Average family size
Average family size - White
Average family size - Black or African American
Average family size - Asian
Average family size - Hispanic or Latino
Average family size - American Indian and Alaska Native
Average family size - Multirace
Average family size - Other Race
Geographical mobility - Same house 1 year ago (%)
Geographical mobility - Moved within same county (%)
Geographical mobility - Moved from different county within same state (%)
Geographical mobility - Moved from different state (%)
Geographical mobility - Moved from abroad (%)
Place of birth - Born in state of residence (%)
Place of birth - Born in other state (%)
Place of birth - Native, outside of US (%)
Place of birth - Foreign born (%)
Housing units in structures - 1, detached (%)
Housing units in structures - 1, attached (%)
Housing units in structures - 2 (%)
Housing units in structures - 3 or 4 (%)
Housing units in structures - 5 to 9 (%)
Housing units in structures - 10 to 19 (%)
Housing units in structures - 20 to 49 (%)
Housing units in structures - 50 or more (%)
Housing units in structures - Mobile home (%)
Housing units in structures - Boat, RV, van, etc. (%)
House/condo owner moved in on average (years ago)
Renter moved in on average (years ago)
Year householder moved into unit - Moved in 1999 to March 2000 (%)
Year householder moved into unit - Moved in 1995 to 1998 (%)
Year householder moved into unit - Moved in 1990 to 1994 (%)
Year householder moved into unit - Moved in 1980 to 1989 (%)
Year householder moved into unit - Moved in 1970 to 1979 (%)
Year householder moved into unit - Moved in 1969 or earlier (%)
Means of transportation to work - Drove car alone (%)
Means of transportation to work - Carpooled (%)
Means of transportation to work - Public transportation (%)
Means of transportation to work - Bus or trolley bus (%)
Means of transportation to work - Streetcar or trolley car (%)
Means of transportation to work - Subway or elevated (%)
Means of transportation to work - Railroad (%)
Means of transportation to work - Ferryboat (%)
Means of transportation to work - Taxicab (%)
Means of transportation to work - Motorcycle (%)
Means of transportation to work - Bicycle (%)
Means of transportation to work - Walked (%)
Means of transportation to work - Other means (%)
Working at home (%)
Industry diversity
Most Common Industries - Agriculture, forestry, fishing and hunting, and mining (%)
Most Common Industries - Agriculture, forestry, fishing and hunting (%)
Most Common Industries - Mining, quarrying, and oil and gas extraction (%)
Most Common Industries - Construction (%)
Most Common Industries - Manufacturing (%)
Most Common Industries - Wholesale trade (%)
Most Common Industries - Retail trade (%)
Most Common Industries - Transportation and warehousing, and utilities (%)
Most Common Industries - Transportation and warehousing (%)
Most Common Industries - Utilities (%)
Most Common Industries - Information (%)
Most Common Industries - Finance and insurance, and real estate and rental and leasing (%)
Most Common Industries - Finance and insurance (%)
Most Common Industries - Real estate and rental and leasing (%)
Most Common Industries - Professional, scientific, and management, and administrative and waste management services (%)
Most Common Industries - Professional, scientific, and technical services (%)
Most Common Industries - Management of companies and enterprises (%)
Most Common Industries - Administrative and support and waste management services (%)
Most Common Industries - Educational services, and health care and social assistance (%)
Most Common Industries - Educational services (%)
Most Common Industries - Health care and social assistance (%)
Most Common Industries - Arts, entertainment, and recreation, and accommodation and food services (%)
Most Common Industries - Arts, entertainment, and recreation (%)
Most Common Industries - Accommodation and food services (%)
Most Common Industries - Other services, except public administration (%)
Most Common Industries - Public administration (%)
Occupation diversity
Most Common Occupations - Management, business, science, and arts occupations (%)
Most Common Occupations - Management, business, and financial occupations (%)
Most Common Occupations - Management occupations (%)
Most Common Occupations - Business and financial operations occupations (%)
Most Common Occupations - Computer, engineering, and science occupations (%)
Most Common Occupations - Computer and mathematical occupations (%)
Most Common Occupations - Architecture and engineering occupations (%)
Most Common Occupations - Life, physical, and social science occupations (%)
Most Common Occupations - Education, legal, community service, arts, and media occupations (%)
Most Common Occupations - Community and social service occupations (%)
Most Common Occupations - Legal occupations (%)
Most Common Occupations - Education, training, and library occupations (%)
Most Common Occupations - Arts, design, entertainment, sports, and media occupations (%)
Most Common Occupations - Healthcare practitioners and technical occupations (%)
Most Common Occupations - Health diagnosing and treating practitioners and other technical occupations (%)
Most Common Occupations - Health technologists and technicians (%)
Most Common Occupations - Service occupations (%)
Most Common Occupations - Healthcare support occupations (%)
Most Common Occupations - Protective service occupations (%)
Most Common Occupations - Fire fighting and prevention, and other protective service workers including supervisors (%)
Most Common Occupations - Law enforcement workers including supervisors (%)
Most Common Occupations - Food preparation and serving related occupations (%)
Most Common Occupations - Building and grounds cleaning and maintenance occupations (%)
Most Common Occupations - Personal care and service occupations (%)
Most Common Occupations - Sales and office occupations (%)
Most Common Occupations - Sales and related occupations (%)
Most Common Occupations - Office and administrative support occupations (%)
Most Common Occupations - Natural resources, construction, and maintenance occupations (%)
Most Common Occupations - Farming, fishing, and forestry occupations (%)
Most Common Occupations - Construction and extraction occupations (%)
Most Common Occupations - Installation, maintenance, and repair occupations (%)
Most Common Occupations - Production, transportation, and material moving occupations (%)
Most Common Occupations - Production occupations (%)
Most Common Occupations - Transportation occupations (%)
Most Common Occupations - Material moving occupations (%)
People in Group quarters - Institutionalized population (%)
People in Group quarters - Correctional institutions (%)
People in Group quarters - Federal prisons and detention centers (%)
People in Group quarters - Halfway houses (%)
People in Group quarters - Local jails and other confinement facilities (including police lockups) (%)
People in Group quarters - Military disciplinary barracks (%)
People in Group quarters - State prisons (%)
People in Group quarters - Other types of correctional institutions (%)
People in Group quarters - Nursing homes (%)
People in Group quarters - Hospitals/wards, hospices, and schools for the handicapped (%)
People in Group quarters - Hospitals/wards and hospices for chronically ill (%)
People in Group quarters - Hospices or homes for chronically ill (%)
People in Group quarters - Military hospitals or wards for chronically ill (%)
People in Group quarters - Other hospitals or wards for chronically ill (%)
People in Group quarters - Hospitals or wards for drug/alcohol abuse (%)
People in Group quarters - Mental (Psychiatric) hospitals or wards (%)
People in Group quarters - Schools, hospitals, or wards for the mentally retarded (%)
People in Group quarters - Schools, hospitals, or wards for the physically handicapped (%)
People in Group quarters - Institutions for the deaf (%)
People in Group quarters - Institutions for the blind (%)
People in Group quarters - Orthopedic wards and institutions for the physically handicapped (%)
People in Group quarters - Wards in general hospitals for patients who have no usual home elsewhere (%)
People in Group quarters - Wards in military hospitals for patients who have no usual home elsewhere (%)
People in Group quarters - Juvenile institutions (%)
People in Group quarters - Long-term care (%)
People in Group quarters - Homes for abused, dependent, and neglected children (%)
People in Group quarters - Residential treatment centers for emotionally disturbed children (%)
People in Group quarters - Training schools for juvenile delinquents (%)
People in Group quarters - Short-term care, detention or diagnostic centers for delinquent children (%)
People in Group quarters - Type of juvenile institution unknown (%)
People in Group quarters - Noninstitutionalized population (%)
People in Group quarters - College dormitories (includes college quarters off campus) (%)
People in Group quarters - Military quarters (%)
People in Group quarters - On base (%)
People in Group quarters - Barracks, unaccompanied personnel housing (UPH), (Enlisted/Officer), ;and similar group living quarters for military personnel (%)
People in Group quarters - Transient quarters for temporary residents (%)
People in Group quarters - Military ships (%)
People in Group quarters - Group homes (%)
People in Group quarters - Homes or halfway houses for drug/alcohol abuse (%)
People in Group quarters - Homes for the mentally ill (%)
People in Group quarters - Homes for the mentally retarded (%)
People in Group quarters - Homes for the physically handicapped (%)
People in Group quarters - Other group homes (%)
People in Group quarters - Religious group quarters (%)
People in Group quarters - Dormitories (%)
People in Group quarters - Agriculture workers' dormitories on farms (%)
People in Group quarters - Job Corps and vocational training facilities (%)
People in Group quarters - Other workers' dormitories (%)
People in Group quarters - Crews of maritime vessels (%)
People in Group quarters - Other nonhousehold living situations (%)
People in Group quarters - Other noninstitutional group quarters (%)
Residents speaking English at home (%)
Residents speaking English at home - Born in the United States (%)
Residents speaking English at home - Native, born elsewhere (%)
Residents speaking English at home - Foreign born (%)
Residents speaking Spanish at home (%)
Residents speaking Spanish at home - Born in the United States (%)
Residents speaking Spanish at home - Native, born elsewhere (%)
Residents speaking Spanish at home - Foreign born (%)
Residents speaking other language at home (%)
Residents speaking other language at home - Born in the United States (%)
Residents speaking other language at home - Native, born elsewhere (%)
Residents speaking other language at home - Foreign born (%)
Class of Workers - Employee of private company (%)
Class of Workers - Self-employed in own incorporated business (%)
Class of Workers - Private not-for-profit wage and salary workers (%)
Class of Workers - Local government workers (%)
Class of Workers - State government workers (%)
Class of Workers - Federal government workers (%)
Class of Workers - Self-employed workers in own not incorporated business and Unpaid family workers (%)
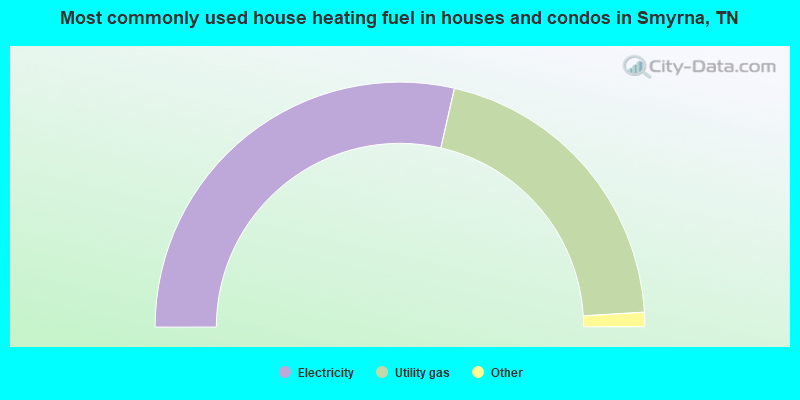
House heating fuel used in houses and condos - Utility gas (%)
House heating fuel used in houses and condos - Bottled, tank, or LP gas (%)
House heating fuel used in houses and condos - Electricity (%)
House heating fuel used in houses and condos - Fuel oil, kerosene, etc. (%)
House heating fuel used in houses and condos - Coal or coke (%)
House heating fuel used in houses and condos - Wood (%)
House heating fuel used in houses and condos - Solar energy (%)
House heating fuel used in houses and condos - Other fuel (%)
House heating fuel used in houses and condos - No fuel used (%)
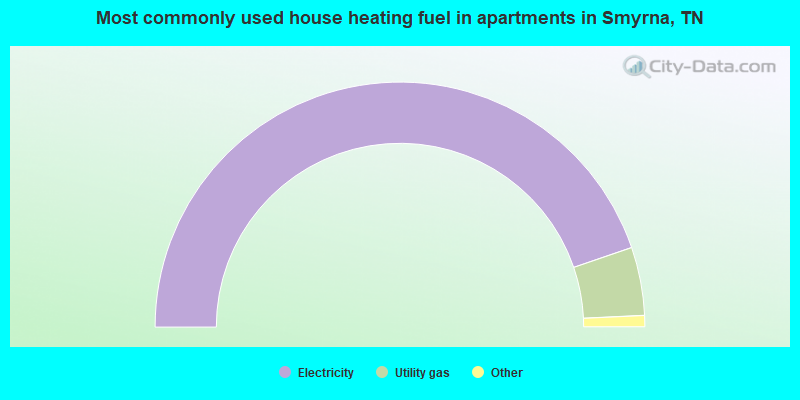
House heating fuel used in apartments - Utility gas (%)
House heating fuel used in apartments - Bottled, tank, or LP gas (%)
House heating fuel used in apartments - Electricity (%)
House heating fuel used in apartments - Fuel oil, kerosene, etc. (%)
House heating fuel used in apartments - Coal or coke (%)
House heating fuel used in apartments - Wood (%)
House heating fuel used in apartments - Solar energy (%)
House heating fuel used in apartments - Other fuel (%)
House heating fuel used in apartments - No fuel used (%)
Armed forces status - In Armed Forces (%)
Armed forces status - Civilian (%)
Armed forces status - Civilian - Veteran (%)
Armed forces status - Civilian - Nonveteran (%)
Fatal accidents locations in years 2005-2021
Fatal accidents locations in 2005
Fatal accidents locations in 2006
Fatal accidents locations in 2007
Fatal accidents locations in 2008
Fatal accidents locations in 2009
Fatal accidents locations in 2010
Fatal accidents locations in 2011
Fatal accidents locations in 2012
Fatal accidents locations in 2013
Fatal accidents locations in 2014
Fatal accidents locations in 2015
Fatal accidents locations in 2016
Fatal accidents locations in 2017
Fatal accidents locations in 2018
Fatal accidents locations in 2019
Fatal accidents locations in 2020
Fatal accidents locations in 2021
Alcohol use - People drinking some alcohol every month (%)
Alcohol use - People not drinking at all (%)
Alcohol use - Average days/month drinking alcohol
Alcohol use - Average drinks/week
Alcohol use - Average days/year people drink much
Audiometry - Average condition of hearing (%)
Audiometry - People that can hear a whisper from across a quiet room (%)
Audiometry - People that can hear normal voice from across a quiet room (%)
Audiometry - Ears ringing, roaring, buzzing (%)
Audiometry - Had a job exposure to loud noise (%)
Audiometry - Had off-work exposure to loud noise (%)
Blood Pressure & Cholesterol - Has high blood pressure (%)
Blood Pressure & Cholesterol - Checking blood pressure at home (%)
Blood Pressure & Cholesterol - Frequently checking blood cholesterol (%)
Blood Pressure & Cholesterol - Has high cholesterol level (%)
Consumer Behavior - Money monthly spent on food at supermarket/grocery store
Consumer Behavior - Money monthly spent on food at other stores
Consumer Behavior - Money monthly spent on eating out
Consumer Behavior - Money monthly spent on carryout/delivered foods
Consumer Behavior - Income spent on food at supermarket/grocery store (%)
Consumer Behavior - Income spent on food at other stores (%)
Consumer Behavior - Income spent on eating out (%)
Consumer Behavior - Income spent on carryout/delivered foods (%)
Current Health Status - General health condition (%)
Current Health Status - Blood donors (%)
Current Health Status - Has blood ever tested for HIV virus (%)
Current Health Status - Left-handed people (%)
Dermatology - People using sunscreen (%)
Diabetes - Diabetics (%)
Diabetes - Had a blood test for high blood sugar (%)
Diabetes - People taking insulin (%)
Diet Behavior & Nutrition - Diet health (%)
Diet Behavior & Nutrition - Milk product consumption (# of products/month)
Diet Behavior & Nutrition - Meals not home prepared (#/week)
Diet Behavior & Nutrition - Meals from fast food or pizza place (#/week)
Diet Behavior & Nutrition - Ready-to-eat foods (#/month)
Diet Behavior & Nutrition - Frozen meals/pizza (#/month)
Drug Use - People that ever used marijuana or hashish (%)
Drug Use - Ever used hard drugs (%)
Drug Use - Ever used any form of cocaine (%)
Drug Use - Ever used heroin (%)
Drug Use - Ever used methamphetamine (%)
Health Insurance - People covered by health insurance (%)
Kidney Conditions-Urology - Avg. # of times urinating at night
Medical Conditions - People with asthma (%)
Medical Conditions - People with anemia (%)
Medical Conditions - People with psoriasis (%)
Medical Conditions - People with overweight (%)
Medical Conditions - Elderly people having difficulties in thinking or remembering (%)
Medical Conditions - People who ever received blood transfusion (%)
Medical Conditions - People having trouble seeing even with glass/contacts (%)
Medical Conditions - People with arthritis (%)
Medical Conditions - People with gout (%)
Medical Conditions - People with congestive heart failure (%)
Medical Conditions - People with coronary heart disease (%)
Medical Conditions - People with angina pectoris (%)
Medical Conditions - People who ever had heart attack (%)
Medical Conditions - People who ever had stroke (%)
Medical Conditions - People with emphysema (%)
Medical Conditions - People with thyroid problem (%)
Medical Conditions - People with chronic bronchitis (%)
Medical Conditions - People with any liver condition (%)
Medical Conditions - People who ever had cancer or malignancy (%)
Mental Health - People who have little interest in doing things (%)
Mental Health - People feeling down, depressed, or hopeless (%)
Mental Health - People who have trouble sleeping or sleeping too much (%)
Mental Health - People feeling tired or having little energy (%)
Mental Health - People with poor appetite or overeating (%)
Mental Health - People feeling bad about themself (%)
Mental Health - People who have trouble concentrating on things (%)
Mental Health - People moving or speaking slowly or too fast (%)
Mental Health - People having thoughts they would be better off dead (%)
Oral Health - Average years since last visit a dentist
Oral Health - People embarrassed because of mouth (%)
Oral Health - People with gum disease (%)
Oral Health - General health of teeth and gums (%)
Oral Health - Average days a week using dental floss/device
Oral Health - Average days a week using mouthwash for dental problem
Oral Health - Average number of teeth
Pesticide Use - Households using pesticides to control insects (%)
Pesticide Use - Households using pesticides to kill weeds (%)
Physical Activity - People doing vigorous-intensity work activities (%)
Physical Activity - People doing moderate-intensity work activities (%)
Physical Activity - People walking or bicycling (%)
Physical Activity - People doing vigorous-intensity recreational activities (%)
Physical Activity - People doing moderate-intensity recreational activities (%)
Physical Activity - Average hours a day doing sedentary activities
Physical Activity - Average hours a day watching TV or videos
Physical Activity - Average hours a day using computer
Physical Functioning - People having limitations keeping them from working (%)
Physical Functioning - People limited in amount of work they can do (%)
Physical Functioning - People that need special equipment to walk (%)
Physical Functioning - People experiencing confusion/memory problems (%)
Physical Functioning - People requiring special healthcare equipment (%)
Prescription Medications - Average number of prescription medicines taking
Preventive Aspirin Use - Adults 40+ taking low-dose aspirin (%)
Reproductive Health - Vaginal deliveries (%)
Reproductive Health - Cesarean deliveries (%)
Reproductive Health - Deliveries resulted in a live birth (%)
Reproductive Health - Pregnancies resulted in a delivery (%)
Reproductive Health - Women breastfeeding newborns (%)
Reproductive Health - Women that had a hysterectomy (%)
Reproductive Health - Women that had both ovaries removed (%)
Reproductive Health - Women that have ever taken birth control pills (%)
Reproductive Health - Women taking birth control pills (%)
Reproductive Health - Women that have ever used Depo-Provera or injectables (%)
Reproductive Health - Women that have ever used female hormones (%)
Sexual Behavior - People 18+ that ever had sex (vaginal, anal, or oral) (%)
Sexual Behavior - Males 18+ that ever had vaginal sex with a woman (%)
Sexual Behavior - Males 18+ that ever performed oral sex on a woman (%)
Sexual Behavior - Males 18+ that ever had anal sex with a woman (%)
Sexual Behavior - Males 18+ that ever had any sex with a man (%)
Sexual Behavior - Females 18+ that ever had vaginal sex with a man (%)
Sexual Behavior - Females 18+ that ever performed oral sex on a man (%)
Sexual Behavior - Females 18+ that ever had anal sex with a man (%)
Sexual Behavior - Females 18+ that ever had any kind of sex with a woman (%)
Sexual Behavior - Average age people first had sex
Sexual Behavior - Average number of female sex partners in lifetime (males 18+)
Sexual Behavior - Average number of female vaginal sex partners in lifetime (males 18+)
Sexual Behavior - Average age people first performed oral sex on a woman (18+)
Sexual Behavior - Average number of woman performed oral sex on in lifetime (18+)
Sexual Behavior - Average number of male sex partners in lifetime (males 18+)
Sexual Behavior - Average number of male anal sex partners in lifetime (males 18+)
Sexual Behavior - Average age people first performed oral sex on a man (18+)
Sexual Behavior - Average number of male oral sex partners in lifetime (18+)
Sexual Behavior - People using protection when performing oral sex (%)
Sexual Behavior - Average number of times people have vaginal or anal sex a year
Sexual Behavior - People having sex without condom (%)
Sexual Behavior - Average number of male sex partners in lifetime (females 18+)
Sexual Behavior - Average number of male vaginal sex partners in lifetime (females 18+)
Sexual Behavior - Average number of female sex partners in lifetime (females 18+)
Sexual Behavior - Circumcised males 18+ (%)
Sleep Disorders - Average hours sleeping at night
Sleep Disorders - People that has trouble sleeping (%)
Smoking-Cigarette Use - People smoking cigarettes (%)
Taste & Smell - People 40+ having problems with smell (%)
Taste & Smell - People 40+ having problems with taste (%)
Taste & Smell - People 40+ that ever had wisdom teeth removed (%)
Taste & Smell - People 40+ that ever had tonsils teeth removed (%)
Taste & Smell - People 40+ that ever had a loss of consciousness because of a head injury (%)
Taste & Smell - People 40+ that ever had a broken nose or other serious injury to face or skull (%)
Taste & Smell - People 40+ that ever had two or more sinus infections (%)
Weight - Average height (inches)
Weight - Average weight (pounds)
Weight - Average BMI
Weight - People that are obese (%)
Weight - People that ever were obese (%)
Weight - People trying to lose weight (%)
According to our research of Tennessee and other state lists, there were 64 registered sex offenders living in Smyrna, Tennessee as of April 27, 2024 . The ratio of all residents to sex offenders in Smyrna is 753 to 1.The ratio of registered sex offenders to all residents in this city is lower than the state average.
The City-Data.com crime index weighs serious crimes and violent crimes more heavily. Higher means more crime, U.S. average is 246.1. It adjusts for the number of visitors and daily workers commuting into cities.
- means the value is smaller than the state average.
- means the value is about the same as the state average.
- means the value is bigger than the state average.
Crime rate in Smyrna detailed stats: murders, rapes, robberies, assaults, burglaries, thefts, arson Officers per 1,000 residents here:
1.65Tennessee average:
2.57
Latest news from Smyrna, TN collected exclusively by city-data.com from local newspapers, TV, and radio stations
Ancestries: American (14.6%), English (7.4%), German (4.7%), Irish (4.4%), Egyptian (3.3%), European (1.8%).
Current Local Time:
Land area: 22.8 square miles.
Population density: 2,475 people per square mile (low).
7,764 residents are foreign born (6.1% Latin America , 4.2% Asia , 2.6% Africa ).
This town:
13.8%Tennessee:
5.4%
Median real estate property taxes paid for housing units with mortgages in 2022: $1,734 (0.5%)Median real estate property taxes paid for housing units with no mortgage in 2022: $1,527 (0.4%)
Nearest city with pop. 50,000+: Murfreesboro, TN
Nearest city with pop. 200,000+: Nashville-Davidson, TN
Nearest city with pop. 1,000,000+: Chicago, IL
Nearest cities:
Latitude: 35.98 N, Longitude: 86.52 W
Daytime population change due to commuting: +13,213 (+23.4%)Workers who live and work in this town: 11,573 (37.6%)
Single-family new house construction building permits:
2022: 218 buildings , average cost: $269,4002021: 290 buildings , average cost: $237,0002020: 604 buildings , average cost: $184,2002019: 469 buildings , average cost: $174,8002018: 310 buildings , average cost: $173,6002017: 243 buildings , average cost: $146,4002016: 370 buildings , average cost: $139,3002015: 238 buildings , average cost: $123,3002014: 243 buildings , average cost: $111,9002013: 197 buildings , average cost: $116,6002012: 193 buildings , average cost: $103,2002011: 97 buildings , average cost: $113,2002010: 99 buildings , average cost: $121,6002009: 151 buildings , average cost: $100,9002008: 148 buildings , average cost: $110,6002007: 475 buildings , average cost: $105,3002006: 656 buildings , average cost: $102,7002005: 547 buildings , average cost: $92,4002004: 522 buildings , average cost: $88,6002003: 494 buildings , average cost: $81,7002002: 460 buildings , average cost: $79,9002001: 456 buildings , average cost: $83,6002000: 395 buildings , average cost: $79,0001999: 314 buildings , average cost: $80,6001998: 294 buildings , average cost: $89,6001997: 219 buildings , average cost: $81,400Unemployment in December 2023:
Population change in the 1990s: +9,017 (+54.5%).
Most common occupations in Smyrna, TN (%)
Both Males Females
Other production occupations, including supervisors (6.1%)
Material recording, scheduling, dispatching, and distributing workers (4.4%)
Other sales and related occupations, including supervisors (4.0%)
Other management occupations, except farmers and farm managers (3.6%)
Electrical equipment mechanics and other installation, maintenance, and repair workers, including supervisors (3.3%)
Laborers and material movers, hand (3.3%)
Other office and administrative support workers, including supervisors (3.2%)
Other production occupations, including supervisors (8.0%)
Electrical equipment mechanics and other installation, maintenance, and repair workers, including supervisors (5.6%)
Material recording, scheduling, dispatching, and distributing workers (4.9%)
Laborers and material movers, hand (4.1%)
Driver/sales workers and truck drivers (4.1%)
Other management occupations, except farmers and farm managers (3.7%)
Other sales and related occupations, including supervisors (3.6%)
Secretaries and administrative assistants (5.2%)
Other office and administrative support workers, including supervisors (5.0%)
Other sales and related occupations, including supervisors (4.6%)
Material recording, scheduling, dispatching, and distributing workers (3.9%)
Other production occupations, including supervisors (3.9%)
Registered nurses (3.9%)
Customer service representatives (3.9%)
Tornado activity:
Smyrna-area historical tornado activity is slightly above Tennessee state average. It is 73% greater than the overall U.S. average.
On 1/24/1997, a category F4 (max. wind speeds 207-260 mph) tornado 13.0 miles away from the Smyrna town center injured 18 people and caused $5 million in damages.
On 12/24/1988, a category F4 tornado 14.9 miles away from the town center killed one person and injured 7 people and caused between $5,000,000 and $50,000,000 in damages.
Earthquake activity:
Smyrna-area historical earthquake activity is significantly above Tennessee state average. It is 182% greater than the overall U.S. average. On 4/18/2008 at 09:36:59, a magnitude 5.4 (5.1 MB, 4.8 MS, 5.4 MW, 5.2 MW, Class: Moderate, Intensity: VI - VII) earthquake occurred 186.8 miles away from Smyrna center On 4/29/2003 at 08:59:39, a magnitude 4.9 (4.4 MB, 4.6 MW, 4.9 LG, Class: Light, Intensity: IV - V) earthquake occurred 114.4 miles away from the city center On 4/18/2008 at 09:36:59, a magnitude 5.2 (5.2 MW, Depth: 8.9 mi) earthquake occurred 186.8 miles away from the city center On 6/18/2002 at 17:37:15, a magnitude 5.0 (4.3 MB, 4.6 MW, 5.0 LG) earthquake occurred 155.3 miles away from the city center On 7/27/1980 at 18:52:21, a magnitude 5.2 (5.1 MB, 4.7 MS, 5.0 UK, 5.2 UK) earthquake occurred 209.6 miles away from the city center On 9/26/1990 at 13:18:51, a magnitude 5.0 (4.7 MB, 4.8 LG, 5.0 LG, Depth: 7.7 mi) earthquake occurred 186.5 miles away from Smyrna center Magnitude types: regional Lg-wave magnitude (LG), body-wave magnitude (MB), surface-wave magnitude (MS), moment magnitude (MW) Natural disasters: The number of natural disasters in Rutherford County (12) is smaller than the US average (15).Major Disasters (Presidential) Declared: 9Emergencies Declared: 2Floods: 7, Storms: 6, Tornadoes: 6, Winter Storms: 2, Flash Flood: 1, Heavy Rain: 1, Hurricane: 1, Ice Storm: 1, Snowfall: 1, Wind: 1, Other: 1 (Note: some incidents may be assigned to more than one category). Hospitals and medical centers in Smyrna: SMYRNA HOSPITAL INC (HIGHWAY 41) TRISTAR STONECREST MEDICAL CENTER (Proprietary, 200 STONECREST BOULEVARD) MAYFIELD REHABILITATION CENTER (200 MAYFIELD DRIVE)
PEACHTREE CTR NURSING AND REHABILITATION (202 ENON SPRINGS ROAD EAST)
SMYRNA NURSING CENTER (202 ENON SPRINGS ROAD)
DAVITA SMYRNA (537 STONECREST PKWY)
FMC DIALYSIS ASSOC. OF SMYRNA (1100 ROCK SPRINGS ROAD)
AMEDISYS HOME HEALTH CARE (537 STONECREST PARKWAY SUITE 109)
Airports located in Smyrna: Smyrna Airport (MQY) Runways: , Commercial Ops: 153, Air Taxi Ops: 5,442, Itinerant Ops: 40,510, Local Ops: 28,906, Military Ops: 9,320)Amtrak station near Smyrna: 20 miles: NASHVILLE (GREYHOUND STA., 200 8TH AVE. S.) - Bus Station Services: enclosed waiting area, public restrooms, public payphones, intercity bus service.
Colleges/universities with over 2000 students nearest to Smyrna:
Middle Tennessee State University (about 13 miles; Murfreesboro, TN ; Full-time enrollment: 21,628)
Trevecca Nazarene University (about 18 miles; Nashville, TN ; FT enrollment: 2,223)
Lipscomb University (about 18 miles; Nashville, TN ; FT enrollment: 3,827)
Belmont University (about 19 miles; Nashville, TN ; FT enrollment: 5,795)
Vanderbilt University (about 20 miles; Nashville, TN ; FT enrollment: 10,518)
Nashville State Community College (about 22 miles; Nashville, TN ; FT enrollment: 6,436)
Tennessee State University (about 22 miles; Nashville, TN ; FT enrollment: 7,341)
Public high schools in Smyrna: SMYRNA HIGH SCHOOL Students: 1,716, Location: 100 BULLDOG DR, Grades: 9-12)SMYRNA WEST ALTERNATIVE SCHOOL Location: 12619 OLD NASHVILLE HW, Grades: 6-12)
STEWARTS CREEK HIGH SCHOOL Location: 300 RED HAWK PW, Grades: 9-12)
Private high school in Smyrna: LANCASTER CHRISTIAN ACADEMY Students: 537, Location: 150 SOCCER WAY, Grades: PK-12)
Biggest public elementary/middle schools in Smyrna: STEWARTSBORO ELEMENTARY Students: 1,161, Location: 10479 OLD NASHVILLE HW, Grades: PK-5)CEDAR GROVE ELEMENTARY Students: 1,091, Location: 354 CHANEY RD, Grades: PK-5)SMYRNA MIDDLE SCHOOL Students: 1,083, Location: 712 HAZELWOOD DR, Grades: 6-8)ROCK SPRINGS MIDDLE SCHOOL Students: 944, Location: 3301 ROCK SPRINGS RD, Grades: 6-8)DAVID YOUREE ELEMENTARY Students: 796, Location: 250 TODD LA, Grades: KG-5)SMYRNA ELEMENTARY Students: 687, Location: 1001 SAM DAVIS RD, Grades: PK-5)SMYRNA PRIMARY Students: 529, Location: 200 WALNUT ST, Grades: PK-5)JOHN COLEMON ELEMENTARY Students: 411, Location: 100 WISE DR, Grades: PK-5)THURMAN FRANCIS ARTS ACADEMY/MAGNET SCHOOL FOR THE Location: 221 TODD LA, Grades: KG-8)
STEWARTS CREEK ELEMENTARY SCHOOL Location: 200 RED HAWK PW, Grades: KG-5)
Private elementary/middle school in Smyrna: COMMUNITY CHRISTIAN DAY SCHOOL Students: 67, Location: 185 ENON SPRINGS RD W, Grades: PK-1)
See full list of schools located in Smyrna User-submitted facts and corrections:
Hospitals/Medical Centers: StoneCreast Medical Center in Smyrna
Notable locations in Smyrna: (A) , Sam Davis Home (B) , Smyrna Fire Department Station 2 (C) , Smyrna Fire Department Station 1 (D) , Smyrna Fire Department Station 3 (E) , Smyrna Fire Department Station 5 (F) , Smyrna Airport Fire Department (G) , Smyrna Fire Department Station 4 Headquarters (H) , Smyrna CB Rescue Unit (I) , Smyrna City Hall (J) , Empact Ambulance Service (K) . Display/hide their locations on the map
Shopping Centers: (1) , Smyrna Town Center Shopping Center (2) , Smyrna Village Shopping Center (3) , Smyrna Square Shopping Center (4) , Country Village Shopping Center (5) . Display/hide their locations on the map
Churches in Smyrna include: (A) , Smyrna Presbyterian Church (B) , Cedar Grove Church (C) , First Baptist Church (D) , Smyrna United Methodist Church (E) , Mount Zion Missionary Baptist Church (F) . Display/hide their locations on the map
Cemeteries: (1) , Ward Cemetery (2) , Walden Cemetery (3) , Thompson Cemetery (4) , Templeton Grove Cemetery (5) , Sanders Cemetery (6) , Sam Davis Cemetery (7) . Display/hide their locations on the map
Streams, rivers, and creeks: (A) , Rock Spring Branch (B) . Display/hide their locations on the map
Parks in Smyrna include: (1) , Jefferson Springs Recreation Area (2) , Gregory Mill Dam Park (3) . Display/hide their locations on the map
Tourist attractions: (1) , Hot Spot Tanning (Amusement & Theme Parks; 307 Sam Ridley Parkway West) (2) , A.C.T.S. Financial Consultants (Tours & Charters; 624 Mayfield Dr) (3) . Display/hide their approximate locations on the map
Hotels: (1) , Hampton Inn & Suites (2573 Highwood Boulevard) (2) , Deerfield Inn & Suites (1071 Courier Place) (3) , Fairfield Inn & Suites by Mariott (810 Expo Drive) (4) , Fairfield Inn (810 Expo Drive) (5) . Display/hide their approximate locations on the map
Courts: (1) , Smyrna Town - Judicial- General Sessions Court (315 South Lowry Street) (2) . Display/hide their approximate locations on the map
Birthplace of: Jess Neely - Football player and coach, Johnny Gooch - Baseball player and coach, Patricia McKissack - Children's writer, William Barksdale - Confederate Army general, Ben H. Guill - Politician, Brett Warner - College basketball player (NC Asheville Bulldogs), Chad Chaffin - Craftsman Truck series NASCAR driver (born : Jul 20, 1968), Charlie Gooch - Baseball player, Danny Young (baseball) - Baseball player, Eddie DeBro - College basketball player (Tennessee Volunteers).
Rutherford County has a predicted average indoor radon screening level greater than 4 pCi/L (pico curies per liter) - Highest Potential Drinking water stations with addresses in Smyrna and their reported violations in the past:
SMYRNA WATER SYSTEM (Population served: 44,572, Surface water):
Past health violations:
MCL, Average - Between APR-2013 and JUN-2013, Contaminant: Total Haloacetic Acids (HAA5). Follow-up actions: St Compliance achieved (JUL-12-2013), St Public Notif requested (JUL-18-2013), St Violation/Reminder Notice (JUL-18-2013), St Civil Case under development (AUG-06-2013), St Public Notif received (SEP-01-2013), St AO (w/penalty) issued (MAY-16-2014)
MCL, Average - Between APR-2013 and JUN-2013, Contaminant: TTHM. Follow-up actions: St Compliance achieved (JUL-12-2013), St Public Notif requested (JUL-18-2013), St Violation/Reminder Notice (JUL-18-2013), St Civil Case under development (AUG-06-2013), St Public Notif received (SEP-01-2013), St AO (w/penalty) issued (MAY-16-2014)
MCL, Average - Between JAN-2013 and MAR-2013, Contaminant: TTHM. Follow-up actions: St Public Notif requested (APR-26-2013), St Violation/Reminder Notice (APR-26-2013), St Public Notif received (APR-30-2013), St Compliance achieved (JUL-12-2013), St Civil Case under development (AUG-06-2013), St AO (w/penalty) issued (MAY-16-2014)
MCL, Average - Between OCT-2012 and DEC-2012, Contaminant: TTHM. Follow-up actions: St Public Notif requested (JAN-29-2013), St Violation/Reminder Notice (JAN-29-2013), St Public Notif received (APR-30-2013), St Compliance achieved (JUL-12-2013), St Civil Case under development (AUG-06-2013), St AO (w/penalty) issued (MAY-16-2014)
Past monitoring violations:
Single Turbidity Exceed (Enhanced SWTR) - In MAY-2011, Contaminant: IESWTR. Follow-up actions: St Public Notif requested (MAY-13-2011), St Violation/Reminder Notice (MAY-13-2011), St Compliance achieved (JUN-30-2011), St Public Notif received (JUN-11-2012), St AO (w/penalty) issued (MAY-16-2014)
Monitoring and Reporting (DBP) - Between JUL-2006 and SEP-2006, Contaminant: CARBON, TOTAL. Follow-up actions: St Compliance achieved (OCT-01-2006), St Public Notif requested (OCT-31-2006), St Violation/Reminder Notice (OCT-31-2006)
One minor monitoring violation
Population served: 150, Groundwater under infl of surface water):
Past monitoring violations:
Monitoring and Reporting (DBP) - Between JUL-2013 and SEP-2013, Contaminant: Chlorine. Follow-up actions: St Public Notif requested (SEP-20-2013), St Violation/Reminder Notice (SEP-20-2013), St BCA signed (OCT-16-2013)
Monitoring, Repeat Major (TCR) - In APR-2011, Contaminant: Coliform (TCR). Follow-up actions: St Public Notif requested (JUN-07-2011), St Violation/Reminder Notice (JUN-07-2011), St Public Notif received (JUN-07-2011), St Compliance achieved (JUN-30-2011)
Monitoring and Reporting (DBP) - Between APR-2011 and JUN-2011, Contaminant: Chlorine. Follow-up actions: St Public Notif requested (JUN-07-2011), St Violation/Reminder Notice (JUN-07-2011), St Public Notif received (JUN-07-2011), St Public Notif requested (JUL-06-2011), St Violation/Reminder Notice (JUL-06-2011), St Compliance achieved (SEP-30-2011)
Monitoring and Reporting (DBP) - Between OCT-2008 and DEC-2008, Contaminant: Chlorine. Follow-up actions: St Public Notif requested (DEC-01-2008), St Violation/Reminder Notice (DEC-01-2008), St Public Notif received (MAR-19-2009), St Compliance achieved (MAR-31-2009)
Monitoring and Reporting (DBP) - Between OCT-2006 and DEC-2006, Contaminant: Chlorine. Follow-up actions: St Compliance achieved (JAN-01-2007), St Public Notif requested (JAN-05-2007), St Violation/Reminder Notice (JAN-05-2007)
2 routine major monitoring violations
2 minor monitoring violations
Average household size: This town:
2.7 peopleTennessee:
2.5 people
Percentage of family households: This town:
71.0%Whole state:
67.3%
Percentage of households with unmarried partners: This town:
7.0%Whole state:
5.8%
Likely homosexual households (counted as self-reported same-sex unmarried-partner households)
Lesbian couples: 0.4% of all households Gay men: 0.3% of all households
People in group quarters in Smyrna in 2010:
215 people in nursing facilities/skilled-nursing facilities
138 people in residential schools for people with disabilities
12 people in other noninstitutional facilities
People in group quarters in Smyrna in 2000:
185 people in nursing homes
157 people in institutions for the blind
25 people in other noninstitutional group quarters
Banks with most branches in Smyrna (2011 data):
Regions Bank: Smyrna Branch, Smyrna Rdt Branch, Smyrna Branch. Info updated 2011/02/24: Bank assets: $123,368.2 mil, Deposits: $98,301.3 mil, headquarters in Birmingham, AL, positive income , Commercial Lending Specialization, 1778 total offices , Holding Company: Regions Financial Corporation
U.S. Bank National Association: Smyrna Branch at 345 Sam Ridley Parkway West, branch established on 2009/09/14; Smyrna Publix Branch at 661 President Place, branch established on 2005/02/02. Info updated 2012/01/30: Bank assets: $330,470.8 mil, Deposits: $236,091.5 mil, headquarters in Cincinnati, OH, positive income , 3121 total offices , Holding Company: U.S. Bancorp
SunTrust Bank: Smyrna Branch at 189 South Lowry, branch established on 1910/01/01; Sam Ridley Parkway Branch at 551 Sam Ridley Pkwy W, branch established on 2004/02/23. Info updated 2010/05/27: Bank assets: $171,291.7 mil, Deposits: $129,833.2 mil, headquarters in Atlanta, GA, positive income , Commercial Lending Specialization, 1716 total offices , Holding Company: Suntrust Banks, Inc.
Pinnacle National Bank: Smyrna; S Lowry Office Branch at 69 South Lowry, branch established on 2003/06/16; Sam Ridley Pkwy Branch at 467 Sam Ridley Pkwy, branch established on 2003/06/02. Info updated 2010/01/06: Bank assets: $4,846.7 mil, Deposits: $3,690.4 mil, headquarters in Nashville, TN, positive income , Commercial Lending Specialization, 33 total offices , Holding Company: Pinnacle Financial Partners, Inc.
First Tennessee Bank, National Association: Smyrna Branch at 770 Nissan Drive, branch established on 1994/05/16; Sam Ridley Financial Center Branch at 471 Sam Ridley Parkway, branch established on 2008/06/09. Info updated 2009/09/08: Bank assets: $24,563.4 mil, Deposits: $16,402.1 mil, headquarters in Memphis, TN, positive income , Commercial Lending Specialization, 180 total offices , Holding Company: First Horizon National Corporation
Bank of America, National Association: Smyrna Branch at 589 South Lowry Street, branch established on 1982/05/17; Sam Ridley Branch at 460 Sam Ridley Parkway West, branch established on 2004/12/06. Info updated 2009/11/18: Bank assets: $1,451,969.3 mil, Deposits: $1,077,176.8 mil, headquarters in Charlotte, NC, positive income , 5782 total offices , Holding Company: Bank Of America Corporation
MidSouth Bank: Sam Ridley Parkway Branch at 724 Presidents Place, branch established on 2005/07/25. Info updated 2006/05/02: Bank assets: $238.7 mil, Deposits: $204.6 mil, headquarters in Murfreesboro, TN, positive income , Commercial Lending Specialization, 5 total offices
First Bank: Smyrna Branch at 417 South Lowry Street, branch established on 2005/09/30. Info updated 2012/02/21: Bank assets: $2,074.4 mil, Deposits: $1,734.5 mil, headquarters in Lexington, TN, positive income , Commercial Lending Specialization, 54 total offices , Holding Company: First South Bancorp, Inc.
Synovus Bank: Sam Ridley Branch at 481 Sam Ridley Parkway, branch established on 2007/06/12. Info updated 2011/01/25: Bank assets: $26,863.3 mil, Deposits: $22,415.0 mil, headquarters in Columbus, GA, positive income , Commercial Lending Specialization, 296 total offices , Holding Company: Synovus Financial Corp.
4 other banks with 4 local branches
For population 15 years and over in Smyrna:
Never married: 36.1%Now married: 45.9%Separated: 1.6%Widowed: 6.6%Divorced: 9.8% For population 25 years and over in Smyrna:
High school or higher: 90.1%Bachelor's degree or higher: 27.6%Graduate or professional degree: 6.5%Unemployed: 2.8%Mean travel time to work (commute): 23.8 minutes
Education Gini index (Inequality in education) Here:
11.2Tennessee average:
11.4
Religion statistics for Smyrna, TN (based on Rutherford County data)
Religion Adherents Congregations Evangelical Protestant 71,509 202 Mainline Protestant 14,802 43 Catholic 8,600 2 Other 4,135 17 Black Protestant 1,711 10 Orthodox 90 1 None 161,757 -
Source: Clifford Grammich, Kirk Hadaway, Richard Houseal, Dale E.Jones, Alexei Krindatch, Richie Stanley and Richard H.Taylor. 2012. 2010 U.S.Religion Census: Religious Congregations & Membership Study. Association of Statisticians of American Religious Bodies. Jones, Dale E., et al. 2002. Congregations and Membership in the United States 2000. Nashville, TN: Glenmary Research Center. Graphs represent county-level data
Food Environment Statistics: Number of grocery stores : 28Rutherford County :
1.16 / 10,000 pop.State :
1.99 / 10,000 pop.
Number of supercenters and club stores : 4Here :
0.17 / 10,000 pop.Tennessee :
0.17 / 10,000 pop.
Number of convenience stores (no gas) : 9This county :
0.37 / 10,000 pop.State :
0.65 / 10,000 pop.
Number of convenience stores (with gas) : 97This county :
4.03 / 10,000 pop.Tennessee :
5.16 / 10,000 pop.
Number of full-service restaurants : 156This county :
6.48 / 10,000 pop.State :
6.56 / 10,000 pop.
Adult diabetes rate : This county :
9.4%Tennessee :
11.4%
Adult obesity rate : Here :
30.9%Tennessee :
30.2%
Low-income preschool obesity rate : Rutherford County :
16.4%Tennessee :
13.5%
Health and Nutrition: Healthy diet rate : Smyrna:
48.0%Tennessee:
49.3%
Average overall health of teeth and gums : Here:
44.8%Tennessee:
46.1%
People feeling badly about themselves : Smyrna:
21.3%Tennessee:
21.0%
People not drinking alcohol at all : Smyrna:
10.7%Tennessee:
10.5%
Average hours sleeping at night : Overweight people : This city:
32.8%Tennessee:
33.9%
General health condition : This city:
56.4%State:
55.9%
Average condition of hearing : Smyrna:
80.0%Tennessee:
79.1%
More about Health and Nutrition of Smyrna, TN Residents
Local government employment and payroll (March 2022)
Function
Full-time employees
Monthly full-time payroll
Average yearly full-time wage
Part-time employees
Monthly part-time payroll
Firefighters
92 $559,896 $73,030 0 $0 Police Protection - Officers
86 $486,276 $67,852 0 $0 Parks and Recreation
52 $208,899 $48,207 35 $50,960 Sewerage
40 $195,833 $58,750 0 $0 Other Government Administration
27 $200,516 $89,118 8 $8,996 Financial Administration
20 $110,423 $66,254 1 $2,017 Gas Supply
17 $92,867 $65,553 0 $0 Water Supply
16 $113,135 $84,851 0 $0 Police - Other
15 $78,089 $62,471 2 $4,660 Judicial and Legal
14 $88,815 $76,127 0 $0 Other and Unallocable
12 $53,623 $53,623 0 $0 Streets and Highways
8 $49,686 $74,529 1 $337 Correction
2 $7,834 $47,004 0 $0 Fire - Other
2 $9,699 $58,194 0 $0
Totals for Government
403 $2,255,591 $67,164 47 $66,970
Smyrna government finances - Expenditure in 2021 (per resident):
Construction - Regular Highways: $8,958,000 ($158.50)
Parks and Recreation: $1,927,000 ($34.10)Sewerage: $1,147,000 ($20.30)Current Operations - Water Utilities: $12,364,000 ($218.77)
Gas Utilities: $12,050,000 ($213.21)General - Other: $11,460,000 ($202.77)Police Protection: $10,733,000 ($189.91)Local Fire Protection: $9,629,000 ($170.38)Sewerage: $7,509,000 ($132.87)Parks and Recreation: $5,852,000 ($103.55)Central Staff Services: $3,762,000 ($66.57)Financial Administration: $2,108,000 ($37.30)Judicial and Legal Services: $1,447,000 ($25.60)Regular Highways: $943,000 ($16.69)General Public Buildings: $694,000 ($12.28)Public Welfare Institutions: $237,000 ($4.19)Miscellaneous Commercial Activities - Other: $70,000 ($1.24)General - Interest on Debt: $187,000 ($3.31)
Intergovernmental to Local - Other - Libraries: $384,000 ($6.79)
Other - Public Welfare - Other: $35,000 ($0.62)Other - Health - Other: $5,000 ($0.09)Intergovernmental to State - General - Other: $12,000 ($0.21)
Other Capital Outlay - Police Protection: $991,000 ($17.53)
Parks and Recreation: $811,000 ($14.35)Local Fire Protection: $423,000 ($7.48)Sewerage: $251,000 ($4.44)General Public Building: $179,000 ($3.17)Central Staff Services: $120,000 ($2.12)Financial Administration: $58,000 ($1.03)Regular Highways: $14,000 ($0.25)General - Other: $9,000 ($0.16)Total Salaries and Wages: $25,526,000 ($451.66)
Water Utilities - Interest on Debt: $168,000 ($2.97)
Smyrna government finances - Revenue in 2021 (per resident):
Charges - Sewerage: $13,928,000 ($246.44)
Parks and Recreation: $1,997,000 ($35.34)Other: $740,000 ($13.09)Miscellaneous Commercial Activities: $182,000 ($3.22)Federal Intergovernmental - Public Welfare: $1,602,000 ($28.35)
General Local Government Support: $946,000 ($16.74)Local Intergovernmental - Highways: $2,853,000 ($50.48)
Water Utilities: $518,000 ($9.17)Gas Utilities: $193,000 ($3.41)Miscellaneous - General Revenue - Other: $8,121,000 ($143.69)
Special Assessments: $6,449,000 ($114.11)Fines and Forfeits: $1,810,000 ($32.03)Interest Earnings: $1,666,000 ($29.48)Donations From Private Sources: $376,000 ($6.65)Sale of Property: $141,000 ($2.49)Rents: $105,000 ($1.86)Revenue - Water Utilities: $21,545,000 ($381.22)
Gas Utilities: $11,921,000 ($210.93)State Intergovernmental - Highways: $6,423,000 ($113.65)
General Local Government Support: $5,223,000 ($92.42)Other: $78,000 ($1.38)Public Welfare: $21,000 ($0.37)Tax - General Sales and Gross Receipts: $16,107,000 ($285.00)
Property: $11,779,000 ($208.42)Occupation and Business License - Other: $3,306,000 ($58.50)Alcoholic Beverage Sales: $1,147,000 ($20.30)Other Selective Sales: $584,000 ($10.33)Alcoholic Beverage License: $569,000 ($10.07)Public Utilities Sales: $507,000 ($8.97)
Smyrna government finances - Debt in 2021 (per resident):
Long Term Debt - Outstanding Nonguaranteed - Industrial Revenue: $37,530,000 ($664.06)
Beginning Outstanding - Unspecified Public Purpose: $28,773,000 ($509.11)Outstanding Unspecified Public Purpose: $25,279,000 ($447.29)Beginning Outstanding - Public Debt for Private Purpose: $24,765,000 ($438.19)Issue, Nonguaranteed - Public Debt for Private Purpose: $15,485,000 ($273.99)Retired Unspecified Public Purpose: $3,820,000 ($67.59)Retired Nonguaranteed - Public Debt for Private Purpose: $2,719,000 ($48.11)Issue, Unspecified Public Purpose: $327,000 ($5.79)Short Term Debt Outstanding - Beginning: $6,248,000 ($110.55)
End of Fiscal Year: $5,434,000 ($96.15)
Smyrna government finances - Cash and Securities in 2021 (per resident):
Other Funds - Cash and Securities: $356,000 ($6.30)
Sinking Funds - Cash and Securities: $37,530,000 ($664.06)
9.99% of this county's 2021 resident taxpayers lived in other counties in 2020 ($55,451 average adjusted gross income )
Here:
9.99%Tennessee average:
8.49%
0.02% of residents moved from foreign countries ($78 average AGI )Rutherford County:
0.02%Tennessee average:
0.02%
Top counties from which taxpayers relocated into this county between 2020 and 2021:
8.46% of this county's 2020 resident taxpayers moved to other counties in 2021 ($51,348 average adjusted gross income )
Here:
8.46%Tennessee average:
7.40%
0.02% of residents moved to foreign countries ($159 average AGI )Rutherford County:
0.02%Tennessee average:
0.01%
Top counties to which taxpayers relocated from this county between 2020 and 2021:
Businesses in Smyrna, TN
Name Count Name Count
ALDI 1 La Quinta 1 AT&T 1 Lane Furniture 1 Academy Sports + Outdoors 1 Little Caesars Pizza 1 Ace Hardware 1 Long John Silver's 1 Advance Auto Parts 1 Lowe's 1 Arby's 2 Maurices 1 AutoZone 1 McDonald's 3 Baskin-Robbins 1 New York & Co 1 Blockbuster 1 Panda Express 1 Buffalo Wild Wings 1 Papa John's Pizza 1 CVS 2 Payless 1 Chick-Fil-A 1 PetSmart 1 ColorTyme 1 Pizza Hut 2 Comfort Suites 1 Publix Super Markets 2 Cracker Barrel 1 Quiznos 2 Cricket Wireless 3 RadioShack 1 Curves 1 Red Robin 1 Discount Tire 1 Rite Aid 1 Domino's Pizza 1 Rodeway Inn 1 DressBarn 1 Ruby Tuesday 1 Dunkin Donuts 1 Rue21 1 Fashion Bug 1 SONIC Drive-In 3 FedEx 9 Sleep Inn 1 Firestone Complete Auto Care 1 Sprint Nextel 1 GNC 2 Staples 1 GameStop 2 Starbucks 2 Goodwill 1 Subway 3 H&R Block 2 T-Mobile 2 Hardee's 1 Taco Bell 2 Hilton 1 Target 1 Holiday Inn 1 U-Haul 3 Home Depot 1 UPS 6 IHOP 1 Verizon Wireless 1 Justice 1 Waffle House 1 KFC 1 Walgreens 3 Kmart 1 Walmart 1 Kohl's 1 Wendy's 2 Kroger 2 YMCA 1
Strongest AM radio stations in Smyrna:
WSM (650 AM; 50 kW; NASHVILLE, TN; Owner: GAYLORD ENTERTAINMENT COMPANY)
WAMB (1160 AM; 50 kW; DONELSON, TN; Owner: GREAT SOUTHERN BROADCASTING COMPANY, INC.)
WFCM (710 AM; daytime; 0 kW; SMYRNA, TN; Owner: THE MOODY BIBLE INSTITUTE OF CHICAGO)
WKDA (1200 AM; 50 kW; NASHVILLE, TN; Owner: RADIO NASHVILLE, INC.)
WLAC (1510 AM; 50 kW; NASHVILLE, TN; Owner: CAPSTAR TX LIMITED PARTNERSHIP)
WNQM (1300 AM; 50 kW; NASHVILLE, TN; Owner: WNQM. INC.)
WMGC (810 AM; 5 kW; MURFREESBORO, TN; Owner: RADIO 810 NASHVILLE, LIMITED)
WPLN (1430 AM; 15 kW; MADISON, TN)
WCOR (900 AM; 5 kW; LEBANON, TN)
WAKM (950 AM; 5 kW; FRANKLIN, TN; Owner: FRANKLIN RADIO ASSOCIATES, INC.)
WYFN (980 AM; 5 kW; NASHVILLE, TN; Owner: BIBLE BRADCASTING NETWORK, INC.)
WWAM (820 AM; daytime; 50 kW; JASPER, TN; Owner: SHELTON BROADCASTING SYSTEM)
WVOL (1470 AM; 5 kW; BERRY HILL, TN)
Strongest FM radio stations in Smyrna:
WFFH (94.1 FM; SMYRNA, TN; Owner: CARON BROADCASTING, INC.)
WMOT (89.5 FM; MURFREESBORO, TN; Owner: MIDDLE TENNESSEE STATE UNIVERSITY)
WRLT (100.1 FM; FRANKLIN, TN; Owner: TUNED-IN BROADCASTING, INC)
WBUZ (102.9 FM; LA VERGNE, TN; Owner: WYCQ, INC)
WKDF (103.3 FM; NASHVILLE, TN; Owner: CITADEL BROADCASTING COMPANY)
WNRQ (105.9 FM; NASHVILLE, TN; Owner: CAPSTAR TX LIMITED PARTNERSHIP)
WSIX-FM (97.9 FM; NASHVILLE, TN; Owner: CAPSTAR TX LIMITED PARTNERSHIP)
WGFX (104.5 FM; GALLATIN, TN; Owner: CITADEL BROADCASTING COMPANY)
WPLN-FM (90.3 FM; NASHVILLE, TN; Owner: NASHVILLE PUBLIC RADIO)
WAYM (88.7 FM; COLUMBIA, TN; Owner: WAY-FM MEDIA GROUP, INC.)
WSM-FM (95.5 FM; NASHVILLE, TN; Owner: CUMULUS LICENSING CORP.)
WMAK (96.3 FM; MURFREESBORO, TN; Owner: SOUTH CENTRAL COMMUNICATIONS CORP.)
WFCM-FM (91.7 FM; MURFREESBORO, TN; Owner: THE MOODY BIBLE INSTITUTE OF CHICAGO)
WRVW (107.5 FM; LEBANON, TN; Owner: CAPSTAR TX LIMITED PARTNERSHIP)
WWTN (99.7 FM; MANCHESTER, TN; Owner: CUMULUS LICENSING CORP.)
WNPL (106.7 FM; BELLE MEADE, TN; Owner: CUMULUS LICENSING CORP.)
WJXA (92.9 FM; NASHVILLE, TN; Owner: SOUTH CENTRAL COMMUNICATIONS CORP.)
WRVU (91.1 FM; NASHVILLE, TN; Owner: VANDERBILT STUDENT COMMUNICATIONS, INC.)
WFFI (93.7 FM; KINGSTON SPRINGS, TN; Owner: CARON BROADCASTING, INC.)
W263AI (100.5 FM; MURFREESBORO, TN; Owner: BART WALKER)
TV broadcast stations around Smyrna:
WNAB (Channel 58; NASHVILLE, TN; Owner: NASHVILLE LICENSE HOLDINGS, L.L.C.)
WHTN (Channel 39; MURFREESBORO, TN; Owner: CHRISTIAN TELEVISION NETWORK, INC.)
WKRN-TV (Channel 2; NASHVILLE, TN; Owner: WKRN, G.P.)
WSMV-TV (Channel 4; NASHVILLE, TN; Owner: MEREDITH CORPORATION)
WTVF (Channel 5; NASHVILLE, TN; Owner: NEWSCHANNEL 5 NETWORK, LP)
WZTV (Channel 17; NASHVILLE, TN; Owner: WZTV LICENSEE, LLC)
WNPT (Channel 8; NASHVILLE, TN; Owner: NASHVILLE PUBLIC TELEVISION, INC.)
WNPX (Channel 28; COOKEVILLE, TN; Owner: PAXSON COMMUNICATIONS LICENSE COMPANY, LLC)
WUXP-TV (Channel 30; NASHVILLE, TN; Owner: WUXP LICENSEE, LLC)
WETV-LP (Channel 11; MURFREESBORO, TN; Owner: CHANNEL ELEVEN, INC.)
W36AK (Channel 36; NASHVILLE, TN; Owner: TRINITY BROADCASTING NETWORK)
WHRT-LP (Channel 27; MURFREESBORO, TN; Owner: LANDMARK ARTS, INC.)
WPGD (Channel 50; HENDERSONVILLE, TN; Owner: TRINITY BROADCASTING NETWORK)
WGAP-LP (Channel 26; NASHVILLE, TN; Owner: SOUTH CENTRAL COMMUNICATIONS CORP.)
WJDE-LP (Channel 24; NASHVILLE, TN; Owner: SOUTH CENTRAL COMMUNICATIONS CORP.)
WRMX-LP (Channel 12; NASHVILLE, TN; Owner: SOUTH CENTRAL COMMUNICATIONS CORP.)
WNPX-LP (Channel 20; NASHVILLE, TN; Owner: PAXSON COMMUNICATIONS LPTV, INC.)
WJNK-LP (Channel 61; NASHVILLE, TN; Owner: THREE ANGELS BROADCASTING NETWORK, INC.)
WJFB (Channel 66; LEBANON, TN; Owner: BRYANT BROADCASTING, INC.)
W52CT (Channel 52; NASHVILLE, TN; Owner: JKB ASSOCIATES, INC.)
WIIW-LP (Channel 14; NASHVILLE, TN; Owner: EQUITY BROADCASTING CORPORATION)
National Bridge Inventory (NBI) Statistics 102 Number of bridges1,299ft / 396m Total length $31,865,000 Total costs2,750,005 Total average daily traffic316,518 Total average daily truck traffic
New bridges - historical statistics
1 1920-1929 1 1930-1939 4 1940-1949 3 1950-1959 21 1960-1969 15 1970-1979 26 1980-1989 19 1990-1999 8 2000-2009 4 2010-2019
See full National Bridge Inventory statistics for Smyrna, TN
Home Mortgage Disclosure Act Aggregated Statistics For Year 2009(Based on 5 partial tracts) A) FHA, FSA/RHS & VA B) Conventional C) Refinancings D) Home Improvement Loans F) Non-occupant Loans on G) Loans On Manufactured Number Average Value Number Average Value Number Average Value Number Average Value Number Average Value Number Average Value
LOANS ORIGINATED 238 $134,098 86 $115,714 531 $134,910 18 $75,794 31 $102,184 1 $16,230 APPLICATIONS APPROVED, NOT ACCEPTED 6 $148,765 2 $190,785 40 $131,896 3 $19,293 1 $75,730 0 $0 APPLICATIONS DENIED 25 $148,071 19 $103,165 175 $135,586 25 $13,790 7 $76,810 4 $33,180 APPLICATIONS WITHDRAWN 28 $130,660 26 $142,026 139 $139,741 4 $40,420 5 $106,780 0 $0 FILES CLOSED FOR INCOMPLETENESS 1 $188,040 3 $93,237 35 $139,774 0 $0 3 $95,553 0 $0
Aggregated Statistics For Year 2008(Based on 5 partial tracts) A) FHA, FSA/RHS & VA B) Conventional C) Refinancings D) Home Improvement Loans F) Non-occupant Loans on G) Loans On Manufactured Number Average Value Number Average Value Number Average Value Number Average Value Number Average Value Number Average Value
LOANS ORIGINATED 180 $142,044 181 $132,113 350 $131,406 39 $36,498 67 $121,810 4 $207,105 APPLICATIONS APPROVED, NOT ACCEPTED 5 $152,970 19 $114,414 41 $126,517 5 $16,498 3 $95,197 4 $41,485 APPLICATIONS DENIED 24 $142,617 18 $112,467 225 $132,902 60 $47,554 11 $93,494 5 $47,104 APPLICATIONS WITHDRAWN 12 $133,988 22 $127,984 104 $142,471 10 $74,183 3 $132,323 2 $92,070 FILES CLOSED FOR INCOMPLETENESS 3 $155,417 4 $212,630 22 $133,889 2 $76,505 2 $93,545 0 $0
Aggregated Statistics For Year 2007(Based on 5 partial tracts) A) FHA, FSA/RHS & VA B) Conventional C) Refinancings D) Home Improvement Loans F) Non-occupant Loans on G) Loans On Manufactured Number Average Value Number Average Value Number Average Value Number Average Value Number Average Value Number Average Value
LOANS ORIGINATED 130 $149,215 558 $120,261 375 $125,204 59 $48,474 108 $103,930 8 $55,028 APPLICATIONS APPROVED, NOT ACCEPTED 4 $140,718 71 $106,333 72 $112,360 13 $56,682 12 $101,368 6 $70,692 APPLICATIONS DENIED 10 $132,857 76 $105,811 294 $123,887 78 $59,428 19 $99,243 9 $59,213 APPLICATIONS WITHDRAWN 13 $132,619 57 $119,145 132 $128,119 10 $67,612 10 $102,259 0 $0 FILES CLOSED FOR INCOMPLETENESS 1 $95,830 10 $156,632 45 $123,624 2 $93,530 2 $214,065 0 $0
Aggregated Statistics For Year 2006(Based on 5 partial tracts) A) FHA, FSA/RHS & VA B) Conventional C) Refinancings D) Home Improvement Loans E) Loans on Dwellings For 5+ Families F) Non-occupant Loans on G) Loans On Manufactured Number Average Value Number Average Value Number Average Value Number Average Value Number Average Value Number Average Value Number Average Value
LOANS ORIGINATED 123 $142,248 716 $101,582 365 $107,360 63 $30,312 1 $23,180 174 $83,154 19 $44,429 APPLICATIONS APPROVED, NOT ACCEPTED 3 $186,220 90 $84,723 80 $106,963 7 $39,890 0 $0 21 $75,716 9 $41,196 APPLICATIONS DENIED 17 $123,556 141 $89,491 298 $112,180 71 $33,438 0 $0 46 $66,427 28 $48,640 APPLICATIONS WITHDRAWN 11 $125,449 86 $109,738 205 $122,637 9 $55,497 0 $0 18 $99,079 1 $77,280 FILES CLOSED FOR INCOMPLETENESS 1 $140,360 21 $93,750 49 $119,155 3 $54,157 0 $0 6 $94,570 0 $0
Aggregated Statistics For Year 2005(Based on 5 partial tracts) A) FHA, FSA/RHS & VA B) Conventional C) Refinancings D) Home Improvement Loans F) Non-occupant Loans on G) Loans On Manufactured Number Average Value Number Average Value Number Average Value Number Average Value Number Average Value Number Average Value
LOANS ORIGINATED 195 $134,741 685 $97,729 405 $104,031 43 $43,049 105 $90,820 14 $46,214 APPLICATIONS APPROVED, NOT ACCEPTED 6 $132,407 81 $84,100 91 $97,298 11 $40,906 9 $71,744 16 $34,024 APPLICATIONS DENIED 13 $124,391 102 $91,874 336 $113,768 63 $27,113 16 $91,459 21 $64,897 APPLICATIONS WITHDRAWN 11 $130,982 98 $100,766 271 $118,649 19 $93,031 19 $122,047 1 $131,650 FILES CLOSED FOR INCOMPLETENESS 2 $166,665 36 $83,898 38 $102,047 6 $68,527 2 $90,945 0 $0
Aggregated Statistics For Year 2004(Based on 5 partial tracts) A) FHA, FSA/RHS & VA B) Conventional C) Refinancings D) Home Improvement Loans F) Non-occupant Loans on G) Loans On Manufactured Number Average Value Number Average Value Number Average Value Number Average Value Number Average Value Number Average Value
LOANS ORIGINATED 232 $124,826 526 $93,379 457 $105,150 41 $31,277 61 $89,617 28 $39,491 APPLICATIONS APPROVED, NOT ACCEPTED 8 $119,694 65 $91,418 97 $108,896 9 $20,889 5 $96,874 12 $39,479 APPLICATIONS DENIED 31 $117,286 115 $85,688 330 $106,346 56 $28,377 9 $102,537 33 $47,364 APPLICATIONS WITHDRAWN 23 $123,941 60 $103,879 235 $114,632 8 $45,419 8 $86,632 3 $75,023 FILES CLOSED FOR INCOMPLETENESS 2 $102,355 27 $91,022 34 $117,190 3 $37,287 1 $65,690 0 $0
Aggregated Statistics For Year 2003(Based on 5 partial tracts) A) FHA, FSA/RHS & VA B) Conventional C) Refinancings D) Home Improvement Loans F) Non-occupant Loans on Number Average Value Number Average Value Number Average Value Number Average Value Number Average Value
LOANS ORIGINATED 286 $120,007 367 $99,275 1,007 $106,481 38 $14,562 65 $79,750 APPLICATIONS APPROVED, NOT ACCEPTED 5 $128,876 58 $79,214 126 $106,328 9 $18,211 7 $78,086 APPLICATIONS DENIED 41 $114,692 99 $75,808 275 $102,493 51 $18,874 14 $104,117 APPLICATIONS WITHDRAWN 25 $123,076 49 $111,966 207 $114,600 1 $32,440 4 $120,202 FILES CLOSED FOR INCOMPLETENESS 3 $110,963 22 $108,234 35 $108,439 2 $20,720 2 $82,625
Aggregated Statistics For Year 2002(Based on 3 partial tracts) A) FHA, FSA/RHS & VA B) Conventional C) Refinancings D) Home Improvement Loans F) Non-occupant Loans on Number Average Value Number Average Value Number Average Value Number Average Value Number Average Value
LOANS ORIGINATED 220 $123,741 269 $98,861 501 $105,814 28 $10,439 33 $73,968 APPLICATIONS APPROVED, NOT ACCEPTED 6 $105,190 41 $79,838 75 $95,143 10 $18,682 6 $65,667 APPLICATIONS DENIED 22 $110,793 101 $64,081 199 $93,172 30 $18,347 5 $54,264 APPLICATIONS WITHDRAWN 10 $116,651 22 $98,184 95 $194,360 3 $107,090 4 $88,798 FILES CLOSED FOR INCOMPLETENESS 2 $125,965 14 $65,086 24 $114,133 0 $0 0 $0
Aggregated Statistics For Year 2001(Based on 3 partial tracts) A) FHA, FSA/RHS & VA B) Conventional C) Refinancings D) Home Improvement Loans E) Loans on Dwellings For 5+ Families F) Non-occupant Loans on Number Average Value Number Average Value Number Average Value Number Average Value Number Average Value Number Average Value
LOANS ORIGINATED 189 $120,069 200 $100,014 427 $105,104 35 $15,680 2 $685,475 28 $80,459 APPLICATIONS APPROVED, NOT ACCEPTED 6 $125,708 31 $62,707 50 $92,776 8 $13,018 0 $0 1 $54,100 APPLICATIONS DENIED 34 $109,757 65 $61,029 197 $93,157 39 $15,089 0 $0 4 $55,818 APPLICATIONS WITHDRAWN 11 $124,018 25 $100,008 97 $91,756 2 $11,205 1 $193,200 2 $25,115 FILES CLOSED FOR INCOMPLETENESS 3 $126,530 9 $92,923 26 $106,154 1 $19,840 0 $0 0 $0
Aggregated Statistics For Year 2000(Based on 3 partial tracts) A) FHA, FSA/RHS & VA B) Conventional C) Refinancings D) Home Improvement Loans E) Loans on Dwellings For 5+ Families F) Non-occupant Loans on Number Average Value Number Average Value Number Average Value Number Average Value Number Average Value Number Average Value
LOANS ORIGINATED 150 $111,931 207 $87,914 131 $84,855 44 $16,413 2 $624,035 20 $61,329 APPLICATIONS APPROVED, NOT ACCEPTED 8 $78,659 47 $50,784 46 $76,122 14 $15,097 0 $0 4 $41,898 APPLICATIONS DENIED 22 $87,333 90 $58,132 170 $72,937 49 $18,414 0 $0 3 $46,837 APPLICATIONS WITHDRAWN 16 $110,418 22 $82,768 72 $78,503 5 $16,758 0 $0 8 $53,535 FILES CLOSED FOR INCOMPLETENESS 0 $0 9 $82,976 24 $71,315 0 $0 0 $0 0 $0
Aggregated Statistics For Year 1999(Based on 4 partial tracts) A) FHA, FSA/RHS & VA B) Conventional C) Refinancings D) Home Improvement Loans E) Loans on Dwellings For 5+ Families F) Non-occupant Loans on Number Average Value Number Average Value Number Average Value Number Average Value Number Average Value Number Average Value
LOANS ORIGINATED 221 $108,542 291 $103,991 297 $86,733 68 $13,567 1 $114,980 30 $108,728 APPLICATIONS APPROVED, NOT ACCEPTED 4 $115,002 59 $60,337 92 $80,821 19 $14,315 0 $0 4 $60,902 APPLICATIONS DENIED 14 $100,021 140 $48,277 182 $91,829 50 $12,432 0 $0 5 $68,358 APPLICATIONS WITHDRAWN 24 $101,732 40 $94,006 122 $81,072 7 $38,907 0 $0 6 $75,535 FILES CLOSED FOR INCOMPLETENESS 1 $155,830 9 $76,567 18 $86,098 0 $0 0 $0 1 $104,380
Detailed HMDA statistics for the following Tracts:
0403.01
, 0403.02 , 0404.01 , 0404.03 , 0404.04
Private Mortgage Insurance Companies Aggregated Statistics For Year 2009(Based on 5 partial tracts) A) Conventional B) Refinancings Number Average Value Number Average Value
LOANS ORIGINATED 18 $138,333 20 $154,460 APPLICATIONS APPROVED, NOT ACCEPTED 3 $182,443 10 $150,673 APPLICATIONS DENIED 3 $123,487 4 $155,145 APPLICATIONS WITHDRAWN 1 $127,200 2 $159,195 FILES CLOSED FOR INCOMPLETENESS 1 $81,140 1 $148,990
Aggregated Statistics For Year 2008(Based on 5 partial tracts) A) Conventional B) Refinancings C) Non-occupant Loans on Number Average Value Number Average Value Number Average Value
LOANS ORIGINATED 78 $143,730 37 $142,935 11 $144,135 APPLICATIONS APPROVED, NOT ACCEPTED 24 $144,158 21 $165,121 2 $125,580 APPLICATIONS DENIED 2 $142,795 3 $133,157 1 $89,850 APPLICATIONS WITHDRAWN 2 $228,250 1 $140,400 0 $0 FILES CLOSED FOR INCOMPLETENESS 4 $140,312 1 $76,510 1 $59,510
Aggregated Statistics For Year 2007(Based on 5 partial tracts) A) Conventional B) Refinancings C) Non-occupant Loans on Number Average Value Number Average Value Number Average Value
LOANS ORIGINATED 184 $144,744 54 $146,504 12 $127,600 APPLICATIONS APPROVED, NOT ACCEPTED 21 $155,465 12 $135,912 0 $0 APPLICATIONS DENIED 2 $106,300 1 $114,370 0 $0 APPLICATIONS WITHDRAWN 4 $128,215 3 $150,320 0 $0 FILES CLOSED FOR INCOMPLETENESS 2 $125,750 0 $0 1 $98,920
Aggregated Statistics For Year 2006(Based on 5 partial tracts) A) Conventional B) Refinancings C) Non-occupant Loans on Number Average Value Number Average Value Number Average Value
LOANS ORIGINATED 73 $144,209 42 $142,552 4 $95,408 APPLICATIONS APPROVED, NOT ACCEPTED 13 $155,488 10 $138,701 0 $0 APPLICATIONS DENIED 0 $0 0 $0 0 $0 APPLICATIONS WITHDRAWN 3 $185,890 2 $116,695 0 $0 FILES CLOSED FOR INCOMPLETENESS 0 $0 0 $0 0 $0
Aggregated Statistics For Year 2005(Based on 5 partial tracts) A) Conventional B) Refinancings C) Non-occupant Loans on Number Average Value Number Average Value Number Average Value
LOANS ORIGINATED 57 $143,991 51 $129,420 6 $99,635 APPLICATIONS APPROVED, NOT ACCEPTED 10 $165,681 19 $122,083 2 $57,185 APPLICATIONS DENIED 0 $0 2 $112,530 0 $0 APPLICATIONS WITHDRAWN 3 $140,793 4 $131,182 0 $0 FILES CLOSED FOR INCOMPLETENESS 0 $0 0 $0 0 $0
Aggregated Statistics For Year 2004(Based on 5 partial tracts) A) Conventional B) Refinancings C) Non-occupant Loans on Number Average Value Number Average Value Number Average Value
LOANS ORIGINATED 83 $116,845 58 $125,260 15 $90,927 APPLICATIONS APPROVED, NOT ACCEPTED 12 $126,141 21 $102,838 1 $108,410 APPLICATIONS DENIED 0 $0 0 $0 0 $0 APPLICATIONS WITHDRAWN 1 $63,890 4 $126,622 2 $112,830 FILES CLOSED FOR INCOMPLETENESS 1 $97,370 1 $103,560 0 $0
Aggregated Statistics For Year 2003(Based on 5 partial tracts) A) Conventional B) Refinancings C) Non-occupant Loans on Number Average Value Number Average Value Number Average Value
LOANS ORIGINATED 73 $123,345 155 $122,158 6 $88,443 APPLICATIONS APPROVED, NOT ACCEPTED 6 $157,860 30 $120,431 0 $0 APPLICATIONS DENIED 1 $69,880 2 $143,110 0 $0 APPLICATIONS WITHDRAWN 1 $92,350 10 $138,743 0 $0 FILES CLOSED FOR INCOMPLETENESS 0 $0 1 $77,280 0 $0
Aggregated Statistics For Year 2002(Based on 3 partial tracts) A) Conventional B) Refinancings C) Non-occupant Loans on Number Average Value Number Average Value Number Average Value
LOANS ORIGINATED 53 $140,468 88 $127,180 6 $107,722 APPLICATIONS APPROVED, NOT ACCEPTED 4 $128,318 19 $111,996 1 $51,000 APPLICATIONS DENIED 0 $0 5 $108,770 2 $73,415 APPLICATIONS WITHDRAWN 1 $124,240 4 $140,032 0 $0 FILES CLOSED FOR INCOMPLETENESS 0 $0 0 $0 0 $0
Aggregated Statistics For Year 2001(Based on 3 partial tracts) A) Conventional B) Refinancings C) Non-occupant Loans on Number Average Value Number Average Value Number Average Value
LOANS ORIGINATED 60 $132,660 59 $123,016 3 $90,193 APPLICATIONS APPROVED, NOT ACCEPTED 6 $122,468 4 $118,080 1 $77,130 APPLICATIONS DENIED 0 $0 2 $144,525 0 $0 APPLICATIONS WITHDRAWN 0 $0 1 $223,320 0 $0 FILES CLOSED FOR INCOMPLETENESS 0 $0 1 $102,010 0 $0
Aggregated Statistics For Year 2000(Based on 3 partial tracts) A) Conventional B) Refinancings C) Non-occupant Loans on Number Average Value Number Average Value Number Average Value
LOANS ORIGINATED 45 $114,982 18 $102,781 2 $68,620 APPLICATIONS APPROVED, NOT ACCEPTED 5 $107,132 3 $117,953 0 $0 APPLICATIONS DENIED 0 $0 0 $0 0 $0 APPLICATIONS WITHDRAWN 1 $132,920 0 $0 0 $0 FILES CLOSED FOR INCOMPLETENESS 0 $0 0 $0 0 $0
Aggregated Statistics For Year 1999(Based on 4 partial tracts) A) Conventional B) Refinancings Number Average Value Number Average Value
LOANS ORIGINATED 67 $122,109 43 $101,665 APPLICATIONS APPROVED, NOT ACCEPTED 3 $124,740 10 $103,568 APPLICATIONS DENIED 1 $96,930 1 $76,210 APPLICATIONS WITHDRAWN 0 $0 1 $126,190 FILES CLOSED FOR INCOMPLETENESS 1 $71,580 0 $0
Detailed PMIC statistics for the following Tracts:
0403.01
, 0403.02 , 0404.01 , 0404.03 , 0404.04 Fire-safe hotels and motels in Smyrna, Tennessee:
Hampton Inn & Suites Nashville/Smyrna, 2573 Highwood Blvd, Smyrna, Tennessee 37167 Phone: (615) 355-8432, Fax: (615) 355-8629
Sleep Inn And Suites, 2689 Highwood Blvd, Smyrna, Tennessee 37167 Phone: (615) 220-2260, Fax: (615) 220-2109
Rodeway Inn & Suites, 1300 Plaza Dr, Smyrna, Tennessee 37167 Phone: (615) 355-6161, Fax: (615) 355-6556
Hilton Garden Inn Nashville/Smyrna, 2631 Highwood Blvd, Smyrna, Tennessee 37167 Phone: (615) 355-6262, Fax: (615) 355-6263
Holiday Inn Express & Suites, 2565 Highwood Blvd, Smyrna, Tennessee 37167 Phone: (615) 893-9992, Fax: (615) 893-9994
Comfort Suites Smyrna TN, 3001 Highwoods Blvd, Smyrna, Tennessee 37167 Phone: (615) 625-9000, Fax: (615) 625-9020
Laquinta Inn & Suites, 2537 Highwood Blvd, Smyrna, Tennessee 37167 Phone: (615) 220-8845, Fax: (615) 220-8846
Candlewood Suites Smyrna/Nashville, 930 Colonnade Dr, Smyrna, Tennessee 37167 Phone: (614) 429-1193, Fax: (615) 442-8428
4 other hotels and motels
All 12 fire-safe hotels and motels in Smyrna, Tennessee
Most common first names in Smyrna, TN among deceased individuals Name Count Lived (average)
James 159 70.0 years Mary 138 77.9 years William 108 71.8 years John 98 71.8 years Robert 96 69.1 years Charles 48 64.2 years Dorothy 45 75.3 years George 43 72.2 years Thomas 36 71.7 years Betty 33 68.8 years
Most common last names in Smyrna, TN among deceased individuals Last name Count Lived (average)
Smith 61 73.7 years Jones 47 69.8 years Williams 36 75.1 years Johnson 34 73.6 years Brown 34 74.7 years Coleman 24 80.3 years Wilson 23 71.5 years Tucker 22 81.9 years Davis 22 72.8 years Carter 21 75.3 years
Smyrna compared to Tennessee state average:
Unemployed percentage significantly below state average. Black race population percentage above state average. Hispanic race population percentage significantly above state average. Median age below state average. Foreign-born population percentage significantly above state average. Length of stay since moving in significantly above state average. House age below state average. Number of college students above state average.
#7 on the list of "Top 101 cities with the largest percentage of people in institutions for the blind (population 1,000+)"
#55 on the list of "Top 101 cities with largest percentage of females in industries: information (population 5,000+)"
#90 on the list of "Top 101 cities with largest percentage of females in occupations: office and administrative support occupations (population 5,000+)"
#34 on the list of "Top 101 counties with the lowest percentage of residents relocating from foreign countries between 2010 and 2011"
#70 on the list of "Top 101 counties with the lowest number of deaths per 1000 residents 2007-2013 (pop. 50,000+)"
#89 on the list of "Top 101 counties with the largest number of people moving in compared to moving out (pop. 50,000+)"
Top Patent Applicants
Sergio Flores (7)
Donald V. Merrifield (4)
Jon P. Yarbrough (3)
Jeremy L. Norris (3)
Daniel Hall (3)
Kenneth Hatcher (3)
Kurt H. Copley (3)
Edwin T. Koehler (3)
Tod J. Miller (2)
Coni Wimsatt (2)
Total of 74 patent applications in 2008-2024.
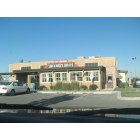


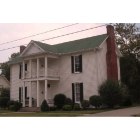
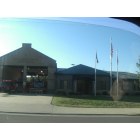


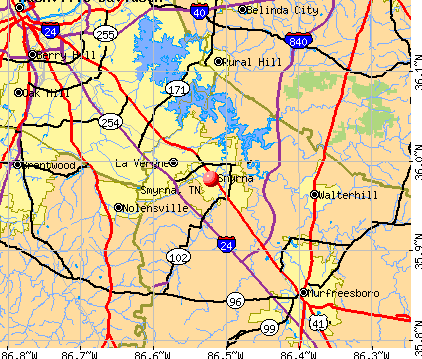


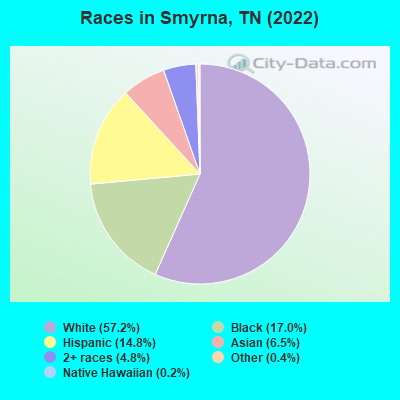
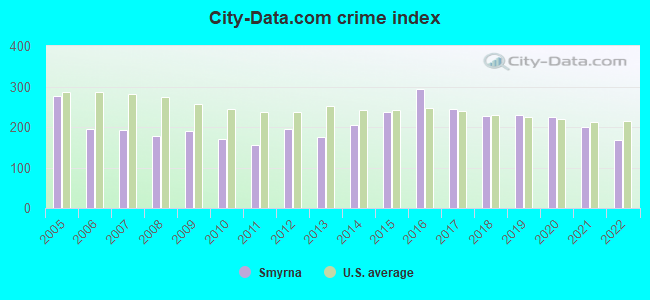
 Recent articles from our blog. Our writers, many of them Ph.D. graduates or candidates, create easy-to-read articles on a wide variety of topics.

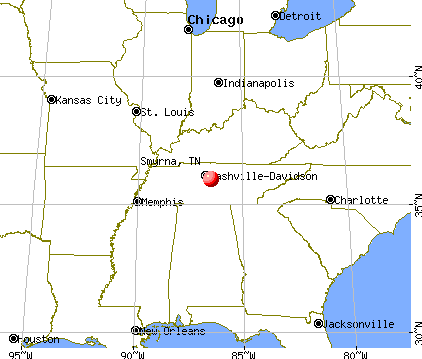
 (11.0 miles
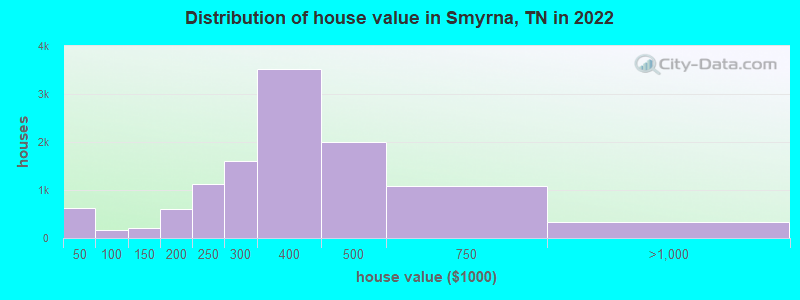

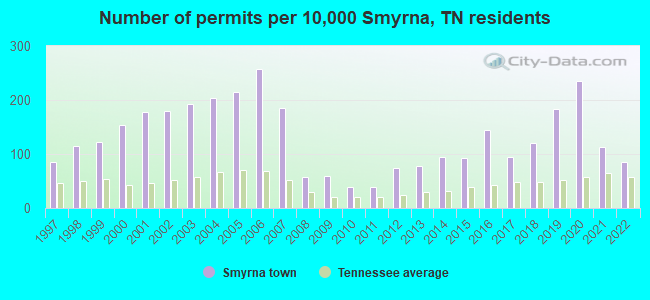
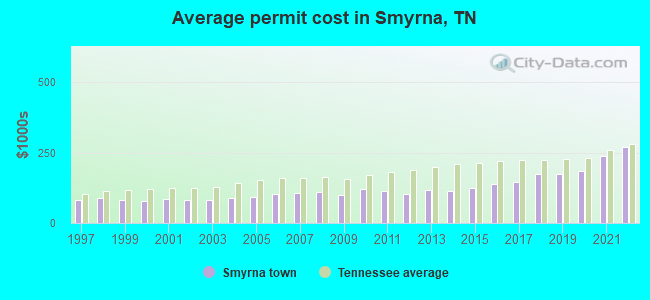
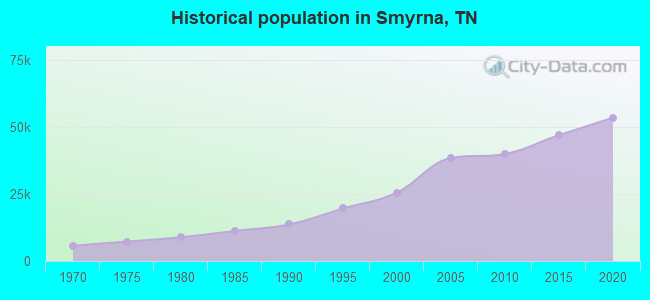
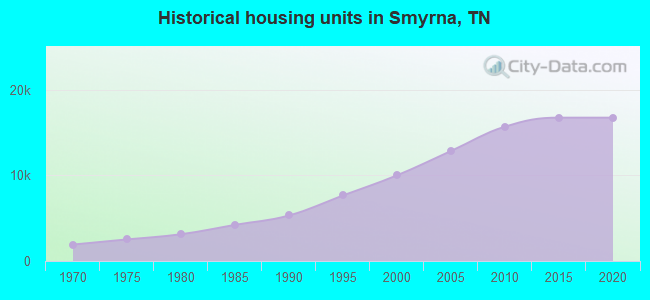
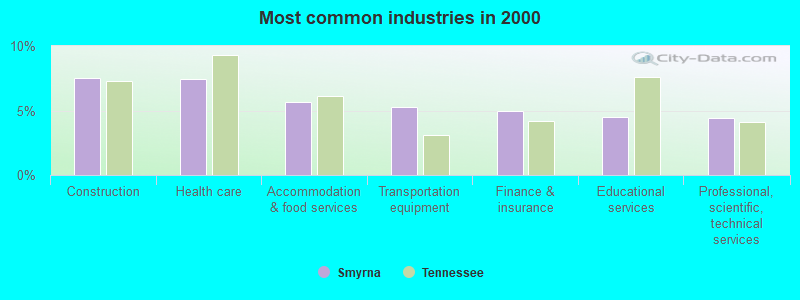
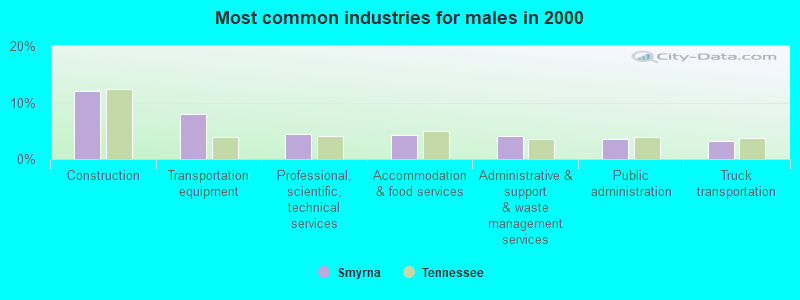
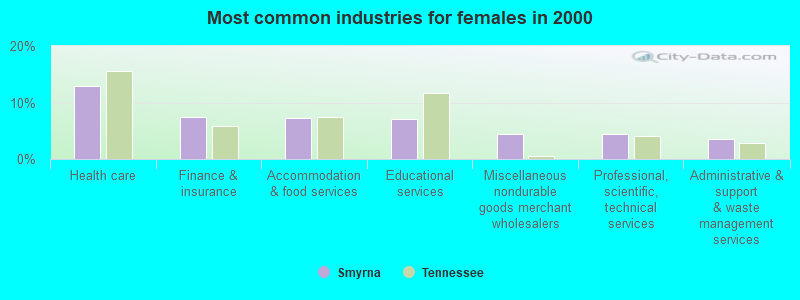
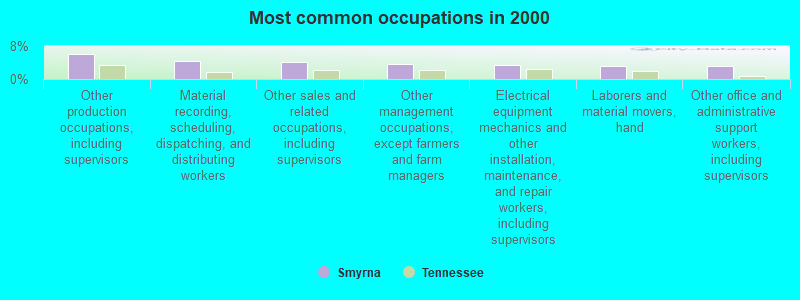
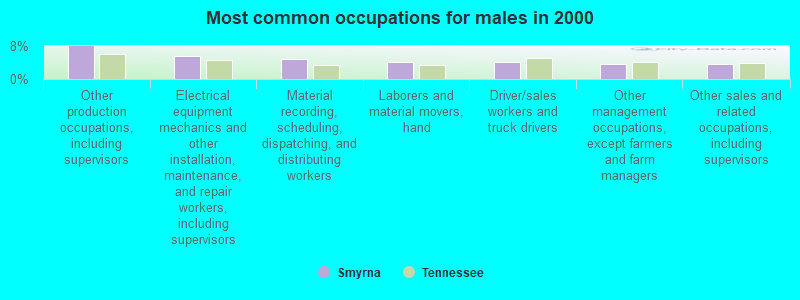
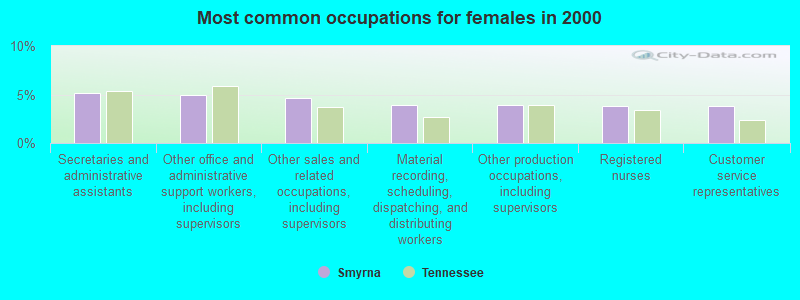
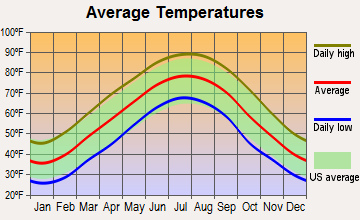


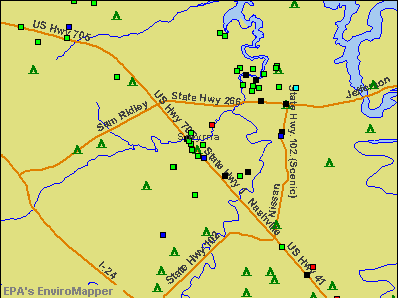

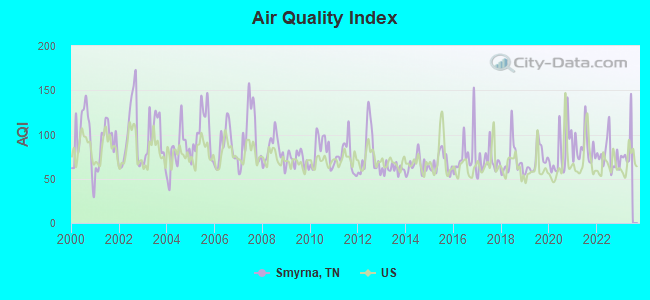
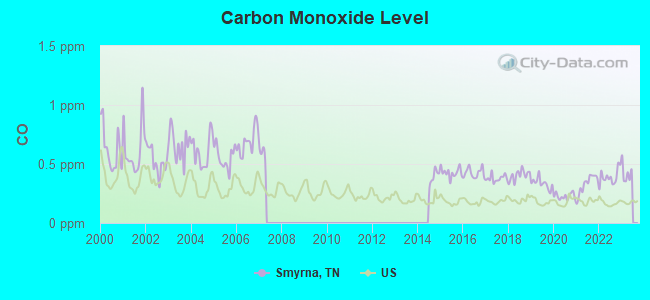
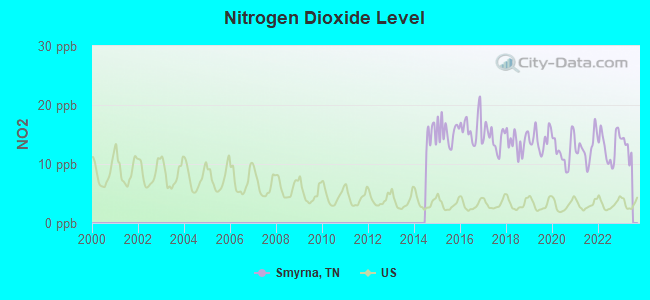
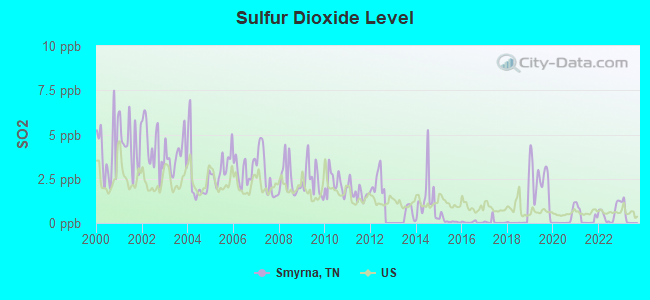
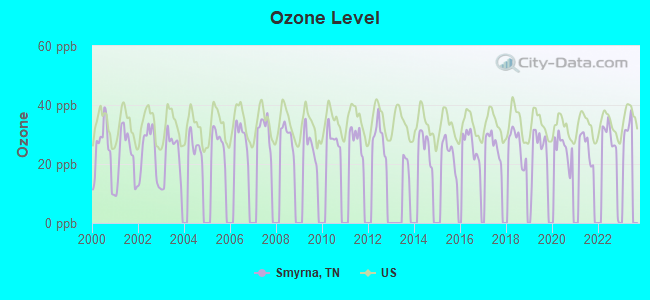
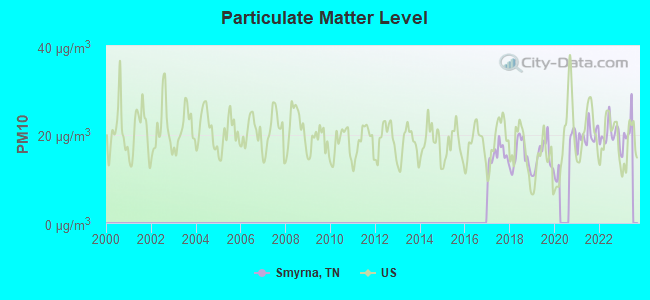
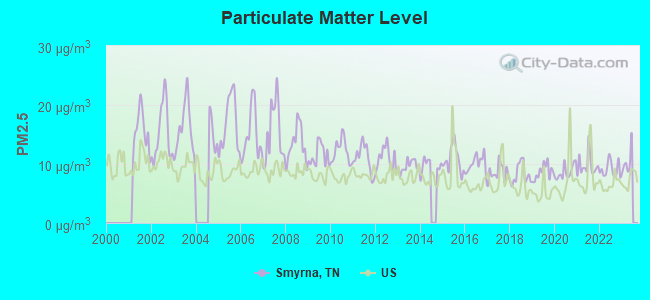
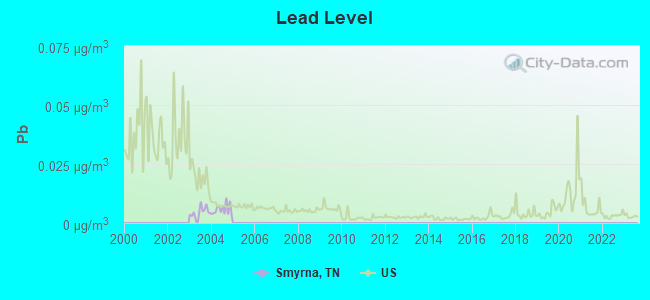

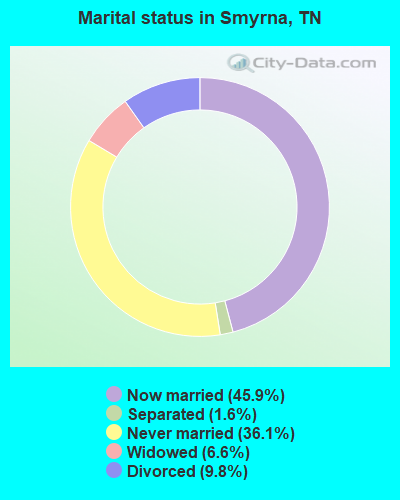
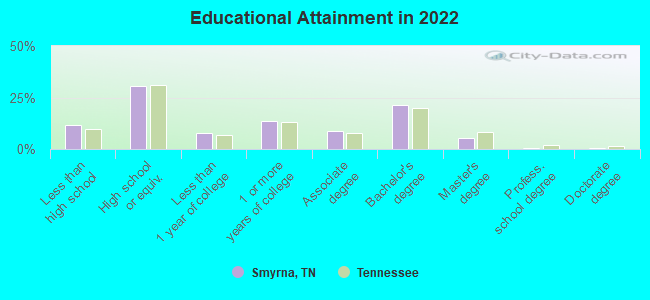
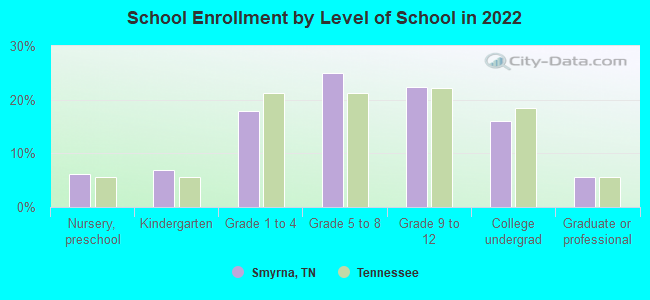
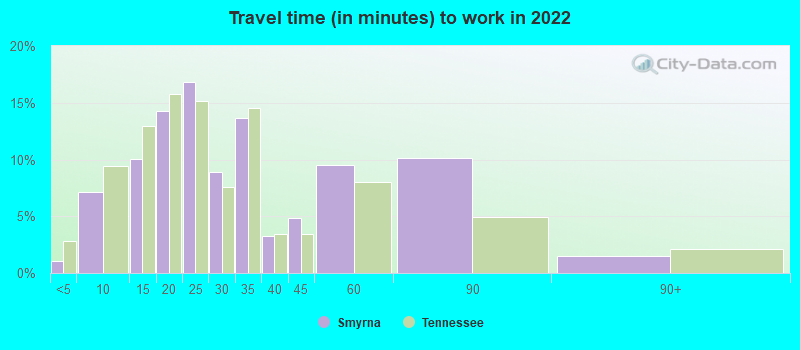
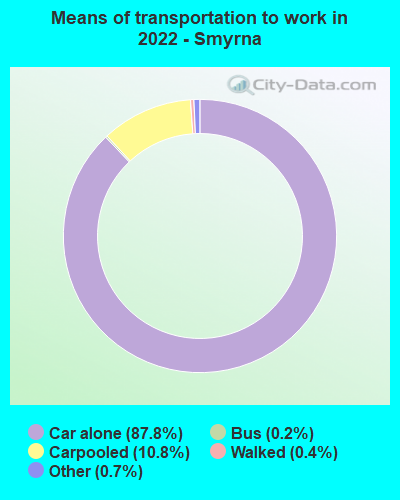
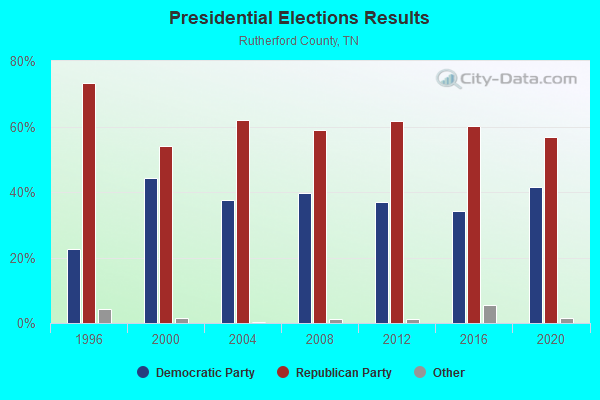
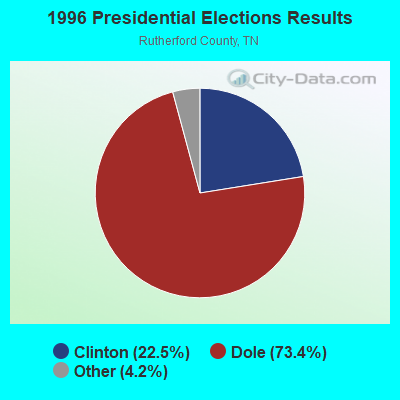
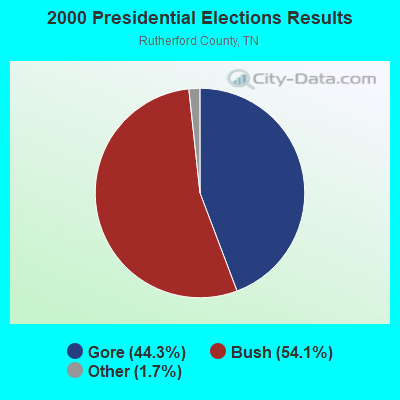
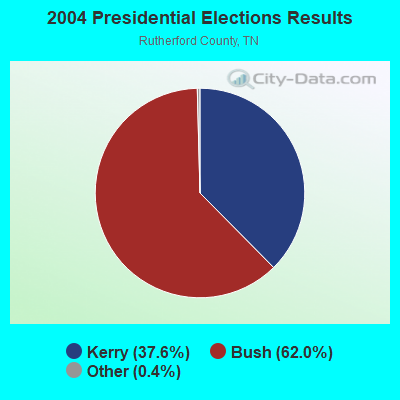
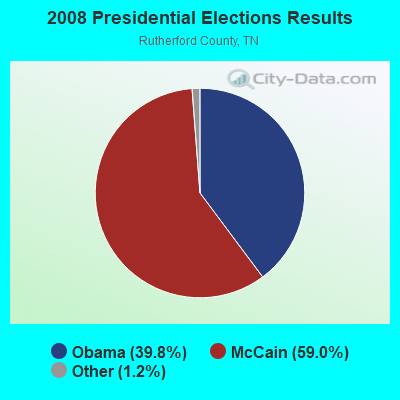
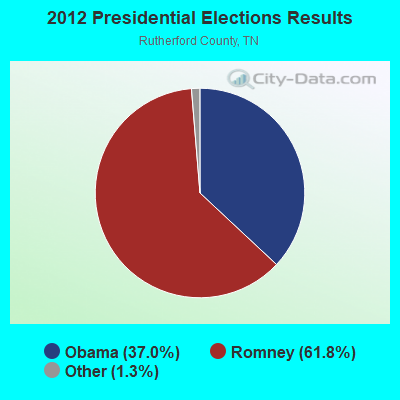
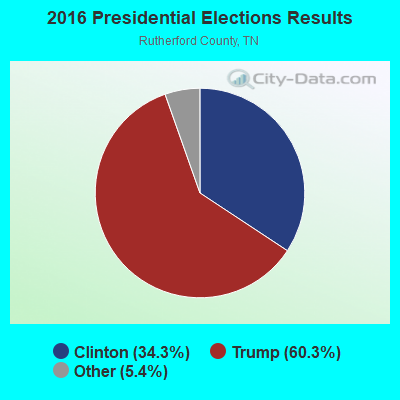
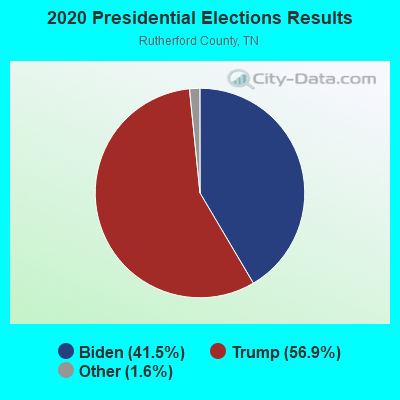
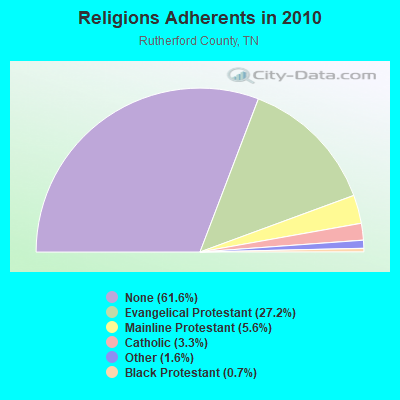
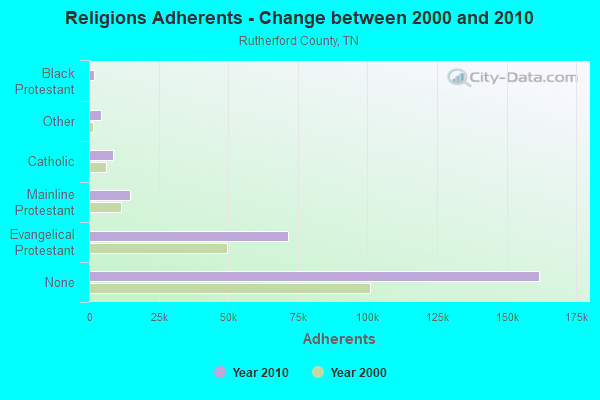
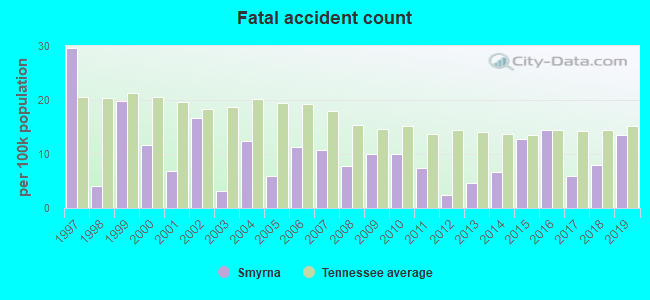
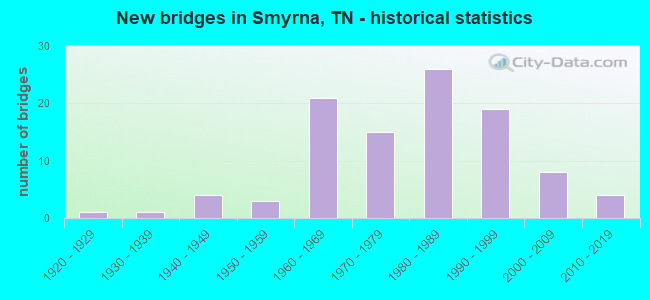
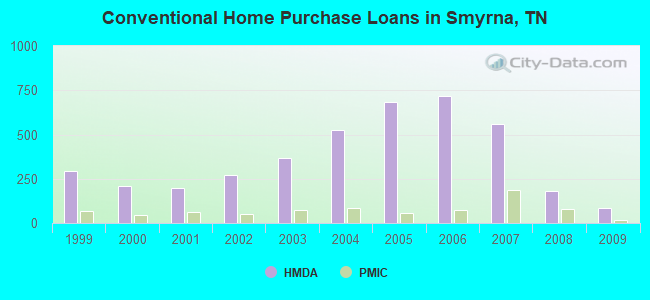
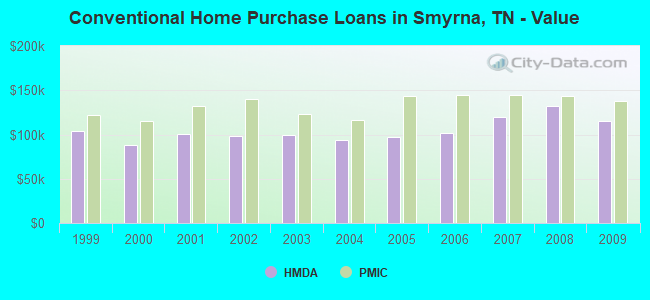
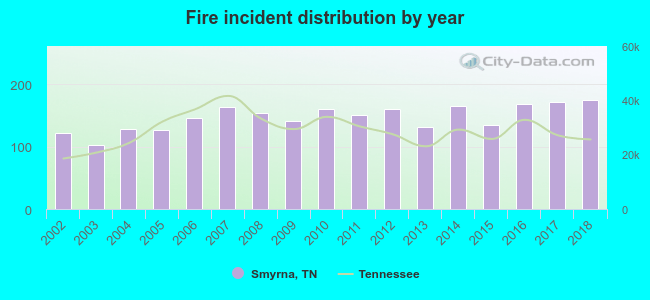 According to the data from the years 2002 - 2018 the average number of fire incidents per year is 147. The highest number of reported fires - 174 took place in 2018, and the least - 102 in 2003. The data has a rising trend.
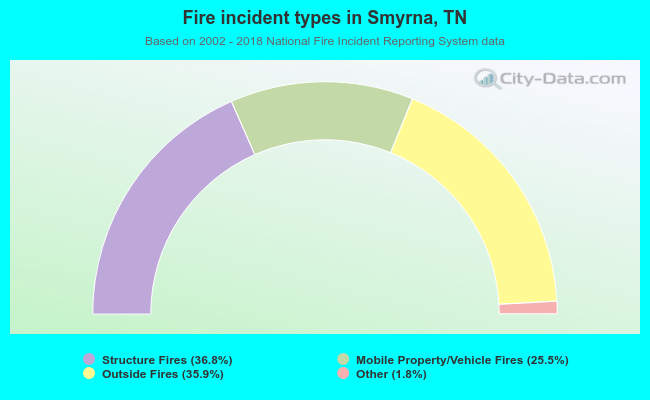 When looking into fire subcategories, the most reports belonged to: Structure Fires (36.8%), and Outside Fires (35.9%).