Van Buren County, Arkansas (AR)
County owner-occupied free and clear houses and condos in 2010: 2,981
County owner-occupied houses and condos in 2000: 5,537
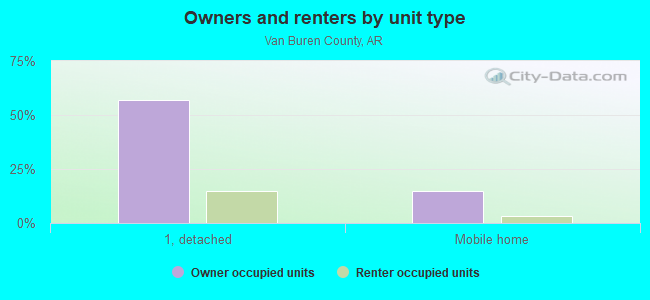
Renter-occupied apartments: 1,644 (it was 1,288 in 2000)
| % of renters here: | 19% |
| State: | 33% |
Land area: 712 sq. mi.
Water area: 12.8 sq. mi.
Population density: 23 people per square mile (low).
Industries providing employment: Educational, health and social services (22.7%), Retail trade (11.8%), Manufacturing (10.8%), Transportation and warehousing,and utilities (10.7%).
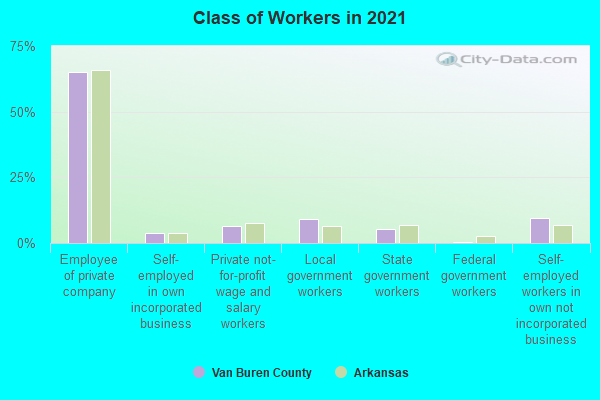
Type of workers:
- Private wage or salary: 77%
- Government: 14%
- Self-employed, not incorporated: 7%
- Unpaid family work: 2%
- OSM Map
- General Map
- Google Map
- MSN Map

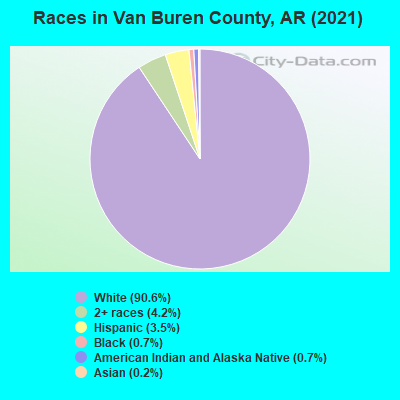
- 14,26590.2%White Non-Hispanic Alone
- 6614.2%Two or more races
- 5773.6%Hispanic or Latino
- 1340.8%American Indian and Alaska Native alone
- 1130.7%Black Non-Hispanic Alone
- 510.3%Asian alone
- 210.1%Native Hawaiian and Other
Pacific Islander alone
| Median resident age: | 50.3 years |
| Arkansas median age: | 38.9 years |
| Males: 7,881 | |
| Females: 8,161 |

 | what's NW AR like for retired gay couple (14 replies) |
| Korea War (150 replies) |
| History, folklore, stories about Oxley, Timbo, Leslie (11 replies) |
| What is attracting California and west coast folks to Northwest Arkansas? (541 replies) |
| Pictures of Arkansas (623 replies) |
| Ice Storm? (106 replies) |
| Van Buren County: | 2.0 people |
| Arkansas: | 2 people |
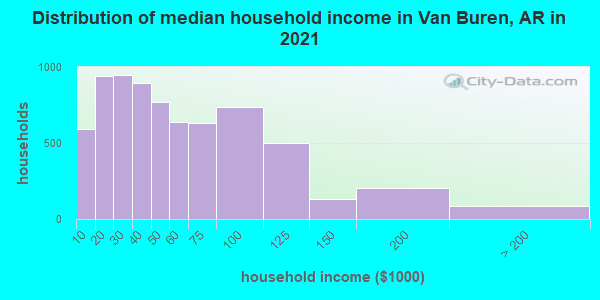
Estimated median household income in 2022: $45,034 ($27,004 in 1999)
| This county: | $45,034 |
| Arkansas: | $55,432 |
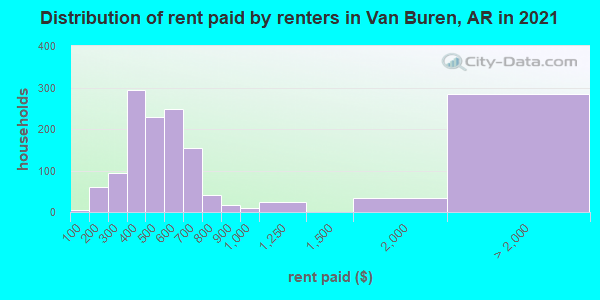
Median contract rent in 2022 for apartments: $483 (lower quartile is $369, upper quartile is $606)
| This county: | $483 |
| State: | $654 |
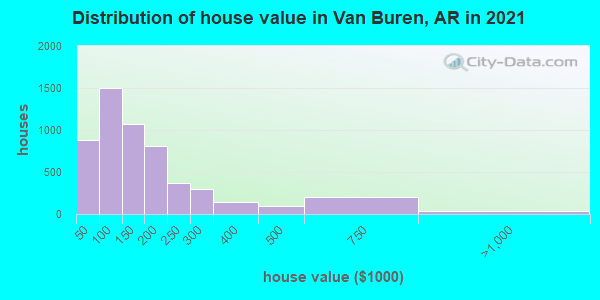
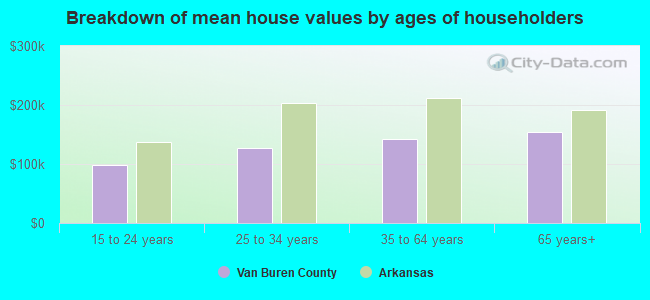
Estimated median house or condo value in 2022: $130,532 (it was $57,900 in 2000)
| Van Buren: | $130,532 |
| Arkansas: | $179,800 |
Mean price in 2022:
Median monthly housing costs for homes and condos with a mortgage: $1,077Detached houses: $210,027
Here: $210,027 State: $243,881 Townhouses or other attached units: $203,574
Here: $203,574 State: $244,376 In 3-to-4-unit structures: $197,046
Here: $197,046 State: $216,658 In 5-or-more-unit structures: $84,466
Here: $84,466 State: $227,195 Mobile homes: $66,458
Here: $66,458 State: $79,566 Occupied boats, RVs, vans, etc.: $4,520
Here: $4,520 State: $127,304
Median monthly housing costs for units without a mortgage: $370
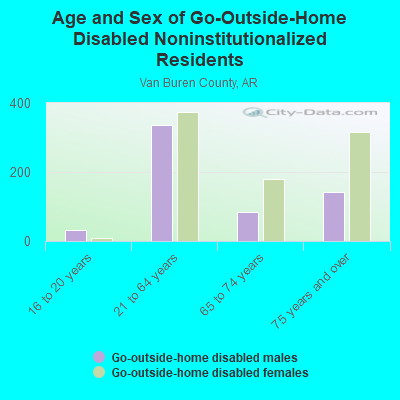
Institutionalized population: 180
Crime in 2021 (reported by the sheriff's office or county police, not the county total):
- Murders: 0
- Rapes: 1
- Robberies: 1
- Assaults: 40
- Burglaries: 35
- Thefts: 76
- Auto thefts: 33
Crime in 2020 (reported by the sheriff's office or county police, not the county total):
- Murders: 0
- Rapes: 1
- Robberies: 0
- Assaults: 42
- Burglaries: 36
- Thefts: 88
- Auto thefts: 27
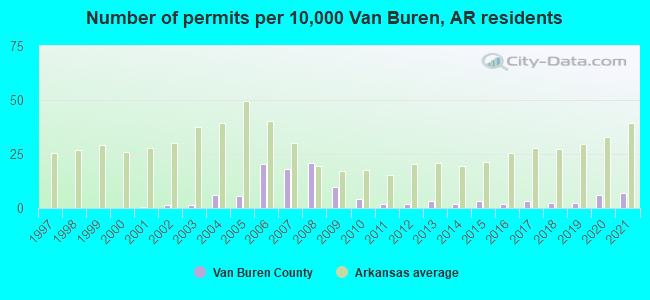
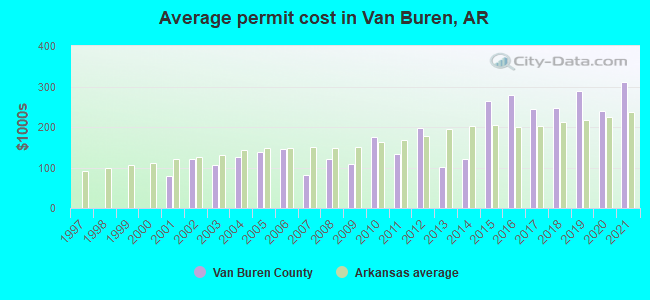
Single-family new house construction building permits:
- 2022: 15 buildings, average cost: $400,200
- 2021: 11 buildings, average cost: $311,900
- 2020: 10 buildings, average cost: $238,700
- 2019: 4 buildings, average cost: $288,500
- 2018: 4 buildings, average cost: $247,500
- 2017: 5 buildings, average cost: $245,000
- 2016: 3 buildings, average cost: $279,700
- 2015: 5 buildings, average cost: $264,000
- 2014: 3 buildings, average cost: $120,000
- 2013: 5 buildings, average cost: $102,000
- 2012: 3 buildings, average cost: $197,800
- 2011: 3 buildings, average cost: $133,000
- 2010: 7 buildings, average cost: $175,600
- 2009: 16 buildings, average cost: $107,500
- 2008: 34 buildings, average cost: $119,700
- 2007: 29 buildings, average cost: $81,200
- 2006: 33 buildings, average cost: $146,400
- 2005: 9 buildings, average cost: $138,800
- 2004: 10 buildings, average cost: $125,800
- 2003: 2 buildings, average cost: $105,000
- 2002: 2 buildings, average cost: $120,000
- 2001: 1 building, cost: $80,000
- 2000: 0 buildings
- 1999: 0 buildings
- 1998: 0 buildings
- 1997: 0 buildings
Median real estate property taxes paid for housing units with mortgages in 2022: $687 (0.5%)
Median real estate property taxes paid for housing units with no mortgage in 2022: $601 (0.5%)
| Van Buren County: | 19.6% |
| Arkansas: | 16.8% |
Median age of residents in 2022: 50.3 years old
(Males: 47.6 years old, Females: 51.7 years old)
(Median age for: White residents: 50.5 years old, Black residents: 58.8 years old, American Indian residents: 27.1 years old, Asian residents: 45.9 years old, Hispanic or Latino residents: 45.8 years old, Other race residents: 18.3 years old)
Fair market rent in 2006 for a 1-bedroom apartment in Van Buren County is $346 a month.
Fair market rent for a 2-bedroom apartment is $456 a month.
Fair market rent for a 3-bedroom apartment is $565 a month.
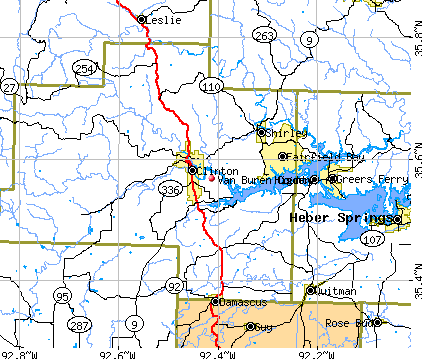
Cities in this county include: Fairfield Bay, Clinton, Dennard, Shirley, Damascus.
Neighboring counties: Cocke County, Tennessee  , Haywood County, Tennessee .
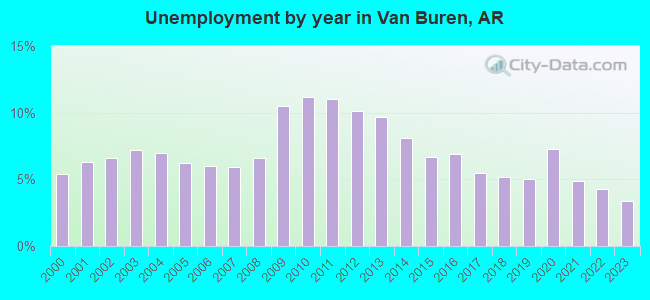
| Here: | 4.7% |
| Arkansas: | 3.4% |
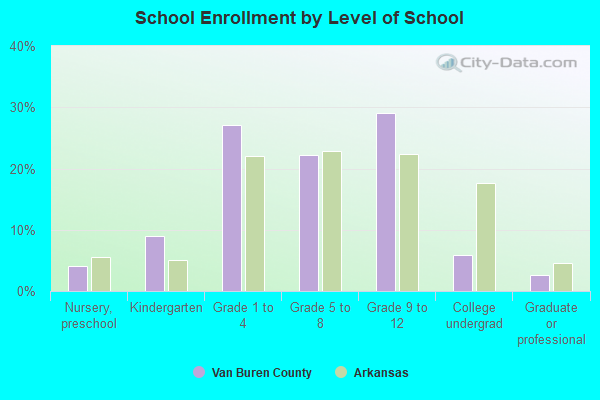
Current college students: 363
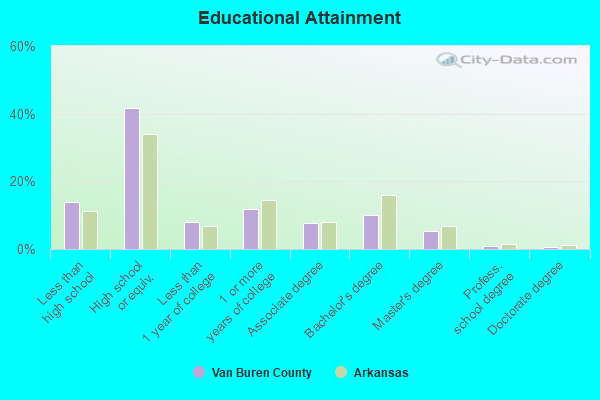
People 25 years of age or older with a high school degree or higher: 84.4%
People 25 years of age or older with a bachelor's degree or higher: 16.8%
Number of foreign born residents: 245 (23.1% naturalized citizens)
| Van Buren County: | 1.5% |
| Whole state: | 5.1% |
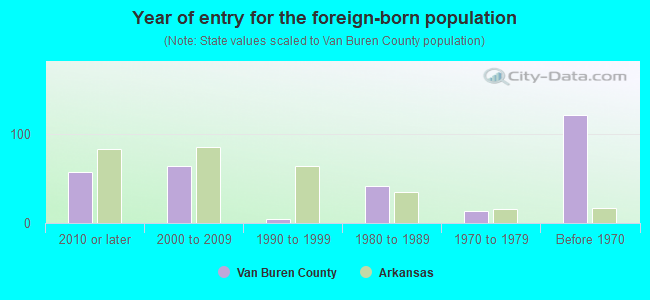
- Year of entry for the foreign-born population
- 1062010 or later
- 532000 to 2009
- 511990 to 1999
- 421980 to 1989
- 131970 to 1979
- 121Before 1970
Mean travel time to work (commute): minutes
Percentage of county residents living and working in this county: 97.5%
Housing units in structures:
- One, detached: 6,837
- One, attached: 101
- Two: 36
- 3 or 4: 247
- 5 to 9: 260
- 10 to 19: 177
- 20 to 49: 53
- 50 or more: 87
- Mobile homes: 2,022
- Boats, RVs, vans, etc.: 46
Housing units in Van Buren County with a mortgage: 2,237 (198 second mortgage, 1 home equity loan, 134 both second mortgage and home equity loan)
Houses without a mortgage: 25
| Here: | 7.4% with mortgage |
| State: | 98.4% with mortgage |
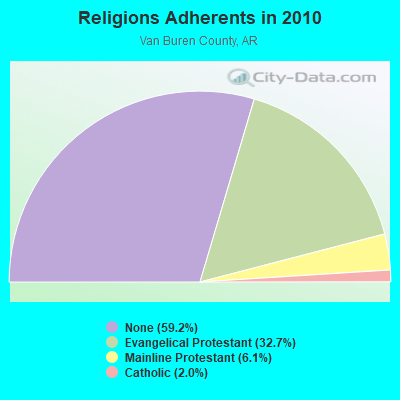
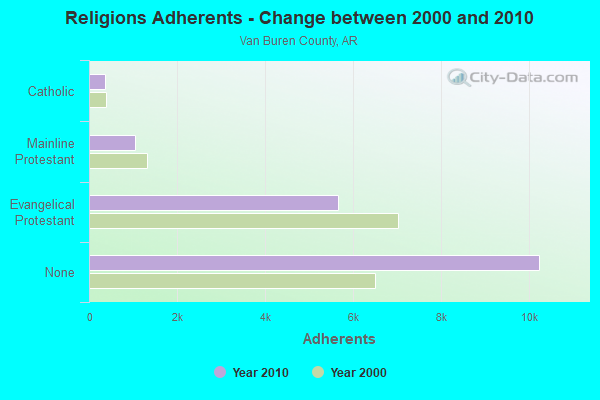
Religion statistics for Van Buren County
| Religion | Adherents | Congregations |
|---|---|---|
| Evangelical Protestant | 5,651 | 42 |
| Mainline Protestant | 1,051 | 4 |
| Catholic | 354 | 2 |
| Other | 1 | 1 |
| None | 10,238 | - |
Source: Clifford Grammich, Kirk Hadaway, Richard Houseal, Dale E.Jones, Alexei Krindatch, Richie Stanley and Richard H.Taylor. 2012. 2010 U.S.Religion Census: Religious Congregations & Membership Study. Association of Statisticians of American Religious Bodies. Jones, Dale E., et al. 2002. Congregations and Membership in the United States 2000. Nashville, TN: Glenmary Research Center.
Food Environment Statistics:
| Van Buren County: | 1.21 / 10,000 pop. |
| State: | 2.02 / 10,000 pop. |
| Here: | 0.61 / 10,000 pop. |
| Arkansas: | 0.25 / 10,000 pop. |
| Van Buren County: | 8.50 / 10,000 pop. |
| Arkansas: | 4.94 / 10,000 pop. |
| This county: | 6.07 / 10,000 pop. |
| State: | 6.66 / 10,000 pop. |
| Van Buren County: | 9.8% |
| Arkansas: | 9.8% |
| Van Buren County: | 27.8% |
| State: | 29.1% |
| Here: | 15.3% |
| State: | 13.6% |
Agriculture in Van Buren County:
Average size of farms: 218 acresAverage value of agricultural products sold per farm: $24,816
Average value of crops sold per acre for harvested cropland: $45.83
The value of livestock, poultry, and their products as a percentage of the total market value of agricultural products sold: 92.62%
Average total farm production expenses per farm: $22,304
Harvested cropland as a percentage of land in farms: 18.29%
Irrigated harvested cropland as a percentage of land in farms: 1.16%
Average market value of all machinery and equipment per farm: $43,679
The percentage of farms operated by a family or individual: 96.52%
Average age of principal farm operators: 56 years
Average number of cattle and calves per 100 acres of all land in farms: 15.97
Milk cows as a percentage of all cattle and calves: 6.93%
Land in orchards: 24 acres
Earthquake activity:
Van Buren County-area historical earthquake activity is significantly above Arkansas state average. It is 531% greater than the overall U.S. average.On 2/28/2011 at 05:00:50, a magnitude 4.7 (4.7 MW, Depth: 2.0 mi, Class: Light, Intensity: IV - V) earthquake occurred 20.8 miles away from Van Buren County center
On 5/4/2001 at 06:42:12, a magnitude 4.7 (4.2 MB, 4.7 LG, 4.5 LG) earthquake occurred 27.9 miles away from the county center
On 9/3/2016 at 12:02:44, a magnitude 5.8 (5.8 MW, Depth: 3.5 mi, Class: Moderate, Intensity: VI - VII) earthquake occurred 259.5 miles away from the county center
On 1/21/1982 at 00:33:54, a magnitude 4.7 (4.5 MB, 4.7 LG, 4.5 LG) earthquake occurred 29.7 miles away from the county center
On 11/6/2011 at 03:53:10, a magnitude 5.7 (5.7 MW, Depth: 3.2 mi) earthquake occurred 244.8 miles away from Van Buren County center
On 3/25/1976 at 00:41:20, a magnitude 5.0 (4.9 MB, 5.0 LG) earthquake occurred 117.5 miles away from the county center
Magnitude types: regional Lg-wave magnitude (LG), body-wave magnitude (MB), moment magnitude (MW)
Most recent natural disasters:
- Arkansas Covid-19 Pandemic, Incident Period: January 20, 2020, FEMA Id: 4518, Natural disaster type: Other
- Arkansas Severe Winter Storm, Incident Period: December 05, 2013 to December 07, 2013, Major Disaster (Presidential) Declared DR-4160: January 06, 2014, FEMA Id: 4160, Natural disaster type: Winter Storm
- Arkansas Severe Storms, Tornadoes, and Flooding, Incident Period: May 30, 2013 to June 03, 2013, Major Disaster (Presidential) Declared DR-4124: June 25, 2013, FEMA Id: 4124, Natural disaster type: Storm, Tornado, Flood
- Arkansas Severe Storms, Tornadoes, and Associated Flooding, Incident Period: April 14, 2011 to June 03, 2011, Major Disaster (Presidential) Declared DR-1975: May 02, 2011, FEMA Id: 1975, Natural disaster type: Storm, Tornado, Flood
- Arkansas Severe Storms, Tornadoes, and Flooding, Incident Period: October 29, 2009 to November 08, 2009, Major Disaster (Presidential) Declared DR-1861: December 03, 2009, FEMA Id: 1861, Natural disaster type: Storm, Tornado, Flood
- Arkansas Severe Winter Storm, Incident Period: January 26, 2009 to January 30, 2009, Major Disaster (Presidential) Declared DR-1819: February 06, 2009, FEMA Id: 1819, Natural disaster type: Winter Storm
- Arkansas Severe Winter Storm, Incident Period: January 26, 2009 to January 30, 2009, Emergency Declared EM-3301: January 28, 2009, FEMA Id: 3301, Natural disaster type: Winter Storm
- Arkansas Tropical Storm Ike, Incident Period: September 13, 2008 to September 23, 2008, Major Disaster (Presidential) Declared DR-1804: October 22, 2008, FEMA Id: 1804, Natural disaster type: Tropical Storm
- Arkansas Severe Storms and Flooding associated with Hurricane Gustav, Incident Period: September 02, 2008 to September 08, 2008, Major Disaster (Presidential) Declared DR-1793: September 18, 2008, FEMA Id: 1793, Natural disaster type: Storm, Hurricane, Flood
- Arkansas Severe Storms, Flooding, and Tornadoes, Incident Period: May 02, 2008 to May 12, 2008, Major Disaster (Presidential) Declared DR-1758: May 20, 2008, FEMA Id: 1758, Natural disaster type: Storm, Tornado, Flood
- 11 other natural disasters have been reported since 1953.
The number of natural disasters in Van Buren County (21) is greater than the US average (15).
Major Disasters (Presidential) Declared: 17
Emergencies Declared: 3
Causes of natural disasters: Storms: 12, Floods: 11, Tornadoes: 9, Winter Storms: 4, Hurricanes: 2, Drought: 1, Ice Storm: 1, Tropical Storm: 1, Other: 1 (Note: some incidents may be assigned to more than one category).
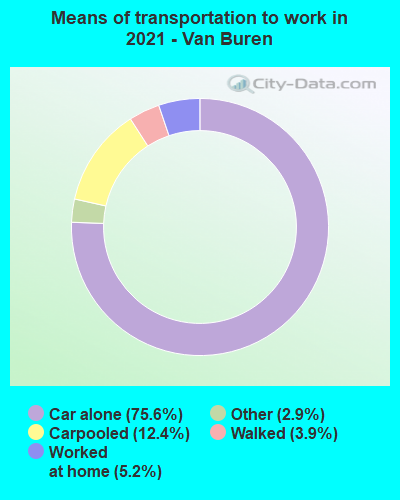
Means of transportation to work:
- Drove a car alone: 3,916 (77.0%)
- Carpooled: 546 (10.7%)
- Taxicab, motorcycle, or other means: 90 (1.8%)
- Walked: 95 (1.9%)
- Worked at home: 417 (8.2%)
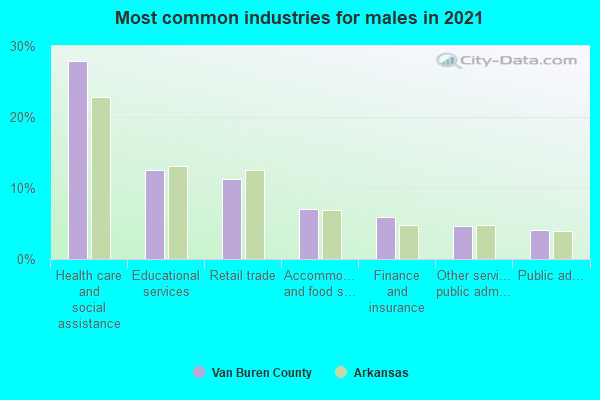
- Health care and social assistance (27%)
- Retail trade (14%)
- Educational services (12%)
- Accommodation and food services (8%)
- Finance and insurance (6%)
- Public administration (5%)
- Manufacturing (4%)
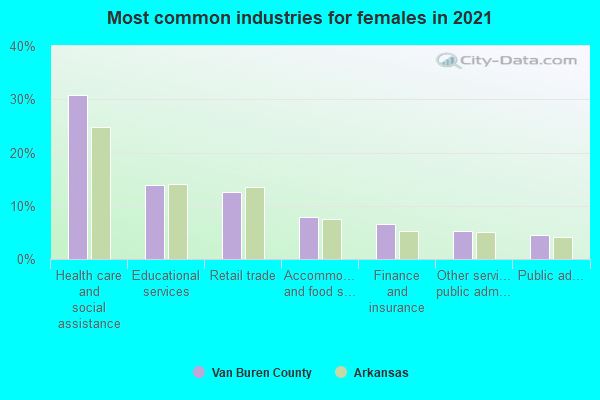
- Health care and social assistance (28%)
- Retail trade (15%)
- Educational services (12%)
- Accommodation and food services (9%)
- Finance and insurance (7%)
- Public administration (5%)
- Manufacturing (5%)
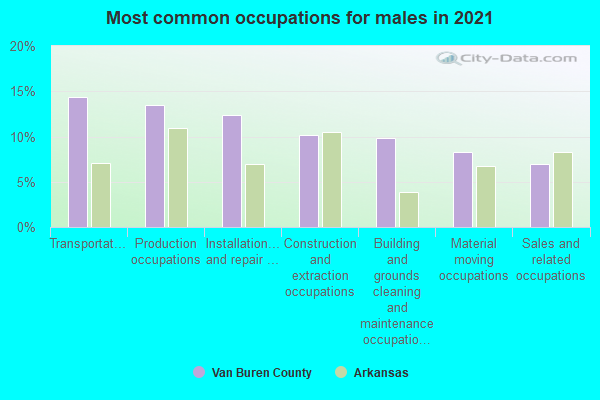
- Installation, maintenance, and repair occupations (15%)
- Transportation occupations (13%)
- Building and grounds cleaning and maintenance occupations (12%)
- Production occupations (11%)
- Construction and extraction occupations (8%)
- Material moving occupations (7%)
- Management occupations (6%)
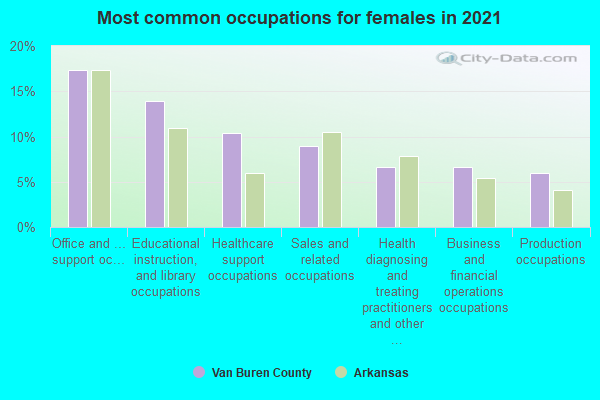
- Office and administrative support occupations (17%)
- Sales and related occupations (14%)
- Educational instruction, and library occupations (11%)
- Production occupations (8%)
- Healthcare support occupations (8%)
- Business and financial operations occupations (7%)
- Food preparation and serving related occupations (6%)
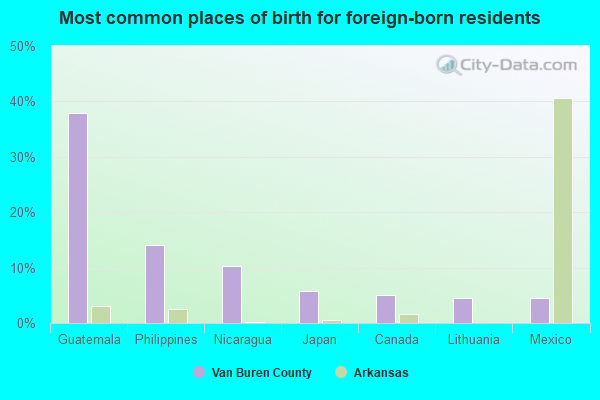
- Guatemala (17%)
- Mexico (14%)
- Philippines (13%)
- Spain (12%)
- Peru (8%)
- Germany (6%)
- Denmark (5%)
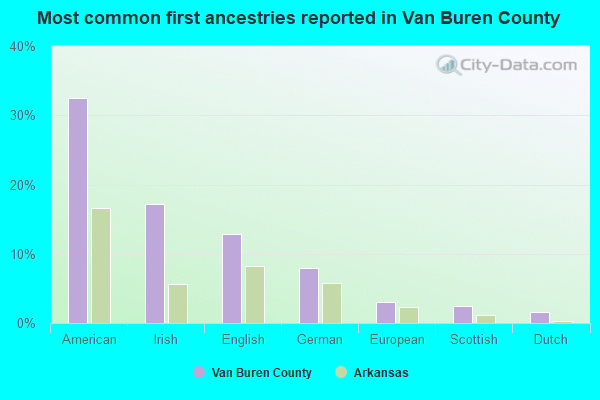
- American (31%)
- Irish (18%)
- English (13%)
- German (7%)
- European (3%)
- Scottish (3%)
- Italian (2%)
People in group quarters in Van Buren County, Arkansas in 2010:
- 130 people in nursing facilities/skilled-nursing facilities
- 50 people in local jails and other municipal confinement facilities
- 9 people in group homes intended for adults
People in group quarters in Van Buren County, Arkansas in 2000:
- 232 people in nursing homes
- 30 people in local jails and other confinement facilities (including police lockups)
- 10 people in homes or halfway houses for drug/alcohol abuse
- 4 people in other noninstitutional group quarters
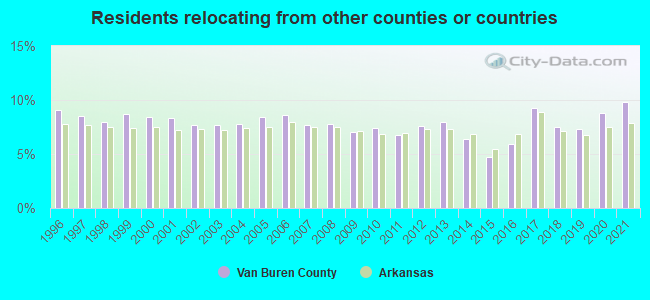
9.79% of this county's 2021 resident taxpayers lived in other counties in 2020 ($52,994 average adjusted gross income)
| Here: | 9.79% |
| Arkansas average: | 7.82% |
10 or fewer of this county's residents moved from foreign countries.
5.47% relocated from other counties in Arkansas ($28,755 average AGI)
4.32% relocated from other states ($24,239 average AGI)
Van Buren County: 4.32% Arkansas average: 3.41%
Top counties from which taxpayers relocated into this county between 2020 and 2021:
| from Faulkner County, AR | |
| from Cleburne County, AR | |
| from Pulaski County, AR |
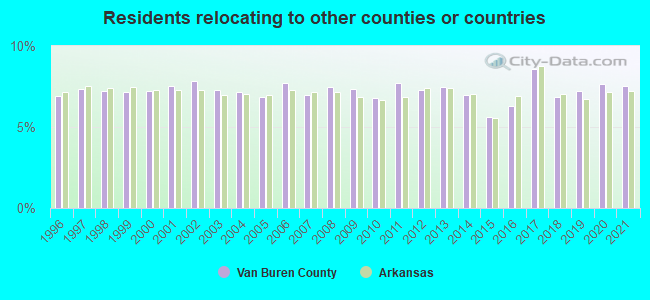
7.50% of this county's 2020 resident taxpayers moved to other counties in 2021 ($38,462 average adjusted gross income)
| Here: | 7.50% |
| Arkansas average: | 7.23% |
10 or fewer of this county's residents moved to foreign countries.
5.23% relocated to other counties in Arkansas ($26,780 average AGI)
2.27% relocated to other states ($11,682 average AGI)
Van Buren County: 2.27% Arkansas average: 2.79%
Top counties to which taxpayers relocated from this county between 2020 and 2021:
| to Faulkner County, AR | |
| to Cleburne County, AR | |
| to Pulaski County, AR |
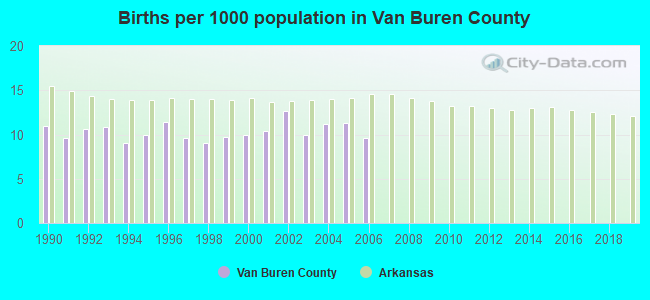
Births per 1000 population from 1990 to 1999: 10.1
Births per 1000 population from 2000 to 2006: 10.7
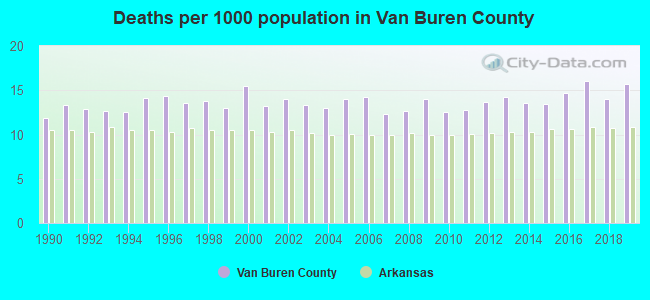
Deaths per 1000 population from 1990 to 1999: 13.2
Deaths per 1000 population from 2000 to 2009: 13.6
Deaths per 1000 population from 2010 to 2020: 14.1
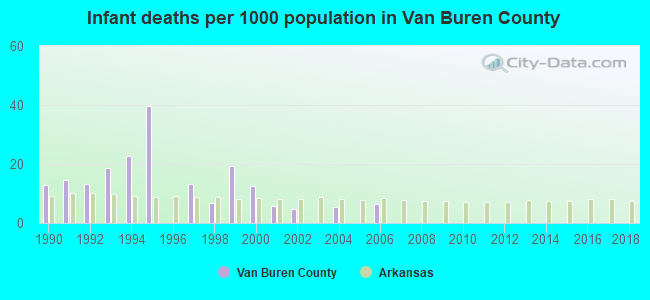
Infant deaths per 1000 live births from 1990 to 1999: 16.1
Infant deaths per 1000 live births from 2000 to 2006: 5.0
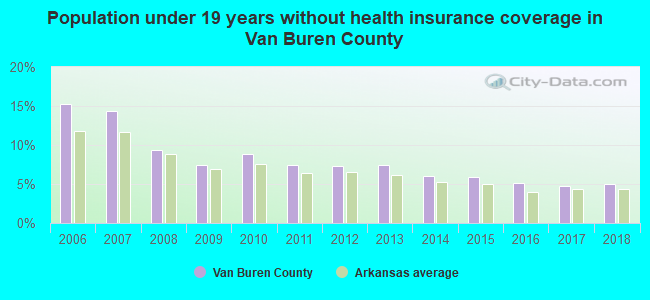
Persons under 19 years old without health insurance coverage in 2018: 5.0%
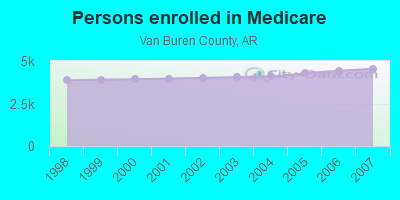
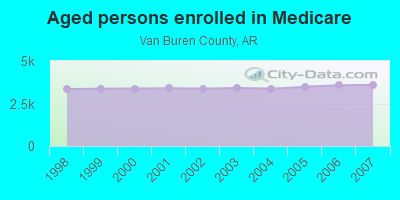
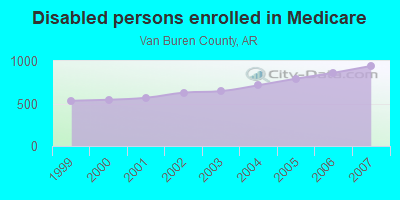
Persons enrolled in hospital insurance and/or supplemental medical insurance (Medicare) in July 1, 2007: 4,537 (3,595 aged, 942 disabled)
Children under 18 without health insurance coverage in 2007: 469 (14%)
Most common underlying causes of death in Van Buren County, Arkansas in 1999 - 2019:
- Acute myocardial infarction, unspecified (414)
- Bronchus or lung, unspecified - Malignant neoplasms (356)
- Chronic obstructive pulmonary disease, unspecified (262)
- Congestive heart failure (195)
- Atherosclerotic heart disease (131)
- Stroke, not specified as haemorrhage or infarction (118)
- Alzheimer disease, unspecified (75)
- Heart disease, unspecified (26)
- Pneumonia, unspecified (23)
- Essential (primary) hypertension (11)
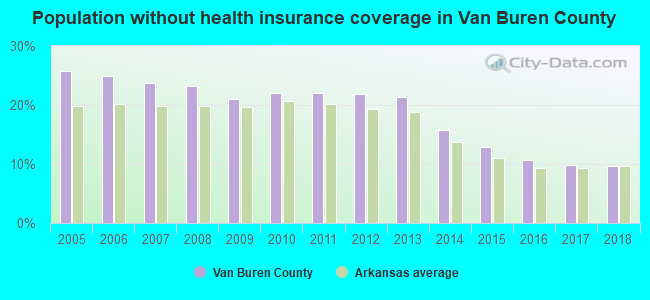
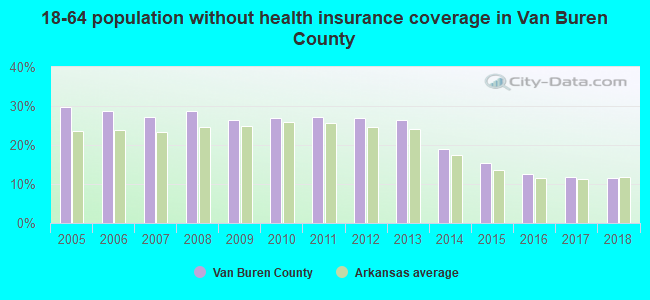
Population without health insurance coverage in 2000: 18%
Children under 18 without health insurance coverage in 2000: 15%
Suicides per 1,000,000 population from 2000 to 2006: 193.6. This is less than state average.
Household type by relationship:
Households: 16,042- Male householders: 3,193 (968 living alone), Female householders: 3,902 (1,359 living alone)
3,355 spouses (3,350 opposite-sex spouses), 391 unmarried partners, (377 opposite-sex unmarried partners), 3,929 children (3,597 natural, 116 adopted, 213 stepchildren), 326 grandchildren, 81 brothers or sisters, 162 parents, 0 foster children, 238 other relatives, 329 non-relatives
- In group quarters: 190
Size of family households: 2,669 2-persons, 818 3-persons, 687 4-persons, 175 5-persons, 113 6-persons, 62 7-or-more-persons.
Size of nonfamily households: 2,330 1-person, 239 2-persons, 12 3-persons, 18 4-persons.
1,833 married couples with children.
866 single-parent households (236 men, 630 women).
96.2% of residents of Van Buren speak English at home.
2.9% of residents speak Spanish at home (73% speak English very well, 10% speak English well, 10% speak English not well, 6% don't speak English at all).
0.2% of residents speak other Indo-European language at home (66% speak English very well, 34% speak English not well).
0.9% of residents speak Asian or Pacific Island language at home (88% speak English very well, 12% speak English well).
In fiscal year 2004:
Federal Government expenditure: $116,887,000 ($7,050 per capita)
Department of Defense expenditure: $7,099,000
Federal direct payments to individuals for retirement and disability: $63,249,000
Federal other direct payments to individuals: $25,169,000
Federal direct payments not to individuals: $350,000
Federal grants: $22,177,000
Federal procurement contracts: $2,911,000 ($2,331,000 Department of Defense)
Federal salaries and wages: $3,032,000 ($40,000 Department of Defense)
Federal Government direct loans: $467,000
Federal guaranteed/insured loans: $2,051,000
Federal Government insurance: $4,745,000
Population change from April 1, 2000 to July 1, 2005:
Births: 891| Here: | 54 per 1000 residents |
| State: | 72 per 1000 residents |
Deaths: 1,163
| Here: | 70 per 1000 residents |
| State: | 53 per 1000 residents |
Net international migration: +11
| Here: | +1 per 1000 residents |
| State: | +8 per 1000 residents |
Net internal migration: +635
| Here: | +38 per 1000 residents |
| State: | +13 per 1000 residents |
Total withdrawal of fresh water for public supply: 2.00 millions of gallons per day (all from surface)
| Here: | 5.6 |
| State: | 6.1 |
| Here: | 4.7 |
| State: | 4.3 |
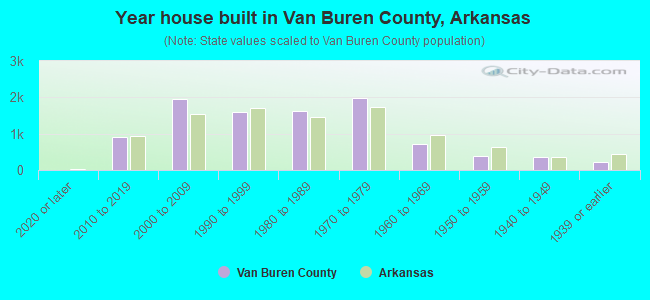
- Year house built in Van Buren County, Arkansas
- 312020 or later
- 1,0082010 to 2019
- 1,7812000 to 2009
- 1,5201990 to 1999
- 1,6301980 to 1989
- 2,0031970 to 1979
- 7631960 to 1969
- 3851950 to 1959
- 3521940 to 1949
- 2341939 or earlier
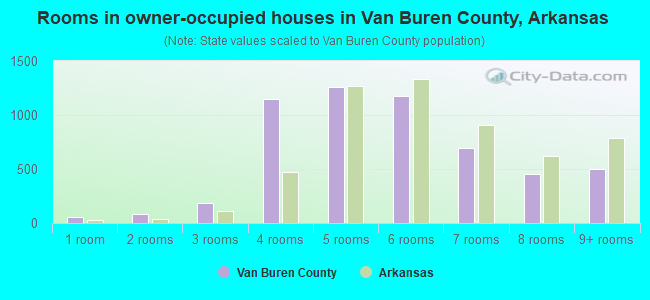
- Rooms in owner-occupied houses in Van Buren County, Arkansas
- 381 room
- 832 rooms
- 2703 rooms
- 1,1754 rooms
- 1,2265 rooms
- 1,1606 rooms
- 7897 rooms
- 4898 rooms
- 4559+ rooms
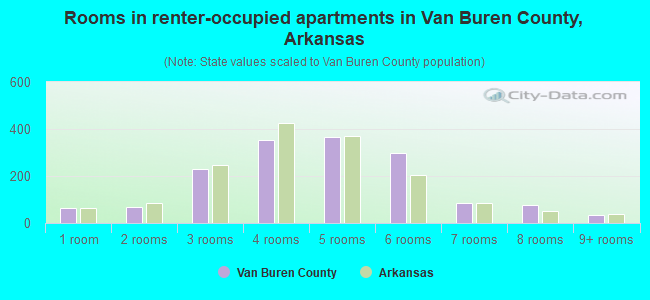
- Rooms in renter-occupied apartments in Van Buren County, Arkansas
- 581 room
- 382 rooms
- 2543 rooms
- 2734 rooms
- 4575 rooms
- 2136 rooms
- 737 rooms
- 588 rooms
- 339+ rooms
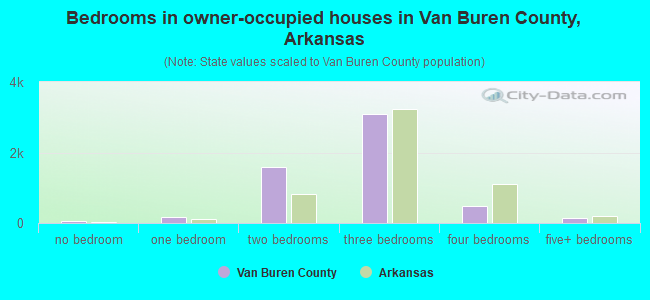
- Bedrooms in owner-occupied houses in Van Buren County, Arkansas
- 46no bedroom
- 1881 bedroom
- 1,6212 bedrooms
- 3,0563 bedrooms
- 5654 bedrooms
- 1215+ bedrooms
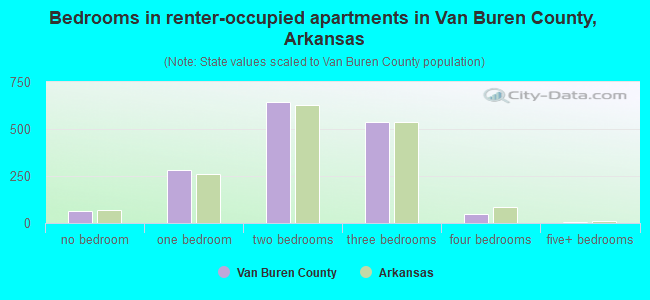
- Bedrooms in renter-occupied apartments in Van Buren County, Arkansas
- 59no bedroom
- 2671 bedroom
- 5082 bedrooms
- 5763 bedrooms
- 454 bedrooms
- 65+ bedrooms
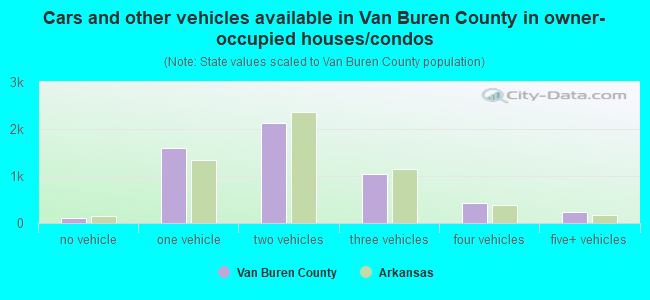
- Cars and other vehicles available in Van Buren County in owner-occupied houses/condos
- 184no vehicle
- 1,6031 vehicle
- 2,1822 vehicles
- 9943 vehicles
- 4564 vehicles
- 2165+ vehicles
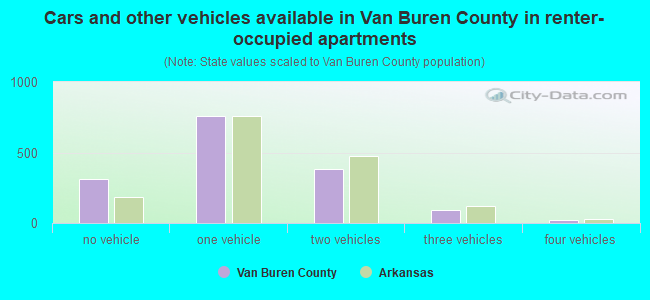
- Cars and other vehicles available in Van Buren County in renter-occupied apartments
- 300no vehicle
- 7421 vehicle
- 3572 vehicles
- 403 vehicles
- 494 vehicles
- 05+ vehicles
90.1% of Van Buren County residents lived in the same house 1 years ago.
Out of people who lived in different houses, 26% lived in this county.
Out of people who lived in different counties, 61% lived in Arkansas.
| Van Buren County: | 90.1% |
| State average: | 87.0% |
Place of birth for U.S.-born residents:
- This state: 9,306
- Other state: 6,481
- Northeast: 518
- Midwest: 2,867
- South: 1,885
- West: 1,188
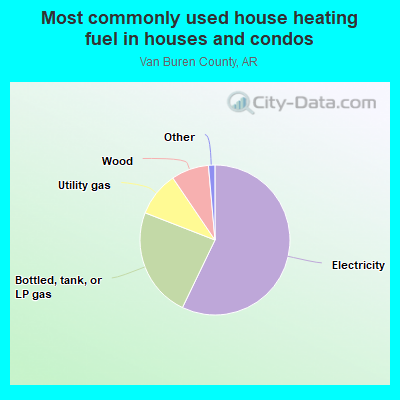
- 57.7%Electricity
- 24.8%Bottled, tank, or LP gas
- 9.7%Utility gas
- 6.4%Wood
- 0.8%No fuel used
- 0.4%Fuel oil, kerosene, etc.
- 0.3%Other fuel
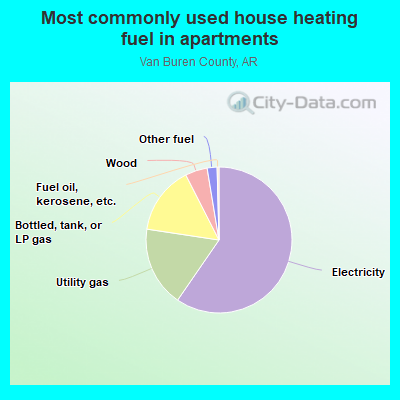
- 51.3%Electricity
- 20.0%Utility gas
- 16.9%Bottled, tank, or LP gas
- 8.5%Wood
- 2.7%Other fuel
- 0.6%Fuel oil, kerosene, etc.
Private vs. public school enrollment:
| Here: | 21.2% |
| Arkansas: | 10.5% |
| Here: | 7.1% |
| Arkansas: | 8.7% |
| Here: | 0.4% |
| Arkansas: | 19.4% |
Van Buren County government finances - Expenditure in 2018:
- Charges - Other: $604,000
Solid Waste Management: $562,000
- Construction - Health - Other: $7,000
- Current Operations - Regular Highways: $3,530,000
Police Protection: $2,928,000
Financial Administration: $1,003,000
Central Staff Services: $654,000
Solid Waste Management: $638,000
Libraries: $623,000
Judicial and Legal Services: $611,000
Health - Other: $256,000
Public Welfare - Other: $234,000
General - Other: $230,000
Local Fire Protection: $155,000
General Public Buildings: $136,000
Correctional Institutions: $60,000
Hospitals: $47,000
- Federal Intergovernmental - Other: $177,000
General Local Government Support: $124,000
Health and Hospitals: $120,000
Highways: $35,000
- General - Interest on Debt: $511,000
- Intergovernmental to Local - Other - General - Other: $537,000
- Long Term Debt - Beginning Outstanding - Unspecified Public Purpose: $8,218,000
Retired Unspecified Public Purpose: $8,218,000
- Miscellaneous - General Revenue - Other: $661,000
Sale of Property: $506,000
Fines and Forfeits: $430,000
Interest Earnings: $32,000
- Other Capital Outlay - Regular Highways: $256,000
General - Other: $23,000
Solid Waste Management: $12,000
- Other Funds - Cash and Securities: $4,974,000
- Sinking Funds - Cash and Securities: $1,428,000
- State Intergovernmental - Highways: $1,723,000
General Local Government Support: $741,000
Other: $113,000
Health and Hospitals: $10,000
- Tax - Property: $4,233,000
General Sales and Gross Receipts: $3,645,000
Public Utilities Sales: $163,000
Van Buren County government finances - Revenue in 2018:
- Charges - Other: $604,000
Solid Waste Management: $562,000
- Construction - Health - Other: $7,000
- Current Operations - Regular Highways: $3,530,000
Police Protection: $2,928,000
Financial Administration: $1,003,000
Central Staff Services: $654,000
Solid Waste Management: $638,000
Libraries: $623,000
Judicial and Legal Services: $611,000
Health - Other: $256,000
Public Welfare - Other: $234,000
General - Other: $230,000
Local Fire Protection: $155,000
General Public Buildings: $136,000
Correctional Institutions: $60,000
Hospitals: $47,000
- Federal Intergovernmental - Other: $177,000
General Local Government Support: $124,000
Health and Hospitals: $120,000
Highways: $35,000
- General - Interest on Debt: $511,000
- Intergovernmental to Local - Other - General - Other: $537,000
- Long Term Debt - Beginning Outstanding - Unspecified Public Purpose: $8,218,000
Retired Unspecified Public Purpose: $8,218,000
- Miscellaneous - General Revenue - Other: $661,000
Sale of Property: $506,000
Fines and Forfeits: $430,000
Interest Earnings: $32,000
- Other Capital Outlay - Regular Highways: $256,000
General - Other: $23,000
Solid Waste Management: $12,000
- Other Funds - Cash and Securities: $4,974,000
- Sinking Funds - Cash and Securities: $1,428,000
- State Intergovernmental - Highways: $1,723,000
General Local Government Support: $741,000
Other: $113,000
Health and Hospitals: $10,000
- Tax - Property: $4,233,000
General Sales and Gross Receipts: $3,645,000
Public Utilities Sales: $163,000
Van Buren County government finances - Debt in 2018:
- Charges - Other: $604,000
Solid Waste Management: $562,000
- Construction - Health - Other: $7,000
- Current Operations - Regular Highways: $3,530,000
Police Protection: $2,928,000
Financial Administration: $1,003,000
Central Staff Services: $654,000
Solid Waste Management: $638,000
Libraries: $623,000
Judicial and Legal Services: $611,000
Health - Other: $256,000
Public Welfare - Other: $234,000
General - Other: $230,000
Local Fire Protection: $155,000
General Public Buildings: $136,000
Correctional Institutions: $60,000
Hospitals: $47,000
- Federal Intergovernmental - Other: $177,000
General Local Government Support: $124,000
Health and Hospitals: $120,000
Highways: $35,000
- General - Interest on Debt: $511,000
- Intergovernmental to Local - Other - General - Other: $537,000
- Long Term Debt - Beginning Outstanding - Unspecified Public Purpose: $8,218,000
Retired Unspecified Public Purpose: $8,218,000
- Miscellaneous - General Revenue - Other: $661,000
Sale of Property: $506,000
Fines and Forfeits: $430,000
Interest Earnings: $32,000
- Other Capital Outlay - Regular Highways: $256,000
General - Other: $23,000
Solid Waste Management: $12,000
- Other Funds - Cash and Securities: $4,974,000
- Sinking Funds - Cash and Securities: $1,428,000
- State Intergovernmental - Highways: $1,723,000
General Local Government Support: $741,000
Other: $113,000
Health and Hospitals: $10,000
- Tax - Property: $4,233,000
General Sales and Gross Receipts: $3,645,000
Public Utilities Sales: $163,000
Van Buren County government finances - Cash and Securities in 2018:
- Charges - Other: $604,000
Solid Waste Management: $562,000
- Construction - Health - Other: $7,000
- Current Operations - Regular Highways: $3,530,000
Police Protection: $2,928,000
Financial Administration: $1,003,000
Central Staff Services: $654,000
Solid Waste Management: $638,000
Libraries: $623,000
Judicial and Legal Services: $611,000
Health - Other: $256,000
Public Welfare - Other: $234,000
General - Other: $230,000
Local Fire Protection: $155,000
General Public Buildings: $136,000
Correctional Institutions: $60,000
Hospitals: $47,000
- Federal Intergovernmental - Other: $177,000
General Local Government Support: $124,000
Health and Hospitals: $120,000
Highways: $35,000
- General - Interest on Debt: $511,000
- Intergovernmental to Local - Other - General - Other: $537,000
- Long Term Debt - Beginning Outstanding - Unspecified Public Purpose: $8,218,000
Retired Unspecified Public Purpose: $8,218,000
- Miscellaneous - General Revenue - Other: $661,000
Sale of Property: $506,000
Fines and Forfeits: $430,000
Interest Earnings: $32,000
- Other Capital Outlay - Regular Highways: $256,000
General - Other: $23,000
Solid Waste Management: $12,000
- Other Funds - Cash and Securities: $4,974,000
- Sinking Funds - Cash and Securities: $1,428,000
- State Intergovernmental - Highways: $1,723,000
General Local Government Support: $741,000
Other: $113,000
Health and Hospitals: $10,000
- Tax - Property: $4,233,000
General Sales and Gross Receipts: $3,645,000
Public Utilities Sales: $163,000
Supplemental Security Income (SSI) in 2006:
- Total number of recipients: 586
- Number of aged recipients: 83
- Number of blind and disabled recipients: 503
- Number of recipients under 18: 78
- Number of recipients between 18 and 64: 350
- Number of recipients older than 64: 158
- Number of recipients also receiving OASDI: 290
- Amount of payments (thousands of dollars): 248
| Most common first names in Van Buren County, AR among deceased individuals | ||
| Name | Count | Lived (average) |
|---|---|---|
| James | 146 | 73.1 years |
| William | 145 | 75.8 years |
| John | 122 | 73.4 years |
| Robert | 92 | 73.7 years |
| Mary | 90 | 81.1 years |
| George | 64 | 74.9 years |
| Charles | 60 | 75.6 years |
| Thomas | 41 | 76.7 years |
| Roy | 36 | 72.4 years |
| Helen | 36 | 75.9 years |
| Most common last names in Van Buren County, AR among deceased individuals | ||
| Last name | Count | Lived (average) |
|---|---|---|
| Smith | 73 | 76.2 years |
| Johnson | 61 | 72.6 years |
| Williams | 59 | 76.8 years |
| Bradford | 53 | 81.8 years |
| Brown | 47 | 81.1 years |
| Jones | 35 | 75.8 years |
| Hall | 31 | 79.2 years |
| Ward | 30 | 78.1 years |
| Bonds | 26 | 78.2 years |
| Martin | 25 | 74.9 years |
| Businesses in Van Buren County, AR | ||||
| Name | Count | Name | Count | |
|---|---|---|---|---|
| AT&T | 1 | MasterBrand Cabinets | 1 | |
| Baskin-Robbins | 1 | McDonald's | 1 | |
| Best Western | 1 | Pizza Hut | 1 | |
| Chevrolet | 1 | RadioShack | 1 | |
| FedEx | 2 | SONIC Drive-In | 1 | |
| H&R Block | 1 | Subway | 1 | |
| Jones New York | 1 | Super 8 | 1 | |
| KFC | 1 | U-Haul | 1 | |
| La-Z-Boy | 1 | Vans | 1 | |
| Long John Silver's | 1 | Walmart | 1 | |
Van Buren County on our top lists:
- #63 on the list of "Top 101 counties with highest percentage of residents voting for 3rd party candidates in the 2012 Presidential Election"