Weld County, Colorado (CO)
County owner-occupied free and clear houses and condos in 2010: 12,266
County owner-occupied houses and condos in 2000: 43,428
Renter-occupied apartments: 27,219 (it was 19,819 in 2000)
| % of renters here: | 31% |
| State: | 34% |
Land area: 3992 sq. mi.
Water area: 29.1 sq. mi.
Population density: 88 people per square mile (average).
Industries providing employment: Educational, health and social services (21.4%), Retail trade (11.8%), Professional, scientific, management, administrative, and waste management services (11.2%), Manufacturing (10.9%), Construction (10.5%).
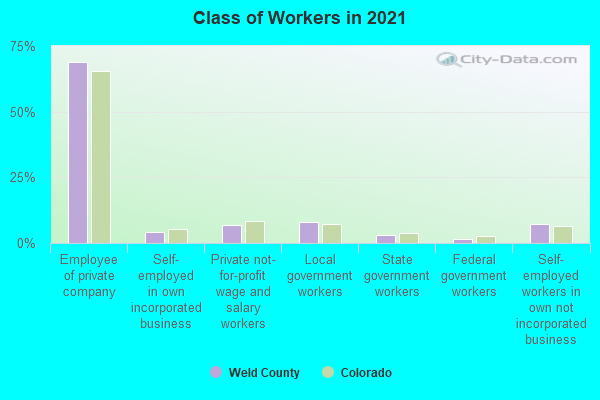
Type of workers:
- Private wage or salary: 81%
- Government: 13%
- Self-employed, not incorporated: 6%
- Unpaid family work: 0%
- OSM Map
- General Map
- Google Map
- MSN Map

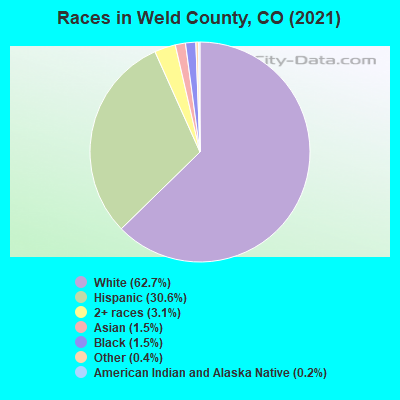
- 218,11162.3%White Non-Hispanic Alone
- 108,51631.0%Hispanic or Latino
- 10,3052.9%Two or more races
- 5,0991.5%Asian alone
- 4,8101.4%Black Non-Hispanic Alone
- 2,0000.6%Some other race alone
- 1,1460.3%American Indian and Alaska Native alone
- 1890.05%Native Hawaiian and Other
Pacific Islander alone
| Median resident age: | 35.3 years |
| Colorado median age: | 37.7 years |
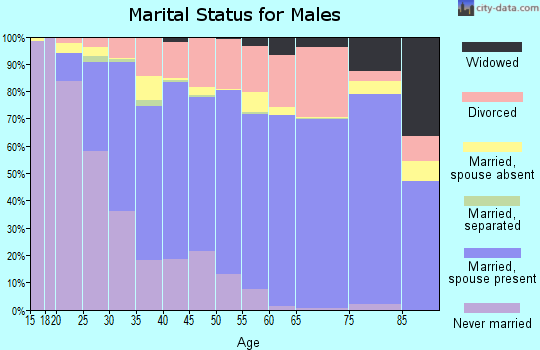
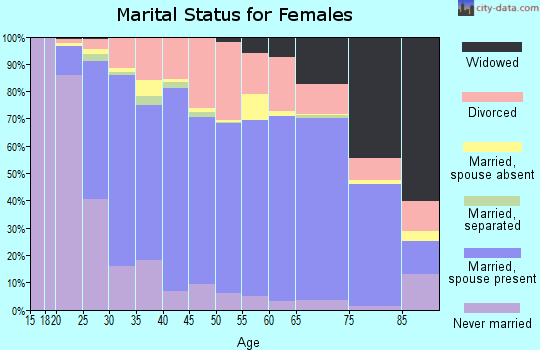
| Males: 178,434 | |
| Females: 171,742 |

 | Future Population Explosion In Loveland? (59 replies) |
| Data on Colorado's growth over the last 22 years (40 replies) |
| COVID-19 General Colorado Thread (845 replies) |
| A few 2023 CO population estimates (7 replies) |
| COVID-19 General Thread for Colorado Springs (326 replies) |
| Official 2020-2021 Colorado Winter and Snow Thread (96 replies) |
| Weld County: | 2.0 people |
| Colorado: | 2 people |
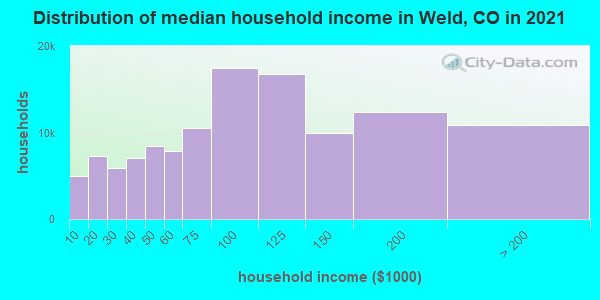
Estimated median household income in 2022: $91,565 ($42,321 in 1999)
| This county: | $91,565 |
| Colorado: | $89,302 |
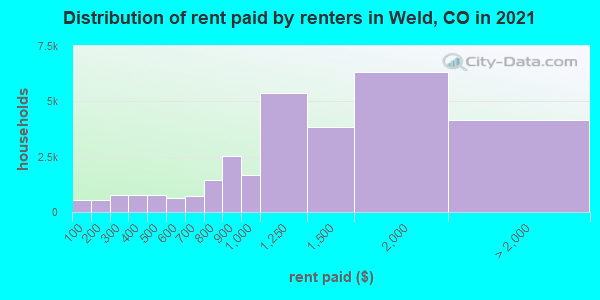
Median contract rent in 2022 for apartments: $1,207 (lower quartile is $900, upper quartile is $1,733)
| This county: | $1207 |
| State: | $1513 |
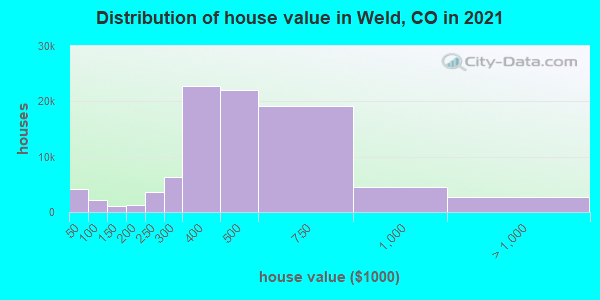
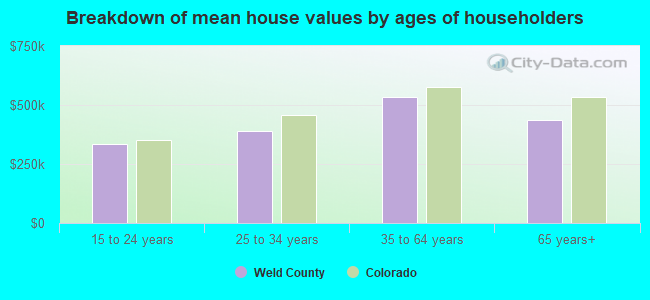
Estimated median house or condo value in 2022: $456,100 (it was $136,600 in 2000)
| Weld: | $456,100 |
| Colorado: | $531,100 |
Mean price in 2022:
Median monthly housing costs for homes and condos with a mortgage: $2,085Detached houses: $562,039
Here: $562,039 State: $676,667 Townhouses or other attached units: $397,639
Here: $397,639 State: $526,340 In 2-unit structures: $262,778
Here: $262,778 State: $431,509 In 3-to-4-unit structures: $323,015
Here: $323,015 State: $385,502 In 5-or-more-unit structures: $295,253
Here: $295,253 State: $417,586 Mobile homes: $112,392
Here: $112,392 State: $115,510 Occupied boats, RVs, vans, etc.: $200,478
Here: $200,478 State: $70,094
Median monthly housing costs for units without a mortgage: $568
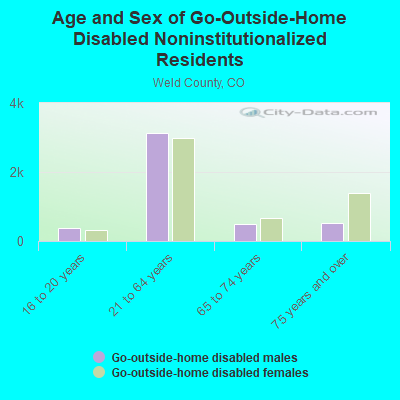
Institutionalized population: 2,617
Crime in 2021 (reported by the sheriff's office or county police, not the county total):
- Murders: 2
- Rapes: 23
- Robberies: 11
- Assaults: 125
- Burglaries: 155
- Thefts: 477
- Auto thefts: 165
Crime in 2020 (reported by the sheriff's office or county police, not the county total):
- Murders: 2
- Rapes: 39
- Robberies: 0
- Assaults: 163
- Burglaries: 143
- Thefts: 486
- Auto thefts: 180
Health of residents in Weld County based on CDC Behavioral Risk Factor Surveillance System Survey Questionnaires from 2003 to 2012:
General health status score of residents in this county from 1 (poor) to 5 (excellent) is 3.5. This is about average.77.3% of residents exercised in the past month. This is about average.
44.4% of residents smoked 100+ cigarettes in their lives. This is about average.
70.7% of adult residents drank alcohol in the past 30 days. This is about average.
63.5% of residents visited a dentist within the past year. This is less than average.
Average weight of males is 195 pounds. This is about average.
Average weight of females is 158 pounds. This is about average.
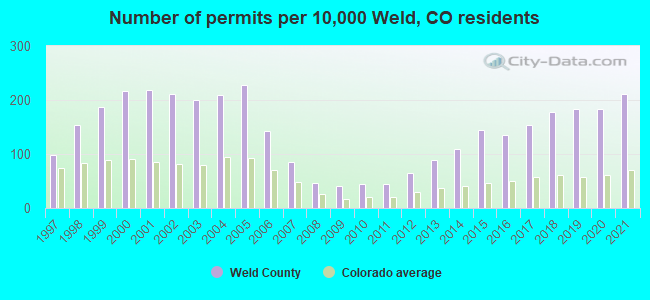
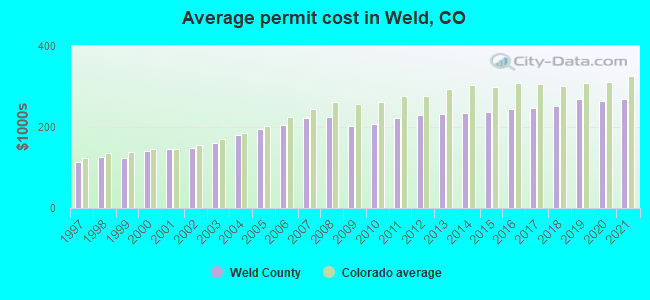
Single-family new house construction building permits:
- 2022: 3203 buildings, average cost: $296,800
- 2021: 3814 buildings, average cost: $268,100
- 2020: 3334 buildings, average cost: $263,200
- 2019: 3335 buildings, average cost: $269,300
- 2018: 3194 buildings, average cost: $253,300
- 2017: 2777 buildings, average cost: $248,200
- 2016: 2463 buildings, average cost: $245,300
- 2015: 2624 buildings, average cost: $236,200
- 2014: 1995 buildings, average cost: $235,100
- 2013: 1616 buildings, average cost: $232,500
- 2012: 1182 buildings, average cost: $229,800
- 2011: 792 buildings, average cost: $221,600
- 2010: 789 buildings, average cost: $207,300
- 2009: 718 buildings, average cost: $202,200
- 2008: 852 buildings, average cost: $224,900
- 2007: 1556 buildings, average cost: $222,500
- 2006: 2579 buildings, average cost: $205,500
- 2005: 4100 buildings, average cost: $194,700
- 2004: 3806 buildings, average cost: $181,200
- 2003: 3624 buildings, average cost: $159,700
- 2002: 3821 buildings, average cost: $147,400
- 2001: 3944 buildings, average cost: $145,100
- 2000: 3934 buildings, average cost: $140,300
- 1999: 3381 buildings, average cost: $122,800
- 1998: 2773 buildings, average cost: $125,400
- 1997: 1773 buildings, average cost: $113,000
Median real estate property taxes paid for housing units with mortgages in 2022: $2,323 (0.5%)
Median real estate property taxes paid for housing units with no mortgage in 2022: $1,911 (0.4%)
| Weld County: | 8.9% |
| Colorado: | 9.4% |
Median age of residents in 2022: 35.3 years old
(Males: 35.0 years old, Females: 35.6 years old)
(Median age for: White residents: 39.3 years old, Black residents: 29.6 years old, American Indian residents: 33.9 years old, Asian residents: 35.9 years old, Hispanic or Latino residents: 29.1 years old, Other race residents: 25.6 years old)
Area name: Greeley, CO MSA
Fair market rent in 2006 for a 1-bedroom apartment in Weld County is $547 a month.
Fair market rent for a 2-bedroom apartment is $670 a month.
Fair market rent for a 3-bedroom apartment is $978 a month.
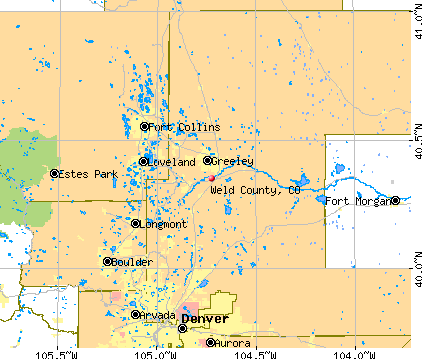
Cities in this county include: Greeley, Windsor, Evans, Fort Lupton, Kersey-Gill, Johnstown, Dacono, Milliken, Eaton, Frederick.
2023 air pollution in Weld County:
Carbon Monoxide: 0.216 ppm (standard limit: 9 ppm). Near U.S. average.
Ozone (1-hour): 0.034 ppm (standard limit: 0.12 ppm). Near U.S. average.
Particulate Matter (PM2.5) Annual: 8.0 µg/m3(standard limit: 15.0 µg/m3). Near U.S. average.
Neighboring counties: Lander County, Nevada  , Lewis County, West Virginia
  , Northampton County, Pennsylvania , Potter County, Pennsylvania , Rawlins County, Kansas , Scotts Bluff County, Nebraska
  .
.
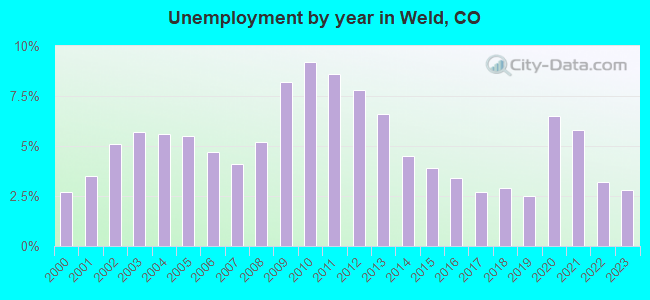
| Here: | 3.3% |
| Colorado: | 3.2% |
Current college students: 15,531
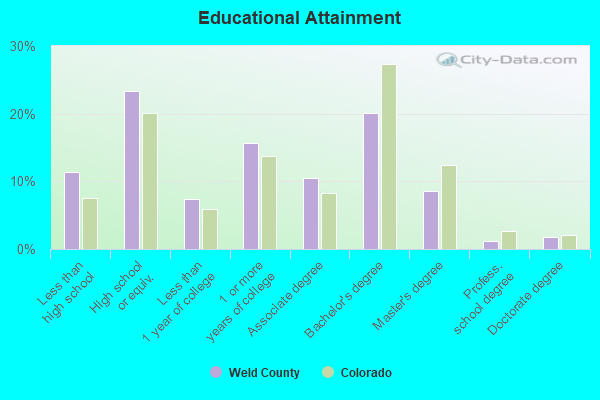
People 25 years of age or older with a high school degree or higher: 89.2%
People 25 years of age or older with a bachelor's degree or higher: 34.6%
Number of foreign born residents: 33,377 (39.8% naturalized citizens)
| Weld County: | 9.5% |
| Whole state: | 9.5% |
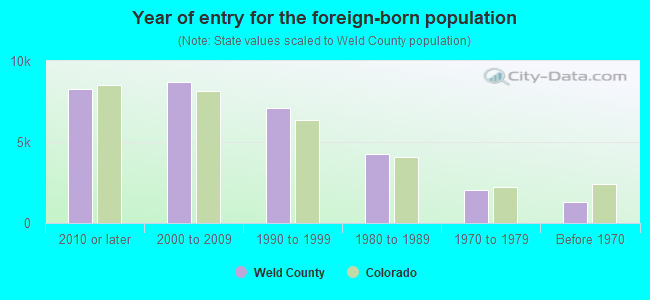
- Year of entry for the foreign-born population
- 9,1782010 or later
- 7,9172000 to 2009
- 7,1451990 to 1999
- 4,2811980 to 1989
- 2,0351970 to 1979
- 1,318Before 1970
Mean travel time to work (commute): minutes
Percentage of county residents living and working in this county: 99.1%
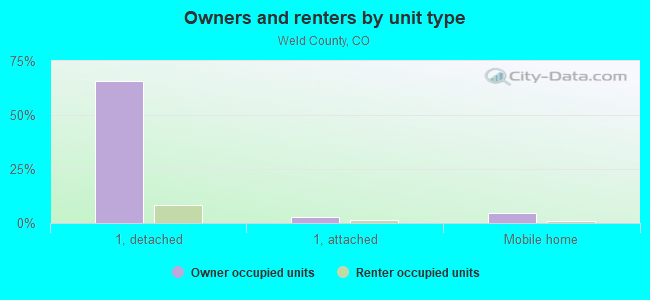
Housing units in structures:
- One, detached: 93,888
- One, attached: 5,157
- Two: 2,512
- 3 or 4: 4,358
- 5 to 9: 4,166
- 10 to 19: 3,978
- 20 to 49: 3,772
- 50 or more: 2,482
- Mobile homes: 8,599
- Boats, RVs, vans, etc.: 66
Housing units in Weld County with a mortgage: 68,899 (8,106 second mortgage, 865 home equity loan, 5,759 both second mortgage and home equity loan)
Houses without a mortgage: 1,538
| Here: | 98.6% with mortgage |
| State: | 98.2% with mortgage |
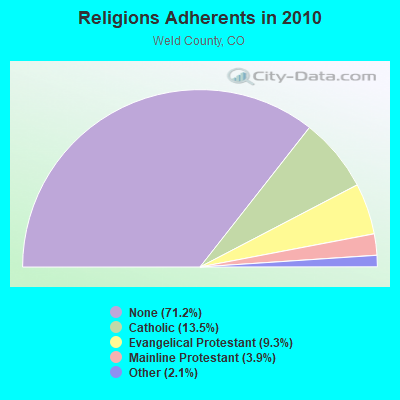
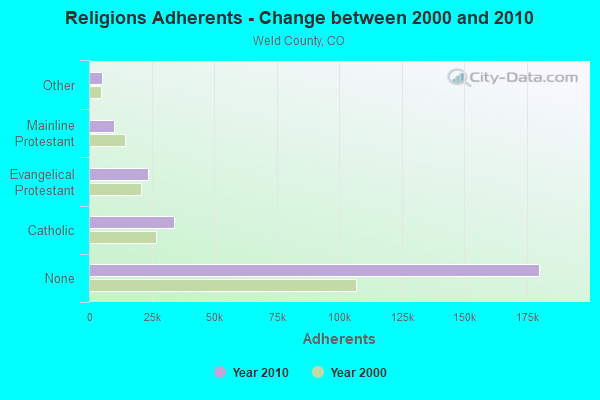
Religion statistics for Weld County
| Religion | Adherents | Congregations |
|---|---|---|
| Catholic | 34,138 | 14 |
| Evangelical Protestant | 23,467 | 133 |
| Mainline Protestant | 9,810 | 36 |
| Other | 5,365 | 21 |
| Orthodox | 35 | 1 |
| None | 180,010 | - |
Source: Clifford Grammich, Kirk Hadaway, Richard Houseal, Dale E.Jones, Alexei Krindatch, Richie Stanley and Richard H.Taylor. 2012. 2010 U.S.Religion Census: Religious Congregations & Membership Study. Association of Statisticians of American Religious Bodies. Jones, Dale E., et al. 2002. Congregations and Membership in the United States 2000. Nashville, TN: Glenmary Research Center.
Food Environment Statistics:
| Weld County: | 1.03 / 10,000 pop. |
| State: | 1.50 / 10,000 pop. |
| Here: | 0.12 / 10,000 pop. |
| Colorado: | 0.15 / 10,000 pop. |
| This county: | 0.04 / 10,000 pop. |
| Colorado: | 0.45 / 10,000 pop. |
| Weld County: | 2.80 / 10,000 pop. |
| Colorado: | 3.13 / 10,000 pop. |
| This county: | 5.77 / 10,000 pop. |
| State: | 8.99 / 10,000 pop. |
| Weld County: | 5.3% |
| Colorado: | 5.3% |
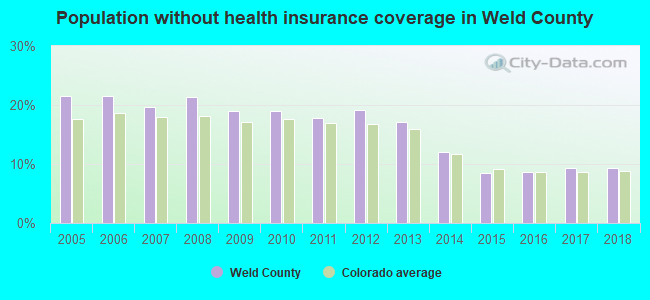
| Weld County: | 23.0% |
| State: | 18.4% |
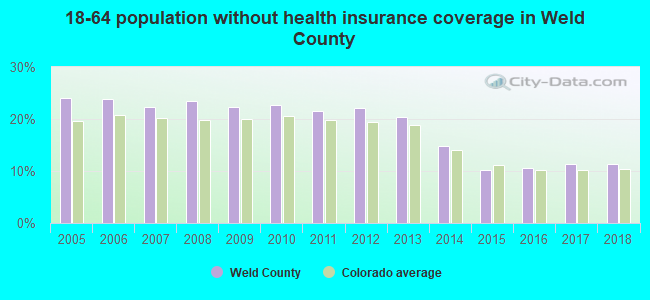
| Here: | 11.5% |
| State: | 9.6% |
Agriculture in Weld County:
Average size of farms: 581 acresAverage value of agricultural products sold per farm: $361,376
Average value of crops sold per acre for harvested cropland: $485.01
The value of nursery, greenhouse, floriculture, and sod as a percentage of the total market value of agricultural products sold: 6.64%
The value of livestock, poultry, and their products as a percentage of the total market value of agricultural products sold: 81.84%
Average total farm production expenses per farm: $347,972
Harvested cropland as a percentage of land in farms: 23.31%
Irrigated harvested cropland as a percentage of land in farms: 71.25%
Average market value of all machinery and equipment per farm: $112,747
The percentage of farms operated by a family or individual: 85.04%
Average age of principal farm operators: 54 years
Average number of cattle and calves per 100 acres of all land in farms: 30.24
Milk cows as a percentage of all cattle and calves: 9.18%
Corn for grain: 74904 harvested acres
All wheat for grain: 91451 harvested acres
Vegetables: 12,219 harvested acres
Land in orchards: 3 acres
Earthquake activity:
Weld County-area historical earthquake activity is significantly above Colorado state average. It is 621% greater than the overall U.S. average.On 8/18/1959 at 06:37:13, a magnitude 7.7 (7.7 UK, Class: Major, Intensity: VIII - XII) earthquake occurred 420.1 miles away from Weld County center, causing $26,000,000 total damage
On 10/18/1984 at 15:30:23, a magnitude 5.5 (5.4 MB, 5.1 MS, 5.5 ML, Class: Moderate, Intensity: VI - VII) earthquake occurred 148.2 miles away from the county center
On 10/28/1983 at 14:06:06, a magnitude 7.3 (6.2 MB, 7.3 MS, 7.0 MW) earthquake occurred 531.2 miles away from the county center, causing 2 deaths (2 shaking deaths) and 3 injuries, causing $15,000,000 total damage
On 8/23/2011 at 05:46:18, a magnitude 5.3 (5.3 MW, Depth: 2.5 mi) earthquake occurred 227.1 miles away from the county center
On 3/28/1975 at 02:31:05, a magnitude 6.2 (6.1 MB, 6.0 MS, 6.2 ML, Class: Strong, Intensity: VII - IX) earthquake occurred 419.2 miles away from Weld County center
On 2/3/1995 at 15:26:10, a magnitude 5.3 (5.3 MB, 4.6 MS, Depth: 0.6 mi) earthquake occurred 269.3 miles away from the county center
Magnitude types: body-wave magnitude (MB), local magnitude (ML), surface-wave magnitude (MS), moment magnitude (MW)
Most recent natural disasters:
- Colorado Covid-19 Pandemic, Incident Period: January 20, 2020, FEMA Id: 4498, Natural disaster type: Other
- Colorado Severe Storms, Flooding, Landslides, and Mudslides, Incident Period: September 11, 2013 to October 31, 2013, Emergency Declared EM-3365: September 12, 2013, FEMA Id: 3365, Natural disaster type: Storm, Mudslide, Landslide, Flood
- Colorado Severe Storms, Flooding, Landslides, and Mudslides, Incident Period: September 11, 2013 to September 30, 2013, Major Disaster (Presidential) Declared DR-4145: September 14, 2013, FEMA Id: 4145, Natural disaster type: Storm, Mudslide, Landslide, Flood
- Colorado Severe Storms and Tornadoes, Incident Period: May 22, 2008, Major Disaster (Presidential) Declared DR-1762: May 26, 2008, FEMA Id: 1762, Natural disaster type: Storm, Tornado
- Colorado Hurricane Katrina Evacuation, Incident Period: August 29, 2005 to October 01, 2005, Emergency Declared EM-3224: September 05, 2005, FEMA Id: 3224, Natural disaster type: Hurricane
- Colorado Snowstorm, Incident Period: March 17, 2003 to March 20, 2003, Emergency Declared EM-3185: April 09, 2003, FEMA Id: 3185, Natural disaster type: Snowstorm
- Colorado Wildfires, Incident Period: April 23, 2002 to August 06, 2002, Major Disaster (Presidential) Declared DR-1421: June 19, 2002, FEMA Id: 1421, Natural disaster type: Fire
- Colorado Severe Storms, Incident Period: April 11, 2001 to April 22, 2001, Major Disaster (Presidential) Declared DR-1374: May 17, 2001, FEMA Id: 1374, Natural disaster type: Storm
- Colorado Severe Storms, Flooding, Mudslides, and Landslides, Incident Period: April 29, 1999 to May 19, 1999, Major Disaster (Presidential) Declared DR-1276: May 17, 1999, FEMA Id: 1276, Natural disaster type: Storm, Mudslide, Landslide, Flood
- Colorado Flooding, Incident Period: July 28, 1997 to August 12, 1997, Major Disaster (Presidential) Declared DR-1186: August 01, 1997, FEMA Id: 1186, Natural disaster type: Flood
- 5 other natural disasters have been reported since 1953.
The number of natural disasters in Weld County (15) is near the US average (15).
Major Disasters (Presidential) Declared: 11
Emergencies Declared: 3
Causes of natural disasters: Storms: 8, Floods: 7, Landslides: 3, Mudslides: 3, Tornadoes: 2, Fire: 1, Flash Flood: 1, Heavy Rain: 1, Hurricane: 1, Snow: 1, Snowstorm: 1, Other: 2 (Note: some incidents may be assigned to more than one category).
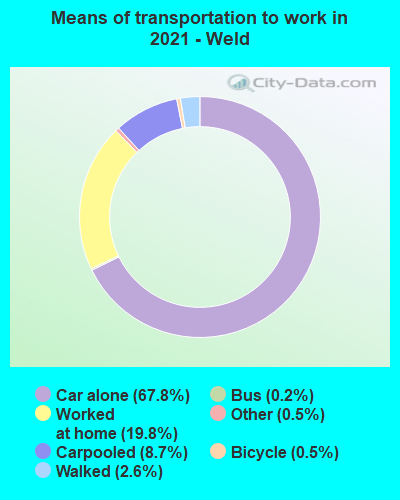
Means of transportation to work:
- Drove a car alone: 95,361 (68.8%)
- Carpooled: 12,774 (9.2%)
- Bus: 370 (0.3%)
- Light rail, streetcar or trolley: 14 (0.0%)
- Taxicab, motorcycle, or other means: 1,593 (1.1%)
- Bicycle: 308 (0.2%)
- Walked: 1,937 (1.4%)
- Worked at home: 26,262 (18.9%)

- Health care and social assistance (16%)
- Educational services (11%)
- Retail trade (11%)
- Professional, scientific, and technical services (6%)
- Accommodation and food services (5%)
- Other services, except public administration (4%)
- Manufacturing (4%)
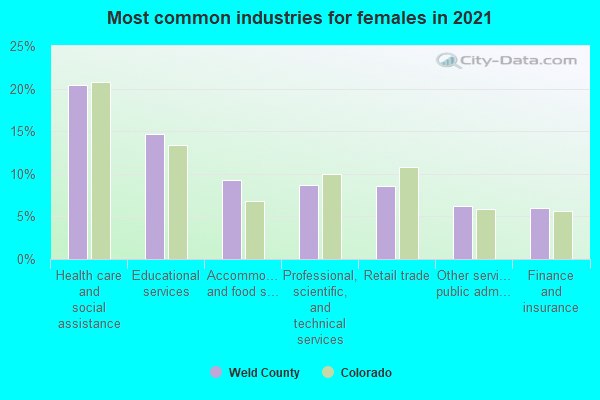
- Health care and social assistance (20%)
- Educational services (14%)
- Retail trade (14%)
- Professional, scientific, and technical services (7%)
- Accommodation and food services (6%)
- Other services, except public administration (6%)
- Manufacturing (6%)
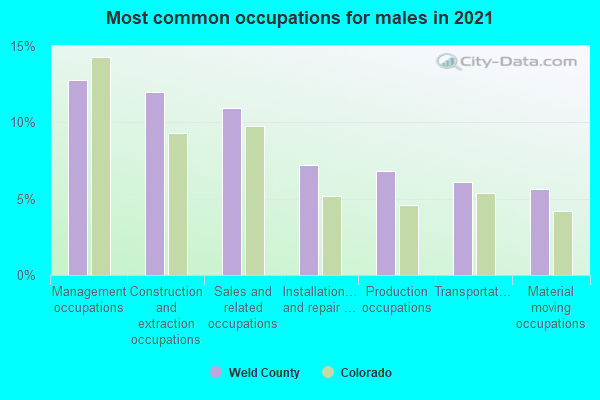
- Management occupations (14%)
- Construction and extraction occupations (12%)
- Sales and related occupations (7%)
- Production occupations (7%)
- Installation, maintenance, and repair occupations (7%)
- Transportation occupations (5%)
- Food preparation and serving related occupations (5%)
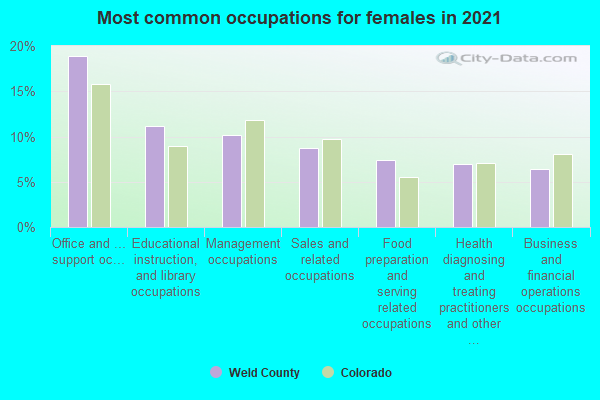
- Office and administrative support occupations (14%)
- Management occupations (13%)
- Educational instruction, and library occupations (11%)
- Sales and related occupations (10%)
- Business and financial operations occupations (6%)
- Healthcare support occupations (6%)
- Food preparation and serving related occupations (6%)
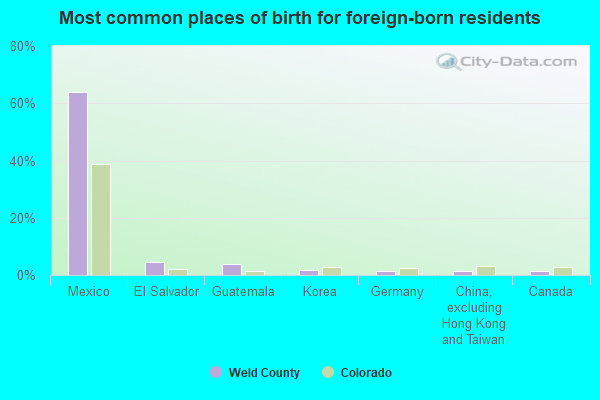
- Mexico (65%)
- El Salvador (5%)
- Guatemala (3%)
- Germany (2%)
- Korea (2%)
- Canada (1%)
- Eritrea (1%)
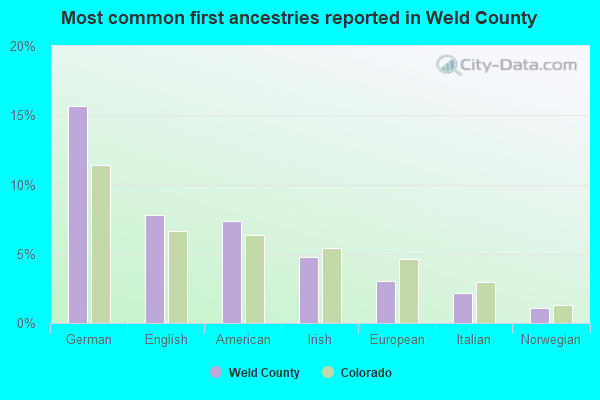
- German (14%)
- American (9%)
- English (8%)
- Irish (4%)
- European (3%)
- Italian (2%)
- Norwegian (1%)
People in group quarters in Weld County, Colorado in 2010:
- 3,055 people in college/university student housing
- 871 people in state prisons
- 730 people in nursing facilities/skilled-nursing facilities
- 549 people in local jails and other municipal confinement facilities
- 243 people in correctional facilities intended for juveniles
- 194 people in correctional residential facilities
- 66 people in group homes intended for adults
- 59 people in other noninstitutional facilities
- 57 people in emergency and transitional shelters (with sleeping facilities) for people experiencing homelessness
- 30 people in residential treatment centers for juveniles (non-correctional)
- 30 people in residential treatment centers for adults
- 11 people in workers' group living quarters and job corps centers
People in group quarters in Weld County, Colorado in 2000:
- 2,877 people in college dormitories (includes college quarters off campus)
- 778 people in nursing homes
- 440 people in local jails and other confinement facilities (including police lockups)
- 262 people in other types of correctional institutions
- 187 people in agriculture workers' dormitories on farms
- 183 people in other noninstitutional group quarters
- 124 people in training schools for juvenile delinquents
- 49 people in other group homes
- 31 people in homes or halfway houses for drug/alcohol abuse
- 19 people in homes for the mentally retarded
- 16 people in homes for the mentally ill
- 10 people in homes for abused, dependent, and neglected children
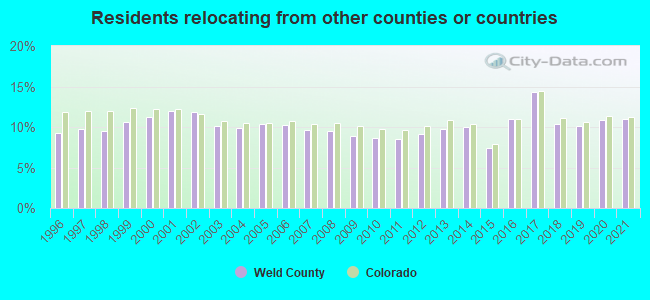
10.97% of this county's 2021 resident taxpayers lived in other counties in 2020 ($69,914 average adjusted gross income)
| Here: | 10.97% |
| Colorado average: | 11.28% |
10 or fewer of this county's residents moved from foreign countries.
7.73% relocated from other counties in Colorado ($49,447 average AGI)
3.23% relocated from other states ($20,468 average AGI)
Weld County: 3.23% Colorado average: 5.04%
Top counties from which taxpayers relocated into this county between 2020 and 2021:
| from Larimer County, CO | |
| from Adams County, CO | |
| from Boulder County, CO | |
| from Jefferson County, CO | |
| from Denver County, CO | |
| from Arapahoe County, CO | |
| from El Paso County, CO |
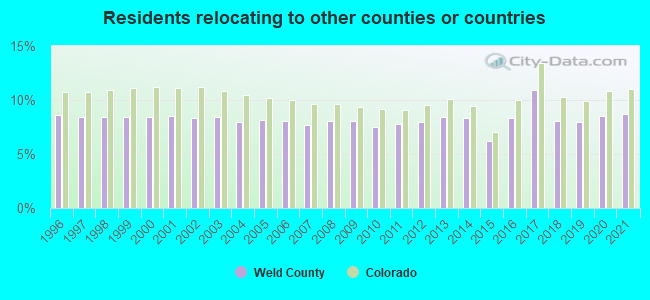
8.74% of this county's 2020 resident taxpayers moved to other counties in 2021 ($67,222 average adjusted gross income)
| Here: | 8.74% |
| Colorado average: | 11.05% |
10 or fewer of this county's residents moved to foreign countries.
4.88% relocated to other counties in Colorado ($35,441 average AGI)
3.87% relocated to other states ($31,781 average AGI)
Weld County: 3.87% Colorado average: 4.80%
Top counties to which taxpayers relocated from this county between 2020 and 2021:
| to Larimer County, CO | |
| to Adams County, CO | |
| to Boulder County, CO | |
| to Denver County, CO | |
| to Jefferson County, CO | |
| to Arapahoe County, CO | |
| to El Paso County, CO |
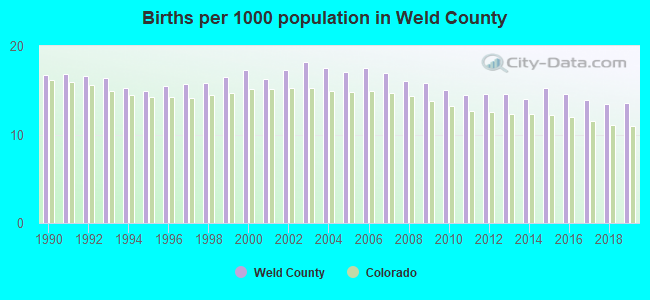
Births per 1000 population from 1990 to 1999: 16.0
Births per 1000 population from 2000 to 2009: 17.0
Births per 1000 population from 2010 to 2022: 12.0
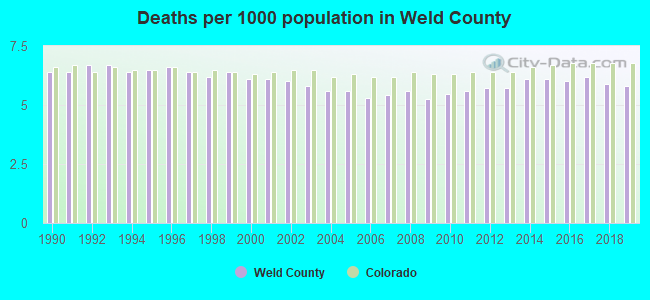
Deaths per 1000 population from 1990 to 1999: 6.5
Deaths per 1000 population from 2000 to 2009: 5.7
Deaths per 1000 population from 2010 to 2020: 5.9
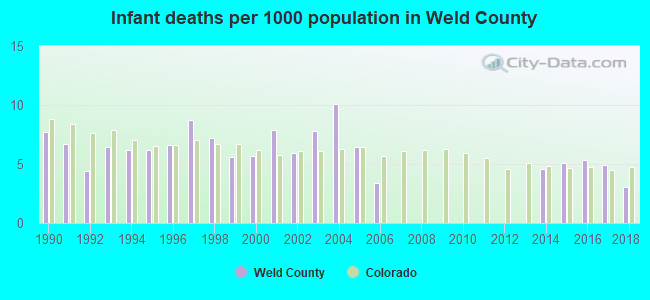
Infant deaths per 1000 live births from 1990 to 1999: 6.6
Infant deaths per 1000 live births from 2000 to 2009: 4.7
Infant deaths per 1000 live births from 2010 to 2021: 3.0
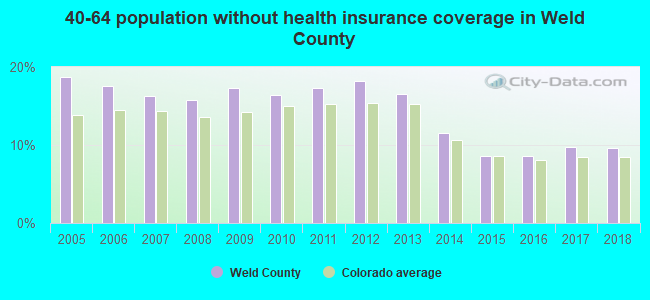
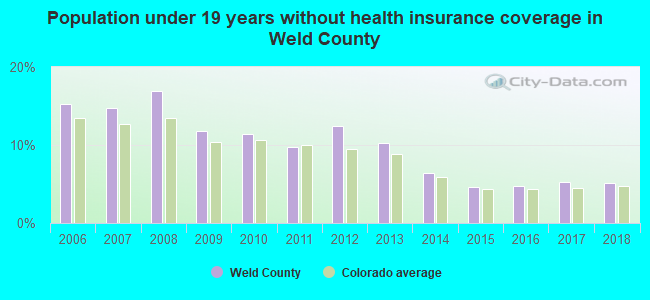
Persons under 19 years old without health insurance coverage in 2018: 5.1%
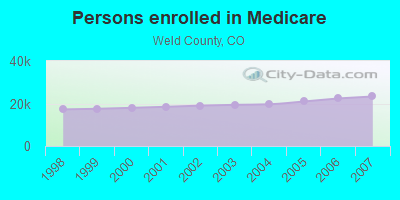
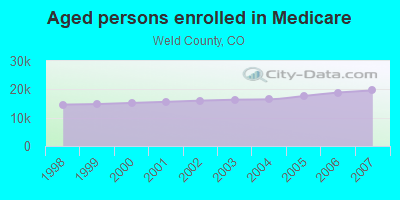
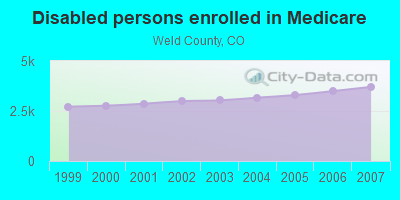
Persons enrolled in hospital insurance and/or supplemental medical insurance (Medicare) in July 1, 2007: 23,305 (19,599 aged, 3,706 disabled)
Children under 18 without health insurance coverage in 2007: 9,005 (13%)
Most common underlying causes of death in Weld County, Colorado in 1999 - 2019:
- Chronic obstructive pulmonary disease, unspecified (1,602)
- Atherosclerotic heart disease (1,529)
- Bronchus or lung, unspecified - Malignant neoplasms (1,474)
- Alzheimer disease, unspecified (1,248)
- Acute myocardial infarction, unspecified (1,238)
- Unspecified dementia (861)
- Stroke, not specified as haemorrhage or infarction (713)
- Congestive heart failure (633)
- Breast, unspecified - Malignant neoplasms (524)
- Colon, unspecified - Malignant neoplasms (477)
Population without health insurance coverage in 2000: 17%
Children under 18 without health insurance coverage in 2000: 14%
Homicides per 1,000,000 population from 2000 to 2006: 27.0. This is less than state average.
Suicides per 1,000,000 population from 2000 to 2006: 131.7. This is less than state average.
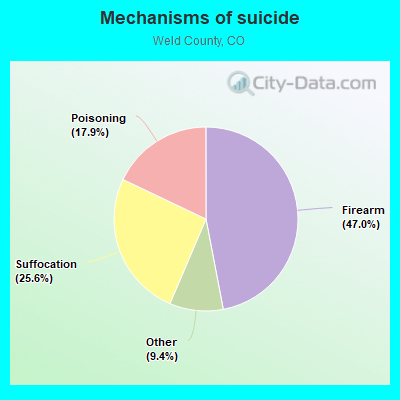
- Firearm - 61.9
- Suffocation - 33.8
- Poisoning - 23.6
- Other - 12.4
Household type by relationship:
Households: 350,176- Male householders: 63,599 (12,632 living alone), Female householders: 60,226 (14,517 living alone)
69,943 spouses (69,410 opposite-sex spouses), 10,320 unmarried partners, (9,701 opposite-sex unmarried partners), 105,611 children (97,044 natural, 1,861 adopted, 6,706 stepchildren), 7,910 grandchildren, 2,604 brothers or sisters, 5,521 parents, 157 foster children, 5,767 other relatives, 13,725 non-relatives
- In group quarters: 4,793
Size of family households: 32,869 2-persons, 20,794 3-persons, 19,939 4-persons, 8,262 5-persons, 3,401 6-persons, 2,049 7-or-more-persons.
Size of nonfamily households: 27,149 1-person, 6,823 2-persons, 1,641 3-persons, 710 4-persons, 188 5-persons.
62,065 married couples with children.
17,118 single-parent households (6,875 men, 10,243 women).
80.6% of residents of Weld speak English at home.
16.6% of residents speak Spanish at home (63% speak English very well, 17% speak English well, 13% speak English not well, 7% don't speak English at all).
1.1% of residents speak other Indo-European language at home (86% speak English very well, 9% speak English well, 6% speak English not well).
0.9% of residents speak Asian or Pacific Island language at home (57% speak English very well, 23% speak English well, 16% speak English not well, 4% don't speak English at all).
0.5% of residents speak other language at home (62% speak English very well, 22% speak English well, 7% speak English not well, 9% don't speak English at all).
In fiscal year 2004:
Federal Government expenditure: $686,188,000 ($3,130 per capita)
Department of Defense expenditure: $36,560,000
Federal direct payments to individuals for retirement and disability: $290,273,000
Federal other direct payments to individuals: $137,039,000
Federal direct payments not to individuals: $30,257,000
Federal grants: $165,818,000
Federal procurement contracts: $18,702,000 ($9,355,000 Department of Defense)
Federal salaries and wages: $44,100,000 ($12,438,000 Department of Defense)
Federal Government direct loans: $7,215,000
Federal guaranteed/insured loans: $413,440,000
Federal Government insurance: $132,454,000
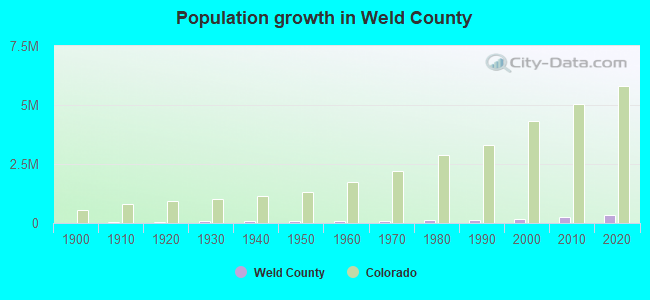
Population change from April 1, 2000 to July 1, 2005:
Births: 18,503| Here: | 81 per 1000 residents |
| State: | 76 per 1000 residents |
Deaths: 6,089
| Here: | 27 per 1000 residents |
| State: | 32 per 1000 residents |
Net international migration: +5,018
| Here: | +22 per 1000 residents |
| State: | +24 per 1000 residents |
Net internal migration: +30,930
| Here: | +135 per 1000 residents |
| State: | +10 per 1000 residents |
Total withdrawal of fresh water for public supply: 36.87 millions of gallons per day (2% from ground, 98% from surface)
| Here: | 7.0 |
| State: | 6.8 |
| Here: | 4.4 |
| State: | 4.0 |
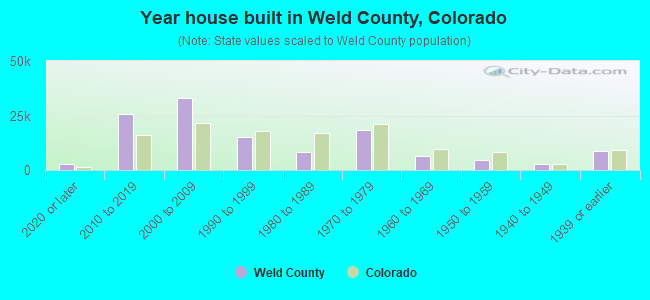
- Year house built in Weld County, Colorado
- 7,1002020 or later
- 29,9982010 to 2019
- 32,1442000 to 2009
- 12,9221990 to 1999
- 9,2021980 to 1989
- 16,4801970 to 1979
- 6,7661960 to 1969
- 5,4881950 to 1959
- 2,1141940 to 1949
- 6,7641939 or earlier
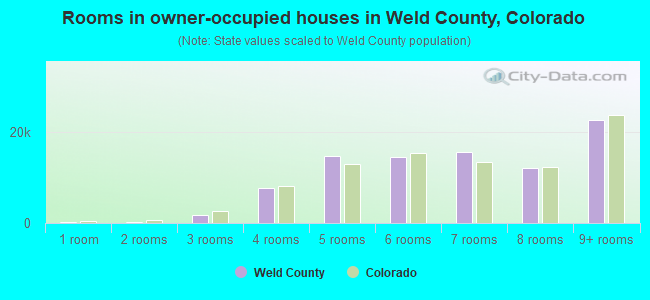
- Rooms in owner-occupied houses in Weld County, Colorado
- 3651 room
- 1142 rooms
- 2,0253 rooms
- 7,6314 rooms
- 15,0805 rooms
- 16,1736 rooms
- 13,5337 rooms
- 14,1008 rooms
- 26,1979+ rooms
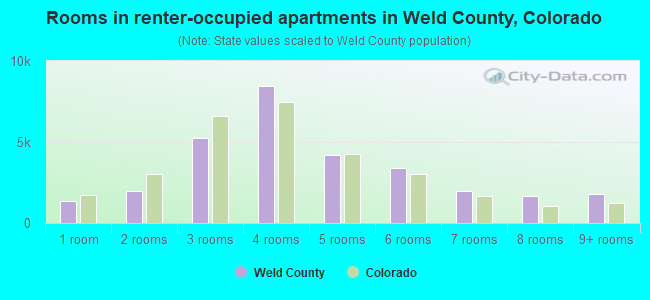
- Rooms in renter-occupied apartments in Weld County, Colorado
- 2,5321 room
- 1,4212 rooms
- 3,3723 rooms
- 7,8284 rooms
- 4,0055 rooms
- 3,8286 rooms
- 1,7607 rooms
- 1,6148 rooms
- 2,2479+ rooms
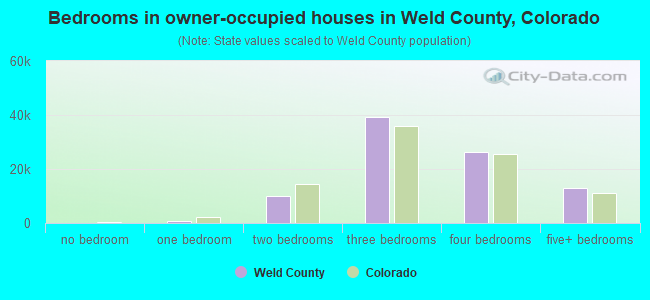
- Bedrooms in owner-occupied houses in Weld County, Colorado
- 365no bedroom
- 7601 bedroom
- 10,5882 bedrooms
- 42,4953 bedrooms
- 26,2924 bedrooms
- 14,7185+ bedrooms
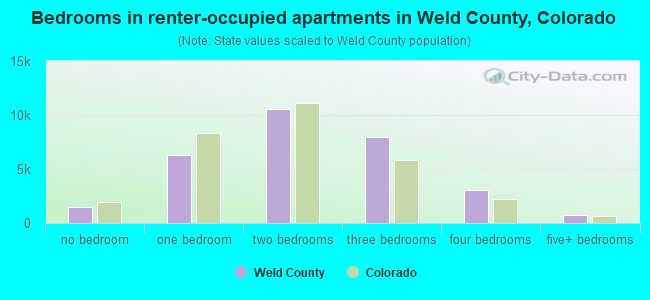
- Bedrooms in renter-occupied apartments in Weld County, Colorado
- 2,615no bedroom
- 4,1221 bedroom
- 11,1342 bedrooms
- 6,1303 bedrooms
- 3,0764 bedrooms
- 1,5305+ bedrooms
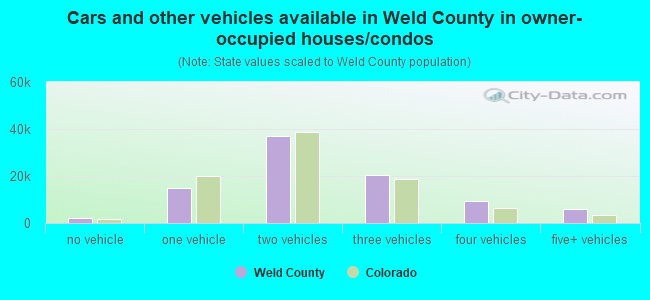
- Cars and other vehicles available in Weld County in owner-occupied houses/condos
- 2,199no vehicle
- 14,5121 vehicle
- 39,2922 vehicles
- 25,3643 vehicles
- 10,2204 vehicles
- 3,6315+ vehicles
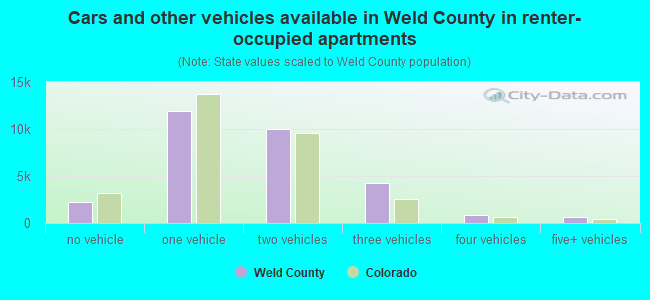
- Cars and other vehicles available in Weld County in renter-occupied apartments
- 3,404no vehicle
- 11,6631 vehicle
- 7,8052 vehicles
- 3,9243 vehicles
- 1,2724 vehicles
- 5395+ vehicles
85.4% of Weld County residents lived in the same house 1 years ago.
Out of people who lived in different houses, 24% lived in this county.
Out of people who lived in different counties, 74% lived in Colorado.
| Weld County: | 85.4% |
| State average: | 83.6% |
Place of birth for U.S.-born residents:
- This state: 192,300
- Other state: 119,709
- Northeast: 12,454
- Midwest: 43,291
- South: 22,434
- West: 41,530
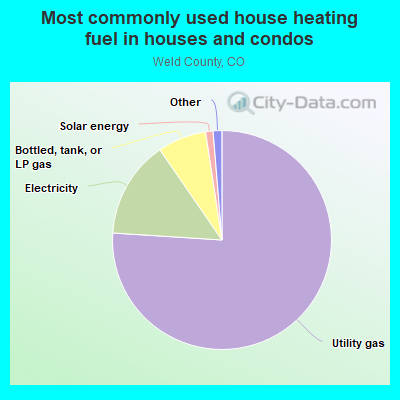
- 78.6%Utility gas
- 13.3%Electricity
- 6.1%Bottled, tank, or LP gas
- 0.6%Wood
- 0.6%Solar energy
- 0.6%Other fuel
- 0.3%No fuel used
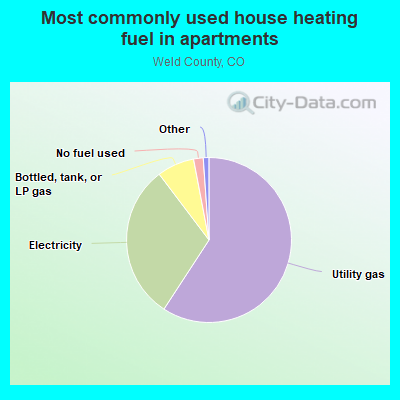
- 60.3%Utility gas
- 31.2%Electricity
- 6.8%Bottled, tank, or LP gas
- 1.1%No fuel used
- 0.3%Other fuel
- 0.3%Wood
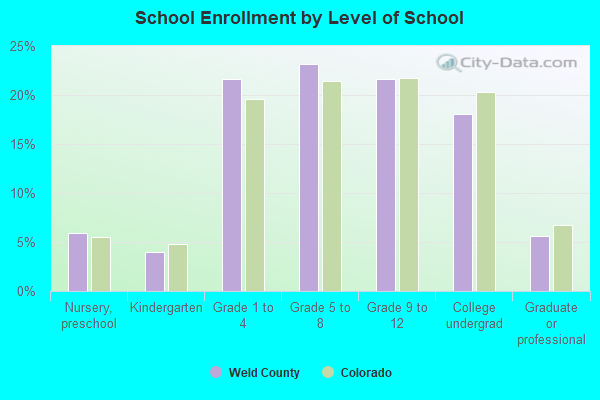
Private vs. public school enrollment:
| Here: | 9.8% |
| Colorado: | 11.4% |
| Here: | 7.1% |
| Colorado: | 8.5% |
| Here: | 10.9% |
| Colorado: | 14.0% |
Weld County government finances - Expenditure in 2018:
- Assistance and Subsidies - Public Welfare, Cash Assistance Programs - Other: $15,331,000
- Bond Funds - Cash and Securities: $54,642,000
- Charges - Other: $32,737,000
Other: $21,210,000
Solid Waste Management: $2,816,000
Solid Waste Management: $1,012,000
Regular Highways: $748,000
Regular Highways: $372,000
Housing and Community Development: $53,000
Parking Facilities: $26,000
Parking Facilities: $19,000
- Construction - General Public Buildings: $4,690,000
Regular Highways: $3,268,000
- Current Operations - Regular Highways: $70,726,000
Police Protection: $62,084,000
Public Welfare - Other: $54,007,000
General - Other: $45,633,000
Regular Highways: $33,892,000
Correctional Institutions: $25,049,000
General - Other: $21,126,000
Police Protection: $19,517,000
Public Welfare - Other: $14,666,000
Health - Other: $12,114,000
Health - Other: $9,443,000
Central Staff Services: $8,884,000
Judicial and Legal Services: $7,943,000
General Public Buildings: $6,924,000
General Public Buildings: $6,691,000
Judicial and Legal Services: $6,460,000
Financial Administration: $6,460,000
Central Staff Services: $6,003,000
Financial Administration: $5,298,000
Housing and Community Development: $3,299,000
Natural Resources - Other: $3,138,000
Corrections - Other: $2,985,000
Corrections - Other: $2,925,000
Natural Resources - Other: $1,777,000
Protective Inspection and Regulation - Other: $1,517,000
Protective Inspection and Regulation - Other: $1,235,000
Public Welfare, Vendor Payments for Other Purposes: $674,000
Parks and Recreation: $433,000
Solid Waste Management: $303,000
Parks and Recreation: $196,000
Solid Waste Management: $92,000
- Federal Intergovernmental - Public Welfare: $6,350,000
Housing and Community Development: $3,420,000
- General - Interest on Debt: $273,000
Interest on Debt: $111,000
- Intergovernmental to Local - Other - Regular Highways: $4,252,000
Other - Regular Highways: $1,444,000
Other - Police Protection: $15,000
- Intergovernmental to State - Police Protection: $45,000
Police Protection: $1,000
- Local Intergovernmental - Other: $808,000
General Local Government Support: $437,000
- Long Term Debt - Beginning Outstanding - Unspecified Public Purpose: $3,952,000
Outstanding Unspecified Public Purpose: $3,666,000
Beginning Outstanding - Public Debt for Private Purpose: $2,769,000
Outstanding Nonguaranteed - Industrial Revenue: $2,769,000
Beginning Outstanding - Public Debt for Private Purpose: $2,345,000
Outstanding Nonguaranteed - Industrial Revenue: $2,107,000
Retired Unspecified Public Purpose: $286,000
Retired Nonguaranteed - Public Debt for Private Purpose: $238,000
- Miscellaneous - Royalties: $36,365,000
Royalties: $20,592,000
General Revenue - Other: $15,603,000
General Revenue - Other: $15,422,000
Interest Earnings: $7,926,000
Interest Earnings: $4,099,000
Rents: $2,680,000
Rents: $1,558,000
Fines and Forfeits: $935,000
Fines and Forfeits: $649,000
Donations From Private Sources: $247,000
Sale of Property: $158,000
Special Assessments: $19,000
Special Assessments: $5,000
- Other Capital Outlay - General Public Building: $10,099,000
General - Other: $3,875,000
General - Other: $1,287,000
Public Welfare - Other: $461,000
Solid Waste Management: $286,000
Health - Other: $201,000
Police Protection: $102,000
Correctional Institutions: $42,000
Regular Highways: $28,000
Regular Highways: $13,000
- Other Funds - Cash and Securities: $163,152,000
Cash and Securities: $149,596,000
- Sinking Funds - Cash and Securities: $3,923,000
Cash and Securities: $2,769,000
- State Intergovernmental - Public Welfare: $33,365,000
Public Welfare: $23,445,000
Other: $13,414,000
Highways: $13,216,000
Highways: $11,285,000
Other: $7,865,000
General Local Government Support: $5,201,000
Health and Hospitals: $3,168,000
Health and Hospitals: $3,112,000
General Local Government Support: $2,775,000
- Tax - Property: $168,838,000
Property: $113,286,000
Other License: $5,477,000
Other License: $2,950,000
Motor Vehicle License: $389,000
Alcoholic Beverage License: $11,000
Other: $1,000
- Total Salaries and Wages: $78,089,000
Weld County government finances - Revenue in 2018:
- Assistance and Subsidies - Public Welfare, Cash Assistance Programs - Other: $15,331,000
- Bond Funds - Cash and Securities: $54,642,000
- Charges - Other: $32,737,000
Other: $21,210,000
Solid Waste Management: $2,816,000
Solid Waste Management: $1,012,000
Regular Highways: $748,000
Regular Highways: $372,000
Housing and Community Development: $53,000
Parking Facilities: $26,000
Parking Facilities: $19,000
- Construction - General Public Buildings: $4,690,000
Regular Highways: $3,268,000
- Current Operations - Regular Highways: $70,726,000
Police Protection: $62,084,000
Public Welfare - Other: $54,007,000
General - Other: $45,633,000
Regular Highways: $33,892,000
Correctional Institutions: $25,049,000
General - Other: $21,126,000
Police Protection: $19,517,000
Public Welfare - Other: $14,666,000
Health - Other: $12,114,000
Health - Other: $9,443,000
Central Staff Services: $8,884,000
Judicial and Legal Services: $7,943,000
General Public Buildings: $6,924,000
General Public Buildings: $6,691,000
Judicial and Legal Services: $6,460,000
Financial Administration: $6,460,000
Central Staff Services: $6,003,000
Financial Administration: $5,298,000
Housing and Community Development: $3,299,000
Natural Resources - Other: $3,138,000
Corrections - Other: $2,985,000
Corrections - Other: $2,925,000
Natural Resources - Other: $1,777,000
Protective Inspection and Regulation - Other: $1,517,000
Protective Inspection and Regulation - Other: $1,235,000
Public Welfare, Vendor Payments for Other Purposes: $674,000
Parks and Recreation: $433,000
Solid Waste Management: $303,000
Parks and Recreation: $196,000
Solid Waste Management: $92,000
- Federal Intergovernmental - Public Welfare: $6,350,000
Housing and Community Development: $3,420,000
- General - Interest on Debt: $273,000
Interest on Debt: $111,000
- Intergovernmental to Local - Other - Regular Highways: $4,252,000
Other - Regular Highways: $1,444,000
Other - Police Protection: $15,000
- Intergovernmental to State - Police Protection: $45,000
Police Protection: $1,000
- Local Intergovernmental - Other: $808,000
General Local Government Support: $437,000
- Long Term Debt - Beginning Outstanding - Unspecified Public Purpose: $3,952,000
Outstanding Unspecified Public Purpose: $3,666,000
Beginning Outstanding - Public Debt for Private Purpose: $2,769,000
Outstanding Nonguaranteed - Industrial Revenue: $2,769,000
Beginning Outstanding - Public Debt for Private Purpose: $2,345,000
Outstanding Nonguaranteed - Industrial Revenue: $2,107,000
Retired Unspecified Public Purpose: $286,000
Retired Nonguaranteed - Public Debt for Private Purpose: $238,000
- Miscellaneous - Royalties: $36,365,000
Royalties: $20,592,000
General Revenue - Other: $15,603,000
General Revenue - Other: $15,422,000
Interest Earnings: $7,926,000
Interest Earnings: $4,099,000
Rents: $2,680,000
Rents: $1,558,000
Fines and Forfeits: $935,000
Fines and Forfeits: $649,000
Donations From Private Sources: $247,000
Sale of Property: $158,000
Special Assessments: $19,000
Special Assessments: $5,000
- Other Capital Outlay - General Public Building: $10,099,000
General - Other: $3,875,000
General - Other: $1,287,000
Public Welfare - Other: $461,000
Solid Waste Management: $286,000
Health - Other: $201,000
Police Protection: $102,000
Correctional Institutions: $42,000
Regular Highways: $28,000
Regular Highways: $13,000
- Other Funds - Cash and Securities: $163,152,000
Cash and Securities: $149,596,000
- Sinking Funds - Cash and Securities: $3,923,000
Cash and Securities: $2,769,000
- State Intergovernmental - Public Welfare: $33,365,000
Public Welfare: $23,445,000
Other: $13,414,000
Highways: $13,216,000
Highways: $11,285,000
Other: $7,865,000
General Local Government Support: $5,201,000
Health and Hospitals: $3,168,000
Health and Hospitals: $3,112,000
General Local Government Support: $2,775,000
- Tax - Property: $168,838,000
Property: $113,286,000
Other License: $5,477,000
Other License: $2,950,000
Motor Vehicle License: $389,000
Alcoholic Beverage License: $11,000
Other: $1,000
- Total Salaries and Wages: $78,089,000
Weld County government finances - Debt in 2018:
- Assistance and Subsidies - Public Welfare, Cash Assistance Programs - Other: $15,331,000
- Bond Funds - Cash and Securities: $54,642,000
- Charges - Other: $32,737,000
Other: $21,210,000
Solid Waste Management: $2,816,000
Solid Waste Management: $1,012,000
Regular Highways: $748,000
Regular Highways: $372,000
Housing and Community Development: $53,000
Parking Facilities: $26,000
Parking Facilities: $19,000
- Construction - General Public Buildings: $4,690,000
Regular Highways: $3,268,000
- Current Operations - Regular Highways: $70,726,000
Police Protection: $62,084,000
Public Welfare - Other: $54,007,000
General - Other: $45,633,000
Regular Highways: $33,892,000
Correctional Institutions: $25,049,000
General - Other: $21,126,000
Police Protection: $19,517,000
Public Welfare - Other: $14,666,000
Health - Other: $12,114,000
Health - Other: $9,443,000
Central Staff Services: $8,884,000
Judicial and Legal Services: $7,943,000
General Public Buildings: $6,924,000
General Public Buildings: $6,691,000
Judicial and Legal Services: $6,460,000
Financial Administration: $6,460,000
Central Staff Services: $6,003,000
Financial Administration: $5,298,000
Housing and Community Development: $3,299,000
Natural Resources - Other: $3,138,000
Corrections - Other: $2,985,000
Corrections - Other: $2,925,000
Natural Resources - Other: $1,777,000
Protective Inspection and Regulation - Other: $1,517,000
Protective Inspection and Regulation - Other: $1,235,000
Public Welfare, Vendor Payments for Other Purposes: $674,000
Parks and Recreation: $433,000
Solid Waste Management: $303,000
Parks and Recreation: $196,000
Solid Waste Management: $92,000
- Federal Intergovernmental - Public Welfare: $6,350,000
Housing and Community Development: $3,420,000
- General - Interest on Debt: $273,000
Interest on Debt: $111,000
- Intergovernmental to Local - Other - Regular Highways: $4,252,000
Other - Regular Highways: $1,444,000
Other - Police Protection: $15,000
- Intergovernmental to State - Police Protection: $45,000
Police Protection: $1,000
- Local Intergovernmental - Other: $808,000
General Local Government Support: $437,000
- Long Term Debt - Beginning Outstanding - Unspecified Public Purpose: $3,952,000
Outstanding Unspecified Public Purpose: $3,666,000
Beginning Outstanding - Public Debt for Private Purpose: $2,769,000
Outstanding Nonguaranteed - Industrial Revenue: $2,769,000
Beginning Outstanding - Public Debt for Private Purpose: $2,345,000
Outstanding Nonguaranteed - Industrial Revenue: $2,107,000
Retired Unspecified Public Purpose: $286,000
Retired Nonguaranteed - Public Debt for Private Purpose: $238,000
- Miscellaneous - Royalties: $36,365,000
Royalties: $20,592,000
General Revenue - Other: $15,603,000
General Revenue - Other: $15,422,000
Interest Earnings: $7,926,000
Interest Earnings: $4,099,000
Rents: $2,680,000
Rents: $1,558,000
Fines and Forfeits: $935,000
Fines and Forfeits: $649,000
Donations From Private Sources: $247,000
Sale of Property: $158,000
Special Assessments: $19,000
Special Assessments: $5,000
- Other Capital Outlay - General Public Building: $10,099,000
General - Other: $3,875,000
General - Other: $1,287,000
Public Welfare - Other: $461,000
Solid Waste Management: $286,000
Health - Other: $201,000
Police Protection: $102,000
Correctional Institutions: $42,000
Regular Highways: $28,000
Regular Highways: $13,000
- Other Funds - Cash and Securities: $163,152,000
Cash and Securities: $149,596,000
- Sinking Funds - Cash and Securities: $3,923,000
Cash and Securities: $2,769,000
- State Intergovernmental - Public Welfare: $33,365,000
Public Welfare: $23,445,000
Other: $13,414,000
Highways: $13,216,000
Highways: $11,285,000
Other: $7,865,000
General Local Government Support: $5,201,000
Health and Hospitals: $3,168,000
Health and Hospitals: $3,112,000
General Local Government Support: $2,775,000
- Tax - Property: $168,838,000
Property: $113,286,000
Other License: $5,477,000
Other License: $2,950,000
Motor Vehicle License: $389,000
Alcoholic Beverage License: $11,000
Other: $1,000
- Total Salaries and Wages: $78,089,000
Weld County government finances - Cash and Securities in 2018:
- Assistance and Subsidies - Public Welfare, Cash Assistance Programs - Other: $15,331,000
- Bond Funds - Cash and Securities: $54,642,000
- Charges - Other: $32,737,000
Other: $21,210,000
Solid Waste Management: $2,816,000
Solid Waste Management: $1,012,000
Regular Highways: $748,000
Regular Highways: $372,000
Housing and Community Development: $53,000
Parking Facilities: $26,000
Parking Facilities: $19,000
- Construction - General Public Buildings: $4,690,000
Regular Highways: $3,268,000
- Current Operations - Regular Highways: $70,726,000
Police Protection: $62,084,000
Public Welfare - Other: $54,007,000
General - Other: $45,633,000
Regular Highways: $33,892,000
Correctional Institutions: $25,049,000
General - Other: $21,126,000
Police Protection: $19,517,000
Public Welfare - Other: $14,666,000
Health - Other: $12,114,000
Health - Other: $9,443,000
Central Staff Services: $8,884,000
Judicial and Legal Services: $7,943,000
General Public Buildings: $6,924,000
General Public Buildings: $6,691,000
Judicial and Legal Services: $6,460,000
Financial Administration: $6,460,000
Central Staff Services: $6,003,000
Financial Administration: $5,298,000
Housing and Community Development: $3,299,000
Natural Resources - Other: $3,138,000
Corrections - Other: $2,985,000
Corrections - Other: $2,925,000
Natural Resources - Other: $1,777,000
Protective Inspection and Regulation - Other: $1,517,000
Protective Inspection and Regulation - Other: $1,235,000
Public Welfare, Vendor Payments for Other Purposes: $674,000
Parks and Recreation: $433,000
Solid Waste Management: $303,000
Parks and Recreation: $196,000
Solid Waste Management: $92,000
- Federal Intergovernmental - Public Welfare: $6,350,000
Housing and Community Development: $3,420,000
- General - Interest on Debt: $273,000
Interest on Debt: $111,000
- Intergovernmental to Local - Other - Regular Highways: $4,252,000
Other - Regular Highways: $1,444,000
Other - Police Protection: $15,000
- Intergovernmental to State - Police Protection: $45,000
Police Protection: $1,000
- Local Intergovernmental - Other: $808,000
General Local Government Support: $437,000
- Long Term Debt - Beginning Outstanding - Unspecified Public Purpose: $3,952,000
Outstanding Unspecified Public Purpose: $3,666,000
Beginning Outstanding - Public Debt for Private Purpose: $2,769,000
Outstanding Nonguaranteed - Industrial Revenue: $2,769,000
Beginning Outstanding - Public Debt for Private Purpose: $2,345,000
Outstanding Nonguaranteed - Industrial Revenue: $2,107,000
Retired Unspecified Public Purpose: $286,000
Retired Nonguaranteed - Public Debt for Private Purpose: $238,000
- Miscellaneous - Royalties: $36,365,000
Royalties: $20,592,000
General Revenue - Other: $15,603,000
General Revenue - Other: $15,422,000
Interest Earnings: $7,926,000
Interest Earnings: $4,099,000
Rents: $2,680,000
Rents: $1,558,000
Fines and Forfeits: $935,000
Fines and Forfeits: $649,000
Donations From Private Sources: $247,000
Sale of Property: $158,000
Special Assessments: $19,000
Special Assessments: $5,000
- Other Capital Outlay - General Public Building: $10,099,000
General - Other: $3,875,000
General - Other: $1,287,000
Public Welfare - Other: $461,000
Solid Waste Management: $286,000
Health - Other: $201,000
Police Protection: $102,000
Correctional Institutions: $42,000
Regular Highways: $28,000
Regular Highways: $13,000
- Other Funds - Cash and Securities: $163,152,000
Cash and Securities: $149,596,000
- Sinking Funds - Cash and Securities: $3,923,000
Cash and Securities: $2,769,000
- State Intergovernmental - Public Welfare: $33,365,000
Public Welfare: $23,445,000
Other: $13,414,000
Highways: $13,216,000
Highways: $11,285,000
Other: $7,865,000
General Local Government Support: $5,201,000
Health and Hospitals: $3,168,000
Health and Hospitals: $3,112,000
General Local Government Support: $2,775,000
- Tax - Property: $168,838,000
Property: $113,286,000
Other License: $5,477,000
Other License: $2,950,000
Motor Vehicle License: $389,000
Alcoholic Beverage License: $11,000
Other: $1,000
- Total Salaries and Wages: $78,089,000
Supplemental Security Income (SSI) in 2006:
- Total number of recipients: 2,610
- Number of aged recipients: 365
- Number of blind and disabled recipients: 2,245
- Number of recipients under 18: 408
- Number of recipients between 18 and 64: 1,566
- Number of recipients older than 64: 636
- Number of recipients also receiving OASDI: 1,055
- Amount of payments (thousands of dollars): 1,095
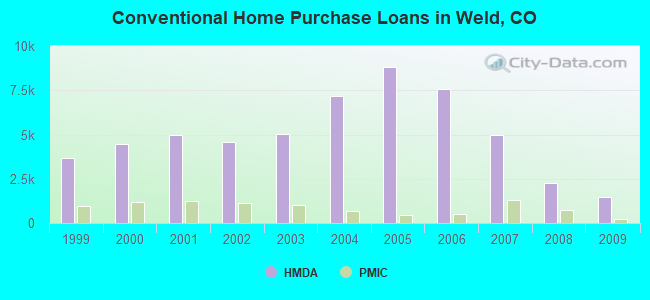
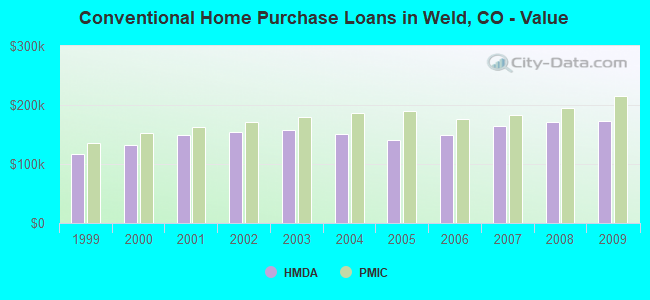
| Home Mortgage Disclosure Act Aggregated Statistics For Year 2009 (Based on 36 full tracts) | ||||||||||||||
| A) FHA, FSA/RHS & VA Home Purchase Loans | B) Conventional Home Purchase Loans | C) Refinancings | D) Home Improvement Loans | E) Loans on Dwellings For 5+ Families | F) Non-occupant Loans on < 5 Family Dwellings (A B C & D) | G) Loans On Manufactured Home Dwelling (A B C & D) | ||||||||
|---|---|---|---|---|---|---|---|---|---|---|---|---|---|---|
| Number | Average Value | Number | Average Value | Number | Average Value | Number | Average Value | Number | Average Value | Number | Average Value | Number | Average Value | |
| LOANS ORIGINATED | 2,259 | $170,364 | 1,468 | $173,247 | 5,740 | $203,544 | 189 | $80,577 | 8 | $195,125 | 546 | $131,621 | 186 | $88,575 |
| APPLICATIONS APPROVED, NOT ACCEPTED | 118 | $156,119 | 162 | $154,352 | 547 | $205,773 | 30 | $57,400 | 3 | $1,663,333 | 54 | $132,296 | 65 | $66,215 |
| APPLICATIONS DENIED | 337 | $148,362 | 239 | $144,008 | 1,780 | $213,225 | 188 | $45,298 | 1 | $1,200,000 | 181 | $142,276 | 110 | $91,345 |
| APPLICATIONS WITHDRAWN | 256 | $153,609 | 164 | $165,268 | 1,319 | $205,738 | 62 | $100,452 | 0 | $0 | 95 | $126,589 | 32 | $117,781 |
| FILES CLOSED FOR INCOMPLETENESS | 22 | $149,955 | 24 | $211,583 | 322 | $205,099 | 16 | $46,875 | 0 | $0 | 13 | $194,385 | 10 | $59,800 |
| Private Mortgage Insurance Companies Aggregated Statistics For Year 2009 (Based on 34 full tracts) | ||||||
| A) Conventional Home Purchase Loans | B) Refinancings | C) Non-occupant Loans on < 5 Family Dwellings (A & B) | ||||
|---|---|---|---|---|---|---|
| Number | Average Value | Number | Average Value | Number | Average Value | |
| LOANS ORIGINATED | 228 | $214,561 | 175 | $233,720 | 4 | $146,000 |
| APPLICATIONS APPROVED, NOT ACCEPTED | 69 | $238,594 | 78 | $238,346 | 5 | $218,000 |
| APPLICATIONS DENIED | 46 | $198,761 | 48 | $223,958 | 3 | $143,667 |
| APPLICATIONS WITHDRAWN | 15 | $186,600 | 15 | $250,333 | 1 | $135,000 |
| FILES CLOSED FOR INCOMPLETENESS | 23 | $211,217 | 14 | $192,286 | 7 | $120,429 |
| Most common first names in Weld County, CO among deceased individuals | ||
| Name | Count | Lived (average) |
|---|---|---|
| John | 952 | 76.9 years |
| Mary | 842 | 79.9 years |
| William | 676 | 76.6 years |
| Robert | 651 | 72.5 years |
| James | 544 | 72.6 years |
| George | 508 | 78.8 years |
| Charles | 440 | 76.9 years |
| Helen | 435 | 81.3 years |
| Henry | 381 | 79.3 years |
| Dorothy | 372 | 79.7 years |
| Most common last names in Weld County, CO among deceased individuals | ||
| Last name | Count | Lived (average) |
|---|---|---|
| Smith | 338 | 77.6 years |
| Johnson | 305 | 77.9 years |
| Miller | 287 | 75.4 years |
| Martinez | 221 | 72.0 years |
| Anderson | 205 | 78.1 years |
| Brown | 192 | 75.9 years |
| Nelson | 135 | 76.9 years |
| Garcia | 129 | 75.7 years |
| Williams | 127 | 76.0 years |
| Wilson | 119 | 74.8 years |
| Businesses in Weld County, CO | ||||
| Name | Count | Name | Count | |
|---|---|---|---|---|
| 7-Eleven | 12 | Long John Silver's | 1 | |
| AT&T | 6 | Lowe's | 2 | |
| Ace Hardware | 7 | Marriott | 1 | |
| Advance Auto Parts | 3 | MasterBrand Cabinets | 6 | |
| Applebee's | 2 | Maurices | 1 | |
| Arby's | 2 | Mazda | 1 | |
| AutoZone | 4 | McDonald's | 9 | |
| Bath & Body Works | 1 | Motel 6 | 2 | |
| Bed Bath & Beyond | 1 | New Balance | 2 | |
| Best Western | 1 | Nike | 10 | |
| Big O Tires | 1 | Nissan | 1 | |
| Blockbuster | 3 | Office Depot | 2 | |
| Buffalo Wild Wings | 2 | OfficeMax | 1 | |
| Burger King | 5 | Olive Garden | 1 | |
| Carl\s Jr. | 3 | Panda Express | 1 | |
| Chevrolet | 3 | Papa John's Pizza | 3 | |
| Chick-Fil-A | 1 | Payless | 3 | |
| Chipotle | 1 | Penske | 1 | |
| Chuck E. Cheese's | 1 | PetSmart | 2 | |
| Clarion | 1 | Pizza Hut | 5 | |
| Cold Stone Creamery | 2 | Plato's Closet | 1 | |
| Comfort Inn | 2 | Qdoba Mexican Grill | 3 | |
| Cricket Wireless | 9 | Quiznos | 4 | |
| Curves | 4 | RadioShack | 3 | |
| Dairy Queen | 5 | Red Lobster | 1 | |
| Decora Cabinetry | 1 | Red Robin | 1 | |
| Discount Tire | 2 | Rite Aid | 1 | |
| Domino's Pizza | 3 | SAS Shoes | 1 | |
| DressBarn | 1 | SONIC Drive-In | 5 | |
| Dressbarn | 1 | Safeway | 5 | |
| Eddie Bauer | 1 | Sam's Club | 1 | |
| Famous Footwear | 2 | Sears | 2 | |
| FedEx | 18 | Sephora | 1 | |
| Finish Line | 1 | Spencer Gifts | 1 | |
| Firestone Complete Auto Care | 1 | Starbucks | 17 | |
| Foot Locker | 1 | Subaru | 1 | |
| Ford | 3 | Subway | 18 | |
| GNC | 5 | Super 8 | 3 | |
| GameStop | 3 | T-Mobile | 10 | |
| H&R Block | 8 | T.G.I. Driday's | 1 | |
| Hilton | 2 | Taco Bell | 7 | |
| Hobby Lobby | 1 | Target | 2 | |
| Holiday Inn | 2 | Toyota | 1 | |
| Home Depot | 2 | True Value | 1 | |
| Honda | 1 | U-Haul | 19 | |
| IHOP | 2 | UPS | 25 | |
| JCPenney | 2 | Vans | 3 | |
| Jones New York | 3 | Verizon Wireless | 3 | |
| Journeys | 1 | Victoria's Secret | 1 | |
| KFC | 4 | Village Inn | 3 | |
| Kmart | 1 | Volkswagen | 1 | |
| Kohl's | 2 | Vons | 6 | |
| Kroger | 7 | Walgreens | 5 | |
| Lane Furniture | 2 | Walmart | 3 | |
| Little Caesars Pizza | 4 | Wendy's | 5 | |
Weld County on our top lists:
- #44 on the list of "Top 101 counties with the highest carbon monoxide air pollution readings in 2012 (ppm)"
- #47 on the list of "Top 101 counties with the highest Particulate Matter (PM10) Annual air pollution readings in 2012 (µg/m3)"
- #50 on the list of "Top 101 counties with the lowest percentage of residents that visited a dentist within the past year"
- #62 on the list of "Top 101 counties with the lowest number of deaths per 1000 residents 2007-2013 (pop. 50,000+)"
- #66 on the list of "Top 101 counties with the lowest percentage of residents that smoked 100+ cigarettes in their lives"
- #71 on the list of "Top 101 counties with the highest percentage of residents that drank alcohol in the past 30 days"
- #82 on the list of "Top 101 counties with highest percentage of residents voting for 3rd party candidates in the 2012 Presidential Election (pop. 50,000+)"
- #84 on the list of "Top 101 counties with the highest number of births per 1000 residents 2007-2013"
- #84 on the list of "Top 101 counties with the highest number of births per 1000 residents 2007-2013 (pop 50,000+)"
- #97 on the list of "Top 101 counties with the largest decrease in the number of births per 1000 residents 2000-2006 to 2007-2013 (pop 50,000+)"
- #99 on the list of "Top 101 counties with the largest number of people moving in compared to moving out (pop. 50,000+)"