Williamson County, Texas (TX)
County owner-occupied free and clear houses and condos in 2010: 19,775
County owner-occupied houses and condos in 2000: 64,391
Renter-occupied apartments: 46,822 (it was 22,375 in 2000)
| % of renters here: | 26% |
| State: | 36% |
Land area: 1123 sq. mi.
Water area: 12.0 sq. mi.
Population density: 598 people per square mile (high).
Industries providing employment: Educational, health and social services (20.5%), Professional, scientific, management, administrative, and waste management services (18.5%), Retail trade (12.5%).
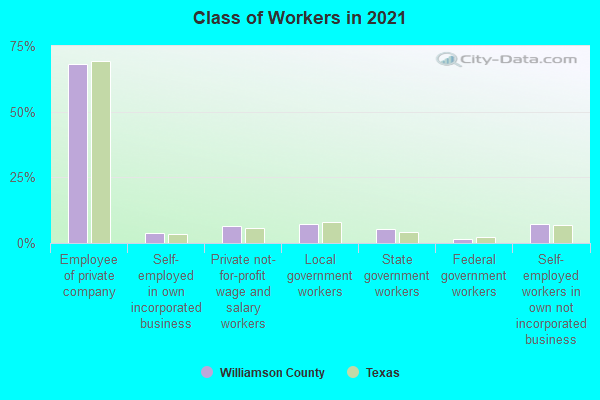
Type of workers:
- Private wage or salary: 82%
- Government: 14%
- Self-employed, not incorporated: 5%
- Unpaid family work: 0%
- OSM Map
- General Map
- Google Map
- MSN Map

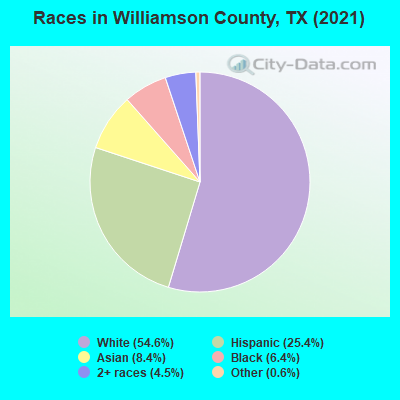
- 354,82152.8%White Non-Hispanic Alone
- 170,14225.3%Hispanic or Latino
- 65,0579.7%Asian alone
- 44,3176.6%Black Non-Hispanic Alone
- 29,3614.4%Two or more races
- 6,2950.9%Some other race alone
- 8530.1%American Indian and Alaska Native alone
- 5720.09%Native Hawaiian and Other
Pacific Islander alone
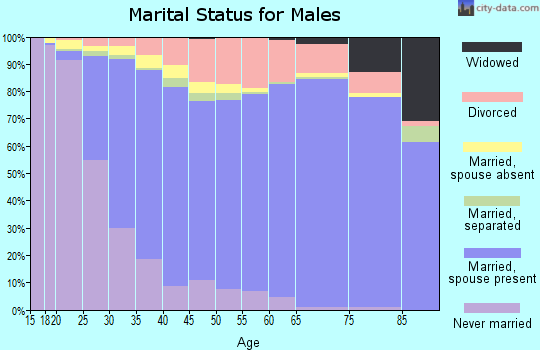
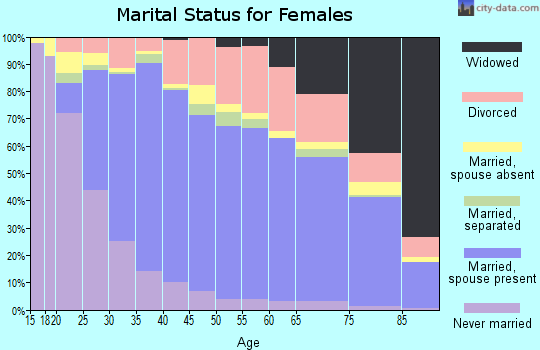
| Median resident age: | 37.2 years |
| Texas median age: | 35.6 years |
| Males: 335,139 | |
| Females: 336,279 |

 | Abbott approves law that eliminates city and county-mandated water breaks. (136 replies) |
| Towne Lake Worsening? (187 replies) |
| What’s the culture in Leander like? (73 replies) |
| Official Austin COVID-19 thread and discussion. (1120 replies) |
| l-35 Austin Proposed Expansion (43 replies) |
| North Austin hotels to be purchased to house 150 homeless (63 replies) |
| Williamson County: | 2.0 people |
| Texas: | 3 people |
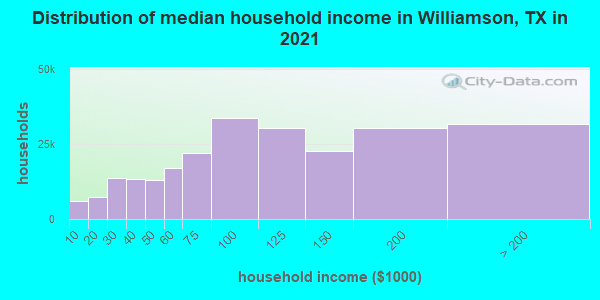
Estimated median household income in 2022: $101,323 ($60,642 in 1999)
| This county: | $101,323 |
| Texas: | $72,284 |
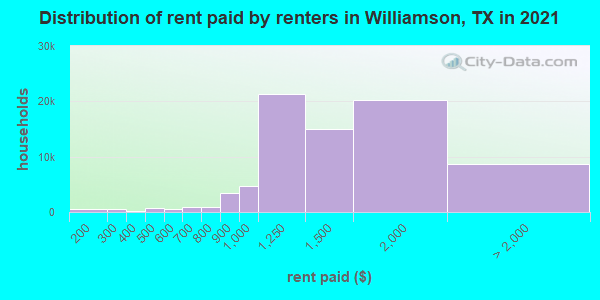
Median contract rent in 2022 for apartments: $1,585 (lower quartile is $1,262, upper quartile is $1,942)
| This county: | $1585 |
| State: | $1117 |
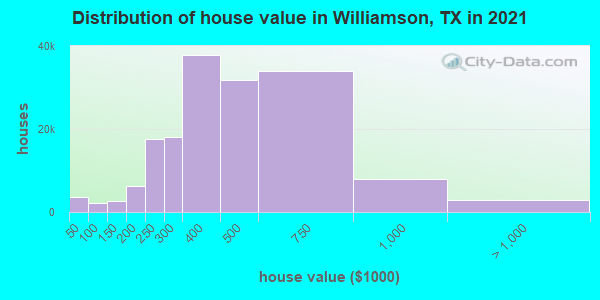
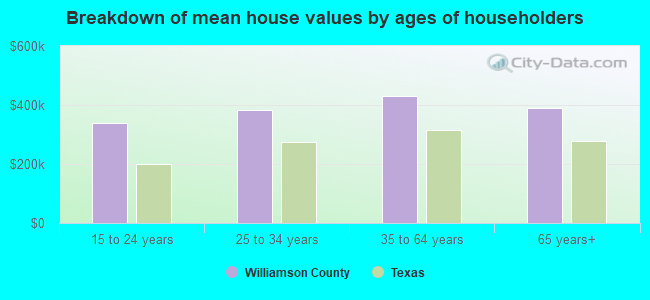
Estimated median house or condo value in 2022: $472,000 (it was $123,900 in 2000)
| Williamson: | $472,000 |
| Texas: | $275,400 |
Mean price in 2022:
Median monthly housing costs for homes and condos with a mortgage: $2,215Detached houses: $535,022
Here: $535,022 State: $369,058 Townhouses or other attached units: $355,295
Here: $355,295 State: $327,631 In 2-unit structures: $369,415
Here: $369,415 State: $374,947 In 3-to-4-unit structures: $401,392
Here: $401,392 State: $209,652 In 5-or-more-unit structures: $300,804
Here: $300,804 State: $413,944 Mobile homes: $242,377
Here: $242,377 State: $124,413 Occupied boats, RVs, vans, etc.: $74,973
Here: $74,973 State: $73,921
Median monthly housing costs for units without a mortgage: $885
Institutionalized population: 3,862
Crime in 2021 (reported by the sheriff's office or county police, not the county total):
- Murders: 0
- Rapes: 54
- Robberies: 15
- Assaults: 108
- Burglaries: 278
- Thefts: 1149
- Auto thefts: 129
Crime in 2020 (reported by the sheriff's office or county police, not the county total):
- Murders: 0
- Rapes: 43
- Robberies: 21
- Assaults: 106
- Burglaries: 319
- Thefts: 1409
- Auto thefts: 122
Health of residents in Williamson County based on CDC Behavioral Risk Factor Surveillance System Survey Questionnaires from 2013 to 2021:
General health status score of residents in this county from 1 (poor) to 5 (excellent) is 3.6. This is about average.77.3% of residents exercised in the past month. This is about average.
37.3% of residents smoked 100+ cigarettes in their lives. This is less than average.
60.5% of adult residents drank alcohol in the past 30 days. This is less than average.
68.0% of residents visited a dentist within the past year. This is about average.
Average weight of males is 194 pounds. This is about average.
Average weight of females is 159 pounds. This is about average.
Health of residents in Williamson County based on CDC Behavioral Risk Factor Surveillance System Survey Questionnaires from 2003 to 2012:
General health status score of residents in this county from 1 (poor) to 5 (excellent) is 3.7. This is better than average.78.2% of residents exercised in the past month. This is about average.
39.8% of residents smoked 100+ cigarettes in their lives. This is less than average.
99.7% of adult residents drank alcohol in the past 30 days. This is more than average.
Average weight of males is 199 pounds. This is more than average.
Average weight of females is 159 pounds. This is about average.
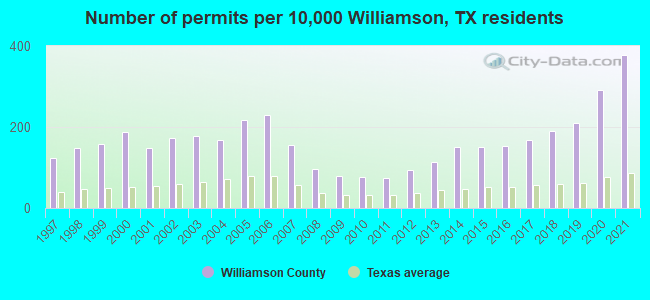
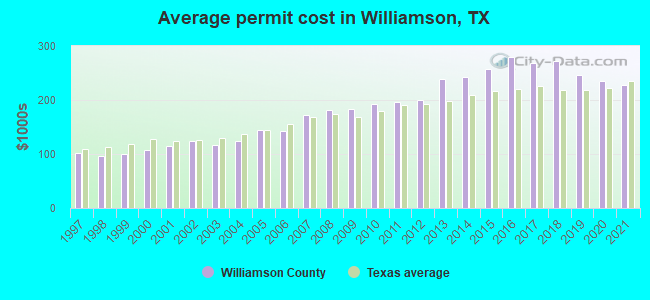
Single-family new house construction building permits:
- 2022: 6437 buildings, average cost: $262,900
- 2021: 9437 buildings, average cost: $227,600
- 2020: 7271 buildings, average cost: $234,500
- 2019: 5233 buildings, average cost: $246,600
- 2018: 4742 buildings, average cost: $273,000
- 2017: 4182 buildings, average cost: $269,200
- 2016: 3800 buildings, average cost: $279,500
- 2015: 3747 buildings, average cost: $257,900
- 2014: 3769 buildings, average cost: $241,700
- 2013: 2838 buildings, average cost: $239,200
- 2012: 2330 buildings, average cost: $200,000
- 2011: 1851 buildings, average cost: $195,700
- 2010: 1889 buildings, average cost: $191,600
- 2009: 1965 buildings, average cost: $183,700
- 2008: 2402 buildings, average cost: $180,500
- 2007: 3907 buildings, average cost: $172,900
- 2006: 5738 buildings, average cost: $142,000
- 2005: 5444 buildings, average cost: $144,400
- 2004: 4209 buildings, average cost: $125,400
- 2003: 4418 buildings, average cost: $115,700
- 2002: 4339 buildings, average cost: $125,000
- 2001: 3685 buildings, average cost: $114,800
- 2000: 4664 buildings, average cost: $107,300
- 1999: 3984 buildings, average cost: $99,600
- 1998: 3725 buildings, average cost: $97,300
- 1997: 3063 buildings, average cost: $100,700
Median real estate property taxes paid for housing units with mortgages in 2022: $7,132 (1.5%)
Median real estate property taxes paid for housing units with no mortgage in 2022: $6,097 (1.4%)
| Williamson County: | 6.6% |
| Texas: | 14.0% |
Median age of residents in 2022: 37.2 years old
(Males: 36.5 years old, Females: 38.0 years old)
(Median age for: White residents: 41.4 years old, Black residents: 34.0 years old, American Indian residents: 38.2 years old, Asian residents: 36.4 years old, Hispanic or Latino residents: 30.8 years old, Other race residents: 33.9 years old)
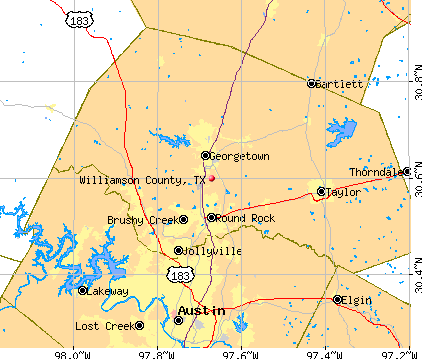
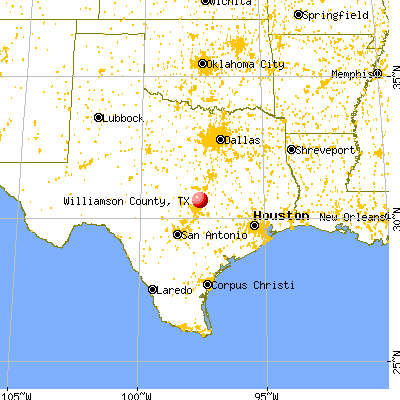
Area name: Austin-Round Rock, TX MSA
Fair market rent in 2006 for a 1-bedroom apartment in Williamson County is $658 a month.
Fair market rent for a 2-bedroom apartment is $804 a month.
Fair market rent for a 3-bedroom apartment is $1093 a month.
Cities in this county include: Round Rock, Georgetown, Cedar Park, Jollyville, Brushy Creek, Taylor, Anderson Mill, Leander, Jarrell, Serenada.
Neighboring counties: Allen Parish, Louisiana  , Calcasieu Parish, Louisiana , Early County, Georgia , Washington Parish, Louisiana , Pecos County
  .
.
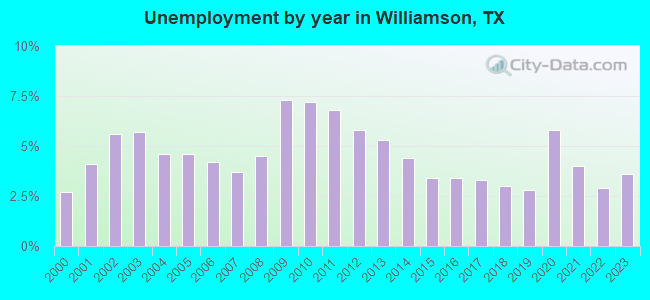
| Here: | 3.1% |
| Texas: | 3.5% |
Current college students: 11,436
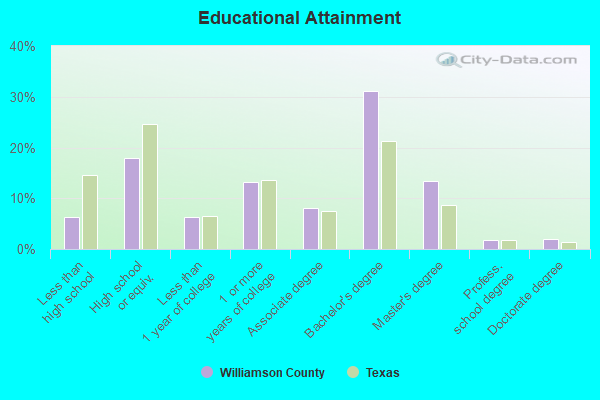
People 25 years of age or older with a high school degree or higher: 94.6%
People 25 years of age or older with a bachelor's degree or higher: 50.3%
Number of foreign born residents: 112,321 (51.9% naturalized citizens)
| Williamson County: | 16.7% |
| Whole state: | 17.2% |
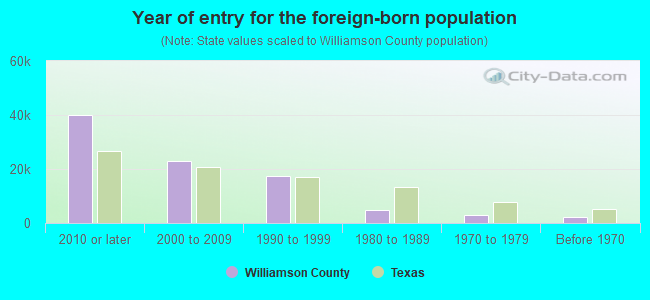
- Year of entry for the foreign-born population
- 46,9052010 or later
- 27,4902000 to 2009
- 16,2621990 to 1999
- 4,9411980 to 1989
- 3,0971970 to 1979
- 2,281Before 1970
Mean travel time to work (commute): minutes
Percentage of county residents living and working in this county: 99.6%
Housing units in structures:
- One, detached: 191,958
- One, attached: 5,902
- Two: 3,802
- 3 or 4: 5,839
- 5 to 9: 7,062
- 10 to 19: 14,823
- 20 to 49: 11,322
- 50 or more: 17,986
- Mobile homes: 6,036
- Boats, RVs, vans, etc.: 388
Housing units in Williamson County with a mortgage: 123,047 (7,727 second mortgage, 33 home equity loan, 5,997 both second mortgage and home equity loan)
Houses without a mortgage: 1,134
| Here: | 99.2% with mortgage |
| State: | 98.4% with mortgage |
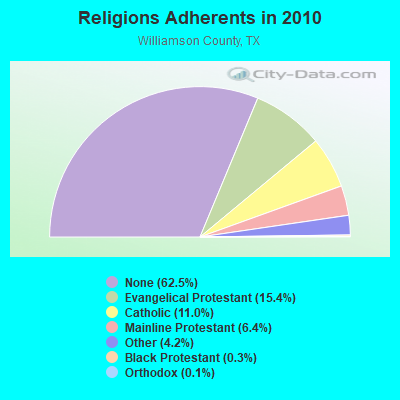
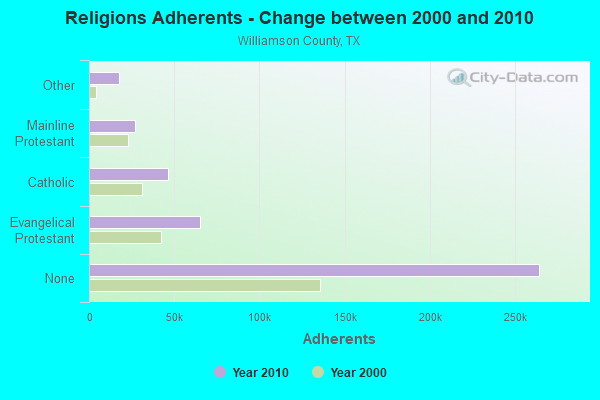
Religion statistics for Williamson County
| Religion | Adherents | Congregations |
|---|---|---|
| Evangelical Protestant | 64,975 | 193 |
| Catholic | 46,503 | 10 |
| Mainline Protestant | 27,143 | 47 |
| Other | 17,763 | 37 |
| Black Protestant | 1,452 | 8 |
| Orthodox | 576 | 5 |
| None | 264,267 | - |
Source: Clifford Grammich, Kirk Hadaway, Richard Houseal, Dale E.Jones, Alexei Krindatch, Richie Stanley and Richard H.Taylor. 2012. 2010 U.S.Religion Census: Religious Congregations & Membership Study. Association of Statisticians of American Religious Bodies. Jones, Dale E., et al. 2002. Congregations and Membership in the United States 2000. Nashville, TN: Glenmary Research Center.
Food Environment Statistics:
| Williamson County: | 0.75 / 10,000 pop. |
| State: | 1.47 / 10,000 pop. |
| Here: | 0.19 / 10,000 pop. |
| Texas: | 0.14 / 10,000 pop. |
| This county: | 0.75 / 10,000 pop. |
| Texas: | 1.11 / 10,000 pop. |
| Williamson County: | 2.98 / 10,000 pop. |
| Texas: | 3.95 / 10,000 pop. |
| This county: | 5.19 / 10,000 pop. |
| State: | 6.13 / 10,000 pop. |
| Williamson County: | 7.4% |
| Texas: | 8.9% |
| Williamson County: | 24.1% |
| State: | 26.6% |
| Here: | 12.8% |
| State: | 15.7% |
Agriculture in Williamson County:
Average size of farms: 232 acresAverage value of agricultural products sold per farm: $18,484
Average value of crops sold per acre for harvested cropland: $140.74
The value of nursery, greenhouse, floriculture, and sod as a percentage of the total market value of agricultural products sold: 5.29%
The value of livestock, poultry, and their products as a percentage of the total market value of agricultural products sold: 34.07%
Average total farm production expenses per farm: $24,209
Harvested cropland as a percentage of land in farms: 37.27%
Irrigated harvested cropland as a percentage of land in farms: 1.60%
Average market value of all machinery and equipment per farm: $36,796
The percentage of farms operated by a family or individual: 94.34%
Average age of principal farm operators: 56 years
Average number of cattle and calves per 100 acres of all land in farms: 11.57
Milk cows as a percentage of all cattle and calves: 0.57%
Corn for grain: 124507 harvested acres
All wheat for grain: 11194 harvested acres
Upland cotton: 9506 harvested acres
Vegetables: 24 harvested acres
Land in orchards: 1,433 acres
Earthquake activity:
Williamson County-area historical earthquake activity is significantly above Texas state average. It is 16% smaller than the overall U.S. average.On 10/20/2011 at 12:24:41, a magnitude 4.8 (4.8 MW, Depth: 3.1 mi, Class: Light, Intensity: IV - V) earthquake occurred 122.2 miles away from Williamson County center
On 6/16/1978 at 11:46:54, a magnitude 5.3 (4.4 MB, 4.6 UK, 5.3 ML, Class: Moderate, Intensity: VI - VII) earthquake occurred 247.7 miles away from the county center
On 4/14/1995 at 00:32:56, a magnitude 5.7 (5.6 MB, 5.7 MS, 5.7 MW, Depth: 11.1 mi) earthquake occurred 340.2 miles away from the county center
On 5/17/2012 at 08:12:00, a magnitude 4.8 (4.8 MW, Depth: 3.1 mi) earthquake occurred 215.9 miles away from the county center
On 4/9/1993 at 12:29:19, a magnitude 4.3 (4.1 MB, 4.3 LG, Depth: 3.1 mi) earthquake occurred 126.5 miles away from Williamson County center
On 5/1/2018 at 16:28:56, a magnitude 4.0 (4.0 MW, Depth: 3.1 mi) earthquake occurred 115.8 miles away from the county center
Magnitude types: regional Lg-wave magnitude (LG), body-wave magnitude (MB), local magnitude (ML), surface-wave magnitude (MS), moment magnitude (MW)
Most recent natural disasters:
- Texas Covid-19 Pandemic, Incident Period: January 20, 2020, FEMA Id: 4485, Natural disaster type: Other
- Texas Severe Storms, Tornadoes, Straight-line Winds, and Flooding, Incident Period: May 04, 2015 to June 23, 2015, Major Disaster (Presidential) Declared DR-4223: May 29, 2015, FEMA Id: 4223, Natural disaster type: Storm, Tornado, Flood, Wind
- Texas Moonglow Fire, Incident Period: September 05, 2011 to December 31, 1969, Fire Management Assistance Declared: September 06, 2011, FEMA Id: 2963, Natural disaster type: Fire
- Texas Wildfires, Incident Period: August 30, 2011 to December 31, 2011, Major Disaster (Presidential) Declared DR-4029: September 09, 2011, FEMA Id: 4029, Natural disaster type: Fire
- Texas Horseshoe Fire, Incident Period: August 15, 2011 to December 31, 1969, Fire Management Assistance Declared: August 15, 2011, FEMA Id: 2949, Natural disaster type: Fire
- Texas Grand Mesa Fire, Incident Period: June 16, 2011 to June 19, 2011, Fire Management Assistance Declared: June 16, 2011, FEMA Id: 2922, Natural disaster type: Fire
- Texas Hurricane Ike, Incident Period: September 07, 2008 to September 26, 2008, Emergency Declared EM-3294: September 10, 2008, FEMA Id: 3294, Natural disaster type: Hurricane
- Texas Florence Fire, Incident Period: August 07, 2008 to August 14, 2008, Fire Management Assistance Declared: August 07, 2008, FEMA Id: 2785, Natural disaster type: Fire
- Texas Wildfires, Incident Period: March 14, 2008 to September 01, 2008, Emergency Declared EM-3284: March 14, 2008, FEMA Id: 3284, Natural disaster type: Fire
- Texas Severe Storms, Tornadoes, and Flooding, Incident Period: June 16, 2007 to August 03, 2007, Major Disaster (Presidential) Declared DR-1709: June 29, 2007, FEMA Id: 1709, Natural disaster type: Storm, Tornado, Flood
- 9 other natural disasters have been reported since 1953.
The number of natural disasters in Williamson County (19) is greater than the US average (15).
Major Disasters (Presidential) Declared: 7
Emergencies Declared: 7
Causes of natural disasters: Fires: 8, Storms: 5, Floods: 4, Hurricanes: 4, Tornadoes: 3, Wind: 1, Other: 2 (Note: some incidents may be assigned to more than one category).
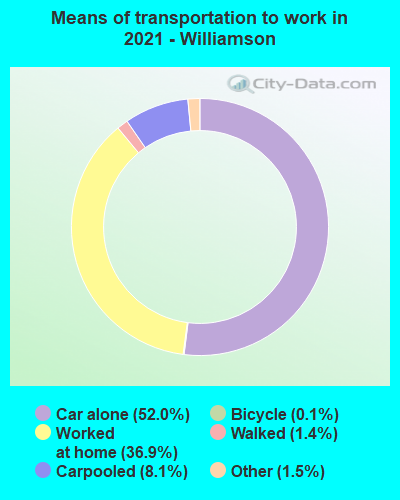
Means of transportation to work:
- Drove a car alone: 175,439 (58.3%)
- Carpooled: 19,133 (6.4%)
- Bus: 324 (0.1%)
- Long-distance train or commuter rail: 80 (0.0%)
- Ferryboat: 46 (0.0%)
- Taxicab, motorcycle, or other means: 4,893 (1.6%)
- Bicycle: 409 (0.1%)
- Walked: 3,828 (1.3%)
- Worked at home: 96,757 (32.2%)
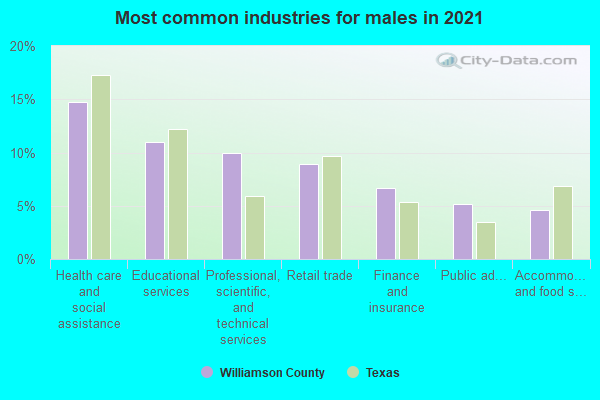
- Health care and social assistance (17%)
- Educational services (12%)
- Retail trade (10%)
- Professional, scientific, and technical services (10%)
- Finance and insurance (6%)
- Accommodation and food services (5%)
- Public administration (5%)
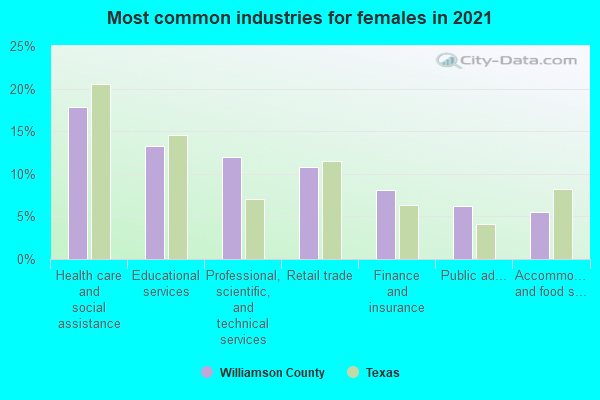
- Health care and social assistance (19%)
- Educational services (14%)
- Retail trade (12%)
- Professional, scientific, and technical services (12%)
- Finance and insurance (7%)
- Accommodation and food services (6%)
- Public administration (5%)
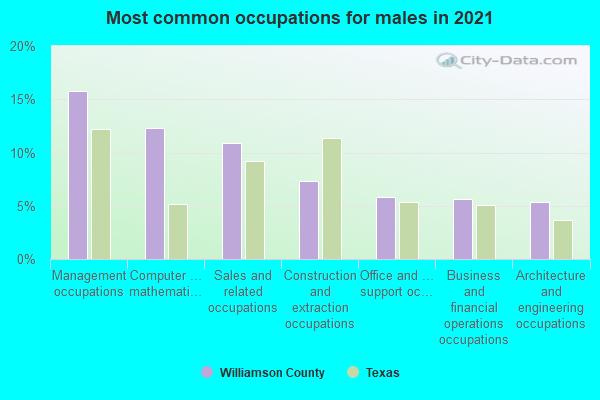
- Management occupations (15%)
- Computer and mathematical occupations (14%)
- Sales and related occupations (11%)
- Business and financial operations occupations (8%)
- Construction and extraction occupations (6%)
- Office and administrative support occupations (6%)
- Architecture and engineering occupations (5%)
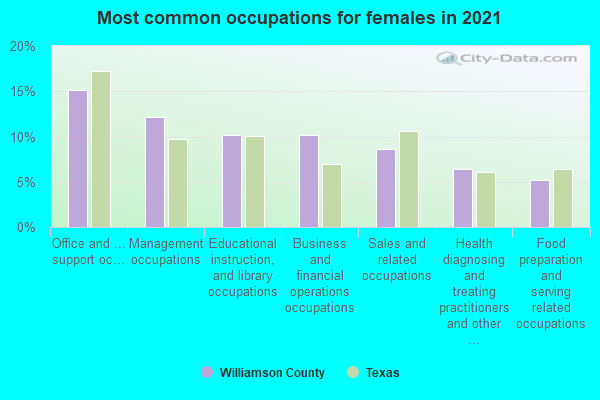
- Office and administrative support occupations (17%)
- Management occupations (13%)
- Educational instruction, and library occupations (11%)
- Sales and related occupations (11%)
- Business and financial operations occupations (10%)
- Health diagnosing and treating practitioners and other technical occupations (6%)
- Food preparation and serving related occupations (4%)
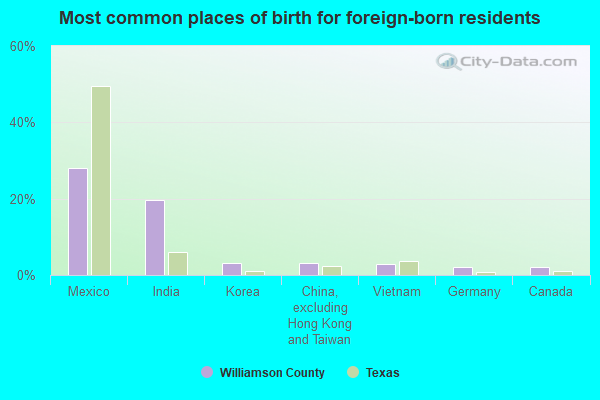
- Mexico (26%)
- India (21%)
- Korea (4%)
- China, excluding Hong Kong and Taiwan (3%)
- Vietnam (3%)
- Philippines (2%)
- Venezuela (2%)
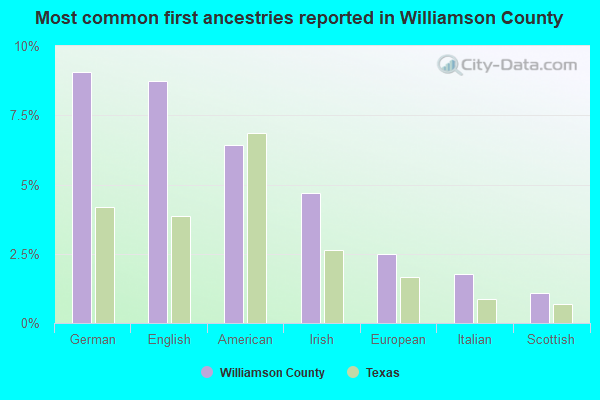
- German (9%)
- English (9%)
- American (6%)
- Irish (4%)
- European (3%)
- Italian (2%)
- Scottish (1%)
People in group quarters in Williamson County, Texas in 2010:
- 1,061 people in state prisons
- 1,047 people in local jails and other municipal confinement facilities
- 1,006 people in college/university student housing
- 809 people in nursing facilities/skilled-nursing facilities
- 491 people in federal detention centers
- 181 people in group homes intended for adults
- 175 people in residential treatment centers for juveniles (non-correctional)
- 100 people in correctional residential facilities
- 79 people in in-patient hospice facilities
- 50 people in group homes for juveniles (non-correctional)
- 50 people in correctional facilities intended for juveniles
- 30 people in workers' group living quarters and job corps centers
- 13 people in residential treatment centers for adults
- 5 people in other noninstitutional facilities
People in group quarters in Williamson County, Texas in 2000:
- 1,427 people in nursing homes
- 983 people in state prisons
- 966 people in college dormitories (includes college quarters off campus)
- 495 people in local jails and other confinement facilities (including police lockups)
- 383 people in federal prisons and detention centers
- 204 people in other group homes
- 141 people in homes for the mentally retarded
- 126 people in other noninstitutional group quarters
- 75 people in other types of correctional institutions
- 47 people in residential treatment centers for emotionally disturbed children
- 33 people in mental (psychiatric) hospitals or wards
- 24 people in short-term care, detention or diagnostic centers for delinquent children
- 11 people in homes or halfway houses for drug/alcohol abuse
- 9 people in religious group quarters
- 2 people in other nonhousehold living situations
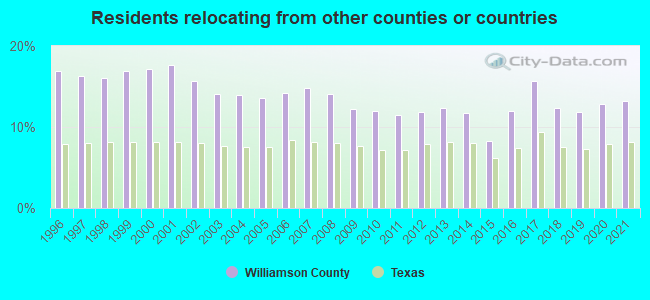
13.25% of this county's 2021 resident taxpayers lived in other counties in 2020 ($88,670 average adjusted gross income)
| Here: | 13.25% |
| Texas average: | 8.12% |
0.03% of residents moved from foreign countries ($181 average AGI)
Williamson County: 0.03% Texas average: 0.04%
8.47% relocated from other counties in Texas ($48,934 average AGI)
4.74% relocated from other states ($39,555 average AGI)
Williamson County: 4.74% Texas average: 2.83%
Top counties from which taxpayers relocated into this county between 2020 and 2021:
| from Travis County, TX | |
| from Bell County, TX | |
| from Harris County, TX | |
| from Santa Clara County, CA | |
| from Bexar County, TX | |
| from Los Angeles County, CA | |
| from Hays County, TX |
9.55% of this county's 2020 resident taxpayers moved to other counties in 2021 ($74,918 average adjusted gross income)
| Here: | 9.55% |
| Texas average: | 7.40% |
0.02% of residents moved to foreign countries ($98 average AGI)
Williamson County: 0.02% Texas average: 0.03%
7.05% relocated to other counties in Texas ($54,447 average AGI)
2.48% relocated to other states ($20,372 average AGI)
Williamson County: 2.48% Texas average: 2.08%

Top counties to which taxpayers relocated from this county between 2020 and 2021:
| to Travis County, TX | |
| to Bell County, TX | |
| to Harris County, TX | |
| to Bexar County, TX | |
| to Hays County, TX | |
| to Burnet County, TX | |
| to Bastrop County, TX |
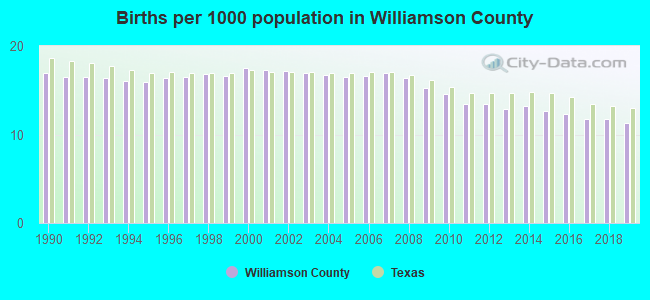
Births per 1000 population from 1990 to 1999: 16.5
Births per 1000 population from 2000 to 2009: 16.7
Births per 1000 population from 2010 to 2022: 10.7
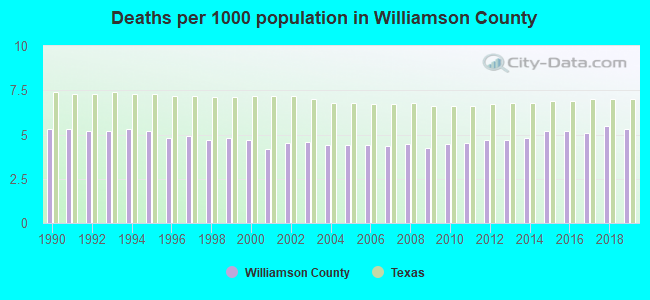
Deaths per 1000 population from 1990 to 1999: 5.1
Deaths per 1000 population from 2000 to 2009: 4.4
Deaths per 1000 population from 2010 to 2020: 5.0
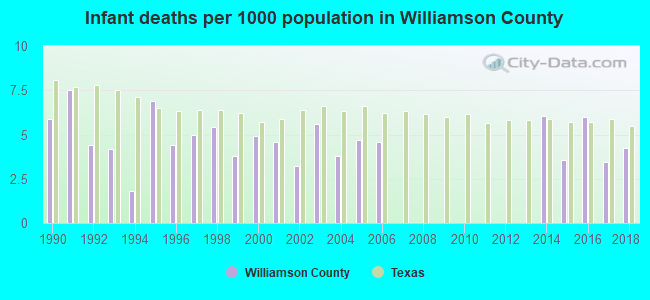
Infant deaths per 1000 live births from 1990 to 1999: 4.9
Infant deaths per 1000 live births from 2000 to 2009: 3.1
Infant deaths per 1000 live births from 2010 to 2021: 2.7
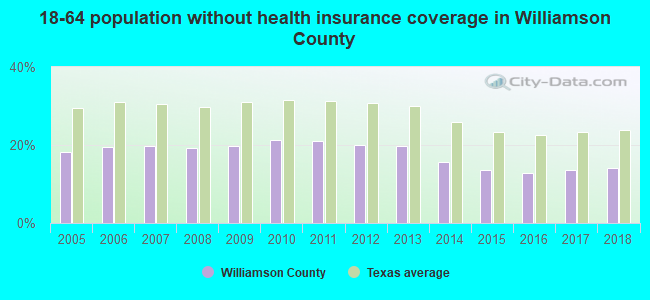
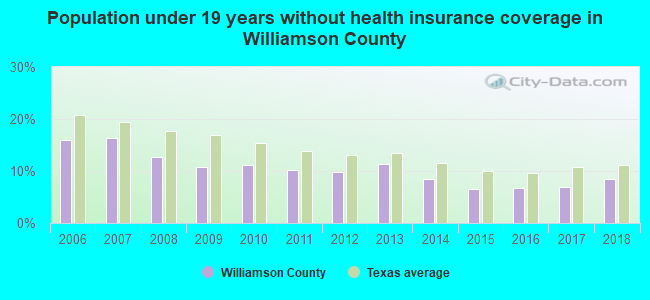
Persons under 19 years old without health insurance coverage in 2018: 8.4%

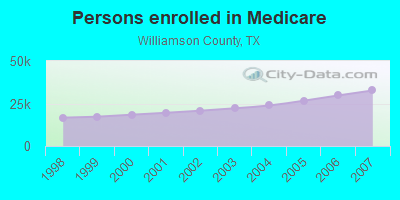
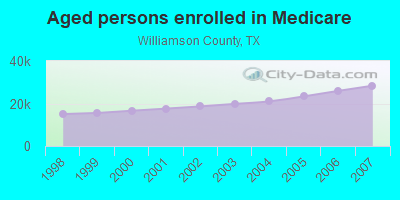
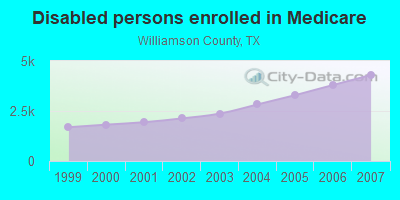
Persons enrolled in hospital insurance and/or supplemental medical insurance (Medicare) in July 1, 2007: 32,682 (28,381 aged, 4,301 disabled)
Children under 18 without health insurance coverage in 2007: 18,589 (16%)
Most common underlying causes of death in Williamson County, Texas in 1999 - 2019:
- Bronchus or lung, unspecified - Malignant neoplasms (2,274)
- Acute myocardial infarction, unspecified (2,154)
- Alzheimer disease, unspecified (1,906)
- Unspecified dementia (1,617)
- Atherosclerotic heart disease (1,613)
- Chronic obstructive pulmonary disease, unspecified (1,572)
- Stroke, not specified as haemorrhage or infarction (986)
- Atherosclerotic cardiovascular disease, so described (931)
- Congestive heart failure (810)
- Breast, unspecified - Malignant neoplasms (768)
Population without health insurance coverage in 2000: 12%
Children under 18 without health insurance coverage in 2000: 13%
Short term general hospital admissions per 100,000 population in 2004: 3,846
Short term general hospital beds per 100,000 population in 2004: 83
Emergency room visits per 100,000 population in 2004: 27,369
General practice office based MDs per 100,000 population in 2005: 1,689
Medical specialist MDs per 100,000 population in 2005: 427
Dentists per 100,000 population in 1998: 9
Total births per 100,000 population, July 2005 - July 2006 : 21
Total deaths per 100,000 population, July 2005 - July 2006: 77
Limited-service eating places per 100,000 population in 2005 : 13
Homicides per 1,000,000 population from 2000 to 2006: 13.2. This is less than state average.
Suicides per 1,000,000 population from 2000 to 2006: 73.2. This is less than state average.
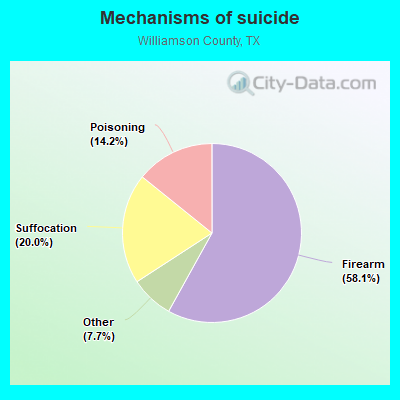
- Firearm - 42.5
- Suffocation - 14.6
- Poisoning - 10.4
- Other - 5.7
Household type by relationship:
Households: 671,418- Male householders: 136,051 (25,510 living alone), Female householders: 122,044 (35,888 living alone)
144,333 spouses (142,855 opposite-sex spouses), 16,971 unmarried partners, (15,864 opposite-sex unmarried partners), 201,560 children (188,933 natural, 4,318 adopted, 8,309 stepchildren), 5,804 grandchildren, 5,621 brothers or sisters, 10,674 parents, 63 foster children, 7,101 other relatives, 16,221 non-relatives
- In group quarters: 4,975
Size of family households: 73,987 2-persons, 41,669 3-persons, 40,669 4-persons, 15,217 5-persons, 5,832 6-persons, 1,779 7-or-more-persons.
Size of nonfamily households: 61,398 1-person, 15,377 2-persons, 1,838 3-persons, 205 4-persons, 124 5-persons.
124,465 married couples with children.
28,244 single-parent households (7,049 men, 21,195 women).
73.2% of residents of Williamson speak English at home.
14.9% of residents speak Spanish at home (71% speak English very well, 17% speak English well, 7% speak English not well, 5% don't speak English at all).
4.5% of residents speak other Indo-European language at home (78% speak English very well, 16% speak English well, 6% speak English not well, 1% don't speak English at all).
5.7% of residents speak Asian or Pacific Island language at home (71% speak English very well, 18% speak English well, 11% speak English not well).
1.8% of residents speak other language at home (65% speak English very well, 22% speak English well, 14% speak English not well).
In fiscal year 2004:
Federal Government expenditure: $1,405,961,000 ($4,422 per capita)
Department of Defense expenditure: $621,928,000
Federal direct payments to individuals for retirement and disability: $451,380,000
Federal other direct payments to individuals: $105,081,000
Federal direct payments not to individuals: $10,010,000
Federal grants: $110,617,000
Federal procurement contracts: $699,450,000 ($538,566,000 Department of Defense)
Federal salaries and wages: $29,423,000 ($1,602,000 Department of Defense)
Federal Government direct loans: $3,374,000
Federal guaranteed/insured loans: $554,749,000
Federal Government insurance: $171,252,000
Population change from April 1, 2000 to July 1, 2005:
Births: 25,795| Here: | 77 per 1000 residents |
| State: | 85 per 1000 residents |
Deaths: 6,840
| Here: | 21 per 1000 residents |
| State: | 35 per 1000 residents |
Net international migration: +3,927
| Here: | +12 per 1000 residents |
| State: | +29 per 1000 residents |
Net internal migration: +61,219
| Here: | +184 per 1000 residents |
| State: | +10 per 1000 residents |
Total withdrawal of fresh water for public supply: 30.24 millions of gallons per day (50% from ground, 50% from surface)
| Here: | 6.5 |
| State: | 6.3 |
| Here: | 4.0 |
| State: | 4.0 |
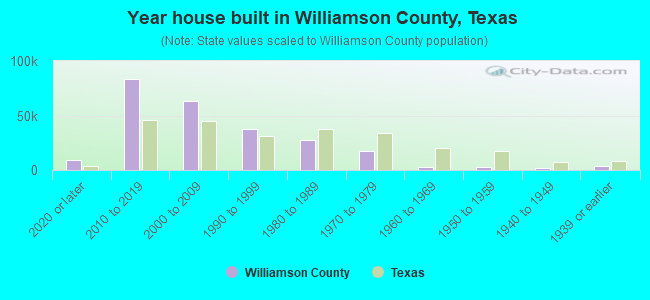
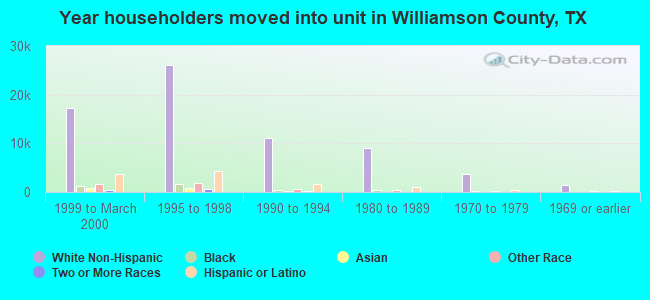
- Year house built in Williamson County, Texas
- 24,3752020 or later
- 82,2742010 to 2019
- 72,1542000 to 2009
- 34,0611990 to 1999
- 28,1111980 to 1989
- 16,0551970 to 1979
- 2,3631960 to 1969
- 1,7291950 to 1959
- 1,1011940 to 1949
- 2,8951939 or earlier
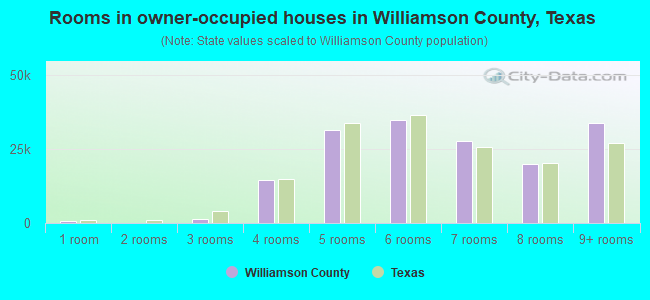
- Rooms in owner-occupied houses in Williamson County, Texas
- 3271 room
- 5052 rooms
- 2,2393 rooms
- 13,0194 rooms
- 31,1265 rooms
- 38,7936 rooms
- 29,3337 rooms
- 22,1728 rooms
- 33,8399+ rooms
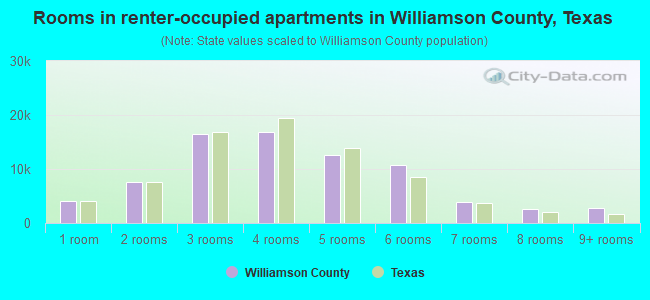
- Rooms in renter-occupied apartments in Williamson County, Texas
- 6,1241 room
- 12,3232 rooms
- 16,2973 rooms
- 16,8714 rooms
- 12,7755 rooms
- 10,5956 rooms
- 6,2767 rooms
- 3,0408 rooms
- 2,4419+ rooms
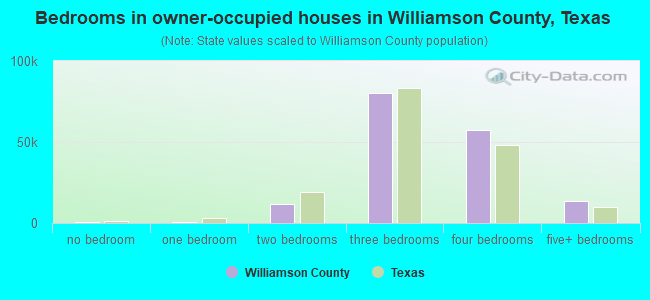
- Bedrooms in owner-occupied houses in Williamson County, Texas
- 374no bedroom
- 1,1701 bedroom
- 15,9342 bedrooms
- 75,7443 bedrooms
- 66,4154 bedrooms
- 11,7165+ bedrooms
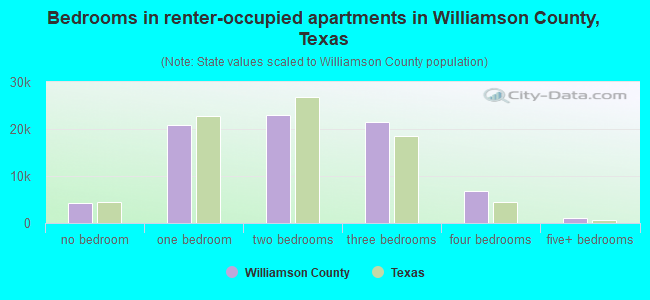
- Bedrooms in renter-occupied apartments in Williamson County, Texas
- 6,275no bedroom
- 25,7331 bedroom
- 22,1382 bedrooms
- 20,0273 bedrooms
- 11,7154 bedrooms
- 8545+ bedrooms
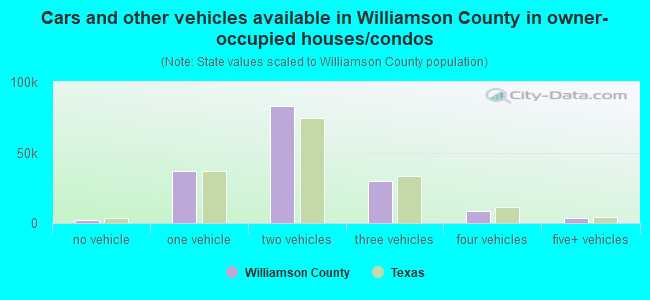
- Cars and other vehicles available in Williamson County in owner-occupied houses/condos
- 2,040no vehicle
- 43,0371 vehicle
- 83,8262 vehicles
- 30,8683 vehicles
- 8,8344 vehicles
- 2,7485+ vehicles
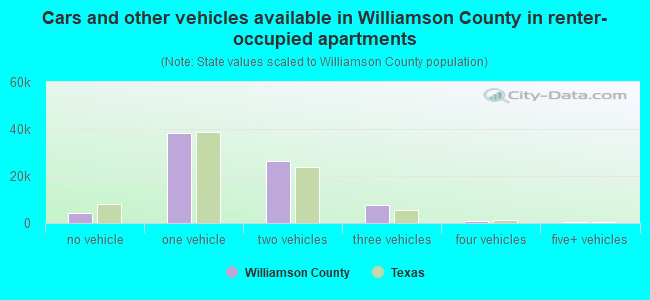
- Cars and other vehicles available in Williamson County in renter-occupied apartments
- 6,331no vehicle
- 41,0061 vehicle
- 28,2992 vehicles
- 9,1183 vehicles
- 1,5234 vehicles
- 4655+ vehicles
83.2% of Williamson County residents lived in the same house 1 years ago.
Out of people who lived in different houses, 27% lived in this county.
Out of people who lived in different counties, 53% lived in Texas.
| Williamson County: | 83.2% |
| State average: | 85.7% |
Place of birth for U.S.-born residents:
- This state: 317,037
- Other state: 225,580
- Northeast: 37,976
- Midwest: 64,280
- South: 53,020
- West: 70,304
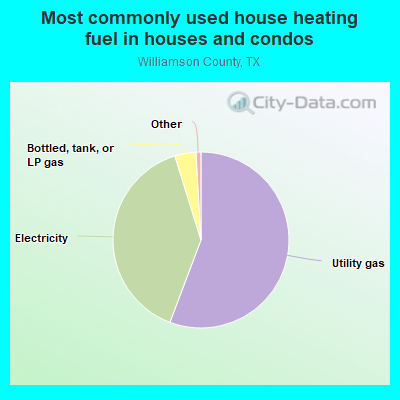
- 56.4%Utility gas
- 38.5%Electricity
- 4.3%Bottled, tank, or LP gas
- 0.3%Solar energy
- 0.2%No fuel used
- 0.2%Other fuel
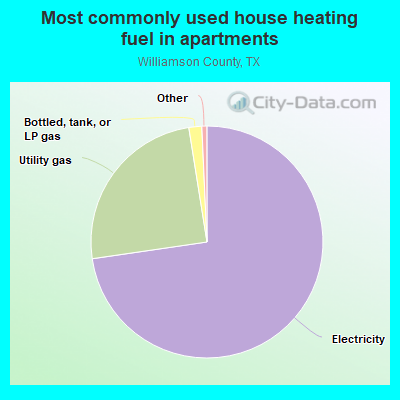
- 70.9%Electricity
- 26.8%Utility gas
- 1.3%Bottled, tank, or LP gas
- 0.7%No fuel used
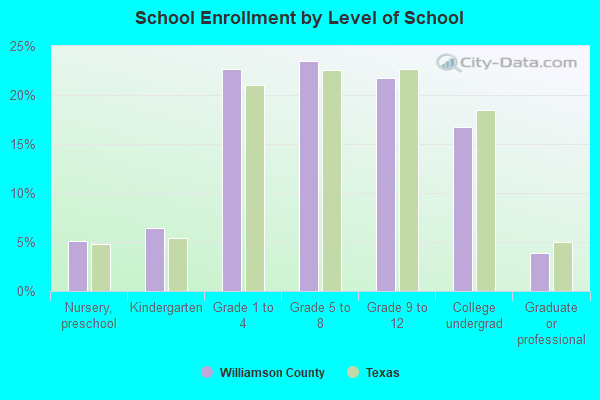
Private vs. public school enrollment:
| Here: | 7.9% |
| Texas: | 8.8% |
| Here: | 5.3% |
| Texas: | 8.0% |
| Here: | 16.0% |
| Texas: | 16.2% |
Williamson County government finances - Expenditure in 2018:
- Charges - Other: $35,116,000
Other: $32,330,000
Regular Highways: $1,691,000
Regular Highways: $728,000
Parks and Recreation: $503,000
Parks and Recreation: $408,000
- Construction - Regular Highways: $26,027,000
Regular Highways: $21,322,000
General Public Buildings: $14,687,000
General Public Buildings: $9,683,000
Parks and Recreation: $6,866,000
Judicial and Legal Services: $5,048,000
Health - Other: $3,811,000
Parks and Recreation: $1,937,000
General - Other: $1,352,000
Correctional Institutions: $1,183,000
Police Protection: $978,000
Miscellaneous Commercial Activities - Other: $863,000
- Current Operations - Regular Highways: $54,416,000
Regular Highways: $49,589,000
Correctional Institutions: $35,257,000
Police Protection: $33,031,000
Correctional Institutions: $31,551,000
Police Protection: $30,479,000
General - Other: $30,081,000
Judicial and Legal Services: $28,325,000
Health - Other: $27,901,000
Health - Other: $26,172,000
Public Welfare, Vendor Payments for Medical Care: $26,123,000
Judicial and Legal Services: $24,309,000
General - Other: $22,832,000
Public Welfare, Vendor Payments for Medical Care: $9,524,000
General Public Buildings: $8,750,000
Financial Administration: $8,322,000
Financial Administration: $7,516,000
General Public Buildings: $7,081,000
Central Staff Services: $5,982,000
Central Staff Services: $5,102,000
Parks and Recreation: $3,946,000
Parks and Recreation: $3,263,000
Public Welfare - Other: $2,781,000
Public Welfare - Other: $1,900,000
Natural Resources - Other: $860,000
Natural Resources - Other: $691,000
Miscellaneous Commercial Activities - Other: $393,000
Miscellaneous Commercial Activities - Other: $258,000
Corrections - Other: $248,000
Corrections - Other: $238,000
Libraries: $202,000
Libraries: $153,000
- Federal Intergovernmental - Other: $1,781,000
Other: $954,000
General Local Government Support: $74,000
General Local Government Support: $73,000
- General - Interest on Debt: $35,946,000
Interest on Debt: $34,940,000
- Local Intergovernmental - Other: $940,000
Other: $737,000
General Local Government Support: $181,000
General Local Government Support: $63,000
- Long Term Debt - Beginning Outstanding - Unspecified Public Purpose: $945,655,000
Beginning Outstanding - Unspecified Public Purpose: $898,425,000
Outstanding Unspecified Public Purpose: $893,870,000
Outstanding Unspecified Public Purpose: $822,605,000
Retired Unspecified Public Purpose: $103,535,000
Retired Unspecified Public Purpose: $81,715,000
Issue, Unspecified Public Purpose: $51,750,000
Issue, Unspecified Public Purpose: $5,895,000
- Miscellaneous - Interest Earnings: $14,043,000
General Revenue - Other: $7,970,000
General Revenue - Other: $5,225,000
Interest Earnings: $4,675,000
Fines and Forfeits: $3,515,000
Fines and Forfeits: $3,269,000
Sale of Property: $571,000
Sale of Property: $456,000
- Other Capital Outlay - Regular Highways: $9,386,000
Regular Highways: $8,248,000
Central Staff Services: $4,977,000
Police Protection: $3,572,000
Police Protection: $2,305,000
Health - Other: $2,276,000
Central Staff Services: $2,011,000
Health - Other: $1,321,000
Judicial and Legal Services: $1,069,000
General Public Building: $308,000
Correctional Institutions: $281,000
Parks and Recreation: $238,000
Judicial and Legal Services: $167,000
Parks and Recreation: $157,000
General Public Building: $95,000
Miscellaneous Commercial Activities - Other: $73,000
General - Other: $69,000
Natural Resources - Other: $30,000
Natural Resources - Other: $30,000
Correctional Institutions: $6,000
Financial Administration: $5,000
Financial Administration: $4,000
- Other Funds - Cash and Securities: $412,451,000
Cash and Securities: $405,173,000
- State Intergovernmental - Other: $5,053,000
General Local Government Support: $4,799,000
Other: $4,682,000
General Local Government Support: $3,782,000
Highways: $528,000
Health and Hospitals: $413,000
Highways: $326,000
Health and Hospitals: $224,000
Public Welfare: $137,000
Public Welfare: $97,000
- Tax - Property: $308,034,000
Property: $250,149,000
Other Selective Sales: $13,747,000
Motor Vehicle License: $5,412,000
Motor Vehicle License: $4,850,000
Williamson County government finances - Revenue in 2018:
- Charges - Other: $35,116,000
Other: $32,330,000
Regular Highways: $1,691,000
Regular Highways: $728,000
Parks and Recreation: $503,000
Parks and Recreation: $408,000
- Construction - Regular Highways: $26,027,000
Regular Highways: $21,322,000
General Public Buildings: $14,687,000
General Public Buildings: $9,683,000
Parks and Recreation: $6,866,000
Judicial and Legal Services: $5,048,000
Health - Other: $3,811,000
Parks and Recreation: $1,937,000
General - Other: $1,352,000
Correctional Institutions: $1,183,000
Police Protection: $978,000
Miscellaneous Commercial Activities - Other: $863,000
- Current Operations - Regular Highways: $54,416,000
Regular Highways: $49,589,000
Correctional Institutions: $35,257,000
Police Protection: $33,031,000
Correctional Institutions: $31,551,000
Police Protection: $30,479,000
General - Other: $30,081,000
Judicial and Legal Services: $28,325,000
Health - Other: $27,901,000
Health - Other: $26,172,000
Public Welfare, Vendor Payments for Medical Care: $26,123,000
Judicial and Legal Services: $24,309,000
General - Other: $22,832,000
Public Welfare, Vendor Payments for Medical Care: $9,524,000
General Public Buildings: $8,750,000
Financial Administration: $8,322,000
Financial Administration: $7,516,000
General Public Buildings: $7,081,000
Central Staff Services: $5,982,000
Central Staff Services: $5,102,000
Parks and Recreation: $3,946,000
Parks and Recreation: $3,263,000
Public Welfare - Other: $2,781,000
Public Welfare - Other: $1,900,000
Natural Resources - Other: $860,000
Natural Resources - Other: $691,000
Miscellaneous Commercial Activities - Other: $393,000
Miscellaneous Commercial Activities - Other: $258,000
Corrections - Other: $248,000
Corrections - Other: $238,000
Libraries: $202,000
Libraries: $153,000
- Federal Intergovernmental - Other: $1,781,000
Other: $954,000
General Local Government Support: $74,000
General Local Government Support: $73,000
- General - Interest on Debt: $35,946,000
Interest on Debt: $34,940,000
- Local Intergovernmental - Other: $940,000
Other: $737,000
General Local Government Support: $181,000
General Local Government Support: $63,000
- Long Term Debt - Beginning Outstanding - Unspecified Public Purpose: $945,655,000
Beginning Outstanding - Unspecified Public Purpose: $898,425,000
Outstanding Unspecified Public Purpose: $893,870,000
Outstanding Unspecified Public Purpose: $822,605,000
Retired Unspecified Public Purpose: $103,535,000
Retired Unspecified Public Purpose: $81,715,000
Issue, Unspecified Public Purpose: $51,750,000
Issue, Unspecified Public Purpose: $5,895,000
- Miscellaneous - Interest Earnings: $14,043,000
General Revenue - Other: $7,970,000
General Revenue - Other: $5,225,000
Interest Earnings: $4,675,000
Fines and Forfeits: $3,515,000
Fines and Forfeits: $3,269,000
Sale of Property: $571,000
Sale of Property: $456,000
- Other Capital Outlay - Regular Highways: $9,386,000
Regular Highways: $8,248,000
Central Staff Services: $4,977,000
Police Protection: $3,572,000
Police Protection: $2,305,000
Health - Other: $2,276,000
Central Staff Services: $2,011,000
Health - Other: $1,321,000
Judicial and Legal Services: $1,069,000
General Public Building: $308,000
Correctional Institutions: $281,000
Parks and Recreation: $238,000
Judicial and Legal Services: $167,000
Parks and Recreation: $157,000
General Public Building: $95,000
Miscellaneous Commercial Activities - Other: $73,000
General - Other: $69,000
Natural Resources - Other: $30,000
Natural Resources - Other: $30,000
Correctional Institutions: $6,000
Financial Administration: $5,000
Financial Administration: $4,000
- Other Funds - Cash and Securities: $412,451,000
Cash and Securities: $405,173,000
- State Intergovernmental - Other: $5,053,000
General Local Government Support: $4,799,000
Other: $4,682,000
General Local Government Support: $3,782,000
Highways: $528,000
Health and Hospitals: $413,000
Highways: $326,000
Health and Hospitals: $224,000
Public Welfare: $137,000
Public Welfare: $97,000
- Tax - Property: $308,034,000
Property: $250,149,000
Other Selective Sales: $13,747,000
Motor Vehicle License: $5,412,000
Motor Vehicle License: $4,850,000
Williamson County government finances - Debt in 2018:
- Charges - Other: $35,116,000
Other: $32,330,000
Regular Highways: $1,691,000
Regular Highways: $728,000
Parks and Recreation: $503,000
Parks and Recreation: $408,000
- Construction - Regular Highways: $26,027,000
Regular Highways: $21,322,000
General Public Buildings: $14,687,000
General Public Buildings: $9,683,000
Parks and Recreation: $6,866,000
Judicial and Legal Services: $5,048,000
Health - Other: $3,811,000
Parks and Recreation: $1,937,000
General - Other: $1,352,000
Correctional Institutions: $1,183,000
Police Protection: $978,000
Miscellaneous Commercial Activities - Other: $863,000
- Current Operations - Regular Highways: $54,416,000
Regular Highways: $49,589,000
Correctional Institutions: $35,257,000
Police Protection: $33,031,000
Correctional Institutions: $31,551,000
Police Protection: $30,479,000
General - Other: $30,081,000
Judicial and Legal Services: $28,325,000
Health - Other: $27,901,000
Health - Other: $26,172,000
Public Welfare, Vendor Payments for Medical Care: $26,123,000
Judicial and Legal Services: $24,309,000
General - Other: $22,832,000
Public Welfare, Vendor Payments for Medical Care: $9,524,000
General Public Buildings: $8,750,000
Financial Administration: $8,322,000
Financial Administration: $7,516,000
General Public Buildings: $7,081,000
Central Staff Services: $5,982,000
Central Staff Services: $5,102,000
Parks and Recreation: $3,946,000
Parks and Recreation: $3,263,000
Public Welfare - Other: $2,781,000
Public Welfare - Other: $1,900,000
Natural Resources - Other: $860,000
Natural Resources - Other: $691,000
Miscellaneous Commercial Activities - Other: $393,000
Miscellaneous Commercial Activities - Other: $258,000
Corrections - Other: $248,000
Corrections - Other: $238,000
Libraries: $202,000
Libraries: $153,000
- Federal Intergovernmental - Other: $1,781,000
Other: $954,000
General Local Government Support: $74,000
General Local Government Support: $73,000
- General - Interest on Debt: $35,946,000
Interest on Debt: $34,940,000
- Local Intergovernmental - Other: $940,000
Other: $737,000
General Local Government Support: $181,000
General Local Government Support: $63,000
- Long Term Debt - Beginning Outstanding - Unspecified Public Purpose: $945,655,000
Beginning Outstanding - Unspecified Public Purpose: $898,425,000
Outstanding Unspecified Public Purpose: $893,870,000
Outstanding Unspecified Public Purpose: $822,605,000
Retired Unspecified Public Purpose: $103,535,000
Retired Unspecified Public Purpose: $81,715,000
Issue, Unspecified Public Purpose: $51,750,000
Issue, Unspecified Public Purpose: $5,895,000
- Miscellaneous - Interest Earnings: $14,043,000
General Revenue - Other: $7,970,000
General Revenue - Other: $5,225,000
Interest Earnings: $4,675,000
Fines and Forfeits: $3,515,000
Fines and Forfeits: $3,269,000
Sale of Property: $571,000
Sale of Property: $456,000
- Other Capital Outlay - Regular Highways: $9,386,000
Regular Highways: $8,248,000
Central Staff Services: $4,977,000
Police Protection: $3,572,000
Police Protection: $2,305,000
Health - Other: $2,276,000
Central Staff Services: $2,011,000
Health - Other: $1,321,000
Judicial and Legal Services: $1,069,000
General Public Building: $308,000
Correctional Institutions: $281,000
Parks and Recreation: $238,000
Judicial and Legal Services: $167,000
Parks and Recreation: $157,000
General Public Building: $95,000
Miscellaneous Commercial Activities - Other: $73,000
General - Other: $69,000
Natural Resources - Other: $30,000
Natural Resources - Other: $30,000
Correctional Institutions: $6,000
Financial Administration: $5,000
Financial Administration: $4,000
- Other Funds - Cash and Securities: $412,451,000
Cash and Securities: $405,173,000
- State Intergovernmental - Other: $5,053,000
General Local Government Support: $4,799,000
Other: $4,682,000
General Local Government Support: $3,782,000
Highways: $528,000
Health and Hospitals: $413,000
Highways: $326,000
Health and Hospitals: $224,000
Public Welfare: $137,000
Public Welfare: $97,000
- Tax - Property: $308,034,000
Property: $250,149,000
Other Selective Sales: $13,747,000
Motor Vehicle License: $5,412,000
Motor Vehicle License: $4,850,000
Williamson County government finances - Cash and Securities in 2018:
- Charges - Other: $35,116,000
Other: $32,330,000
Regular Highways: $1,691,000
Regular Highways: $728,000
Parks and Recreation: $503,000
Parks and Recreation: $408,000
- Construction - Regular Highways: $26,027,000
Regular Highways: $21,322,000
General Public Buildings: $14,687,000
General Public Buildings: $9,683,000
Parks and Recreation: $6,866,000
Judicial and Legal Services: $5,048,000
Health - Other: $3,811,000
Parks and Recreation: $1,937,000
General - Other: $1,352,000
Correctional Institutions: $1,183,000
Police Protection: $978,000
Miscellaneous Commercial Activities - Other: $863,000
- Current Operations - Regular Highways: $54,416,000
Regular Highways: $49,589,000
Correctional Institutions: $35,257,000
Police Protection: $33,031,000
Correctional Institutions: $31,551,000
Police Protection: $30,479,000
General - Other: $30,081,000
Judicial and Legal Services: $28,325,000
Health - Other: $27,901,000
Health - Other: $26,172,000
Public Welfare, Vendor Payments for Medical Care: $26,123,000
Judicial and Legal Services: $24,309,000
General - Other: $22,832,000
Public Welfare, Vendor Payments for Medical Care: $9,524,000
General Public Buildings: $8,750,000
Financial Administration: $8,322,000
Financial Administration: $7,516,000
General Public Buildings: $7,081,000
Central Staff Services: $5,982,000
Central Staff Services: $5,102,000
Parks and Recreation: $3,946,000
Parks and Recreation: $3,263,000
Public Welfare - Other: $2,781,000
Public Welfare - Other: $1,900,000
Natural Resources - Other: $860,000
Natural Resources - Other: $691,000
Miscellaneous Commercial Activities - Other: $393,000
Miscellaneous Commercial Activities - Other: $258,000
Corrections - Other: $248,000
Corrections - Other: $238,000
Libraries: $202,000
Libraries: $153,000
- Federal Intergovernmental - Other: $1,781,000
Other: $954,000
General Local Government Support: $74,000
General Local Government Support: $73,000
- General - Interest on Debt: $35,946,000
Interest on Debt: $34,940,000
- Local Intergovernmental - Other: $940,000
Other: $737,000
General Local Government Support: $181,000
General Local Government Support: $63,000
- Long Term Debt - Beginning Outstanding - Unspecified Public Purpose: $945,655,000
Beginning Outstanding - Unspecified Public Purpose: $898,425,000
Outstanding Unspecified Public Purpose: $893,870,000
Outstanding Unspecified Public Purpose: $822,605,000
Retired Unspecified Public Purpose: $103,535,000
Retired Unspecified Public Purpose: $81,715,000
Issue, Unspecified Public Purpose: $51,750,000
Issue, Unspecified Public Purpose: $5,895,000
- Miscellaneous - Interest Earnings: $14,043,000
General Revenue - Other: $7,970,000
General Revenue - Other: $5,225,000
Interest Earnings: $4,675,000
Fines and Forfeits: $3,515,000
Fines and Forfeits: $3,269,000
Sale of Property: $571,000
Sale of Property: $456,000
- Other Capital Outlay - Regular Highways: $9,386,000
Regular Highways: $8,248,000
Central Staff Services: $4,977,000
Police Protection: $3,572,000
Police Protection: $2,305,000
Health - Other: $2,276,000
Central Staff Services: $2,011,000
Health - Other: $1,321,000
Judicial and Legal Services: $1,069,000
General Public Building: $308,000
Correctional Institutions: $281,000
Parks and Recreation: $238,000
Judicial and Legal Services: $167,000
Parks and Recreation: $157,000
General Public Building: $95,000
Miscellaneous Commercial Activities - Other: $73,000
General - Other: $69,000
Natural Resources - Other: $30,000
Natural Resources - Other: $30,000
Correctional Institutions: $6,000
Financial Administration: $5,000
Financial Administration: $4,000
- Other Funds - Cash and Securities: $412,451,000
Cash and Securities: $405,173,000
- State Intergovernmental - Other: $5,053,000
General Local Government Support: $4,799,000
Other: $4,682,000
General Local Government Support: $3,782,000
Highways: $528,000
Health and Hospitals: $413,000
Highways: $326,000
Health and Hospitals: $224,000
Public Welfare: $137,000
Public Welfare: $97,000
- Tax - Property: $308,034,000
Property: $250,149,000
Other Selective Sales: $13,747,000
Motor Vehicle License: $5,412,000
Motor Vehicle License: $4,850,000
Supplemental Security Income (SSI) in 2006:
- Total number of recipients: 2,659
- Number of aged recipients: 511
- Number of blind and disabled recipients: 2,148
- Number of recipients under 18: 579
- Number of recipients between 18 and 64: 1,353
- Number of recipients older than 64: 727
- Number of recipients also receiving OASDI: 904
- Amount of payments (thousands of dollars): 1,091
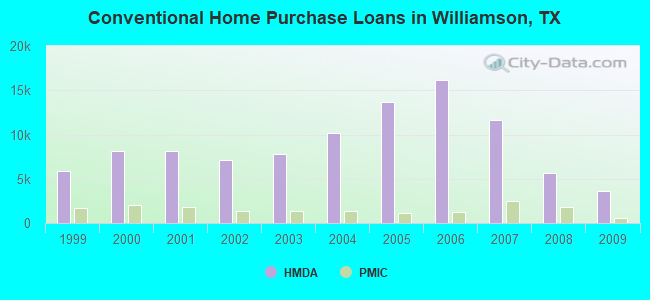
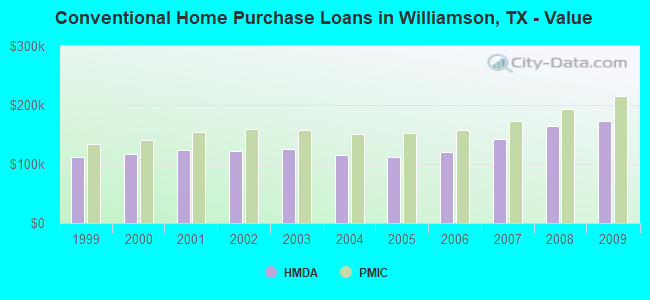
| Home Mortgage Disclosure Act Aggregated Statistics For Year 2009 (Based on 46 full tracts) | ||||||||||||||
| A) FHA, FSA/RHS & VA Home Purchase Loans | B) Conventional Home Purchase Loans | C) Refinancings | D) Home Improvement Loans | E) Loans on Dwellings For 5+ Families | F) Non-occupant Loans on < 5 Family Dwellings (A B C & D) | G) Loans On Manufactured Home Dwelling (A B C & D) | ||||||||
|---|---|---|---|---|---|---|---|---|---|---|---|---|---|---|
| Number | Average Value | Number | Average Value | Number | Average Value | Number | Average Value | Number | Average Value | Number | Average Value | Number | Average Value | |
| LOANS ORIGINATED | 3,589 | $170,533 | 3,590 | $173,018 | 8,740 | $172,119 | 477 | $54,551 | 9 | $6,884,000 | 710 | $138,393 | 72 | $86,597 |
| APPLICATIONS APPROVED, NOT ACCEPTED | 116 | $163,647 | 250 | $154,108 | 883 | $163,156 | 87 | $48,598 | 0 | $0 | 54 | $123,167 | 36 | $69,028 |
| APPLICATIONS DENIED | 549 | $162,242 | 436 | $144,784 | 2,568 | $167,677 | 493 | $38,223 | 0 | $0 | 230 | $125,139 | 68 | $68,721 |
| APPLICATIONS WITHDRAWN | 423 | $174,671 | 506 | $199,223 | 2,030 | $167,586 | 134 | $69,701 | 0 | $0 | 133 | $131,955 | 11 | $102,909 |
| FILES CLOSED FOR INCOMPLETENESS | 55 | $160,927 | 54 | $210,296 | 398 | $169,568 | 37 | $74,838 | 0 | $0 | 20 | $130,150 | 9 | $74,000 |
| Private Mortgage Insurance Companies Aggregated Statistics For Year 2009 (Based on 45 full tracts) | ||||||||
| A) Conventional Home Purchase Loans | B) Refinancings | C) Non-occupant Loans on < 5 Family Dwellings (A & B) | D) Loans On Manufactured Home Dwelling (A & B) | |||||
|---|---|---|---|---|---|---|---|---|
| Number | Average Value | Number | Average Value | Number | Average Value | Number | Average Value | |
| LOANS ORIGINATED | 609 | $215,737 | 387 | $195,760 | 16 | $216,562 | 0 | $0 |
| APPLICATIONS APPROVED, NOT ACCEPTED | 171 | $217,561 | 118 | $217,008 | 10 | $201,300 | 0 | $0 |
| APPLICATIONS DENIED | 98 | $229,806 | 64 | $211,984 | 5 | $193,200 | 1 | $162,000 |
| APPLICATIONS WITHDRAWN | 33 | $247,455 | 48 | $204,562 | 2 | $147,500 | 0 | $0 |
| FILES CLOSED FOR INCOMPLETENESS | 19 | $204,895 | 6 | $209,000 | 4 | $123,250 | 0 | $0 |
| Most common first names in Williamson County, TX among deceased individuals | ||
| Name | Count | Lived (average) |
|---|---|---|
| John | 705 | 75.1 years |
| Mary | 659 | 80.8 years |
| James | 558 | 73.0 years |
| William | 533 | 76.5 years |
| Robert | 450 | 73.5 years |
| Charles | 284 | 74.0 years |
| George | 265 | 76.4 years |
| Dorothy | 233 | 78.7 years |
| Joe | 229 | 77.0 years |
| Frank | 223 | 78.2 years |
| Most common last names in Williamson County, TX among deceased individuals | ||
| Last name | Count | Lived (average) |
|---|---|---|
| Smith | 280 | 76.6 years |
| Johnson | 249 | 77.9 years |
| Williams | 210 | 74.4 years |
| Davis | 198 | 78.6 years |
| Anderson | 166 | 77.6 years |
| Brown | 148 | 73.9 years |
| Jones | 135 | 75.5 years |
| Moore | 108 | 77.5 years |
| Taylor | 107 | 73.8 years |
| Wilson | 101 | 76.5 years |
| Businesses in Williamson County, TX | ||||
| Name | Count | Name | Count | |
|---|---|---|---|---|
| 7-Eleven | 1 | Jimmy John's | 10 | |
| AT&T | 2 | Justice | 1 | |
| Ace Hardware | 1 | KFC | 1 | |
| Advance Auto Parts | 2 | Kohl's | 1 | |
| Applebee's | 1 | La Quinta | 1 | |
| Audi | 1 | Lane Bryant | 1 | |
| AutoZone | 3 | Lane Furniture | 2 | |
| BMW | 1 | Little Caesars Pizza | 2 | |
| Baskin-Robbins | 1 | Lowe's | 1 | |
| Bath & Body Works | 1 | MasterBrand Cabinets | 2 | |
| Best Western | 1 | Mazda | 1 | |
| Blockbuster | 2 | McDonald's | 6 | |
| Budget Car Rental | 1 | New Balance | 2 | |
| Burger King | 2 | Nike | 6 | |
| CVS | 4 | Office Depot | 1 | |
| Carl\s Jr. | 1 | Old Navy | 1 | |
| Chevrolet | 2 | Panda Express | 1 | |
| Chick-Fil-A | 1 | Papa John's Pizza | 1 | |
| Chipotle | 2 | Payless | 1 | |
| Church's Chicken | 1 | Penske | 1 | |
| Cinnabon | 1 | PetSmart | 2 | |
| Circle K | 2 | Pier 1 Imports | 1 | |
| Comfort Suites | 1 | Pizza Hut | 3 | |
| Cricket Wireless | 2 | Quality | 1 | |
| Crossland Economy Studios | 1 | Quiznos | 1 | |
| Curves | 2 | RadioShack | 2 | |
| DHL | 2 | Rue21 | 1 | |
| Discount Tire | 1 | SONIC Drive-In | 5 | |
| Domino's Pizza | 3 | Sears | 2 | |
| DressBarn | 1 | Sephora | 1 | |
| Dressbarn | 1 | Sprint Nextel | 3 | |
| Famous Footwear | 1 | Starbucks | 5 | |
| FedEx | 22 | Subaru | 1 | |
| Firestone Complete Auto Care | 1 | Subway | 3 | |
| Ford | 2 | T-Mobile | 4 | |
| GNC | 1 | T.J.Maxx | 1 | |
| GameStop | 2 | Taco Bell | 4 | |
| Goodwill | 1 | Target | 1 | |
| H&R Block | 3 | True Value | 1 | |
| Hobby Lobby | 1 | U-Haul | 9 | |
| Holiday Inn | 3 | UPS | 16 | |
| Home Depot | 2 | Volkswagen | 1 | |
| IHOP | 1 | Walgreens | 8 | |
| IKEA | 1 | Walmart | 3 | |
| JCPenney | 1 | Wendy's | 3 | |
| Jack In The Box | 4 | YMCA | 1 | |
Williamson County on our top lists:
- #7 on the list of "Top 101 counties with the largest number of people moving in compared to moving out (pop. 50,000+)"
- #17 on the list of "Top 101 counties with the lowest number of deaths per 1000 residents 2007-2013 (pop. 50,000+)"
- #21 on the list of "Top 101 counties with the largest number of children under 18 without health insurance coverage in 2000 (pop. 50,000+)"
- #35 on the list of "Top 101 counties with the highest percentage of residents that drank alcohol in the past 30 days"
- #35 on the list of "Top 101 counties with the highest percentage of residents relocating from other counties between 2010 and 2011 (pop. 50,000+)"
- #38 on the list of "Top 101 counties with the lowest percentage of residents that smoked 100+ cigarettes in their lives"
- #62 on the list of "Top 101 counties with the largest decrease in the number of births per 1000 residents 2000-2006 to 2007-2013 (pop 50,000+)"
- #62 on the list of "Top 101 counties with the lowest number of deaths per 1000 residents 2007-2013"
- #63 on the list of "Top 101 counties with the best general health status score of residents (1-5), 3 years of data"
- #68 on the list of "Top 101 counties with the largest number of people without health insurance coverage in 2000 (pop. 50,000+)"
- #77 on the list of "Top 101 counties with the largest number of children under 18 without health insurance coverage in 2000"
- #82 on the list of "Top 101 counties with the highest percentage of residents relocating from other counties between 2010 and 2011"
- #88 on the list of "Top 101 counties with highest percentage of residents voting for 3rd party candidates in the 2012 Presidential Election (pop. 50,000+)"