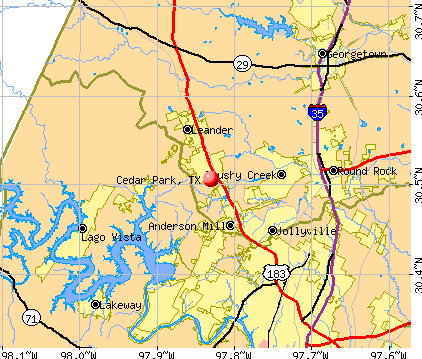
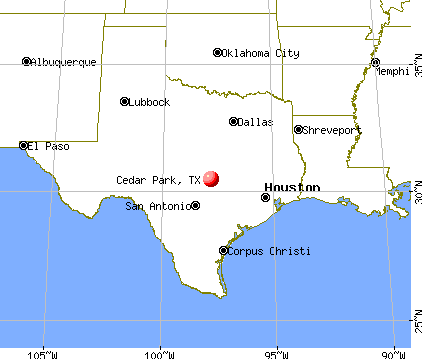
Cedar Park, Texas

Cedar Park: December 2005 Sunset

Cedar Park: Sunset over Brushey Creek Lake
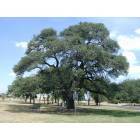
Cedar Park: Heritage Oak Park
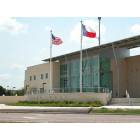
Cedar Park: Cedar Park Police Headquarters and Municipal Court Building on Discovery Drive.
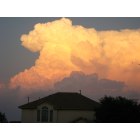
Cedar Park: Sunset cloud bank over my neighbors house.
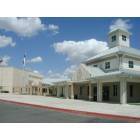
Cedar Park: Vista Ridge High School
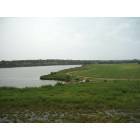
Cedar Park: Brushy Creek Lake from the top of the dam
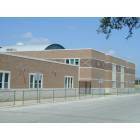
Cedar Park: Cedar Park High School
- add
your
Submit your own pictures of this city and show them to the world
- OSM Map
- General Map
- Google Map
- MSN Map
Population change since 2000: +198.1%
| Males: 38,149 | |
| Females: 39,493 |
| Median resident age: | 38.3 years |
| Texas median age: | 35.6 years |
Zip codes: 78613.
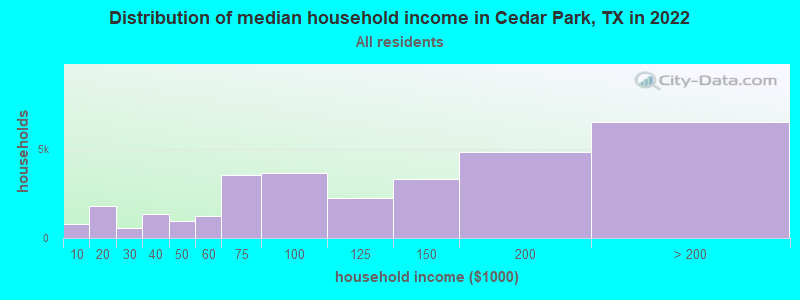
| Cedar Park: | $114,735 |
| TX: | $72,284 |
Estimated per capita income in 2022: $52,092 (it was $24,767 in 2000)
Cedar Park city income, earnings, and wages data
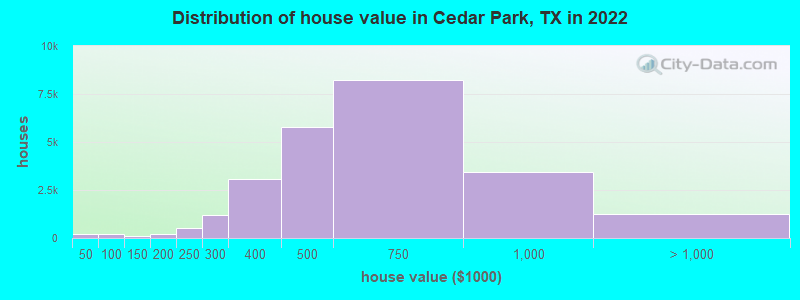
Estimated median house or condo value in 2022: $569,500 (it was $126,600 in 2000)
| Cedar Park: | $569,500 |
| TX: | $275,400 |
Mean prices in 2022: all housing units: $583,477; detached houses: $603,826; townhouses or other attached units: $322,031; mobile homes: $210,542
Median gross rent in 2022: $1,764.
(3.7% for White Non-Hispanic residents, 17.3% for Black residents, 9.9% for Hispanic or Latino residents, 4.6% for American Indian residents, 68.8% for Native Hawaiian and other Pacific Islander residents, 9.8% for other race residents, 5.1% for two or more races residents)
Detailed information about poverty and poor residents in Cedar Park, TX


Compare current foreclosures in Cedar Park, TX:
| Photo | Address | Area | Beds / Baths | Price | Details |
|---|---|---|---|---|---|

|
#1
Goldfinch Dr
Cedar Park, TX 78613
|
2,074 sq. feet
|
2 baths 4 beds |
show details | |

|
#2
Turkey Path Bnd
Cedar Park, TX 78613
|
3,206 sq. feet
|
2 baths 4 beds |
show details | |

|
#3
Marysol Trl
Cedar Park, TX 78613
|
3,297 sq. feet
|
2 baths - beds |
show details | |

|
#4
Zach Russell Dr
Cedar Park, TX 78613
|
3,859 sq. feet
|
4 baths - beds |
show details | |

|
#5
Cluck Creek Trl
Cedar Park, TX 78613
|
1,734 sq. feet
|
2 baths - beds |
show details | |

|
#6
Cashell Wood Dr
Cedar Park, TX 78613
|
2,753 sq. feet
|
2 baths - beds |
show details | |

|
#7
S Lynnwood Trl
Cedar Park, TX 78613
|
2,598 sq. feet
|
2 baths - beds |
show details | |

|
#8
Simbrah Dr
Cedar Park, TX 78613
|
2,006 sq. feet
|
2 baths - beds |
show details | |

|
#9
Romeo Dr
Cedar Park, TX 78613
|
2,518 sq. feet
|
2 baths - beds |
show details | |

|
#10
Bird Dog Ln
Cedar Park, TX 78613
|
2,777 sq. feet
|
2 baths - beds |
show details |
| Photo | Address | Area | Beds / Baths | Price | Details |
|---|---|---|---|---|---|

|
#11
Brushy Creek Rd # A
Cedar Park, TX 78613
|
1,280 sq. feet
|
3 baths - beds |
show details | |

|
#12
Holly Trl
Cedar Park, TX 78613
|
1,562 sq. feet
|
2 baths - beds |
show details | |

|
#13
Terlingua Dr
Cedar Park, TX 78613
|
3,624 sq. feet
|
3 baths - beds |
show details | |

|
#14
Cripple Creek Rd
Cedar Park, TX 78613
|
3,098 sq. feet
|
2 baths - beds |
show details | |

|
#15
Antelope Rdg
Cedar Park, TX 78613
|
2,428 sq. feet
|
2 baths - beds |
show details | |

|
#16
Glen Field Dr
Cedar Park, TX 78613
|
2,593 sq. feet
|
2 baths - beds |
show details | |

|
#17
Brook Meadow Trl
Cedar Park, TX 78613
|
1,918 sq. feet
|
2 baths - beds |
show details | |

|
#18
Twin Oak Trl
Cedar Park, TX 78613
|
1,340 sq. feet
|
2 baths - beds |
show details | |

|
#19
Spiderlily Vw
Cedar Park, TX 78613
|
2,261 sq. feet
|
2 baths - beds |
show details | |

|
#20
El Salido Pkwy
Cedar Park, TX 78613
|
3,004 sq. feet
|
2 baths - beds |
show details |
| Photo | Address | Area | Beds / Baths | Price | Details |
|---|---|---|---|---|---|

|
#21
Mancuso Bnd
Cedar Park, TX 78613
|
2,424 sq. feet
|
2 baths - beds |
show details | |

|
#22
S Lakeline Blvd Apt 1516
Cedar Park, TX 78613
|
- sq. feet
|
- baths - beds |
show details | |

|
#23
Dijon Dr
Cedar Park, TX 78613
|
- sq. feet
|
- baths - beds |
show details | |

|
#24
E Whitestone Blvd Ste 500
Cedar Park, TX 78613
|
- sq. feet
|
- baths - beds |
show details | |

|
#25
Bull Creek Pkwy Unit 1
Cedar Park, TX 78613
|
1,351 sq. feet
|
- baths - beds |
show details | |

|
#26
Fall Creek Loop
Cedar Park, TX 78613
|
- sq. feet
|
- baths - beds |
show details | |

|
#27
Main St # C306
Cedar Park, TX 78613
|
- sq. feet
|
- baths - beds |
show details | |

|
#28
Colonial Pkwy Apt 2103
Cedar Park, TX 78613
|
- sq. feet
|
- baths - beds |
show details | |

|
#29
Aster Pass
Cedar Park, TX 78613
|
- sq. feet
|
- baths - beds |
show details | |

|
#30
Ridgeline Blvd, Apt 10305
Cedar Park, TX 78613
|
- sq. feet
|
- baths - beds |
show details |
| Photo | Address | Area | Beds / Baths | Price | Details |
|---|---|---|---|---|---|

|
#31
S Lakeline Blvd Unit 1313
Cedar Park, TX 78613
|
- sq. feet
|
- baths - beds |
show details | |

|
#32
Riviera Dr
Cedar Park, TX 78613
|
- sq. feet
|
- baths - beds |
show details | |

|
#33
S Lakeline Blvd Apt 310
Cedar Park, TX 78613
|
- sq. feet
|
- baths - beds |
show details | |

|
#34
Sumac Ln
Cedar Park, TX 78613
|
1,456 sq. feet
|
- baths - beds |
show details | |

|
#35
Brady Ridge
Cedar Park, TX 78613
|
- sq. feet
|
- baths - beds |
show details | |

|
Check over 1 million property listings on Foreclosure.com!
|
browse all offers | |||


- 42,56453.1%White alone
- 17,07021.3%Asian alone
- 11,76714.7%Hispanic
- 5,2896.6%Two or more races
- 2,1712.7%Black alone
- 9861.2%Other race alone
- 1720.2%American Indian alone
- 1930.2%Native Hawaiian and Other
Pacific Islander alone

Races in Cedar Park detailed stats: ancestries, foreign born residents, place of birth
According to our research of Texas and other state lists, there were 26 registered sex offenders living in Cedar Park, Texas as of April 27, 2024.
The ratio of all residents to sex offenders in Cedar Park is 2,634 to 1.
The ratio of registered sex offenders to all residents in this city is much lower than the state average.
The City-Data.com crime index weighs serious crimes and violent crimes more heavily. Higher means more crime, U.S. average is 246.1. It adjusts for the number of visitors and daily workers commuting into cities.
- means the value is smaller than the state average.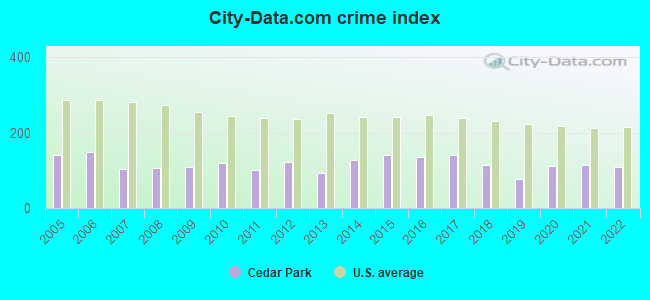
Crime rate in Cedar Park detailed stats: murders, rapes, robberies, assaults, burglaries, thefts, arson
Full-time law enforcement employees in 2021, including police officers: 126 (90 officers - 79 male; 11 female).
| Officers per 1,000 residents here: | 1.07 |
| Texas average: | 2.07 |
 Recent articles from our blog. Our writers, many of them Ph.D. graduates or candidates, create easy-to-read articles on a wide variety of topics.


Latest news from Cedar Park, TX collected exclusively by city-data.com from local newspapers, TV, and radio stations
Ancestries: German (8.0%), English (7.3%), American (7.1%), Irish (6.0%), European (4.2%), Italian (2.3%).
Current Local Time: CST time zone
Elevation: 910 feet
Land area: 17.0 square miles.
Population density: 4,575 people per square mile (average).
13,354 residents are foreign born (9.5% Asia, 4.8% Latin America).
| This city: | 16.1% |
| Texas: | 17.1% |
Median real estate property taxes paid for housing units with mortgages in 2022: $9,047 (1.5%)
Median real estate property taxes paid for housing units with no mortgage in 2022: $7,239 (1.5%)
Nearest city with pop. 50,000+: Round Rock, TX  (9.4 miles , pop. 61,136).
Nearest city with pop. 200,000+: Austin, TX (15.1 miles , pop. 656,562).
Nearest city with pop. 1,000,000+: San Antonio, TX (83.6 miles , pop. 1,144,646).
Nearest cities:
), ), ), Latitude: 30.51 N, Longitude: 97.83 W
Daytime population change due to commuting: +2,489 (+3.1%)
Workers who live and work in this city: 20,577 (48.4%)
Area code commonly used in this area: 512
Cedar Park, Texas accommodation & food services, waste management - Economy and Business Data
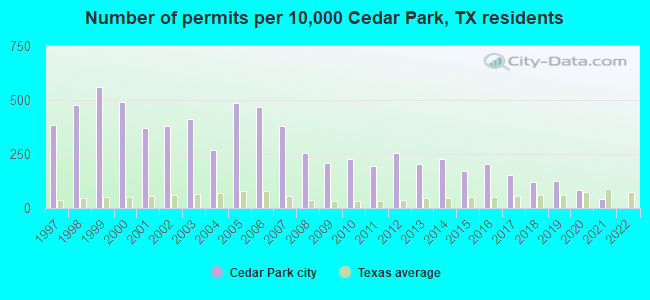
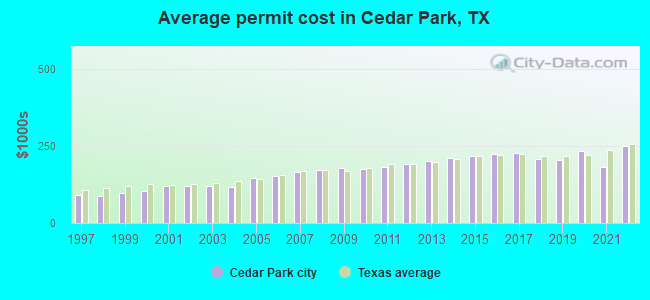
Single-family new house construction building permits:
- 2022: 3 buildings, average cost: $250,700
- 2021: 103 buildings, average cost: $181,500
- 2020: 214 buildings, average cost: $233,300
- 2019: 332 buildings, average cost: $204,900
- 2018: 317 buildings, average cost: $207,300
- 2017: 399 buildings, average cost: $227,600
- 2016: 535 buildings, average cost: $223,200
- 2015: 439 buildings, average cost: $217,400
- 2014: 596 buildings, average cost: $210,000
- 2013: 533 buildings, average cost: $201,600
- 2012: 668 buildings, average cost: $192,300
- 2011: 506 buildings, average cost: $180,600
- 2010: 595 buildings, average cost: $175,400
- 2009: 544 buildings, average cost: $179,400
- 2008: 660 buildings, average cost: $173,900
- 2007: 989 buildings, average cost: $165,200
- 2006: 1216 buildings, average cost: $154,300
- 2005: 1270 buildings, average cost: $144,700
- 2004: 698 buildings, average cost: $116,700
- 2003: 1072 buildings, average cost: $120,100
- 2002: 988 buildings, average cost: $120,100
- 2001: 967 buildings, average cost: $119,200
- 2000: 1280 buildings, average cost: $104,100
- 1999: 1462 buildings, average cost: $96,900
- 1998: 1246 buildings, average cost: $88,800
- 1997: 1003 buildings, average cost: $89,700
| Here: | 2.9% |
| Texas: | 3.5% |
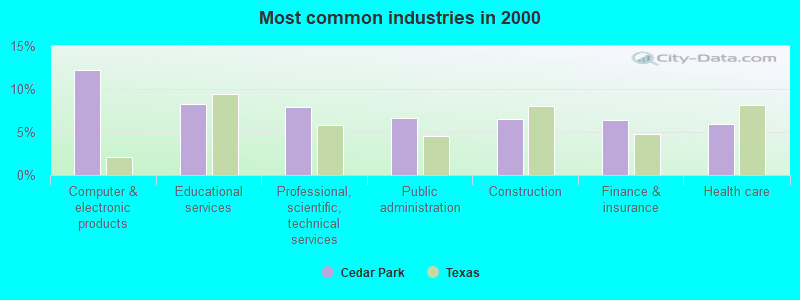
- Computer & electronic products (12.2%)
- Educational services (8.2%)
- Professional, scientific, technical services (7.9%)
- Public administration (6.7%)
- Construction (6.5%)
- Finance & insurance (6.4%)
- Health care (5.9%)
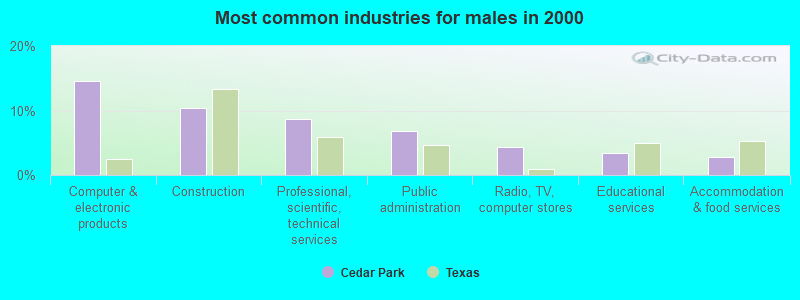
- Computer & electronic products (14.6%)
- Construction (10.4%)
- Professional, scientific, technical services (8.7%)
- Public administration (6.8%)
- Radio, TV, computer stores (4.3%)
- Educational services (3.4%)
- Accommodation & food services (2.9%)
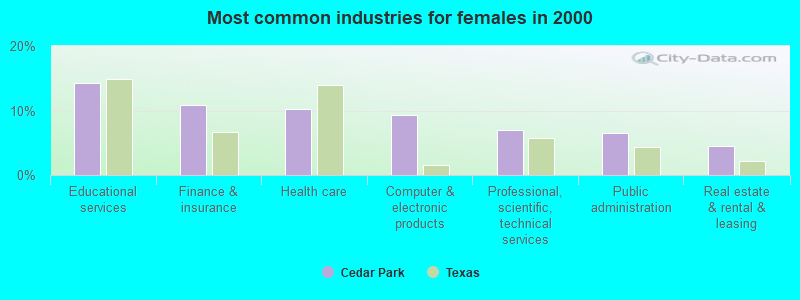
- Educational services (14.3%)
- Finance & insurance (10.9%)
- Health care (10.2%)
- Computer & electronic products (9.3%)
- Professional, scientific, technical services (6.9%)
- Public administration (6.5%)
- Real estate & rental & leasing (4.5%)
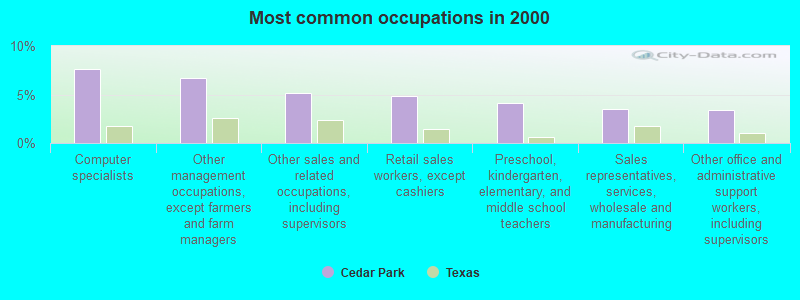
- Computer specialists (7.6%)
- Other management occupations, except farmers and farm managers (6.7%)
- Other sales and related occupations, including supervisors (5.2%)
- Retail sales workers, except cashiers (4.9%)
- Preschool, kindergarten, elementary, and middle school teachers (4.1%)
- Sales representatives, services, wholesale and manufacturing (3.6%)
- Other office and administrative support workers, including supervisors (3.5%)
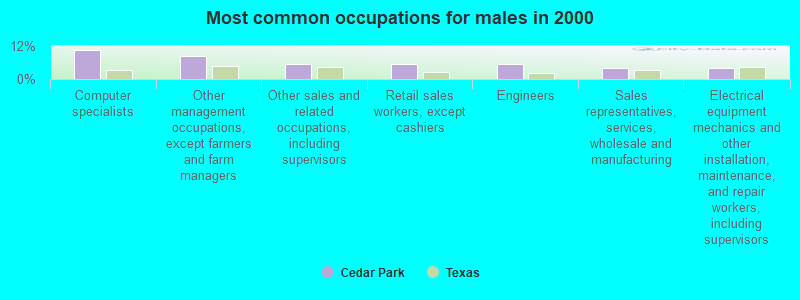
- Computer specialists (10.5%)
- Other management occupations, except farmers and farm managers (8.2%)
- Other sales and related occupations, including supervisors (5.5%)
- Retail sales workers, except cashiers (5.5%)
- Engineers (5.4%)
- Sales representatives, services, wholesale and manufacturing (4.2%)
- Electrical equipment mechanics and other installation, maintenance, and repair workers, including supervisors (3.9%)
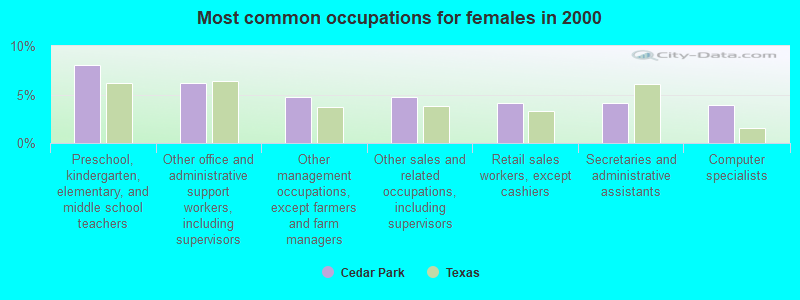
- Preschool, kindergarten, elementary, and middle school teachers (8.0%)
- Other office and administrative support workers, including supervisors (6.2%)
- Other management occupations, except farmers and farm managers (4.8%)
- Other sales and related occupations, including supervisors (4.7%)
- Retail sales workers, except cashiers (4.2%)
- Secretaries and administrative assistants (4.1%)
- Computer specialists (4.0%)
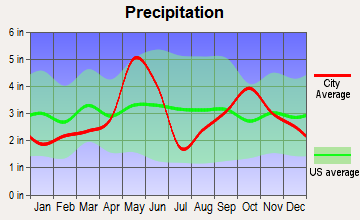
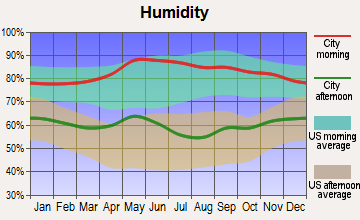
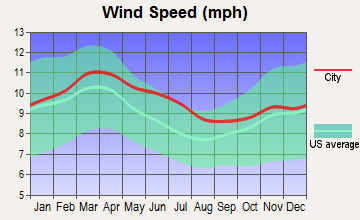
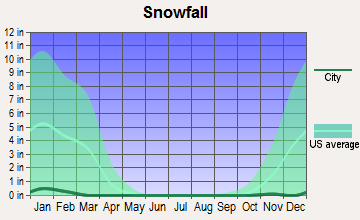
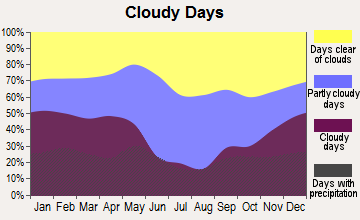
Average climate in Cedar Park, Texas
Based on data reported by over 4,000 weather stations


|
|

(lower is better)
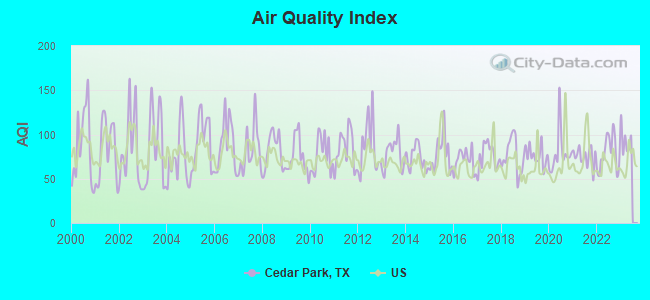
Air Quality Index (AQI) level in 2022 was 78.6. This is about average.
| City: | 78.6 |
| U.S.: | 72.6 |
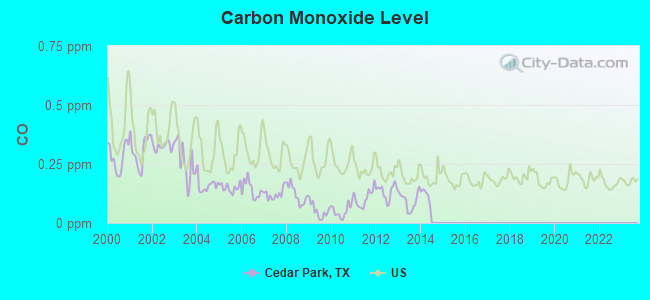
Carbon Monoxide (CO) [ppm] level in 2013 was 0.0938. This is significantly better than average. Closest monitor was 10.7 miles away from the city center.
| City: | 0.0938 |
| U.S.: | 0.2513 |
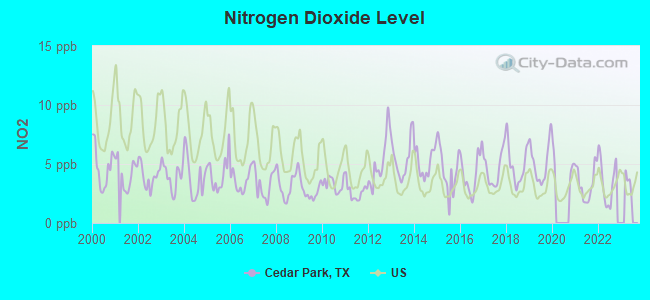
Nitrogen Dioxide (NO2) [ppb] level in 2022 was 3.48. This is significantly better than average. Closest monitor was 3.1 miles away from the city center.
| City: | 3.48 |
| U.S.: | 5.11 |
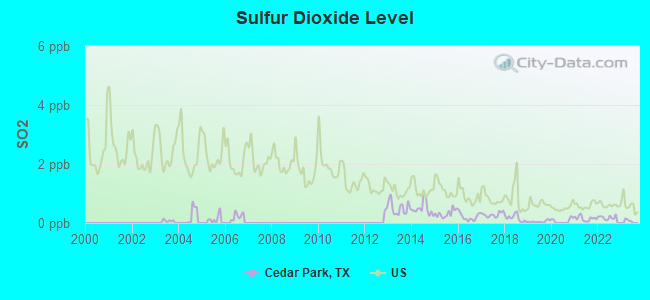
Sulfur Dioxide (SO2) [ppb] level in 2022 was 0.186. This is significantly better than average. Closest monitor was 10.7 miles away from the city center.
| City: | 0.186 |
| U.S.: | 1.515 |
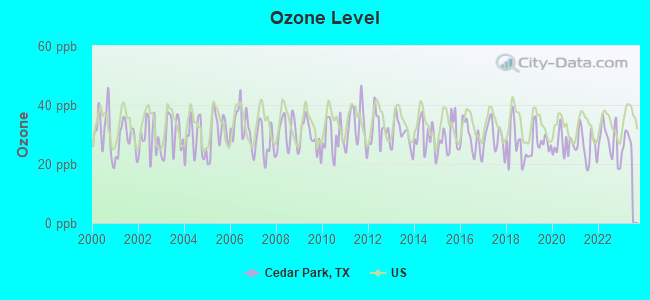
Ozone [ppb] level in 2022 was 27.8. This is about average. Closest monitor was 3.1 miles away from the city center.
| City: | 27.8 |
| U.S.: | 33.3 |
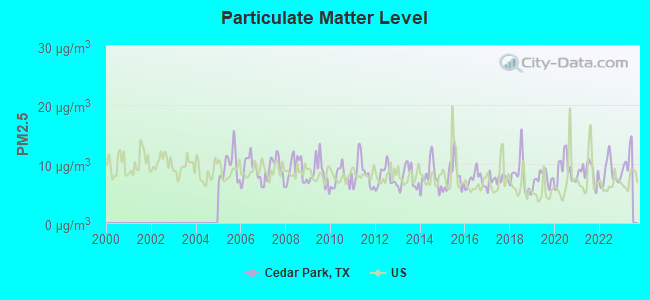
Particulate Matter (PM2.5) [µg/m3] level in 2022 was 8.30. This is about average. Closest monitor was 3.1 miles away from the city center.
| City: | 8.30 |
| U.S.: | 8.11 |
Tornado activity:
Cedar Park-area historical tornado activity is near Texas state average. It is 38% greater than the overall U.S. average.
On 5/27/1997, a category F5 (max. wind speeds 261-318 mph) tornado 20.6 miles away from the Cedar Park city center killed 27 people and injured 12 people and caused $40 million in damages.
On 5/27/1997, a category F4 (max. wind speeds 207-260 mph) tornado 14.7 miles away from the city center killed one person and injured 5 people and caused $15 million in damages.
Earthquake activity:
Cedar Park-area historical earthquake activity is significantly above Texas state average. It is 17% smaller than the overall U.S. average.On 10/20/2011 at 12:24:41, a magnitude 4.8 (4.8 MW, Depth: 3.1 mi, Class: Light, Intensity: IV - V) earthquake occurred 114.5 miles away from Cedar Park center
On 6/16/1978 at 11:46:54, a magnitude 5.3 (4.4 MB, 4.6 UK, 5.3 ML, Class: Moderate, Intensity: VI - VII) earthquake occurred 245.5 miles away from Cedar Park center
On 4/14/1995 at 00:32:56, a magnitude 5.7 (5.6 MB, 5.7 MS, 5.7 MW, Depth: 11.1 mi) earthquake occurred 330.7 miles away from the city center
On 4/9/1993 at 12:29:19, a magnitude 4.3 (4.1 MB, 4.3 LG, Depth: 3.1 mi) earthquake occurred 118.6 miles away from the city center
On 5/17/2012 at 08:12:00, a magnitude 4.8 (4.8 MW, Depth: 3.1 mi) earthquake occurred 227.1 miles away from the city center
On 5/1/2018 at 16:28:56, a magnitude 4.0 (4.0 MW, Depth: 3.1 mi) earthquake occurred 108.3 miles away from the city center
Magnitude types: regional Lg-wave magnitude (LG), body-wave magnitude (MB), local magnitude (ML), surface-wave magnitude (MS), moment magnitude (MW)
Natural disasters:
The number of natural disasters in Williamson County (19) is greater than the US average (15).Major Disasters (Presidential) Declared: 7
Emergencies Declared: 7
Causes of natural disasters: Fires: 8, Storms: 5, Floods: 4, Hurricanes: 4, Tornadoes: 3, Wind: 1, Other: 2 (Note: some incidents may be assigned to more than one category).

Main business address for: FIELDPOINT PETROLEUM CORP (CRUDE PETROLEUM & NATURAL GAS).
Hospitals and medical centers in Cedar Park:
- CEDAR PARK COMMUNITY RESIDENCE (611 POMEGRANATE PASS)
- CEDAR PARK REGIONAL MEDICAL CENTER (Voluntary non-profit - Other, provides emergency services, 1401 MEDICAL PARKWAY)
- HILL COUNTRY COMMUNITY RESIDENCE (1406 PECAN ST)
- RIVIERA COMMUNITY RESIDENCE (2401 DIJON DR)
- NEW HOPE MANOR (1623 W NEW HOPE DR)
- SAGEBROOK SN HEALTH CENTER (901 DISCOVERY BLVD)
- THE ISLE AT CEDAR RIDGE (2200 S LAKELINE BLVD)
- BIO-MEDICAL APPLICATIONS OF TEXAS, INC (1201 NORTH LAKELINE BLVD.)
- CEDAR PARK DIALYSIS CENTER (1720 E WHITESTONE BLVD)
- LAKE AREA HOME HEALTH INC (715 DISCOVERY BLVD #410)
Airports and heliports located in Cedar Park:
- Hank Sasser Airport At Breakaway (40XS) (Runways: 1)
- Cedar Park Regional Medical Center Heliport (XS19)
Amtrak station near Cedar Park:
College/University in Cedar Park:
Colleges/universities with over 2000 students nearest to Cedar Park:
- Concordia University-Texas (about 6 miles; Austin, TX; Full-time enrollment: 2,192)
- Austin Community College District (about 15 miles; Austin, TX; FT enrollment: 25,957)
- The University of Texas at Austin (about 17 miles; Austin, TX; FT enrollment: 45,500)
- Saint Edward's University (about 20 miles; Austin, TX; FT enrollment: 4,308)
- Central Texas College (about 43 miles; Killeen, TX; FT enrollment: 15,911)
- Texas State University (about 44 miles; San Marcos, TX; FT enrollment: 29,202)
- University of Mary Hardin-Baylor (about 45 miles; Belton, TX; FT enrollment: 2,885)
Public high schools in Cedar Park:
- CEDAR PARK H S (Students: 2,070, Location: 2150 CYPRESS CREEK RD, Grades: 9-12)
- VISTA RIDGE H S (Location: 200 S VISTA RDG, Grades: 9-12)
Private high school in Cedar Park:
Biggest public elementary/middle schools in Cedar Park:
- ARTIE L HENRY MIDDLE (Students: 1,290, Location: 100 N VISTA RDG BLVD, Grades: 6-8)
- CEDAR PARK MIDDLE (Students: 1,268, Location: 2100 SUN CHASE BLVD, Grades: 6-8)
- RUNNING BRUSHY MIDDLE (Students: 1,120, Location: 2303 N LAKELINE BLVD, Grades: 6-8)
- CYPRESS EL (Students: 862, Location: 2900 EL SALIDO PKWY, Grades: PK-5)
- RONALD REAGAN EL (Students: 808, Location: 1700 E PARK ST, Grades: PK-5)
- DEER CREEK EL (Students: 806, Location: 2420 ZEPPELIN DR, Grades: PK-5)
- PAULINE NAUMANN EL (Students: 759, Location: 1201 BRIGHTON BLVD, Grades: PK-5)
- C C MASON EL (Students: 696, Location: 1501 N LAKELINE BLVD, Grades: PK-5)
- CHARLOTTE COX EL (Students: 675, Location: 1001 BRUSHY CREEK RD, Grades: PK-5)
- PATRICIA KNOWLES EL (Students: 615, Location: 2101 COUGAR COUNTRY DR, Grades: PK-5)
Private elementary/middle schools in Cedar Park:
Library in Cedar Park:
User-submitted facts and corrections:
- Church in Cedar Park: Shenandoah Baptist Church - www.shenandoahbaptist.com (512) 258-6909
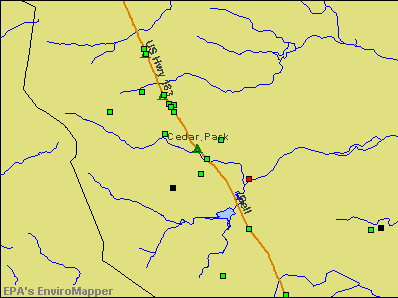
Points of interest:
Notable locations in Cedar Park: Cedar Park Volunteer Fire Department (A), Leander Fire Department (B), Cedar Park Fire Department Station 3 (C), Cedar Park Fire Department Station 1 (D), Cedar Park Fire Department Station 2 (E), Williamson County Emergency Medical Services Cedar Park (F). Display/hide their locations on the map
Main business address in Cedar Park: FIELDPOINT PETROLEUM CORP (A). Display/hide its location on the map
Churches in Cedar Park include: Carriage Hills Baptist Church (A), Whitestone Assembly of God Church (B), Living Hope Community Church (C), Gateway Community Church (D), Cedar Park United Methodist Church (E), Saint Margaret Mary Catholic Church (F), Newsong Baptist Church (G), Lakehills Free Will Baptist Church (H), White Stone Church (I). Display/hide their locations on the map
Cemetery: Bonnet Cemetery (1). Display/hide its location on the map
Reservoirs: Soil Conservation Service Site 7 Reservoir (A), Soil Conservation Service Site 4 Reservoir (B), Soil Conservation Service Site 6 Reservoir (C). Display/hide their locations on the map
Creeks: Spanish Oak Creek (A), Cluck Creek (B), Buttercup Creek (C), Cottonwood Creek (D). Display/hide their locations on the map
Park in Cedar Park: Hilltop Christian Academy Football Stadium (1). Display/hide its location on the map
Hotels: Comfort (300 East Whitestone Boulevard) (1), Best Western Cedar Inn (425 East Whitestone Boulevard) (2), Comfort Inn Cedar Park (300 East Whitestone Boulevard) (3). Display/hide their approximate locations on the map
Court: Williamson County - Juvenile Services- Round Rock- Cedar Park- Justice of the P (350 Discovery Boulevard) (1). Display/hide its approximate location on the map
Birthplace of: Barak Ness - College football player (Texas State Bobcats).
| This city: | 2.7 people |
| Texas: | 2.8 people |
| This city: | 72.5% |
| Whole state: | 69.9% |
| This city: | 6.3% |
| Whole state: | 6.0% |
Likely homosexual households (counted as self-reported same-sex unmarried-partner households)
- Lesbian couples: 0.6% of all households
- Gay men: 0.3% of all households
30 people in group homes intended for adults in 2010
People in group quarters in Cedar Park in 2000:
- 133 people in nursing homes
- 22 people in homes for the mentally retarded
- 11 people in mental (psychiatric) hospitals or wards
- 2 people in other nonhousehold living situations
Banks with most branches in Cedar Park (2011 data):
- JPMorgan Chase Bank, National Association: Cedar Park Banking Center, Lakeline Banking Center Branch, Vista Ridge. Info updated 2011/11/10: Bank assets: $1,811,678.0 mil, Deposits: $1,190,738.0 mil, headquarters in Columbus, OH, positive income, International Specialization, 5577 total offices, Holding Company: Jpmorgan Chase & Co.
- Wells Fargo Bank, National Association: Randall's Cypress Creek Branch, Whitestone And 183 Branch, North Lakeline & 1431 Branch. Info updated 2011/04/05: Bank assets: $1,161,490.0 mil, Deposits: $905,653.0 mil, headquarters in Sioux Falls, SD, positive income, 6395 total offices, Holding Company: Wells Fargo & Company
- Bank of America, National Association: 1431 Parmer Banking Store Branch, Whitestone Banking Store, Cypress Creek Banking Store Branch. Info updated 2009/11/18: Bank assets: $1,451,969.3 mil, Deposits: $1,077,176.8 mil, headquarters in Charlotte, NC, positive income, 5782 total offices, Holding Company: Bank Of America Corporation
- International Bank of Commerce: Lakeline Mall - Cedar Park Branch at 11200 Lakeline Mall Drive, branch established on 2007/01/10; Cedar Park Branch at 301 W. Whitestone, branch established on 2006/03/01. Info updated 2007/03/28: Bank assets: $9,621.9 mil, Deposits: $6,548.8 mil, headquarters in Laredo, TX, positive income, Commercial Lending Specialization, 197 total offices, Holding Company: International Bancshares Corporation
- Bank Midwest, National Association: Lakeline Oaks Retirement Community at 1905 South Lakeline Oaks Boulevard, branch established on 2009/02/12. Info updated 2012/03/19: Bank assets: $6,237.6 mil, Deposits: $5,064.6 mil, headquarters in Kansas City, MO, positive income, 138 total offices, Holding Company: Nbh Holdings Corp.
- Lone Star Bank, S.S.B.: Cedar Park Branch at 109 Cypress Creek Road, branch established on 2011/11/01. Info updated 2006/11/03: Bank assets: $252.2 mil, Deposits: $184.6 mil, headquarters in Moulton, TX, positive income, Mortgage Lending Specialization, 5 total offices, Holding Company: Southern Bancshares, Inc.
- Compass Bank: Cedar Park Branch at 1455 East Whitestone Boulevard, branch established on 2009/08/22. Info updated 2011/02/24: Bank assets: $63,107.0 mil, Deposits: $46,232.4 mil, headquarters in Birmingham, AL, negative income in the last year, Commercial Lending Specialization, 720 total offices, Holding Company: Banco Bilbao Vizcaya Argentaria, S.A.
- First National Bank: /Branch at 190 East Whitestone Boulevard, branch established on 2005/10/24. Info updated 2007/09/20: Bank assets: $3,517.0 mil, Deposits: $2,598.8 mil, headquarters in Edinburg, TX, negative income in the last year, Commercial Lending Specialization, 58 total offices, Holding Company: First National Bank Group, Inc.
- Regions Bank: Cedar Park Branch at 401 North Bell Avenue, branch established on 1997/01/21. Info updated 2011/02/24: Bank assets: $123,368.2 mil, Deposits: $98,301.3 mil, headquarters in Birmingham, AL, positive income, Commercial Lending Specialization, 1778 total offices, Holding Company: Regions Financial Corporation
- 7 other banks with 7 local branches
For population 15 years and over in Cedar Park:
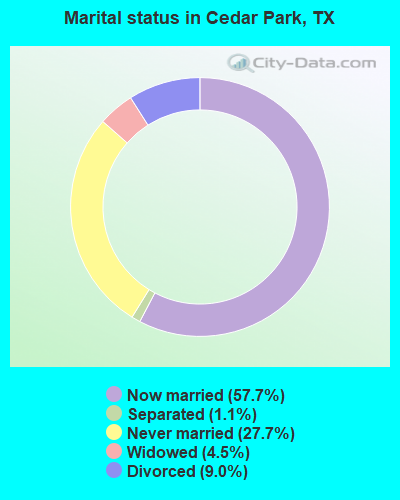
- Never married: 27.7%
- Now married: 57.7%
- Separated: 1.1%
- Widowed: 4.5%
- Divorced: 9.0%
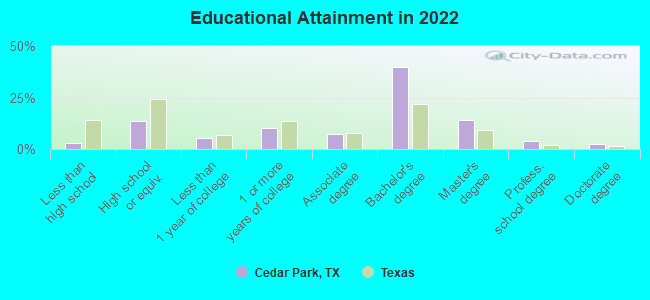
For population 25 years and over in Cedar Park:
- High school or higher: 96.9%
- Bachelor's degree or higher: 60.5%
- Graduate or professional degree: 20.5%
- Unemployed: 1.9%
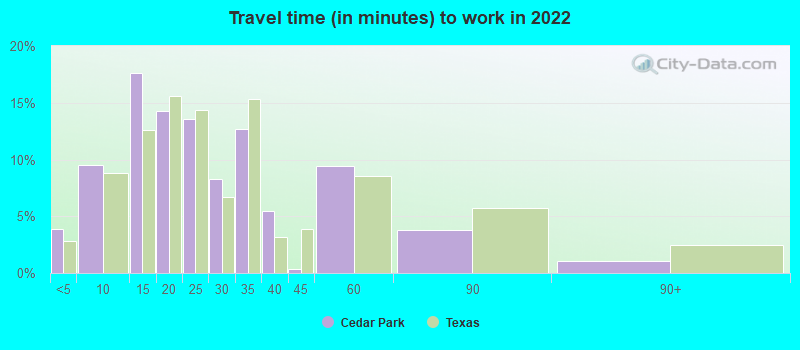
- Mean travel time to work (commute): 15.9 minutes
| Here: | 9.4 |
| Texas average: | 14.0 |
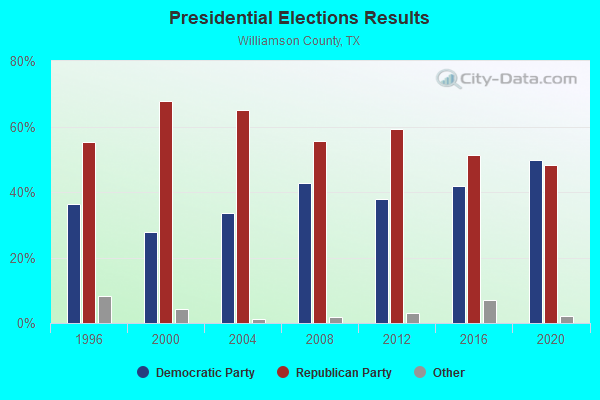
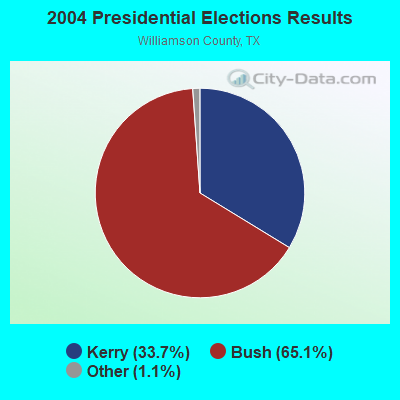
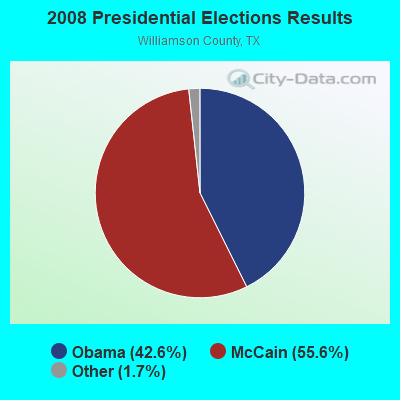
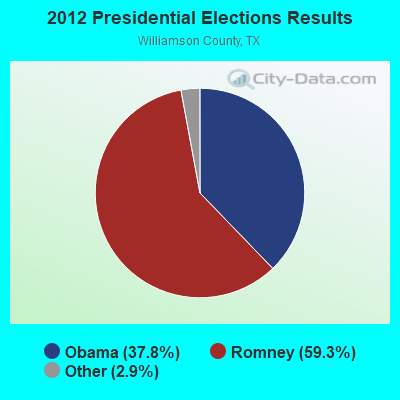


Graphs represent county-level data. Detailed 2008 Election Results
Religion statistics for Cedar Park, TX (based on Williamson County data)
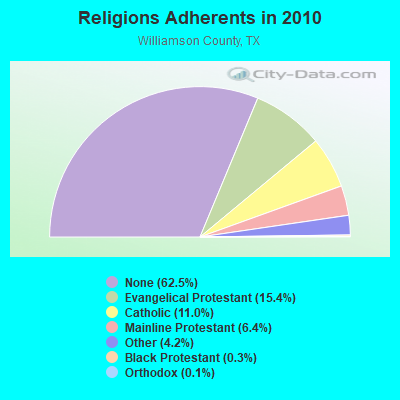
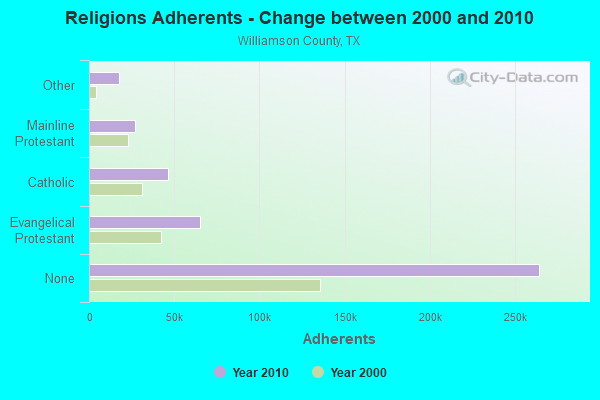
| Religion | Adherents | Congregations |
|---|---|---|
| Evangelical Protestant | 64,975 | 193 |
| Catholic | 46,503 | 10 |
| Mainline Protestant | 27,143 | 47 |
| Other | 17,763 | 37 |
| Black Protestant | 1,452 | 8 |
| Orthodox | 576 | 5 |
| None | 264,267 | - |
Food Environment Statistics:
| Here: | 0.75 / 10,000 pop. |
| State: | 1.47 / 10,000 pop. |
| Williamson County: | 0.19 / 10,000 pop. |
| Texas: | 0.14 / 10,000 pop. |
| This county: | 0.75 / 10,000 pop. |
| Texas: | 1.11 / 10,000 pop. |
| Williamson County: | 2.98 / 10,000 pop. |
| State: | 3.95 / 10,000 pop. |
| Williamson County: | 5.19 / 10,000 pop. |
| Texas: | 6.13 / 10,000 pop. |
| Here: | 7.4% |
| State: | 8.9% |
| Williamson County: | 24.1% |
| Texas: | 26.6% |
| This county: | 12.8% |
| Texas: | 15.7% |
Health and Nutrition:
| Here: | 52.0% |
| State: | 48.6% |
| Cedar Park: | 52.7% |
| State: | 47.4% |
| Here: | 28.4 |
| Texas: | 28.5 |
| Cedar Park: | 20.4% |
| State: | 20.6% |
| Here: | 8.8% |
| State: | 10.3% |
| This city: | 6.8 |
| Texas: | 6.8 |
| Cedar Park: | 33.6% |
| State: | 33.1% |
| Cedar Park: | 60.8% |
| Texas: | 56.2% |
| Here: | 83.1% |
| Texas: | 80.7% |
More about Health and Nutrition of Cedar Park, TX Residents
| Local government employment and payroll (March 2022) | |||||
| Function | Full-time employees | Monthly full-time payroll | Average yearly full-time wage | Part-time employees | Monthly part-time payroll |
|---|---|---|---|---|---|
| Police Protection - Officers | 97 | $728,925 | $90,176 | 0 | $0 |
| Firefighters | 81 | $667,017 | $98,817 | 0 | $0 |
| Other and Unallocable | 68 | $422,153 | $74,498 | 0 | $0 |
| Parks and Recreation | 40 | $162,072 | $48,622 | 30 | $28,803 |
| Police - Other | 35 | $191,707 | $65,728 | 0 | $0 |
| Streets and Highways | 32 | $164,929 | $61,848 | 0 | $0 |
| Financial Administration | 29 | $187,603 | $77,629 | 0 | $0 |
| Sewerage | 19 | $74,329 | $46,945 | 0 | $0 |
| Local Libraries | 18 | $83,309 | $55,539 | 7 | $9,670 |
| Judicial and Legal | 18 | $85,856 | $57,237 | 3 | $5,758 |
| Water Supply | 17 | $89,296 | $63,032 | 0 | $0 |
| Other Government Administration | 14 | $130,586 | $111,931 | 3 | $5,462 |
| Natural Resources | 7 | $30,161 | $51,705 | 0 | $0 |
| Fire - Other | 5 | $46,652 | $111,965 | 0 | $0 |
| Health | 4 | $14,387 | $43,161 | 0 | $0 |
| Totals for Government | 484 | $3,078,982 | $76,338 | 43 | $49,693 |
Cedar Park government finances - Expenditure in 2021 (per resident):
- Construction - Sewerage: $8,688,000 ($111.90)
Regular Highways: $7,359,000 ($94.78)
Water Utilities: $2,260,000 ($29.11)
General Public Buildings: $1,094,000 ($14.09)
Natural Resources - Other: $333,000 ($4.29)
Libraries: $20,000 ($0.26)
- Current Operations - Central Staff Services: $29,741,000 ($383.05)
Police Protection: $16,648,000 ($214.42)
Water Utilities: $16,133,000 ($207.79)
Local Fire Protection: $12,914,000 ($166.33)
Regular Highways: $7,664,000 ($98.71)
General - Other: $5,042,000 ($64.94)
Parks and Recreation: $4,475,000 ($57.64)
Solid Waste Management: $3,958,000 ($50.98)
Natural Resources - Other: $2,295,000 ($29.56)
Libraries: $1,895,000 ($24.41)
Judicial and Legal Services: $1,669,000 ($21.50)
Sewerage: $1,480,000 ($19.06)
Financial Administration: $1,259,000 ($16.22)
Housing and Community Development: $812,000 ($10.46)
Health - Other: $444,000 ($5.72)
General Public Buildings: $274,000 ($3.53)
Protective Inspection and Regulation - Other: $210,000 ($2.70)
Public Welfare - Other: $46,000 ($0.59)
- General - Interest on Debt: $6,473,000 ($83.37)
- Other Capital Outlay - Central Staff Services: $7,939,000 ($102.25)
Regular Highways: $4,313,000 ($55.55)
Parks and Recreation: $799,000 ($10.29)
Sewerage: $318,000 ($4.10)
Police Protection: $102,000 ($1.31)
Natural Resources - Other: $81,000 ($1.04)
Libraries: $11,000 ($0.14)
Local Fire Protection: $10,000 ($0.13)
- Total Salaries and Wages: $35,344,000 ($455.22)
- Water Utilities - Interest on Debt: $1,035,000 ($13.33)
Cedar Park government finances - Revenue in 2021 (per resident):
- Charges - Sewerage: $12,944,000 ($166.71)
Solid Waste Management: $4,070,000 ($52.42)
Other: $3,449,000 ($44.42)
Parks and Recreation: $629,000 ($8.10)
- Federal Intergovernmental - Public Welfare: $296,000 ($3.81)
- Local Intergovernmental - General Local Government Support: $176,000 ($2.27)
Highways: $104,000 ($1.34)
- Miscellaneous - Donations From Private Sources: $4,173,000 ($53.75)
Interest Earnings: $2,584,000 ($33.28)
Rents: $1,407,000 ($18.12)
Fines and Forfeits: $519,000 ($6.68)
Sale of Property: $386,000 ($4.97)
General Revenue - Other: $346,000 ($4.46)
- Revenue - Water Utilities: $20,924,000 ($269.49)
- State Intergovernmental - General Local Government Support: $256,000 ($3.30)
Public Welfare: $80,000 ($1.03)
- Tax - Property: $44,718,000 ($575.95)
General Sales and Gross Receipts: $31,143,000 ($401.11)
Public Utilities Sales: $3,286,000 ($42.32)
Other License: $920,000 ($11.85)
Other Selective Sales: $693,000 ($8.93)
Cedar Park government finances - Debt in 2021 (per resident):
- Long Term Debt - Outstanding Unspecified Public Purpose: $263,997,000 ($3400.18)
Beginning Outstanding - Unspecified Public Purpose: $228,726,000 ($2945.91)
Issue, Unspecified Public Purpose: $66,635,000 ($858.23)
Retired Unspecified Public Purpose: $31,365,000 ($403.97)
Cedar Park government finances - Cash and Securities in 2021 (per resident):
- Bond Funds - Cash and Securities: $97,499,000 ($1255.75)
- Other Funds - Cash and Securities: $124,559,000 ($1604.27)
- Sinking Funds - Cash and Securities: $17,672,000 ($227.61)
13.25% of this county's 2021 resident taxpayers lived in other counties in 2020 ($88,670 average adjusted gross income)
| Here: | 13.25% |
| Texas average: | 8.12% |
0.03% of residents moved from foreign countries ($181 average AGI)
Williamson County: 0.03% Texas average: 0.04%
Top counties from which taxpayers relocated into this county between 2020 and 2021:
| from Travis County, TX | |
| from Bell County, TX | |
| from Harris County, TX |
9.55% of this county's 2020 resident taxpayers moved to other counties in 2021 ($74,918 average adjusted gross income)
| Here: | 9.55% |
| Texas average: | 7.40% |
0.02% of residents moved to foreign countries ($98 average AGI)
Williamson County: 0.02% Texas average: 0.03%
Top counties to which taxpayers relocated from this county between 2020 and 2021:
| to Travis County, TX | |
| to Bell County, TX | |
| to Harris County, TX |
| Businesses in Cedar Park, TX | ||||
| Name | Count | Name | Count | |
|---|---|---|---|---|
| 7-Eleven | 1 | La-Z-Boy | 1 | |
| AT&T | 2 | Lane Bryant | 1 | |
| Abercrombie & Fitch | 1 | Lane Furniture | 2 | |
| Academy Sports + Outdoors | 1 | LensCrafters | 1 | |
| Ace Hardware | 1 | Little Caesars Pizza | 1 | |
| Advance Auto Parts | 2 | Long John Silver's | 1 | |
| Aeropostale | 1 | Macy's | 1 | |
| American Eagle Outfitters | 1 | Maurices | 1 | |
| Applebee's | 1 | McDonald's | 3 | |
| AutoZone | 1 | Men's Wearhouse | 1 | |
| Baskin-Robbins | 1 | Motel 6 | 1 | |
| Bath & Body Works | 1 | Motherhood Maternity | 2 | |
| Best Western | 1 | New Balance | 2 | |
| Blockbuster | 1 | New York & Co | 1 | |
| Brookstone | 1 | Nike | 15 | |
| Buffalo Wild Wings | 1 | Office Depot | 1 | |
| Burger King | 1 | OfficeMax | 2 | |
| CVS | 2 | Old Navy | 1 | |
| Carl\s Jr. | 1 | Pac Sun | 1 | |
| Charlotte Russe | 1 | Panda Express | 2 | |
| Chick-Fil-A | 2 | Papa John's Pizza | 1 | |
| Church's Chicken | 1 | Payless | 1 | |
| Cinnabon | 1 | PetSmart | 2 | |
| Circle K | 2 | Pizza Hut | 2 | |
| Comfort Inn | 1 | Plato's Closet | 1 | |
| Cricket Wireless | 1 | Popeyes | 1 | |
| DHL | 1 | RadioShack | 2 | |
| Discount Tire | 1 | Rooms To Go | 2 | |
| Domino's Pizza | 1 | Rue21 | 1 | |
| Express | 1 | SONIC Drive-In | 4 | |
| Famous Footwear | 1 | Safeway | 1 | |
| FedEx | 9 | Sears | 2 | |
| Finish Line | 1 | Spencer Gifts | 1 | |
| Firestone Complete Auto Care | 1 | Sprint Nextel | 1 | |
| Foot Locker | 1 | Starbucks | 5 | |
| Fredericks Of Hollywood | 1 | T-Mobile | 4 | |
| GNC | 2 | T.J.Maxx | 1 | |
| GameStop | 3 | Taco Bell | 1 | |
| Gap | 1 | Target | 1 | |
| Gymboree | 1 | The Limited | 1 | |
| H&R Block | 1 | Torrid | 1 | |
| Havertys Furniture | 1 | Toys"R"Us | 2 | |
| Hobby Lobby | 1 | U-Haul | 1 | |
| Holiday Inn | 2 | UPS | 8 | |
| Hollister Co. | 1 | Vans | 5 | |
| Home Depot | 1 | Verizon Wireless | 2 | |
| IHOP | 1 | Victoria's Secret | 1 | |
| JCPenney | 1 | Vons | 1 | |
| Jamba Juice | 1 | Walgreens | 3 | |
| Jones New York | 2 | Walmart | 1 | |
| Journeys | 1 | Wendy's | 2 | |
| Justice | 1 | Wet Seal | 1 | |
| KFC | 1 | YMCA | 2 | |
| La Quinta | 1 | |||
Strongest AM radio stations in Cedar Park:
- KVET (1300 AM; 5 kW; AUSTIN, TX; Owner: CAPSTAR TX LIMITED PARTNERSHIP)
- KLBJ (590 AM; 5 kW; AUSTIN, TX; Owner: EMMIS AUSTIN RADIO BROADCASTING COMPANY, L.P.)
- WMOP (900 AM; 5 kW; OCALA, FL; Owner: FLORIDA SPORTSTALK, INC.)
- KJCE (1370 AM; 5 kW; ROLLINGWOOD, TX; Owner: TEXAS INFINITY RADIO L.P.)
- KTKR (760 AM; 50 kW; SAN ANTONIO, TX; Owner: CCB TEXAS LICENSES, L.P.)
- KKYX (680 AM; 50 kW; SAN ANTONIO, TX; Owner: CXR HOLDINGS, INC.)
- WOAI (1200 AM; 50 kW; SAN ANTONIO, TX; Owner: CCB TEXAS LICENSES, L.P.)
- KOKE (1600 AM; 5 kW; PFLUGERVILLE, TX; Owner: AMIGO RADIO, LTD.)
- KTXZ (1560 AM; 2 kW; WEST LAKE HILLS, TX; Owner: NOGALES BROADCASTING, L.C.)
- KFIT (1060 AM; daytime; 2 kW; LOCKHART, TX; Owner: KFIT, INC..)
- KQQA (1530 AM; 10 kW; CREEDMOOR, TX; Owner: YELLOW ROSE COMMUNICATIONS, INC.)
- KIXL (970 AM; 1 kW; DEL VALLE, TX; Owner: KIXL BROADCASTING, CORPORATION)
- KENS (1160 AM; 25 kW; SAN ANTONIO, TX; Owner: KENS-TV, INC.)
Strongest FM radio stations in Cedar Park:
- KFMK (105.9 FM; ROUND ROCK, TX; Owner: CAPSTAR TX LIMITED PARTNERSHIP)
- KHFI-FM (96.7 FM; GEORGETOWN, TX; Owner: CCB TEXAS LICENSES, L.P.)
- KAMX (94.7 FM; LULING, TX; Owner: TEXAS INFINITY RADIO L.P.)
- KKMJ-FM (95.5 FM; AUSTIN, TX; Owner: TEXAS INFINITY RADIO L.P.)
- KMFA (89.5 FM; AUSTIN, TX; Owner: CAPITOL BROADCASTING ASSOCIATION, INC)
- KASE-FM (100.7 FM; AUSTIN, TX; Owner: CAPSTAR TX LIMITED PARTNERSHIP)
- KDHT (93.3 FM; CEDAR PARK, TX; Owner: EMMIS AUSTIN RADIO BROADCASTING COMPANY, L.P.)
- KHHL (98.9 FM; LEANDER, TX; Owner: AMIGO RADIO, LTD.)
- KLBJ-FM (93.7 FM; AUSTIN, TX; Owner: EMMIS AUSTIN RADIO BROADCASTING COMPANY, L.P.)
- KVET-FM (98.1 FM; AUSTIN, TX; Owner: CAPSTAR TX LIMITED PARTNERSHIP)
- KUT (90.5 FM; AUSTIN, TX; Owner: THE UNIVERSITY OF TEXAS AT AUSTIN)
- KINV (107.7 FM; GEORGETOWN, TX; Owner: SIMMONS LONE STAR MEDIA, LTD.)
- KQJZ (92.1 FM; HUTTO, TX; Owner: CENTRAL TEXAS RADIO, INC.)
- KEYI-FM (103.5 FM; SAN MARCOS, TX; Owner: EMMIS AUSTIN RADIO BROADCASTING COMPANY, L.P.)
- KPEZ (102.3 FM; AUSTIN, TX; Owner: CCB TEXAS LICENSES, L.P.)
- KNCT-FM (91.3 FM; KILLEEN, TX; Owner: CENTRAL TEXAS COLLEGE)
- KNLE-FM (88.1 FM; ROUND ROCK, TX; Owner: IXOYE PRODUCTIONS, INC.)
- KQBT (104.3 FM; TAYLOR, TX; Owner: INFINITY RADIO OPERATIONS INC.)
- KAZI (88.7 FM; AUSTIN, TX; Owner: AUSTIN COMMUNITY RADIO)
- K206CF (89.1 FM; AUSTIN, TX; Owner: CALVARY CHAPEL OF TWIN FALLS, INC.)
TV broadcast stations around Cedar Park:
- KTBC (Channel 7; AUSTIN, TX; Owner: KTBC LICENSE, INC.)
- KEYE-TV (Channel 42; AUSTIN, TX; Owner: CBS STATIONS GROUP OF TEXAS L.P.)
- KXAN-TV (Channel 36; AUSTIN, TX; Owner: KXAN, INC.)
- KVUE (Channel 24; AUSTIN, TX; Owner: KVUE TELEVISION, INC.)
- KNVA (Channel 54; AUSTIN, TX; Owner: 54 BROADCASTING, INC.)
- KLRU (Channel 18; AUSTIN, TX; Owner: CAPITAL OF TEXAS PUBLIC TELECOMMUNICATIONS COUNCIL)
- KQUX-CA (Channel 11; AUSTIN, TX; Owner: LOUIS MARTINEZ FAMILY GROUP, LLC)
- KAKW (Channel 62; KILLEEN, TX; Owner: KAKW LICENSE PARTNERSHIP, L.P.)
- KBVO-CA (Channel 49; AUSTIN, TX; Owner: KXAN, INC.)
- K63AY (Channel 63; MULLIN, TX; Owner: MAKO COMMUNICATIONS, LLC)
- KHPX-CA (Channel 48; GEORGETOWN, TX; Owner: KXAN, INC.)
- KHPZ-CA (Channel 64; ROUND ROCK, TX; Owner: KXAN, INC.)
- KADF-LP (Channel 20; AUSTIN, TX; Owner: JOSEPH W. SHAFFER)
- K34FM (Channel 34; AUSTIN, TX; Owner: TRINITY BROADCASTING NETWORK)
- KGBS-CA (Channel 65; AUSTIN, TX; Owner: CABALLERO TELEVISION AUSTIN, INC.)
- KXLK-CA (Channel 67; AUSTIN, TX; Owner: CASA OF AUSTIN, A CALIFORNIA LIMITED PARTNERSHIP)
- KDAS-CA (Channel 31; AUSTIN, TX; Owner: KWEX LICENSE PARTNERSHIP, L.P.)
- K09VR (Channel 9; AUSTIN, TX; Owner: THE UNIVERSITY OF TEXAS AT AUSTIN)
- KNCT (Channel 46; BELTON, TX; Owner: CENTRAL TEXAS COLLEGE)
- KXAM-TV (Channel 14; LLANO, TX; Owner: KXAN, INC)
- National Bridge Inventory (NBI) Statistics
- 93Number of bridges
- 1,749ft / 533mTotal length
- $21,000Total costs
- 1,341,486Total average daily traffic
- 57,028Total average daily truck traffic
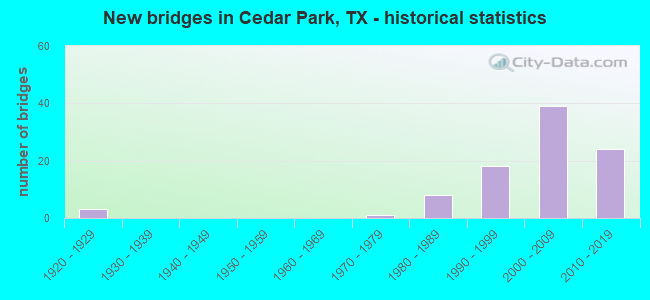
- New bridges - historical statistics
- 31920-1929
- 11970-1979
- 81980-1989
- 181990-1999
- 392000-2009
- 242010-2019
FCC Registered Private Land Mobile Towers: 2 (See the full list of FCC Registered Private Land Mobile Towers in Cedar Park, TX)
FCC Registered Broadcast Land Mobile Towers: 27 (See the full list of FCC Registered Broadcast Land Mobile Towers)
FCC Registered Microwave Towers: 32 (See the full list of FCC Registered Microwave Towers in this town)
FCC Registered Amateur Radio Licenses: 495 (See the full list of FCC Registered Amateur Radio Licenses in Cedar Park)
FAA Registered Aircraft Manufacturers and Dealers: 2 (See the full list of FAA Registered Manufacturers and Dealers in Cedar Park)
FAA Registered Aircraft: 96 (See the full list of FAA Registered Aircraft)
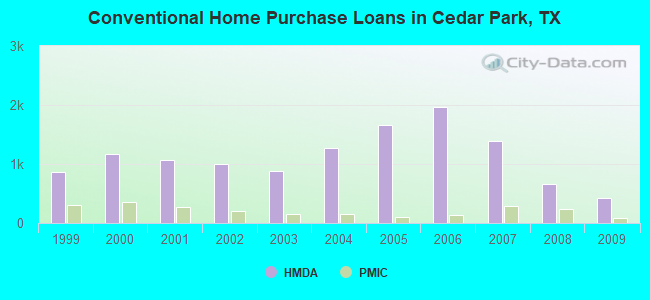
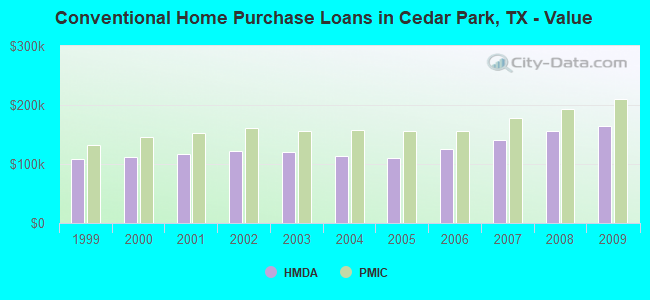
| Home Mortgage Disclosure Act Aggregated Statistics For Year 2009 (Based on 6 partial tracts) | ||||||||||||
| A) FHA, FSA/RHS & VA Home Purchase Loans | B) Conventional Home Purchase Loans | C) Refinancings | D) Home Improvement Loans | F) Non-occupant Loans on < 5 Family Dwellings (A B C & D) | G) Loans On Manufactured Home Dwelling (A B C & D) | |||||||
|---|---|---|---|---|---|---|---|---|---|---|---|---|
| Number | Average Value | Number | Average Value | Number | Average Value | Number | Average Value | Number | Average Value | Number | Average Value | |
| LOANS ORIGINATED | 382 | $183,695 | 421 | $164,839 | 1,018 | $154,865 | 51 | $53,392 | 88 | $127,763 | 0 | $0 |
| APPLICATIONS APPROVED, NOT ACCEPTED | 7 | $173,173 | 24 | $152,053 | 97 | $160,209 | 11 | $33,378 | 6 | $118,937 | 2 | $115,715 |
| APPLICATIONS DENIED | 31 | $171,866 | 40 | $154,064 | 295 | $151,492 | 61 | $39,034 | 26 | $113,773 | 3 | $52,530 |
| APPLICATIONS WITHDRAWN | 39 | $186,523 | 51 | $214,855 | 236 | $155,991 | 19 | $77,647 | 12 | $145,252 | 1 | $53,120 |
| FILES CLOSED FOR INCOMPLETENESS | 5 | $147,514 | 5 | $192,372 | 46 | $165,512 | 2 | $36,770 | 3 | $124,623 | 0 | $0 |
Detailed HMDA statistics for the following Tracts: 0203.05 , 0203.06, 0203.07, 0203.08, 0203.09
| Private Mortgage Insurance Companies Aggregated Statistics For Year 2009 (Based on 6 partial tracts) | ||||||
| A) Conventional Home Purchase Loans | B) Refinancings | C) Non-occupant Loans on < 5 Family Dwellings (A & B) | ||||
|---|---|---|---|---|---|---|
| Number | Average Value | Number | Average Value | Number | Average Value | |
| LOANS ORIGINATED | 79 | $210,564 | 48 | $188,907 | 2 | $216,360 |
| APPLICATIONS APPROVED, NOT ACCEPTED | 20 | $218,480 | 15 | $202,732 | 1 | $242,060 |
| APPLICATIONS DENIED | 11 | $230,138 | 6 | $224,927 | 1 | $77,290 |
| APPLICATIONS WITHDRAWN | 3 | $269,167 | 5 | $213,748 | 0 | $0 |
| FILES CLOSED FOR INCOMPLETENESS | 2 | $219,525 | 0 | $0 | 0 | $0 |
Detailed PMIC statistics for the following Tracts: 0203.05 , 0203.06, 0203.07, 0203.08, 0203.09
2002 - 2018 National Fire Incident Reporting System (NFIRS) incidents
- Fire incident types reported to NFIRS in Cedar Park, TX
- 1,09945.9%Outside Fires
- 93739.2%Structure Fires
- 30012.5%Mobile Property/Vehicle Fires
- 562.3%Other
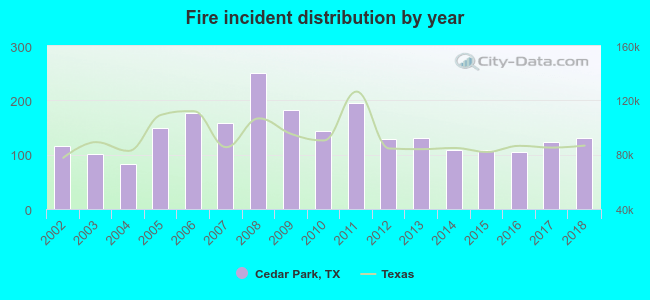 According to the data from the years 2002 - 2018 the average number of fire incidents per year is 141. The highest number of fire incidents - 250 took place in 2008, and the least - 83 in 2004. The data has a growing trend.
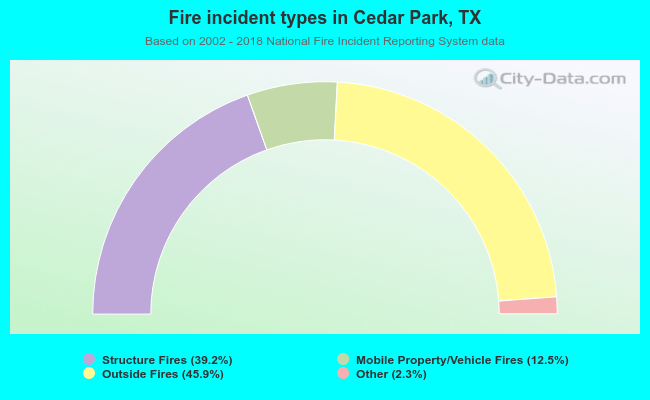 When looking into fire subcategories, the most incidents belonged to: Outside Fires (45.9%), and Structure Fires (39.2%).
Fire-safe hotels and motels in Cedar Park, Texas:
- Holiday Inn Express Hotel & Suites, 1605 E Whitestone Blvd, Cedar Park, Texas 78613 , Phone: (512) 259-8200, Fax: (512) 259-8204
- Comfort Inn, 300 E Whitestone Blvd, Cedar Park, Texas 78613 , Phone: (512) 259-1810
- La Quinta Inn & Suites, 1010 E Whitestone Blvd, Cedar Park, Texas 78613 , Phone: (512) 528-9300, Fax: (512) 528-9432
- Candlewood Suites Cedar Park, 1100 Cottonwood Creek Trl, Cedar Park, Texas 78613 , Phone: (512) 986-4825, Fax: (512) 986-4829
- SpringHill Suites by Marriott Austin Cedar Park, 1110 Discovery Blvd, Cedar park, Texas 78613 , Phone: (512) 260-1200
| Most common first names in Cedar Park, TX among deceased individuals | ||
| Name | Count | Lived (average) |
|---|---|---|
| Mary | 47 | 77.4 years |
| James | 42 | 70.2 years |
| John | 41 | 76.0 years |
| William | 28 | 74.0 years |
| Charles | 27 | 74.3 years |
| Robert | 26 | 70.3 years |
| Dorothy | 19 | 76.5 years |
| Donald | 16 | 61.9 years |
| George | 15 | 76.9 years |
| Helen | 14 | 78.6 years |
| Most common last names in Cedar Park, TX among deceased individuals | ||
| Last name | Count | Lived (average) |
|---|---|---|
| Smith | 21 | 74.5 years |
| Moore | 12 | 67.4 years |
| Jones | 10 | 62.7 years |
| Johnson | 10 | 74.8 years |
| Brown | 9 | 74.3 years |
| Taylor | 8 | 73.9 years |
| Allen | 8 | 78.0 years |
| Hamilton | 8 | 78.1 years |
| Williams | 7 | 71.6 years |
| Davis | 7 | 66.6 years |
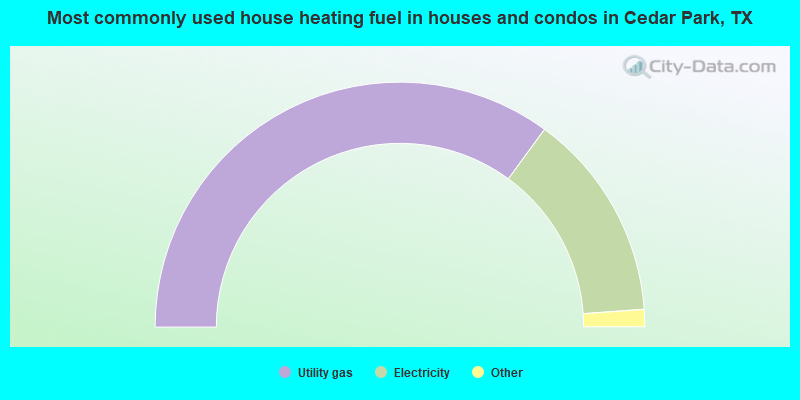
- 70.1%Utility gas
- 27.6%Electricity
- 2.1%Bottled, tank, or LP gas
- 0.1%Solar energy
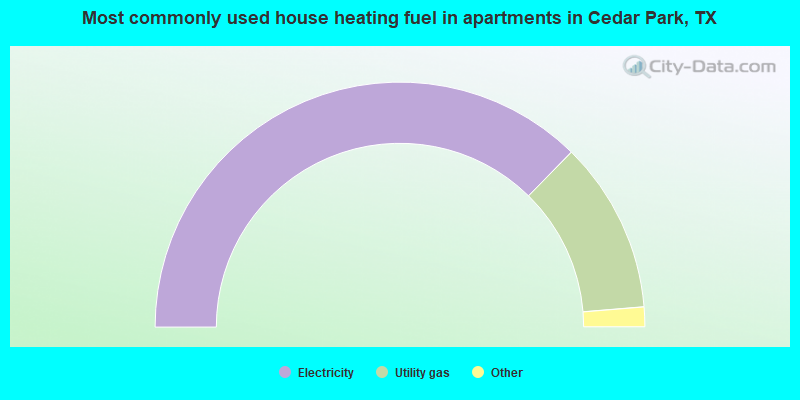
- 74.7%Electricity
- 22.7%Utility gas
- 1.4%Bottled, tank, or LP gas
- 1.2%No fuel used
Cedar Park compared to Texas state average:
- Median household income above state average.
- Median house value above state average.
- Unemployed percentage significantly below state average.
- Foreign-born population percentage significantly above state average.
- Length of stay since moving in significantly below state average.
- House age significantly below state average.
- Number of college students above state average.
- Percentage of population with a bachelor's degree or higher significantly above state average.
Cedar Park on our top lists:
- #7 on the list of "Top 101 cities with the smallest household incomes disparities (population 50,000+)"
- #8 on the list of "Top 100 cities with newest houses (pop. 50,000+)"
- #8 on the list of "Top 101 cities with most building permits per 10,000 residents (population 50,000+)"
- #14 on the list of "Top 101 cities with the lowest number of robberies per 100,000 residents (population 50,000+)"
- #20 on the list of "Top 101 cities with the least people below 50% of the poverty level (population 50,000+)"
- #25 on the list of "Top 100 fastest growing cities from 2000 to 2014 (pop. 50,000+)"
- #28 on the list of "Top 101 cities that people commute from (largest negative percentage daily daytime population change due to commuting) (population 50,000+)"
- #31 on the list of "Top 100 cities with highest median household income and median resident age less than 35 (pop. 50,000+)"
- #35 on the list of "Top 101 cities with largest percentage of females in industries: real estate and rental and leasing (population 50,000+)"
- #38 on the list of "Top 101 cities with largest percentage of males in occupations: computer and mathematical occupations (population 50,000+)"
- #40 on the list of "Top 101 cities with largest percentage of females in occupations: management occupations (population 50,000+)"
- #44 on the list of "Top 101 cities with the least people below the poverty level (population 50,000+)"
- #44 on the list of "Top 101 cities with the lowest number of burglaries per 100,000 residents (population 50,000+)"
- #45 on the list of "Top 101 cities with the smallest house values disparities (population 50,000+)"
- #46 on the list of "Top 101 cities with the lowest number of auto thefts per 100,000 residents (population 50,000+)"
- #49 on the list of "Top 101 cities with largest percentage of males in occupations: architecture and engineering occupations (population 50,000+)"
- #56 on the list of "Top 100 cities with biggest houses (pop. 50,000+)"
- #65 on the list of "Top 101 cities with the lowest city-data.com crime index (population 50,000+)"
- #74 on the list of "Top 100 safest cities (lowest city-data.com crime index) (pop. 50,000+)"
- #75 on the list of "Top 101 cities with the largest percentage of likely lesbian couples (counted as self-reported female-female unmarried-partner households) (population 50,000+)"
- #79 (78613) on the list of "Top 101 zip codes with the smallest percentage of taxpayers using paid preparers for 2012 taxes (pop 5,000+)"
- #7 on the list of "Top 101 counties with the largest number of people moving in compared to moving out (pop. 50,000+)"
- #17 on the list of "Top 101 counties with the lowest number of deaths per 1000 residents 2007-2013 (pop. 50,000+)"
- #21 on the list of "Top 101 counties with the largest number of children under 18 without health insurance coverage in 2000 (pop. 50,000+)"
- #35 on the list of "Top 101 counties with the highest percentage of residents that drank alcohol in the past 30 days"
- #35 on the list of "Top 101 counties with the highest percentage of residents relocating from other counties between 2010 and 2011 (pop. 50,000+)"

|
|
Total of 3803 patent applications in 2008-2024.