Austin, Texas

Austin: Texas Classroom Teachers' Association

Austin: Downtown Austin at Night from South Bank of Town Lake
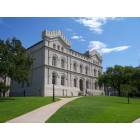
Austin: Capitol Visitor's Center
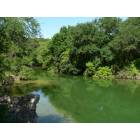
Austin: Barton Creek

Austin: Stevie Ray Vaughan statue, Auditorium Shores
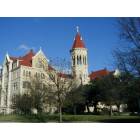
Austin: Saint Edward's University, Austin TX
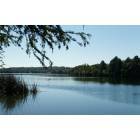
Austin: Town Lake
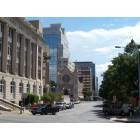
Austin: Congress Avenue
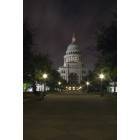
Austin: Capital building at night
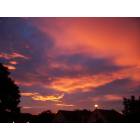
Austin: A North Austin Sunset

Austin: Austin Town Lake Night Time Skyline
- see
153
more - add
your
Submit your own pictures of this city and show them to the world
- OSM Map
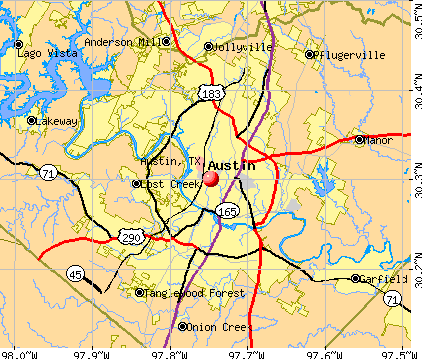
- General Map
- Google Map
- MSN Map
Population change since 2000: +48.4%
| Males: 496,925 | |
| Females: 477,522 |
| Median resident age: | 34.5 years |
| Texas median age: | 35.6 years |
Zip codes: 78610, 78613, 78617, 78641, 78652, 78653, 78660, 78664, 78681, 78701, 78702, 78703, 78704, 78705, 78712, 78717, 78719, 78721, 78722, 78723, 78724, 78725, 78726, 78727, 78728, 78729, 78730, 78731, 78732, 78733, 78734, 78735, 78736, 78737, 78738, 78739, 78741, 78742, 78744, 78745, 78746, 78747, 78748, 78749, 78750, 78751, 78752, 78753, 78754, 78756, 78757, 78758, 78759.
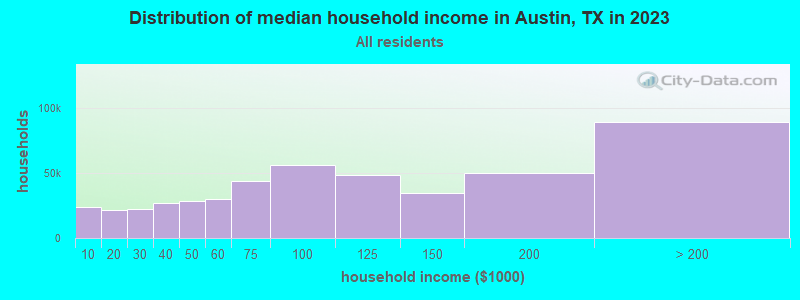
Austin Zip Code Map| Austin: | $89,415 |
| TX: | $72,284 |
Estimated per capita income in 2022: $60,120 (it was $24,163 in 2000)
Austin city income, earnings, and wages data
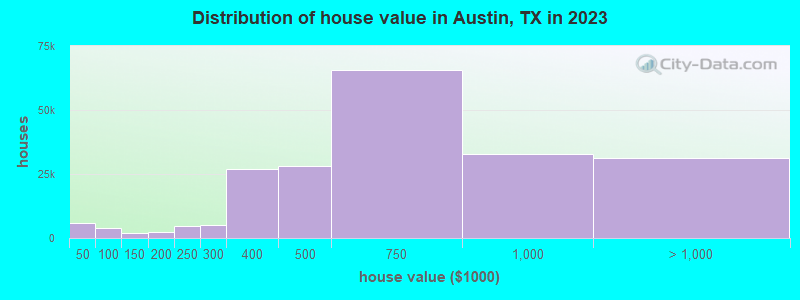
Estimated median house or condo value in 2022: $593,000 (it was $120,800 in 2000)
| Austin: | $593,000 |
| TX: | $275,400 |
Mean prices in 2022: all housing units: $720,900; detached houses: $737,673; townhouses or other attached units: $533,017; in 2-unit structures: over $1,000,000; in 3-to-4-unit structures: $301,152; in 5-or-more-unit structures: $800,345; mobile homes: $105,214
Median gross rent in 2022: $1,581.
(7.0% for White Non-Hispanic residents, 13.0% for Black residents, 16.5% for Hispanic or Latino residents, 20.0% for American Indian residents, 30.1% for Native Hawaiian and other Pacific Islander residents, 17.5% for other race residents, 11.9% for two or more races residents)
Detailed information about poverty and poor residents in Austin, TX


Compare current foreclosures in Austin, TX:
| Photo | Address | Area | Beds / Baths | Price | Details |
|---|---|---|---|---|---|

|
#1
N Redondo Dr
Austin, TX 78721
|
972 sq. feet
|
1 baths 3 beds |
$339,900
|
show details |

|
#2
Hycreek Dr
Austin, TX 78723
|
2,040 sq. feet
|
3 baths 4 beds |
$449,900
|
show details |

|
#3
Sigman Ln
Austin, TX 78723
|
1,864 sq. feet
|
2 baths 3 beds |
show details | |

|
#4
E Croslin St Apt 113
Austin, TX 78752
|
919 sq. feet
|
2 baths 2 beds |
show details | |

|
#5
Bubbling Springs Trl
Austin, TX 78729
|
1,792 sq. feet
|
2 baths 4 beds |
show details | |

|
#6
Knockfin Dr
Austin, TX 78744
|
- sq. feet
|
4 baths 5 beds |
show details | |

|
#7
Summer Alcove Way
Austin, TX 78732
|
4,148 sq. feet
|
3 baths 4 beds |
show details | |

|
#8
Manchaca Rd Apt 43
Austin, TX 78704
|
1,586 sq. feet
|
3 baths 2 beds |
show details | |

|
#9
Ronee Leah Dr
Austin, TX 78724
|
2,047 sq. feet
|
2 baths 4 beds |
show details | |

|
#10
Geneva Dr
Austin, TX 78723
|
1,756 sq. feet
|
1 baths 4 beds |
show details |
| Photo | Address | Area | Beds / Baths | Price | Details |
|---|---|---|---|---|---|

|
#11
Copperstone Ave
Austin, TX 78748
|
1,749 sq. feet
|
2 baths 4 beds |
show details | |

|
#12
Conejo Dr
Austin, TX 78734
|
2,554 sq. feet
|
2 baths 3 beds |
show details | |

|
#13
Southwick Dr
Austin, TX 78724
|
1,429 sq. feet
|
2 baths 3 beds |
show details | |

|
#14
Mcintyre Cir
Austin, TX 78734
|
4,729 sq. feet
|
4 baths 4 beds |
show details | |

|
#15
Nesting Way
Austin, TX 78744
|
1,608 sq. feet
|
2 baths 3 beds |
show details | |

|
#16
Howerington Cir
Austin, TX 78724
|
870 sq. feet
|
1 baths - beds |
show details | |

|
#17
Spicewood Pkwy
Austin, TX 78750
|
3,145 sq. feet
|
2 baths - beds |
show details | |

|
#18
Rolling Green Dr
Austin, TX 78734
|
2,289 sq. feet
|
3 baths 4 beds |
show details | |

|
#19
Scales St
Austin, TX 78723
|
1,422 sq. feet
|
2 baths - beds |
show details | |

|
#20
Clearock Dr
Austin, TX 78750
|
2,965 sq. feet
|
2 baths - beds |
show details |
| Photo | Address | Area | Beds / Baths | Price | Details |
|---|---|---|---|---|---|

|
#21
Minerva St
Austin, TX 78753
|
3,302 sq. feet
|
2 baths - beds |
show details | |

|
#22
Barcelona Dr
Austin, TX 78752
|
2,096 sq. feet
|
2 baths - beds |
show details | |

|
#23
Banbridge Trl
Austin, TX 78717
|
2,448 sq. feet
|
2 baths - beds |
show details | |

|
#24
Calaveras Dr
Austin, TX 78717
|
2,612 sq. feet
|
2 baths - beds |
show details | |

|
#25
Misty Hill Cv
Austin, TX 78759
|
2,544 sq. feet
|
2 baths - beds |
show details | |

|
#26
Bridgeport Dr
Austin, TX 78758
|
1,242 sq. feet
|
2 baths - beds |
show details | |

|
#27
E 56th St
Austin, TX 78751
|
572 sq. feet
|
1 baths - beds |
show details | |

|
#28
Eskew Dr
Austin, TX 78749
|
1,459 sq. feet
|
2 baths - beds |
show details | |

|
#29
Cedar Ave
Austin, TX 78722
|
1,294 sq. feet
|
1 baths - beds |
show details | |

|
#30
Rutherglen Dr
Austin, TX 78749
|
1,681 sq. feet
|
2 baths - beds |
show details |
| Photo | Address | Area | Beds / Baths | Price | Details |
|---|---|---|---|---|---|

|
#31
Church Canyon Dr
Austin, TX 78754
|
1,378 sq. feet
|
2 baths - beds |
show details | |

|
#32
Deaf Smith Blvd
Austin, TX 78725
|
1,587 sq. feet
|
2 baths - beds |
show details | |

|
#33
Yellowleaf Trl
Austin, TX 78728
|
1,335 sq. feet
|
2 baths - beds |
show details | |

|
#34
Waterside Trl
Austin, TX 78750
|
1,742 sq. feet
|
2 baths - beds |
show details | |

|
#35
Bahama Rd
Austin, TX 78733
|
1,232 sq. feet
|
2 baths - beds |
show details | |

|
#36
Clearbrook Trl
Austin, TX 78729
|
2,058 sq. feet
|
4 baths - beds |
show details | |

|
#37
Lake Stone Dr
Austin, TX 78738
|
1,838 sq. feet
|
2 baths - beds |
show details | |

|
#38
Irongate Cir
Austin, TX 78727
|
1,188 sq. feet
|
2 baths - beds |
show details | |

|
#39
Burnhill Dr
Austin, TX 78745
|
1,531 sq. feet
|
1 baths - beds |
show details | |

|
#40
Almarion Way
Austin, TX 78746
|
1,782 sq. feet
|
1 baths - beds |
show details |
| Photo | Address | Area | Beds / Baths | Price | Details |
|---|---|---|---|---|---|

|
#41
E 2nd St
Austin, TX 78702
|
550 sq. feet
|
1 baths - beds |
show details | |

|
#42
Mateo Cv
Austin, TX 78717
|
2,806 sq. feet
|
2 baths - beds |
show details | |

|
#43
Brodie Ln Unit 4103
Austin, TX 78748
|
1,550 sq. feet
|
2 baths - beds |
show details | |

|
#44
Shanghai Pierce Rd
Austin, TX 78749
|
1,752 sq. feet
|
2 baths - beds |
show details | |

|
#45
Barkley Dr
Austin, TX 78727
|
1,632 sq. feet
|
2 baths - beds |
show details | |

|
#46
Colfax Dr
Austin, TX 78724
|
1,024 sq. feet
|
1 baths - beds |
show details | |

|
#47
Rodriguez Rd # A
Austin, TX 78747
|
3,350 sq. feet
|
2 baths - beds |
show details | |

|
#48
Stoney Creek Cv
Austin, TX 78734
|
1,794 sq. feet
|
2 baths - beds |
show details | |

|
#49
E 13th St
Austin, TX 78702
|
616 sq. feet
|
2 baths - beds |
show details | |

|
Check over 1 million property listings on Foreclosure.com!
|
browse all offers | |||


- 455,98446.8%White alone
- 322,77633.1%Hispanic
- 78,7448.1%Asian alone
- 71,0067.3%Black alone
- 39,7754.1%Two or more races
- 5,6780.6%Other race alone
- 8430.09%American Indian alone
- 5290.05%Native Hawaiian and Other
Pacific Islander alone
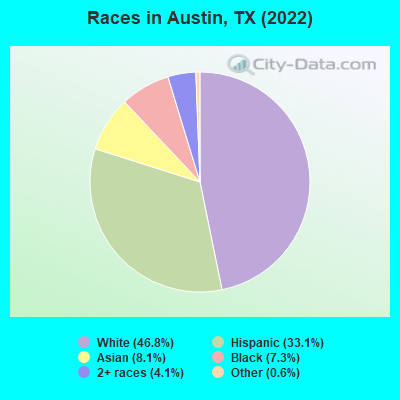
Races in Austin detailed stats: ancestries, foreign born residents, place of birth
According to our research of Texas and other state lists, there were 1,428 registered sex offenders living in Austin, Texas as of April 26, 2024.
The ratio of all residents to sex offenders in Austin is 664 to 1.
The ratio of registered sex offenders to all residents in this city is lower than the state average.
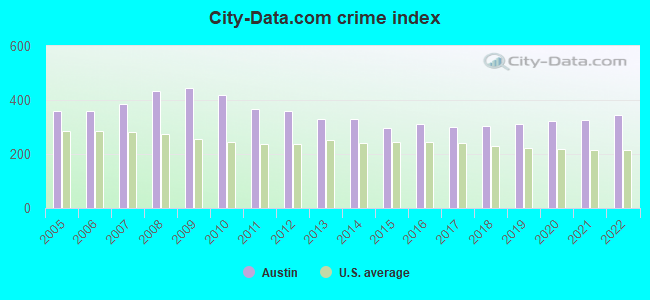
The City-Data.com crime index weighs serious crimes and violent crimes more heavily. Higher means more crime, U.S. average is 246.1. It adjusts for the number of visitors and daily workers commuting into cities.
- means the value is smaller than the state average.- means the value is about the same as the state average.
- means the value is bigger than the state average.
- means the value is much bigger than the state average.
Crime rate in Austin detailed stats: murders, rapes, robberies, assaults, burglaries, thefts, arson
Full-time law enforcement employees in 2021, including police officers: 2,087 (1,613 officers - 1,436 male; 177 female).
| Officers per 1,000 residents here: | 1.59 |
| Texas average: | 2.07 |
 Recent articles from our blog. Our writers, many of them Ph.D. graduates or candidates, create easy-to-read articles on a wide variety of topics.

 | Why tech talent is in the process of abandoning Austin (34 replies) |
| Austin Trip Reflection (30 replies) |
| Let’s be honest. What’s your take on Austin and newcomers? (42 replies) |
| How much longer does Austin have? (338 replies) |
| UT Austin Policy Report Shows Austin's the Only Fast-Growing City Losing African-Americans (150 replies) |
| Latest crime statistics for Austin, 2016 (2 replies) |
Latest news from Austin, TX collected exclusively by city-data.com from local newspapers, TV, and radio stations
Ancestries: English (5.0%), German (5.0%), European (3.8%), American (3.8%), Irish (3.6%), Italian (1.4%).
Current Local Time: CST time zone
Elevation: 501 feet
Land area: 251.5 square miles.
Population density: 3,874 people per square mile (average).
181,712 residents are foreign born (9.0% Latin America, 6.3% Asia).
| This city: | 18.4% |
| Texas: | 17.1% |
Median real estate property taxes paid for housing units with mortgages in 2022: $7,844 (1.3%)
Median real estate property taxes paid for housing units with no mortgage in 2022: $7,023 (1.3%)
Nearest city with pop. 1,000,000+: San Antonio, TX  (74.5 miles , pop. 1,144,646).
Nearest cities:
), ), ), ), ), )Latitude: 30.30 N, Longitude: 97.75 W
Daytime population change due to commuting: +185,005 (+19.0%)
Workers who live and work in this city: 518,254 (87.6%)
Area code: 512
Property values in Austin, TX
Detailed articles:
- Austin: Introduction
- Austin Basic Facts
- Austin: Communications
- Austin: Convention Facilities
- Austin: Economy
- Austin: Education and Research
- Austin: Geography and Climate
- Austin: Health Care
- Austin: History
- Austin: Municipal Government
- Austin: Population Profile
- Austin: Recreation
- Austin: Transportation
Austin tourist attractions:
- Austin Arboretum Area
- Austin-Bergstrom International Airport
- Austin City Limits Music Festival
- Austin Downtown Area
- Austin Film Festival
- Austin Lyrics Opera
- Arboretum neighborhood in Austin
- Ballet Austin
- Barton Creek Resort & Spa, Fazio Canyons Course, Austin, Texas - A Tom Fazio Signature Golf Course in the Hill Country Outside Austin
- Barton Creek Resort & Spa, Fazio Foothills Course, Austin, Texas - A Tom Fazio Signature Golf Course With Plenty of Visual Impact and Challenge
- Barton Creek Square, Austin, Texas
- Barton Hills Neighborhood in Austin
- Barton Springs Pool in Austin
- Blanton Museum of Art
- Bouldin Creek Neighborhood in Austin
- Brentwood Neighborhood in Austin
- Clarksville District neighborhood in Austin
- Deep Eddy Pool in Austin
- Four Seasons Hotel Austin
- Highland Mall, Austin, TX
- Highland Mall - Austin, TX - Two-floor shopping mall
- Hill Country Galleria - Austin, TX - Popular lifestyle center
- Hyde Park Neighborhood in Austin
- InterContinental Stephen F. Austin Hotel
- Lake Travis, a popular place for outdoor and water recreation
- Lakeway Resort and Spa in Austin
- Barton Creek Resort & Spa
- Hyatt Regency Austin
- Renaissance Austin Hotel
- Hilton Austin
- Hampton Inn & Suites Austin Downtown
- Mansion at Judges' Hill
- Radisson Hotel & Suites Austin-Town Lake
- Doubletree Guest Suites Austin
- The Crossings
- Embassy Suites Austin - Downtown/Town Lake Austin Texas
- Old West Austin Historic District
- Oltorf Neighborhood in Austin
- Sixth Street in Austin
- Tarrytown Neighborhood in Austin
- The Arboretum - Austin, TX - Upscale shopping center
- The Domain - Austin, TX - Luxury shopping complex
- The Paramount Theater in Austin
- Travis County Expo Center
- Travis Heights Neighborhood in Austin
- West Campus Neighborhood in Austin
Austin, Texas accommodation & food services, waste management - Economy and Business Data
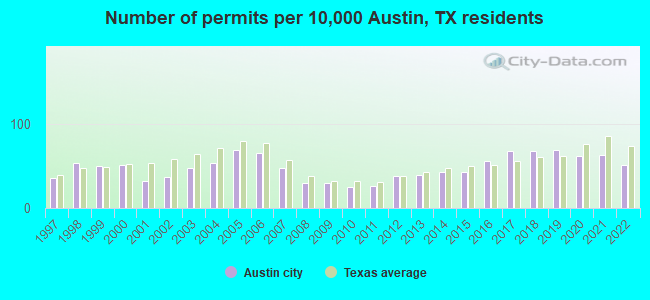
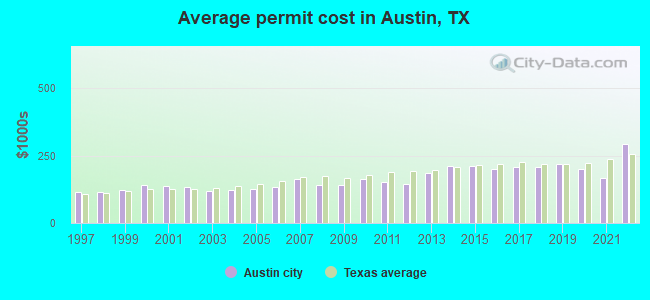
Single-family new house construction building permits:
- 2022: 3344 buildings, average cost: $292,000
- 2021: 4180 buildings, average cost: $167,300
- 2020: 4113 buildings, average cost: $201,000
- 2019: 4568 buildings, average cost: $218,000
- 2018: 4433 buildings, average cost: $208,400
- 2017: 4440 buildings, average cost: $208,300
- 2016: 3705 buildings, average cost: $202,400
- 2015: 2846 buildings, average cost: $211,200
- 2014: 2800 buildings, average cost: $209,800
- 2013: 2573 buildings, average cost: $184,600
- 2012: 2539 buildings, average cost: $146,400
- 2011: 1713 buildings, average cost: $151,000
- 2010: 1664 buildings, average cost: $162,200
- 2009: 1951 buildings, average cost: $139,900
- 2008: 1928 buildings, average cost: $139,500
- 2007: 3155 buildings, average cost: $165,100
- 2006: 4340 buildings, average cost: $135,100
- 2005: 4569 buildings, average cost: $127,600
- 2004: 3533 buildings, average cost: $120,600
- 2003: 3117 buildings, average cost: $120,000
- 2002: 2431 buildings, average cost: $133,400
- 2001: 2119 buildings, average cost: $136,600
- 2000: 3361 buildings, average cost: $141,200
- 1999: 3302 buildings, average cost: $124,400
- 1998: 3521 buildings, average cost: $116,000
- 1997: 2380 buildings, average cost: $113,500
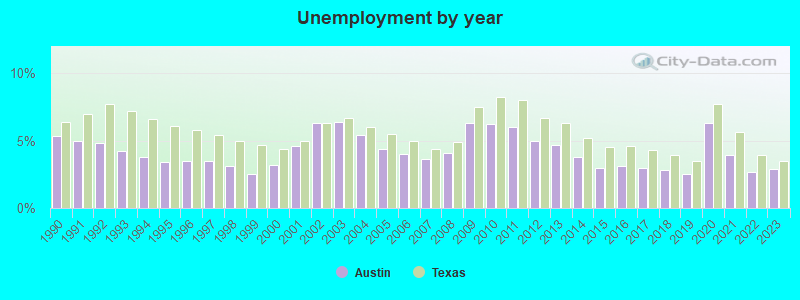
| Here: | 2.9% |
| Texas: | 3.5% |
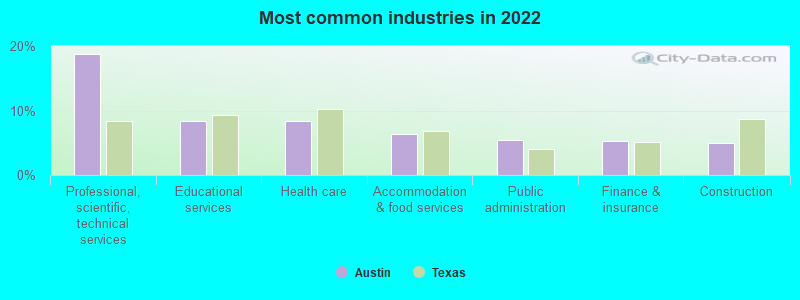
- Professional, scientific, technical services (18.8%)
- Educational services (8.4%)
- Health care (8.4%)
- Accommodation & food services (6.3%)
- Public administration (5.4%)
- Finance & insurance (5.2%)
- Construction (5.0%)
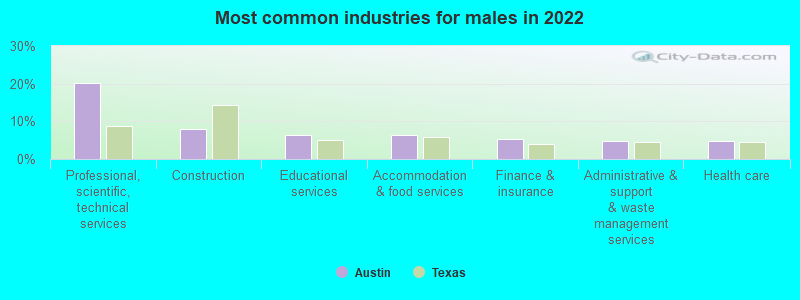
- Professional, scientific, technical services (20.3%)
- Construction (7.9%)
- Educational services (6.4%)
- Accommodation & food services (6.4%)
- Finance & insurance (5.4%)
- Administrative & support & waste management services (4.9%)
- Health care (4.8%)
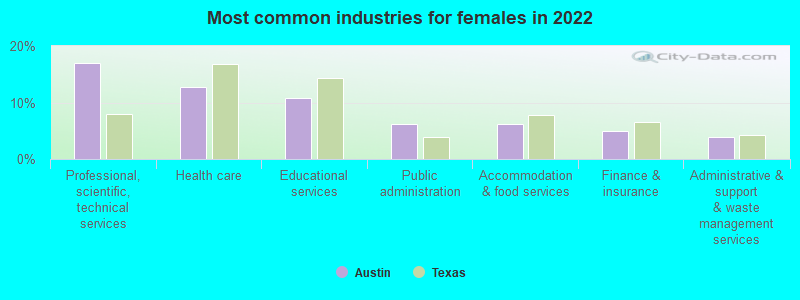
- Professional, scientific, technical services (17.0%)
- Health care (12.7%)
- Educational services (10.8%)
- Public administration (6.3%)
- Accommodation & food services (6.2%)
- Finance & insurance (5.0%)
- Administrative & support & waste management services (3.9%)
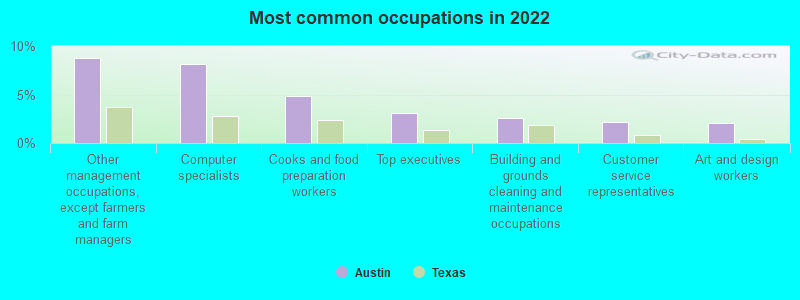
- Other management occupations, except farmers and farm managers (8.7%)
- Computer specialists (8.2%)
- Cooks and food preparation workers (4.8%)
- Top executives (3.1%)
- Building and grounds cleaning and maintenance occupations (2.6%)
- Customer service representatives (2.1%)
- Art and design workers (2.1%)
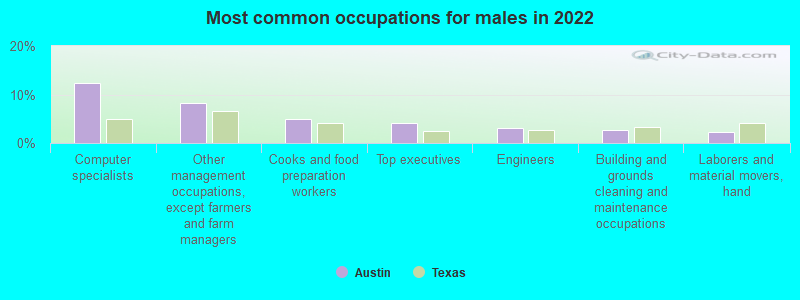
- Computer specialists (12.3%)
- Other management occupations, except farmers and farm managers (8.3%)
- Cooks and food preparation workers (5.0%)
- Top executives (4.2%)
- Engineers (3.1%)
- Building and grounds cleaning and maintenance occupations (2.8%)
- Laborers and material movers, hand (2.4%)
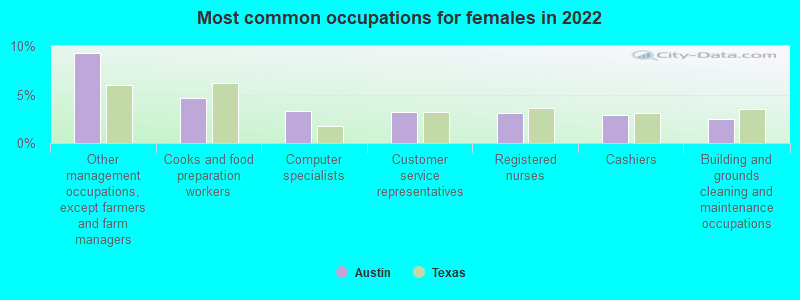
- Other management occupations, except farmers and farm managers (9.3%)
- Cooks and food preparation workers (4.6%)
- Computer specialists (3.3%)
- Customer service representatives (3.2%)
- Registered nurses (3.1%)
- Cashiers (2.8%)
- Building and grounds cleaning and maintenance occupations (2.4%)
Average climate in Austin, Texas
Based on data reported by over 4,000 weather stations


|
|

(lower is better)
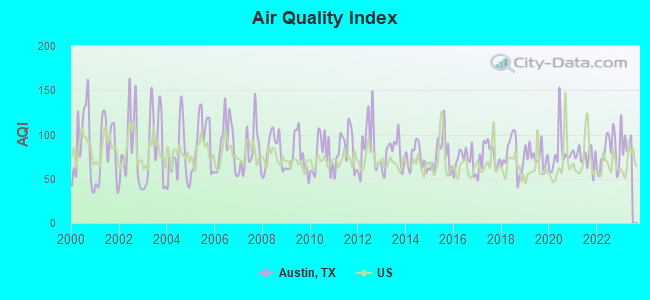
Air Quality Index (AQI) level in 2022 was 78.6. This is about average.
| City: | 78.6 |
| U.S.: | 72.6 |
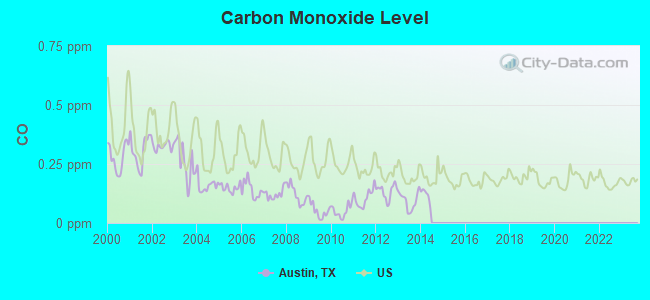
Carbon Monoxide (CO) [ppm] level in 2013 was 0.0938. This is significantly better than average. Closest monitor was 1.7 miles away from the city center.
| City: | 0.0938 |
| U.S.: | 0.2513 |
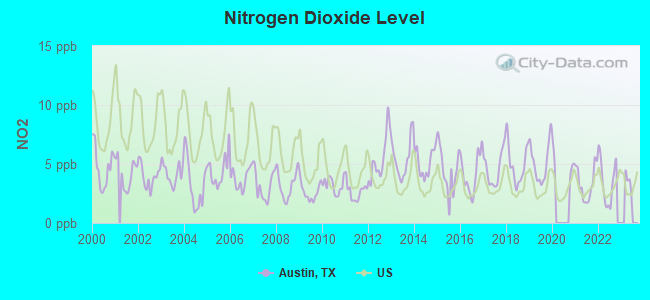
Nitrogen Dioxide (NO2) [ppb] level in 2022 was 3.48. This is significantly better than average. Closest monitor was 1.7 miles away from the city center.
| City: | 3.48 |
| U.S.: | 5.11 |
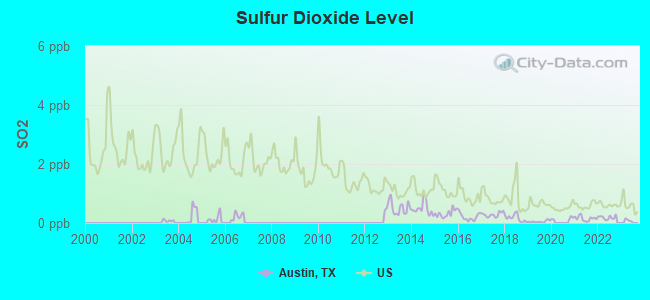
Sulfur Dioxide (SO2) [ppb] level in 2022 was 0.186. This is significantly better than average. Closest monitor was 1.7 miles away from the city center.
| City: | 0.186 |
| U.S.: | 1.515 |
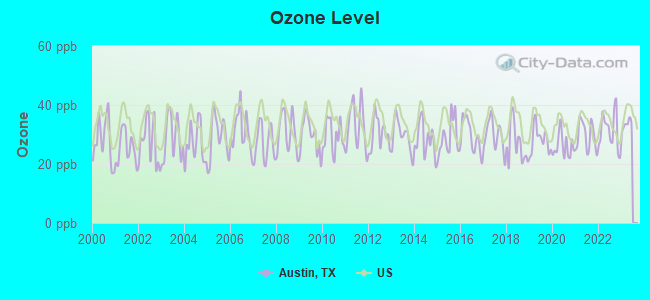
Ozone [ppb] level in 2022 was 31.3. This is about average. Closest monitor was 1.7 miles away from the city center.
| City: | 31.3 |
| U.S.: | 33.3 |
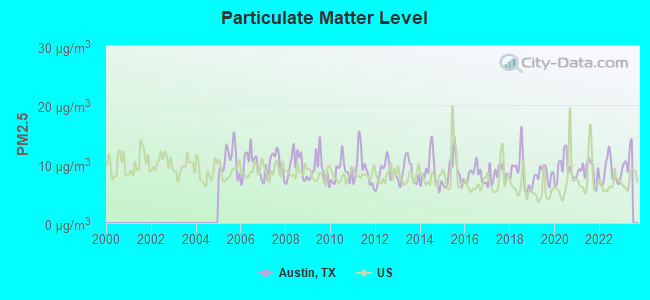
Particulate Matter (PM2.5) [µg/m3] level in 2022 was 8.41. This is about average. Closest monitor was 3.3 miles away from the city center.
| City: | 8.41 |
| U.S.: | 8.11 |
Tornado activity:
Austin-area historical tornado activity is near Texas state average. It is 38% greater than the overall U.S. average.
On 5/27/1997, a category F4 (max. wind speeds 207-260 mph) tornado 14.0 miles away from the Austin city center killed one person and injured 5 people and caused $15 million in damages.
On 5/27/1997, a category F5 (max. wind speeds 261-318 mph) tornado 32.8 miles away from the city center killed 27 people and injured 12 people and caused $40 million in damages.
Earthquake activity:
Austin-area historical earthquake activity is significantly above Texas state average. It is 20% smaller than the overall U.S. average.On 10/20/2011 at 12:24:41, a magnitude 4.8 (4.8 MW, Depth: 3.1 mi, Class: Light, Intensity: IV - V) earthquake occurred 101.3 miles away from the city center
On 6/16/1978 at 11:46:54, a magnitude 5.3 (4.4 MB, 4.6 UK, 5.3 ML, Class: Moderate, Intensity: VI - VII) earthquake occurred 259.3 miles away from Austin center
On 4/14/1995 at 00:32:56, a magnitude 5.7 (5.6 MB, 5.7 MS, 5.7 MW, Depth: 11.1 mi) earthquake occurred 335.6 miles away from the city center
On 4/9/1993 at 12:29:19, a magnitude 4.3 (4.1 MB, 4.3 LG, Depth: 3.1 mi) earthquake occurred 105.5 miles away from Austin center
On 5/17/2012 at 08:12:00, a magnitude 4.8 (4.8 MW, Depth: 3.1 mi) earthquake occurred 229.5 miles away from Austin center
On 5/1/2018 at 16:28:56, a magnitude 4.0 (4.0 MW, Depth: 3.1 mi) earthquake occurred 94.8 miles away from the city center
Magnitude types: regional Lg-wave magnitude (LG), body-wave magnitude (MB), local magnitude (ML), surface-wave magnitude (MS), moment magnitude (MW)
Natural disasters:
The number of natural disasters in Travis County (29) is a lot greater than the US average (15).Major Disasters (Presidential) Declared: 11
Emergencies Declared: 9
Causes of natural disasters: Fires: 11, Storms: 10, Floods: 9, Hurricanes: 7, Tornadoes: 4, Winds: 2, Other: 1 (Note: some incidents may be assigned to more than one category).

Main business address for: FORGENT NETWORKS INC (SERVICES-COMPUTER INTEGRATED SYSTEMS DESIGN), AMERICAN PHYSICIANS SERVICE GROUP INC (SERVICES-MANAGEMENT SERVICES), PROFUTURES DIVERSIFIED FUND L P (REAL ESTATE INVESTMENT TRUSTS), TRAVIS BOATS & MOTORS INC (RETAIL-AUTO & HOME SUPPLY STORES), AAC Group Holding Corp. (JEWELRY, PRECIOUS METAL), BRIGHAM EXPLORATION CO (CRUDE PETROLEUM & NATURAL GAS), ACTIVANT SOLUTIONS INC /DE/ (SERVICES-COMPUTER INTEGRATED SYSTEMS DESIGN), HEALTHTRONICS, INC. (ELECTROMEDICAL & ELECTROTHERAPEUTIC APPARATUS) and 36 other public companies.
Hospitals in Austin:
- ALLANDALE (6110 A BULLARD DR)
- AUTUMN RIDGE (11605 AUTUMN RIDGE)
- CENTRAL TEXAS REHABILITATION HOSPITAL (provides emergency services, 1201 WEST 38TH STREET, 8TH FL NORTH, SUITE 810)
- CRAIG DRIVE (4901 CRAIG DR)
- GRANT HOUSE (11602 FLINNWOOD CIR)
- MARY LEE FOUNDATION SOUTHPOINTE I I (1336 LAMAR SQUARE DR)
- PILGRIMS PLACE (8204 PILGRIMS PL)
- SETON MEDICAL CENTER AUSTIN (Voluntary non-profit - Private, 1201 W 38TH ST)
- ST DAVIDS PAVILION (919 EAST 32ND STREET)
- UNIVERSITY MEDICAL CENTER AT BRACKENRIDGE (Voluntary non-profit - Private, provides emergency services, 601 E 15TH STREET)
Airports and heliports located in Austin:
- Austin-Bergstrom International Airport (AUS) (Runways: 5, Commercial Ops: 105,995, Air Taxi Ops: 16,640, Itinerant Ops: 51,110, Local Ops: 2,598, Military Ops: 6,973)
- Austin Executive Airport (EDC) (Runways: 2, Itinerant Ops: 11,700, Local Ops: 6,300)
- Bud Dryden Airport (TX05) (Runways: 1)
- Heliports: 18
Biggest Colleges/Universities in Austin:
- The University of Texas at Austin (Full-time enrollment: 45,500; Location: 2400 Inner Campus Drive; Public; Website: www.utexas.edu; Offers Doctor's degree)
- Austin Community College District (Full-time enrollment: 25,957; Location: 5930 Middle Fiskville Rd; Public; Website: www.austincc.edu)
- Saint Edward's University (Full-time enrollment: 4,308; Location: 3001 S Congress Ave; Private, not-for-profit; Website: www.stedwards.edu; Offers Master's degree)
- Concordia University-Texas (Full-time enrollment: 2,192; Location: 11400 Concordia University Dr.; Private, not-for-profit; Website: www.concordia.edu; Offers Master's degree)
- The Art Institute of Austin (Full-time enrollment: 1,587; Location: 101 W. Louis Henna Blvd, Suite 100; Private, for-profit; Website: www.artinstitutes.edu/austin/)
- Everest Institute-Austin (Full-time enrollment: 1,484; Location: 9100 US Hwy 290 East, Bldg 1-Ste 100; Private, for-profit; Website: www.everest.edu/campus/austin)
- Le Cordon Bleu College of Culinary Arts-Austin (Full-time enrollment: 977; Location: 3110 Esperanza Crossing, Suite 100; Private, for-profit; Website: www.chefs.edu/Austin)
- Strayer University-Texas (Full-time enrollment: 966; Location: 8501 N. Mopac Expressway; Private, for-profit; Website: www.strayer.edu/texas/north-austin; Offers Master's degree)
- Huston-Tillotson University (Full-time enrollment: 666; Location: 900 Chicon St; Private, not-for-profit; Website: www.htu.edu)
- University of Phoenix-Austin Campus (Full-time enrollment: 546; Location: 10801 N Mo-Pac; Private, for-profit; Website: www.phoenix.edu; Offers Master's degree)
- Southern Careers Institute-Austin (Full-time enrollment: 543; Location: 2301 S Congress Ste 27; Private, for-profit; Website: www.scitexas.edu)
- ITT Technical Institute-Austin (Full-time enrollment: 510; Location: 6330 Highway 290 East, Ste 150; Private, for-profit; Website: www.itt-tech.edu)
- Virginia College-Austin (Full-time enrollment: 475; Location: 6301 E Highway 290; Private, for-profit; Website: vc.edu)
- Avenue Five Institute (Full-time enrollment: 280; Location: 8620 Burnet Rd Ste 300; Private, for-profit; Website: www.avenuefive.com)
- The College of Health Care Professions-Austin (Full-time enrollment: 256; Location: 6505 Airport Blvd, Suite 102; Private, for-profit; Website: www.chcp.edu)
- Allied Health Careers (Full-time enrollment: 246; Location: 5424 Hwy 290 W Ste 105; Private, for-profit; Website: alliedhealthcareers.net)
- Auguste Escoffier School of Culinary Arts-Austin (Full-time enrollment: 244; Location: 6020-B Dillard Circle; Private, for-profit; Website: www.escoffier.edu)
- AOMA Graduate School of Integrative Medicine (Full-time enrollment: 244; Location: 4701 W Gate Blvd; Private, for-profit; Website: https://aoma.edu/; Offers Master's degree)
- Capitol City Trade and Technical School (Full-time enrollment: 229; Location: 205 E Riverside Dr; Private, for-profit; Website: capcitytradetech.com)
- National American University-Austin (Full-time enrollment: 225; Location: 13801 Burnet Road, Suite 300; Private, for-profit; Website: www.national.edu/locations/texas/austin)
Other colleges/universities with over 2000 students near Austin:
- Texas State University (about 31 miles; San Marcos, TX; Full-time enrollment: 29,202)
- University of Mary Hardin-Baylor (about 56 miles; Belton, TX; FT enrollment: 2,885)
- Central Texas College (about 57 miles; Killeen, TX; FT enrollment: 15,911)
- Temple College (about 59 miles; Temple, TX; FT enrollment: 3,796)
- University of the Incarnate Word (about 72 miles; San Antonio, TX; FT enrollment: 6,875)
- The University of Texas at San Antonio (about 73 miles; San Antonio, TX; FT enrollment: 25,503)
- Trinity University (about 73 miles; San Antonio, TX; FT enrollment: 2,467)
Biggest public high schools in Austin:
- BOWIE H S (Students: 2,813, Location: 4103 W SLAUGHTER LN, Grades: 9-12)
- MCNEIL H S (Students: 2,783, Location: 5720 MCNEIL DR, Grades: 9-12)
- AKINS H S (Students: 2,676, Location: 10701 S 1ST ST, Grades: 9-12)
- WESTLAKE H S (Students: 2,479, Location: 4100 WESTBANK DR, Grades: 9-12)
- WESTWOOD H S (Students: 2,443, Location: 12400 MELLOW MEADOW DR, Grades: 9-12)
- JOHN B CONNALLY H S (Students: 2,081, Location: 13212 N LAMAR, Grades: 9-12)
- LAKE TRAVIS H S (Students: 1,955, Location: 3324 RANCH RD 620 S, Grades: 9-12)
- MCCALLUM H S (Students: 1,771, Location: 5600 SUNSHINE DR, Grades: 9-12)
- CROCKETT H S (Students: 1,741, Location: 5601 MANCHACA RD, Grades: 9-12)
- LANIER H S (Students: 1,459, Location: 1201 PEYTON GIN RD, Grades: 9-12)
Biggest private high schools in Austin:
- REGENTS SCHOOL OF AUSTIN (Students: 943, Location: 3230 TRAVIS COUNTRY CIR, Grades: KG-12)
- BRENTWOOD CHRISTIAN SCHOOL (Students: 711, Location: 11908 N LAMAR BLVD, Grades: PK-12)
- ST STEPHENS EPISCOPAL SCHOOL (Students: 683, Location: 6500 SAINT STEPHENS DR, Grades: 6-12)
- HYDE PARK BAPTIST SCHOOL (Students: 524, Location: 3901 SPEEDWAY, Grades: KG-12)
- HILL COUNTRY CHRISTIAN SCHOOL OF AUSTIN (Students: 503, Location: 12124 RANCH ROAD 620 N, Grades: PK-12)
- VERITAS ACADEMY (Students: 479, Location: 4220 MONTEREY OAKS BLVD, Grades: PK-12)
- AUSTIN WALDORF SCHOOL (Students: 393, Location: 8700 SOUTH VIEW RD, Grades: KG-12)
- ST MICHAEL'S CATHOLIC ACADEMY (Students: 388, Location: 3000 BARTON CREEK BLVD, Grades: 9-12)
- AUSTIN PEACE ACADEMY (Students: 337, Location: 5110 MANOR RD, Grades: PK-12)
- AUSTIN MONTESSORI SCHOOL (Students: 318, Location: 5006 SUNSET TRL, Grades: PK-9)
Biggest public elementary/middle schools in Austin:
- ANDERSON MILL EL (Students: 1,997, Location: 10610 SALT MILL HOLLOW, Grades: PK-5)
- TRAVIS HTS EL (Students: 1,344, Location: 2010 ALAMEDA DR, Grades: PK-5, Charter school)
- MURCHISON M S (Students: 1,244, Location: 3700 N HILLS DR, Grades: 6-8)
- KEALING M S (Students: 1,241, Location: 1607 PENNSYLVANIA AVE, Grades: 6-8)
- CANYON RIDGE MIDDLE (Students: 1,210, Location: 12601 COUNTRY TRAILS LN, Grades: 6-8)
- CEDAR VALLEY MIDDLE (Students: 1,185, Location: 8139 RACINE TRL, Grades: 6-8)
- CANYON VISTA MIDDLE (Students: 1,135, Location: 8455 SPICEWOOD SPRINGS RD, Grades: 6-8)
- MILLS EL (Students: 1,099, Location: 6201 DAVIS LN, Grades: PK-5)
- DESSAU MIDDLE (Students: 1,027, Location: 12900 DESSAU RD, Grades: 6-8)
- BEDICHEK M S (Students: 1,021, Location: 6800 BILL HUGHES RD, Grades: 6-8)
Biggest private elementary/middle schools in Austin:
- REDEEMER LUTHERAN SCHOOL (Students: 490, Location: 1500 W ANDERSON LN, Grades: PK-8)
- HOLY FAMILY CATHOLIC SCHOOL (Students: 486, Location: 9400 NEENAH AVE, Grades: PK-8)
- ST THERESAS CATHOLIC SCHOOL (Students: 426, Location: 4311 SMALL DR, Grades: PK-8)
- ST GABRIEL'S CATHOLIC SCHOOL (Students: 380, Location: 2500 WIMBERLY LN, Grades: PK-8)
- ST FRANCIS SCHOOL (Students: 377, Location: 300 E HUNTLAND DR, Grades: PK-8)
- JACKIE'S PERFORMING ARTS & PRIVATE EDUCATION (Students: 296, Location: 11530 MANCHACA RD, Grades: PK-5)
- ST IGNATIUS MARTYR SCHOOL (Students: 268, Location: 120 W OLTORF ST, Grades: PK-8)
- ST LOUIS SCHOOL (Students: 245, Location: 2114 SAINT JOSEPH BLVD, Grades: PK-8)
- ST AUSTIN CATHOLIC SCHOOL (Students: 223, Location: 1911 SAN ANTONIO ST, Grades: PK-8)
- PRIMAVERA MONTESSORI SCHOOL (Students: 200, Location: 1934 BERKELEY AVE, Grades: PK-5)
Libraries in Austin:
- AUSTIN PUBLIC LIBRARY (Operating income: $24,766,956; Location: 800 GUADALUPE ST; 1,245,111 books; 28,472 e-books; 92,954 audio materials; 64,924 video materials; 27 local licensed databases; 50 state licensed databases; 2,321 print serial subscriptions; 4 electronic serial subscriptions)
- WELLS BRANCH COMMUNITY LIBRARY (Operating income: $694,229; Location: 15001 WELLS PORT DR; 32,559 books; 2,684 audio materials; 3,326 video materials; 50 state licensed databases; 45 print serial subscriptions)
User-submitted facts and corrections:
- Westake High School has way more than 1700 kids. It is more like 2500.
added by Stephen
- This airport no longer exists in Austin Texas... It is now a DELL computers campus BIRD'S NEST (about 14 miles; AUSTIN, TX; ID: 6R4)
- The college identified as The Institute for Christian Studies has changed its name to the Austin Graduate School of Theology. The Web site is www.austingrad.edu.
- Southwest Texas State University is now known as Texas State U.
- Great Hills Christian School and Grace Covenant Christian School no longer exist.
- This airport no longer exists in Austin Texas... It is now a DELL computers campus
BIRD\'S NEST (about 14 miles; AUSTIN, TX; ID: 6R4)
- On your page at http://www.city-data.com/city/Austin-Texas.html noting Biggest private high schools in Austin: St. Michael's Academy changed their name to St. Michael's Catholic Academy, who now has 437 students in grades 9-12.
Points of interest:
Notable locations in Austin: Morris Williams Golf Course (A), Balcones Country Club (B), A F Siding (C), Oak Hill Downs (D), Valley Oak Golf Club (E), Austin Country Club (F), Camp Tom Wooten (G), Willow-Spence Streets Historic District (H), Zilker Park Historic District (I), Shadow Lawn Historic District (J), Sixth Street Historic District (K), Swedish Hill Historic District (L), Rainey Street Historic District (M), Moores Crossing Historic District (N), McKinney Homestead (O), Moore-Hancock Farmstead (P), Hyde Park Historic District (Q), Ernest and Anna Gustafson Farmstead (R), Congress Avenue Historic District (S), Edward H Rogers Homestead (T). Display/hide their locations on the map
Shopping Centers: Southwood Shopping Center (1), West Gate Shopping Center (2), Northcross Shopping Center (3), Lakeline Shopping Center (4), Arboretum Shopping Center (5), Barton Creek Square Shopping Center (6), Capital Plaza Shopping Center (7), Highland Shopping Center (8), Capital Plaza Shopping Center (9). Display/hide their locations on the map
Main business address in Austin include: FORGENT NETWORKS INC (A), AMERICAN PHYSICIANS SERVICE GROUP INC (B), TRAVIS BOATS & MOTORS INC (C), AAC Group Holding Corp. (D), BRIGHAM EXPLORATION CO (E), ACTIVANT SOLUTIONS INC /DE/ (F), HEALTHTRONICS, INC. (G). Display/hide their locations on the map
Churches in Austin include: Saint Peters Church (A), Mimosa Place Church (B), Boulevard Church (C), North Austin Community Church (D), Saint Vincent de Paul Catholic Church (E), University Baptist Church (F), Wesley United Methodist Church (G), Saint Davids Episcopal Church (H), Saint Marys Cathedral (I). Display/hide their locations on the map
Cemeteries: Capital Memorial Park (1), Austin Memorial Park (2), Mount Calvary Cemetery (3), Bethany Cemetery (4), Assumption Cemetery (5), Memorial Hill Park (6), Burdett Prairie Cemetery (7). Display/hide their locations on the map
Lakes and reservoirs: Elm Waterhole (A), Walter E. Long Lake (B), Lake Walter E Long (C), Lake Austin (D), Balcones Country Club Lake (E), Town Lake (F). Display/hide their locations on the map
Streams, rivers, and creeks: Bear Creek (A), Blunn Creek (B), Waller Creek (C), Turkey Creek (D), Tannehill Branch (E), Barton Creek (F), Short Spring Branch (G), Mayfield Creek (H), Skunk Hollow Creek (I). Display/hide their locations on the map
Parks in Austin include: Lakeshore Park (1), Lamar Beach (2), Zilker Park (3), Zargosa Park (4), Kealing Park (5), Wooldridge Park (6), Jordan Park (7), Westenfield Park (8), Govalle Playground (9). Display/hide their locations on the map
Tourist attractions: Austin Museum of Art - Downtown (823 Congress Avenue Suite 100) (1), Austin Museum of Art (823 Congress Avenue Suite 100) (2), Capitol Complex Visitors Center (Museums; 112 East 11th Street) (3), Austin Museum of Art - Austin Museum of Art Guild (823 Congress Avenue Suite 100) (4), Austin Children's Museum (201 Colorado Street) (5), Bob Bullock Texas State History Museum (Mlk Jr Boulevard & N Cong) (6), Austin Zoo (Cultural Attractions- Events- & Facilities; 10807 Rawhide Trail) (7), French Legation Museum (Cultural Attractions- Events- & Facilities; 802 San Marcos Street) (8), Austin City - Teen Youth- Children- Programs Services- Youth Services- Food and Nutr (Cultural Attractions- Events- & Facilities; 800 Guadalupe Street) (9). Display/hide their approximate locations on the map
Hotels: Club Hotel by Doubletree Austin University Area (1617 North I H 35) (1), Austin Folk House (506 West 22nd Street) (2), AmeriPark at Austin (1130 Camino La Costa) (3), Clarion Inn & Suites (2200 South I H 35) (4), Best Western Seville Plaza Inn (4323 South Interstate 35) (5), Bradford Homesuites Austin North West (10001 North Capital Of Texas Highway) (6), Amerisuites Austin North (7522 N I H 35) (7), Austin Central Super 8 Motel (1201 N I H 35) (8), Bridgestreet Corporate Housing Worldwide (7801 North Lamar Boulevard) (9). Display/hide their approximate locations on the map
Courts: Texas-State - Supreme Court- Clerk-Weber Andrew (Supreme Court Buildi) (1), United States Government - Courts Us- Us District Court- Sam Sparks District J (200 West 8th Street) (2), Texas-State - State Securities Board (208 East 10th Street) (3), Texas-State - Board Of Law Examiners (209 West 14th Street) (4), Texas-State - Legislative Council- Administration Division (Robert E Johnson Sr) (5), Texas State - Pension Review Board- Pention Review Board (300 West 15th Street) (6), Texas State - Comptroller of Public Accounts- Audit Headquarters- Stephen F Austin Buil (1700 Congress Avenue) (7), United States Government - Courts Us- Us District Court- Alan D Albright Magistrate J (200 West 8th Street) (8), United States Government - Courts Us- Bankruptcy Court- Larry E Kelly Bankruptcy J (903 San Jacinto Boulevard) (9). Display/hide their approximate locations on the map
Birthplace of: Aaron Peña - Politician, Alan Lomax - Folklorist, John Henry Faulk - Texas folklorist, Ron Kirk - Mayor, Paul London - Professional wrestler, Ciara - Singer–songwriter, Lloyd Doggett - Politician, Carly Fiorina - Businesswoman, Michael Jackson and Bubbles - Actor, Dustin Rhodes - Professional wrestler.
Drinking water stations with addresses in Austin and their reported violations in the past:
EMMA LONG METRO PARK (Population served: 3,840, Surface water):Past monitoring violations:BRITTMOORE UTILITY (Population served: 2,617, Groundwater):
- Single Turbidity Exceed (Enhanced SWTR) - In JUN-2012, Contaminant: IESWTR. Follow-up actions: St Public Notif requested (JUN-30-2012), St Compliance achieved (AUG-01-2012)
- Monthly Turbidity Exceed (Enhanced SWTR) - In OCT-2007, Contaminant: IESWTR. Follow-up actions: St Public Notif received (NOV-03-2007), St Public Notif requested (NOV-26-2007), St Violation/Reminder Notice (NOV-26-2007), St Compliance achieved (AUG-09-2010)
- Monitoring, Turbidity (Enhanced SWTR) - In AUG-2007, Contaminant: IESWTR. Follow-up actions: St Compliance achieved (AUG-09-2010)
- Monthly Turbidity Exceed (Enhanced SWTR) - In JUL-2007, Contaminant: IESWTR. Follow-up actions: St Public Notif received (AUG-07-2007), St Public Notif requested (AUG-31-2007), St Violation/Reminder Notice (AUG-31-2007), St Compliance achieved (AUG-09-2010)
- Monthly Turbidity Exceed (Enhanced SWTR) - In DEC-2006, Contaminant: IESWTR. Follow-up actions: St Violation/Reminder Notice (JAN-30-2007), St Compliance achieved (AUG-09-2010)
- 2 minor monitoring violations
- 2 regular monitoring violations
- 2 other older monitoring violations
Past health violations:BUFFALO CREEK UTILITY (Population served: 2,340, Purch surface water):
- MCL, Monthly (TCR) - In MAR-2009, Contaminant: Coliform. Follow-up actions: St Public Notif requested (MAR-12-2009), St Violation/Reminder Notice (MAR-12-2009), St Compliance achieved (MAR-31-2009), St Public Notif received (APR-27-2009)
Past monitoring violations:CANDLELIGHT HILLS SUBDIVISION (Population served: 2,271, Purch surface water):
- Lead Consumer Notice - In DEC-30-2013, Contaminant: Lead and Copper Rule
- Monitoring and Reporting (DBP) - Between OCT-2008 and DEC-2008, Contaminant: Chlorine. Follow-up actions: St Public Notif requested (MAR-27-2009), St Violation/Reminder Notice (MAR-27-2009), St Compliance achieved (JUL-09-2010)
Past monitoring violations:BRIARCREEK SUBDIVISION (Population served: 2,181, Purch groundwater):
- Lead Consumer Notice - In DEC-30-2013, Contaminant: Lead and Copper Rule. Follow-up actions: St Compliance achieved (OCT-08-2013)
- Follow-up Or Routine LCR Tap M/R - In OCT-01-2013, Contaminant: Lead and Copper Rule
Past monitoring violations:CARRIAGE HILLS (Population served: 1,665, Groundwater):
- Lead Consumer Notice - In DEC-30-2013, Contaminant: Lead and Copper Rule. Follow-up actions: St Compliance achieved (FEB-18-2014)
- Follow-up Or Routine LCR Tap M/R - In OCT-01-2011, Contaminant: Lead and Copper Rule. Follow-up actions: St Compliance achieved (NOV-05-2013)
- Monitoring and Reporting (DBP) - Between OCT-2008 and DEC-2008, Contaminant: Chlorine. Follow-up actions: St Violation/Reminder Notice (MAR-27-2009), St Public Notif requested (MAR-27-2009), St Compliance achieved (JUL-07-2010)
- Monitoring, Repeat Major (TCR) - In AUG-2005, Contaminant: Coliform (TCR). Follow-up actions: St Compliance achieved (AUG-31-2005), St Public Notif requested (SEP-21-2005), St Violation/Reminder Notice (SEP-21-2005), St Public Notif received (DEC-01-2005)
Past monitoring violations:CANYON LAKE MOBILE HOME ESTATES (Population served: 1,656, Groundwater):
- Follow-up Or Routine LCR Tap M/R - In OCT-01-2010, Contaminant: Lead and Copper Rule. Follow-up actions: St Compliance achieved (NOV-14-2013)
Past monitoring violations:TPWD LYNDON B JOHNSON SHP (Population served: 1,500, Groundwater):
- Monitoring and Reporting (DBP) - Between OCT-2008 and DEC-2008, Contaminant: Chlorine. Follow-up actions: St Violation/Reminder Notice (MAR-27-2009), St Public Notif requested (MAR-27-2009), St Public Notif received (APR-28-2009), St Compliance achieved (AUG-04-2009)
- Monitoring and Reporting (DBP) - Between JAN-2007 and MAR-2007, Contaminant: Chlorine. Follow-up actions: St Public Notif requested (JUL-19-2007), St Violation/Reminder Notice (JUL-19-2007), St Compliance achieved (2 times from JAN-21-2011 to JAN-21-2011)
- Monitoring and Reporting (DBP) - Between OCT-2006 and DEC-2006, Contaminant: Chlorine. Follow-up actions: St Public Notif requested (JUL-19-2007), St Violation/Reminder Notice (JUL-19-2007), St Compliance achieved (2 times from JAN-21-2011 to JAN-21-2011)
- Monitoring and Reporting (DBP) - Between JUL-2006 and SEP-2006, Contaminant: Chlorine. Follow-up actions: St Public Notif requested (JUL-19-2007), St Violation/Reminder Notice (JUL-19-2007), St Compliance achieved (2 times from JAN-21-2011 to JAN-21-2011)
- Monitoring and Reporting (DBP) - Between APR-2006 and JUN-2006, Contaminant: Chlorine. Follow-up actions: St Public Notif requested (JUL-19-2007), St Violation/Reminder Notice (JUL-19-2007), St Compliance achieved (2 times from JAN-21-2011 to JAN-21-2011)
- One routine major monitoring violation
- 5 other older monitoring violations
Past monitoring violations:
- One routine major monitoring violation
- One minor monitoring violation
Drinking water stations with addresses in Austin that have no violations reported:
- BARTON CREEK WEST WSC (Population served: 1,251, Primary Water Source Type: Purch surface water)
- TPWD GARNER STATE PARK (Population served: 1,232, Primary Water Source Type: Groundwater)
- TPWD DINOSAUR VALLEY STATE PARK (Population served: 1,000, Primary Water Source Type: Groundwater)
- BLUE WATER SHORES (Population served: 957, Primary Water Source Type: Groundwater)
- CARSON RANCH (Population served: 900, Primary Water Source Type: Groundwater)
- ARROWHEAD LAKE & FRONTIER LAKE (Population served: 900, Primary Water Source Type: Groundwater)
- TPWD ENCHANTED ROCK SNA (Population served: 885, Primary Water Source Type: Groundwater)
- TXDOT COLORADO COUNTY SRA (Address: MNT DIVISION , Population served: 750, Primary Water Source Type: Purch groundwater)
- TPWD GOOSE ISLAND STATE PARK (Population served: 600, Primary Water Source Type: Groundwater)
- TRAVIS COUNTY MILTON REIMERS RANCH PARK (Population served: 500, Primary Water Source Type: Groundwater)
| This city: | 2.4 people |
| Texas: | 2.8 people |
| This city: | 51.9% |
| Whole state: | 69.9% |
| This city: | 8.2% |
| Whole state: | 6.0% |
Likely homosexual households (counted as self-reported same-sex unmarried-partner households)
- Lesbian couples: 0.7% of all households
- Gay men: 0.6% of all households
People in group quarters in Austin in 2010:
- 12,990 people in college/university student housing
- 1,869 people in nursing facilities/skilled-nursing facilities
- 1,198 people in other noninstitutional facilities
- 1,105 people in state prisons
- 1,020 people in group homes intended for adults
- 601 people in emergency and transitional shelters (with sleeping facilities) for people experiencing homelessness
- 323 people in correctional residential facilities
- 281 people in local jails and other municipal confinement facilities
- 215 people in hospitals with patients who have no usual home elsewhere
- 165 people in workers' group living quarters and job corps centers
- 142 people in residential treatment centers for juveniles (non-correctional)
- 98 people in mental (psychiatric) hospitals and psychiatric units in other hospitals
- 88 people in residential treatment centers for adults
- 79 people in correctional facilities intended for juveniles
- 50 people in group homes for juveniles (non-correctional)
- 33 people in residential schools for people with disabilities
- 4 people in in-patient hospice facilities
People in group quarters in Austin in 2000:
- 9,143 people in college dormitories (includes college quarters off campus)
- 2,369 people in local jails and other confinement facilities (including police lockups)
- 1,892 people in nursing homes
- 1,246 people in other noninstitutional group quarters
- 988 people in state prisons
- 977 people in other group homes
- 635 people in other nonhousehold living situations
- 543 people in homes for the mentally retarded
- 501 people in schools, hospitals, or wards for the intellectually disabled
- 432 people in homes or halfway houses for drug/alcohol abuse
- 375 people in mental (psychiatric) hospitals or wards
- 178 people in job corps and vocational training facilities
- 158 people in wards in military hospitals for patients who have no usual home elsewhere
- 125 people in hospitals/wards and hospices for chronically ill
- 120 people in other types of correctional institutions
- 99 people in other hospitals or wards for chronically ill
- 98 people in short-term care, detention or diagnostic centers for delinquent children
- 87 people in residential treatment centers for emotionally disturbed children
- 73 people in religious group quarters
- 67 people in halfway houses
- 54 people in homes for the physically handicapped
- 50 people in homes for the mentally ill
- 26 people in hospices or homes for chronically ill
- 16 people in training schools for juvenile delinquents
- 3 people in hospitals or wards for drug/alcohol abuse
Banks with most branches in Austin (2011 data):
- Wells Fargo Bank, National Association: 51 branches. Info updated 2011/04/05: Bank assets: $1,161,490.0 mil, Deposits: $905,653.0 mil, headquarters in Sioux Falls, SD, positive income, 6395 total offices, Holding Company: Wells Fargo & Company
- JPMorgan Chase Bank, National Association: 41 branches. Info updated 2011/11/10: Bank assets: $1,811,678.0 mil, Deposits: $1,190,738.0 mil, headquarters in Columbus, OH, positive income, International Specialization, 5577 total offices, Holding Company: Jpmorgan Chase & Co.
- Bank of America, National Association: 28 branches. Info updated 2009/11/18: Bank assets: $1,451,969.3 mil, Deposits: $1,077,176.8 mil, headquarters in Charlotte, NC, positive income, 5782 total offices, Holding Company: Bank Of America Corporation
- Compass Bank: 19 branches. Info updated 2011/02/24: Bank assets: $63,107.0 mil, Deposits: $46,232.4 mil, headquarters in Birmingham, AL, negative income in the last year, Commercial Lending Specialization, 720 total offices, Holding Company: Banco Bilbao Vizcaya Argentaria, S.A.
- Prosperity Bank: 13 branches. Info updated 2012/01/05: Bank assets: $9,816.2 mil, Deposits: $8,064.8 mil, headquarters in El Campo, TX, positive income, Mortgage Lending Specialization, 187 total offices, Holding Company: Prosperity Bancshares, Inc.
- The Frost National Bank: 12 branches. Info updated 2006/12/21: Bank assets: $20,372.1 mil, Deposits: $16,846.8 mil, headquarters in San Antonio, TX, positive income, Commercial Lending Specialization, 133 total offices, Holding Company: Cullen/Frost Bankers, Inc.
- Capital One, National Association: 11 branches. Info updated 2011/07/01: Bank assets: $133,477.8 mil, Deposits: $97,063.7 mil, headquarters in Mclean, VA, positive income, 984 total offices, Holding Company: Capital One Financial Corporation
- Regions Bank: 9 branches. Info updated 2011/02/24: Bank assets: $123,368.2 mil, Deposits: $98,301.3 mil, headquarters in Birmingham, AL, positive income, Commercial Lending Specialization, 1778 total offices, Holding Company: Regions Financial Corporation
- Woodforest National Bank: 7 branches. Info updated 2011/05/10: Bank assets: $3,488.9 mil, Deposits: $3,097.6 mil, headquarters in Houston, TX, positive income, Commercial Lending Specialization, 766 total offices, Holding Company: Woodforest Financial Group Employee Stock Ownership Plan (With 401(K) Provisions)
- 34 other banks with 73 local branches
For population 15 years and over in Austin:
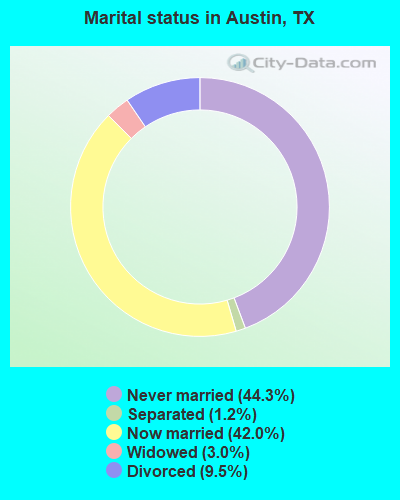
- Never married: 44.3%
- Now married: 42.0%
- Separated: 1.2%
- Widowed: 3.0%
- Divorced: 9.5%
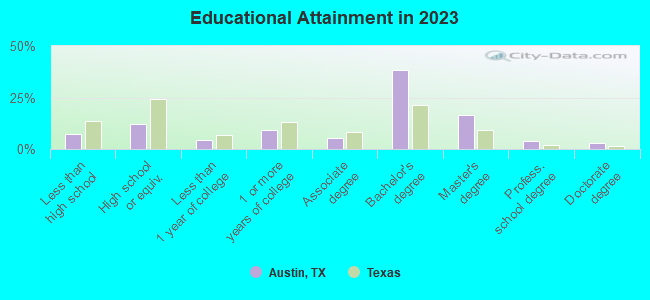
For population 25 years and over in Austin:
- High school or higher: 92.7%
- Bachelor's degree or higher: 59.9%
- Graduate or professional degree: 22.8%
- Unemployed: 4.4%
- Mean travel time to work (commute): 15.5 minutes
| Here: | 11.6 |
| Texas average: | 14.0 |


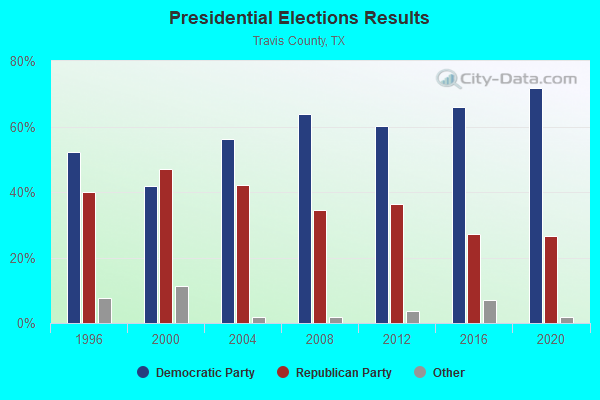
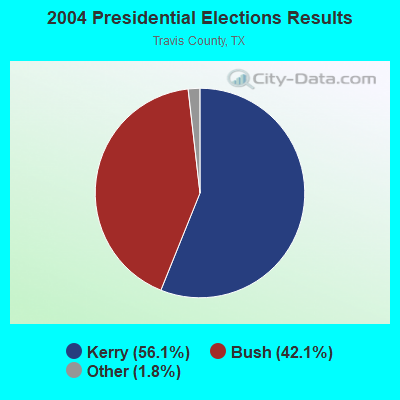
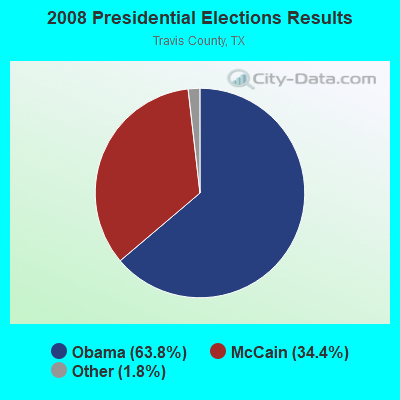
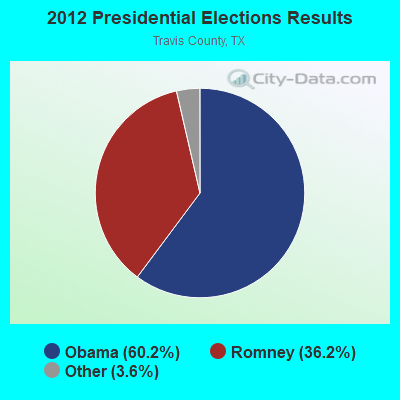
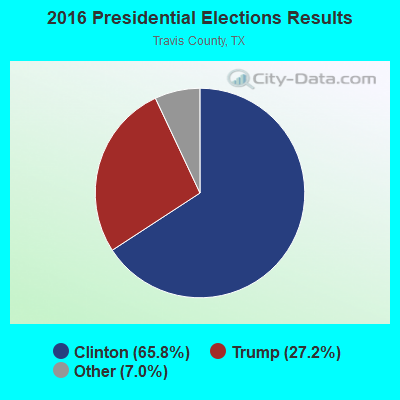
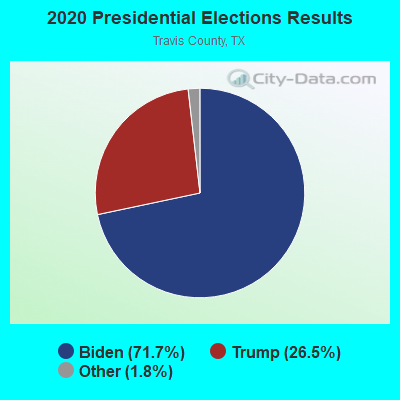
Graphs represent county-level data. Detailed 2008 Election Results
Neighborhoods in Austin:
(Austin, Texas Neighborhood Map)- 2nd Street Disrict neighborhood
- 6th Street Disrict neighborhood
- 6th Street District neighborhood
- Alamo Park neighborhood
- Allandale neighborhood
- Arts District neighborhood
- Auditorium Shores neighborhood
- Barrington Oaks neighborhood
- Barton Hills neighborhood
- Barton Springs neighborhood
- Battle Bend Springs neighborhood
- Blackland (Rogers-Washington-Holy Cross) neighborhood
- Bouldin Creek neighborhood
- Bratton neighborhood
- Bratton Lane Business Park neighborhood
- Brentwood neighborhood
- Brush Park neighborhood
- Bryker Woods neighborhood
- Cat Mountain neighborhood
- Central East Austin neighborhood
- Cherry Creek neighborhood
- Cherrywood neighborhood
- Chestnut neighborhood
- Circle C Ranch neighborhood
- Clarksville neighborhood
- Clarksville Park neighborhood
- Comal Park neighborhood
- Congress Ave District neighborhood
- Convention Center District neighborhood
- Copperfield neighborhood
- Corners of Brushy Creek neighborhood
- Coronado Hills neighborhood
- Crestview neighborhood
- Dawson neighborhood
- Downtown neighborhood
- Duncan Park neighborhood
- East Austin neighborhood
- East Cesar Chavez neighborhood
- East Congress neighborhood
- East End neighborhood
- Ed Bluestein neighborhood
- Fireside Loop neighborhood
- Franklin Park neighborhood
- Galindo neighborhood
- Garrison Park neighborhood
- Gateway neighborhood
- Georgian Acres neighborhood
- Govalle neighborhood
- Gracy Woods neighborhood
- Great Hills neighborhood
- Hancock neighborhood
- Harris Branch neighborhood
- Heritage neighborhood
- Heritage Hills neighborhood
- Highland neighborhood
- Highland North neighborhood
- Highland South neighborhood
- Holly neighborhood
- Hutson-Tillotson University neighborhood
- Hyde Park neighborhood
- Johnston Terrace neighborhood
- Kealing Park and Pool neighborhood
- Lamplight Village neighborhood
- Limestone Ridgeapts neighborhood
- Market District neighborhood
- Mckinney neighborhood
- Meadows of Brushy Creek neighborhood
- Milwood neighborhood
- Mlk neighborhood
- Mlk-183 neighborhood
- Montopolis neighborhood
- Mt Calvary Cemetery neighborhood
- North Austin neighborhood
- North Burnet neighborhood
- North Lamar neighborhood
- North Loop neighborhood
- North Shoal Creek neighborhood
- North University neighborhood
- Northridge Acres neighborhood
- Northwest Austin (NW Austin) neighborhood
- Northwest Hills (NW Hills) neighborhood
- Oak Brook neighborhood
- Oak Park neighborhood
- Oak Springs neighborhood
- Oakwood Cemetery neighborhood
- Old Enfield neighborhood
- Old West Austin neighborhood
- Oltorf-East Riverside (East Riverside-Oltorf) neighborhood
- Oriens Park neighborhood
- Palm Park neighborhood
- Pan Am Park neighborhood
- Parker Lane neighborhood
- Pecan Springs-springdale neighborhood
- Pleasant Valley neighborhood
- Prologis neighborhood
- Red River District neighborhood
- Republic Square Park neighborhood
- Riverside neighborhood
- Rmma neighborhood
- Rollingwood neighborhood
- Rosedale neighborhood
- Rosewood neighborhood
- Round Rock Gateway neighborhood
- Shady Hollow neighborhood
- Shoal Crest neighborhood
- South Austin (Austin del Sur) neighborhood
- South Congress neighborhood
- South Lamar neighborhood
- South Manchaca neighborhood
- South River City neighborhood
- Southeast neighborhood
- Southeast Austin (SE Austin) neighborhood
- Spyglass-Bartons Bluff (Bartons Bluff-Spyglass) neighborhood
- St. Edwards neighborhood
- St. Johns neighborhood
- Sweetbriar neighborhood
- Tarrytown (Tarrytown-Exposition Boulevard) neighborhood
- Texas State Cemetery neighborhood
- The Drag neighborhood
- Town Lake neighborhood
- Town Lake Park (Town Lake) neighborhood
- Triangle State neighborhood
- UT neighborhood
- University Hills neighborhood
- University of Texas (UT) neighborhood
- University of Texas at Austin neighborhood
- Upper Boggy Creek neighborhood
- Villages of Brushy Creek neighborhood
- Warehouse District neighborhood
- Waterloo Park neighborhood
- Wells Branch neighborhood
- West Austin Park neighborhood
- West Congress neighborhood
- West End neighborhood
- West University neighborhood
- Westgate neighborhood
- William Carl Young neighborhood
- Wilshire Wood (Delwood) neighborhood
- Windsor Hills neighborhood
- Windsor Park neighborhood
- Windsor Road neighborhood
- Wooten neighborhood
- Zilker neighborhood
- Zilker Metropolitan Park neighborhood
Religion statistics for Austin, TX (based on Travis County data)
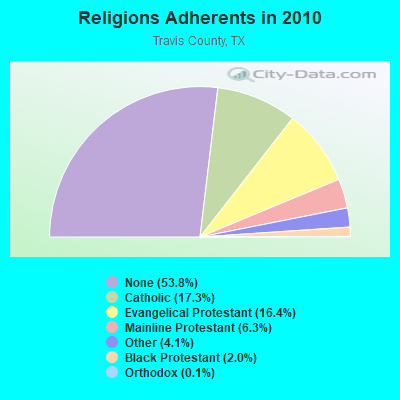
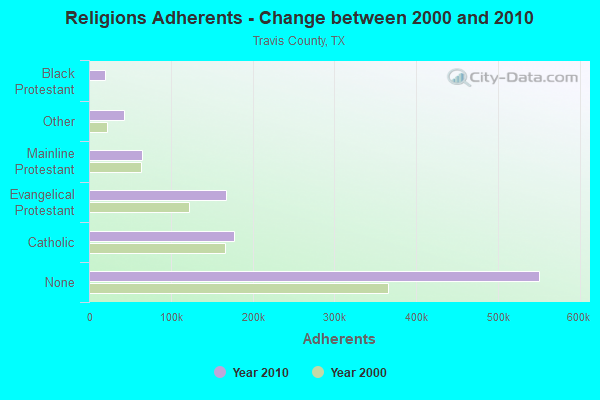
| Religion | Adherents | Congregations |
|---|---|---|
| Catholic | 177,192 | 30 |
| Evangelical Protestant | 167,792 | 406 |
| Mainline Protestant | 64,364 | 114 |
| Other | 42,336 | 86 |
| Black Protestant | 20,156 | 28 |
| Orthodox | 1,524 | 6 |
| None | 550,902 | - |
Food Environment Statistics:
| Here: | 1.37 / 10,000 pop. |
| Texas: | 1.47 / 10,000 pop. |
| Travis County: | 0.08 / 10,000 pop. |
| Texas: | 0.14 / 10,000 pop. |
| This county: | 1.45 / 10,000 pop. |
| Texas: | 1.11 / 10,000 pop. |
| This county: | 3.10 / 10,000 pop. |
| State: | 3.95 / 10,000 pop. |
| Travis County: | 7.96 / 10,000 pop. |
| Texas: | 6.13 / 10,000 pop. |
| Here: | 6.7% |
| Texas: | 8.9% |
| This county: | 21.7% |
| Texas: | 26.6% |
| This county: | 15.3% |
| Texas: | 15.7% |
Health and Nutrition:
| Austin: | 49.2% |
| State: | 48.6% |
| Here: | 50.3% |
| State: | 47.4% |
| Austin: | 27.8 |
| Texas: | 28.5 |
| Here: | 18.9% |
| Texas: | 20.6% |
| This city: | 8.9% |
| State: | 10.3% |
| This city: | 6.8 |
| Texas: | 6.8 |
| Austin: | 29.9% |
| Texas: | 33.1% |
| Austin: | 59.4% |
| State: | 56.2% |
| Austin: | 82.8% |
| Texas: | 80.7% |
More about Health and Nutrition of Austin, TX Residents
| Local government employment and payroll (March 2022) | |||||
| Function | Full-time employees | Monthly full-time payroll | Average yearly full-time wage | Part-time employees | Monthly part-time payroll |
|---|---|---|---|---|---|
| Police Protection - Officers | 1,711 | $19,875,823 | $139,398 | 0 | $0 |
| Electric Power | 1,677 | $14,042,610 | $100,484 | 68 | $346,480 |
| Health | 1,496 | $9,515,122 | $76,325 | 64 | $126,967 |
| Parks and Recreation | 1,213 | $4,824,811 | $47,731 | 445 | $540,011 |
| Firefighters | 1,153 | $13,098,682 | $136,326 | 0 | $0 |
| Streets and Highways | 939 | $4,028,502 | $51,482 | 188 | $231,428 |
| Water Supply | 829 | $5,632,946 | $81,538 | 18 | $46,748 |
| Sewerage | 764 | $5,220,420 | $81,996 | 11 | $31,084 |
| Financial Administration | 642 | $5,263,804 | $98,389 | 45 | $177,767 |
| Other and Unallocable | 637 | $5,332,596 | $100,457 | 34 | $95,921 |
| Housing and Community Development (Local) | 558 | $5,077,320 | $109,190 | 7 | $15,988 |
| Police - Other | 506 | $2,690,982 | $63,818 | 17 | $36,788 |
| Solid Waste Management | 488 | $2,645,766 | $65,060 | 13 | $37,309 |
| Airports | 474 | $2,838,269 | $71,855 | 4 | $9,296 |
| Local Libraries | 413 | $2,036,076 | $59,160 | 44 | $74,717 |
| Other Government Administration | 383 | $2,901,385 | $90,905 | 35 | $87,719 |
| Natural Resources | 362 | $2,292,953 | $76,009 | 15 | $19,465 |
| Judicial and Legal | 259 | $1,654,198 | $76,642 | 16 | $74,912 |
| Fire - Other | 229 | $1,395,334 | $73,118 | 2 | $4,631 |
| Totals for Government | 14,733 | $110,367,598 | $89,894 | 1,026 | $1,957,231 |
Austin government finances - Expenditure in 2021 (per resident):
- Construction - Electric Utilities: $180,867,000 ($185.61)
Regular Highways: $108,750,000 ($111.60)
Air Transportation: $66,810,000 ($68.56)
Water Utilities: $64,323,000 ($66.01)
Sewerage: $60,319,000 ($61.90)
Natural Resources - Other: $53,513,000 ($54.92)
General - Other: $51,453,000 ($52.80)
Libraries: $41,455,000 ($42.54)
Parks and Recreation: $36,936,000 ($37.90)
Solid Waste Management: $16,661,000 ($17.10)
Housing and Community Development: $16,175,000 ($16.60)
Police Protection: $1,112,000 ($1.14)
Judicial and Legal Services: $20,000 ($0.02)
Health - Other: $6,000 ($0.01)
- Current Operations - Electric Utilities: $1,178,769,000 ($1209.68)
Police Protection: $419,713,000 ($430.72)
Local Fire Protection: $203,278,000 ($208.61)
Health - Other: $181,311,000 ($186.07)
Parks and Recreation: $169,598,000 ($174.05)
Water Utilities: $140,085,000 ($143.76)
Sewerage: $132,730,000 ($136.21)
Solid Waste Management: $117,242,000 ($120.32)
Air Transportation: $105,238,000 ($108.00)
Regular Highways: $93,876,000 ($96.34)
General - Other: $78,592,000 ($80.65)
Natural Resources - Other: $73,573,000 ($75.50)
Housing and Community Development: $66,329,000 ($68.07)
Central Staff Services: $61,803,000 ($63.42)
Financial Administration: $48,361,000 ($49.63)
Judicial and Legal Services: $45,968,000 ($47.17)
Libraries: $44,854,000 ($46.03)
Miscellaneous Commercial Activities - Other: $1,272,000 ($1.31)
Parking Facilities: $285,000 ($0.29)
- Electric Utilities - Interest on Debt: $70,641,000 ($72.49)
- General - Interest on Debt: $108,279,000 ($111.12)
- Other Capital Outlay - Natural Resources - Other: $3,296,000 ($3.38)
Health - Other: $1,752,000 ($1.80)
Libraries: $1,657,000 ($1.70)
Parks and Recreation: $728,000 ($0.75)
Regular Highways: $443,000 ($0.45)
Police Protection: $309,000 ($0.32)
Local Fire Protection: $261,000 ($0.27)
Central Staff Services: $68,000 ($0.07)
General - Other: $46,000 ($0.05)
- Total Salaries and Wages: $757,379,000 ($777.24)
- Water Utilities - Interest on Debt: $104,927,000 ($107.68)
Austin government finances - Revenue in 2021 (per resident):
- Charges - Sewerage: $303,639,000 ($311.60)
Other: $166,632,000 ($171.00)
Air Transportation: $166,217,000 ($170.58)
Solid Waste Management: $112,819,000 ($115.78)
Natural Resources - Other: $91,066,000 ($93.45)
Parks and Recreation: $49,016,000 ($50.30)
Parking Facilities: $522,000 ($0.54)
Housing and Community Development: $174,000 ($0.18)
- Federal Intergovernmental - Housing and Community Development: $40,671,000 ($41.74)
Health and Hospitals: $17,332,000 ($17.79)
Other: $14,696,000 ($15.08)
Air Transportation: $12,489,000 ($12.82)
Highways: $4,347,000 ($4.46)
- Local Intergovernmental - Other: $13,214,000 ($13.56)
Highways: $2,386,000 ($2.45)
- Miscellaneous - Special Assessments: $93,705,000 ($96.16)
Interest Earnings: $37,009,000 ($37.98)
General Revenue - Other: $33,721,000 ($34.61)
Fines and Forfeits: $29,234,000 ($30.00)
Sale of Property: $9,132,000 ($9.37)
Donations From Private Sources: $3,832,000 ($3.93)
Rents: $2,388,000 ($2.45)
- Revenue - Electric Utilities: $1,565,102,000 ($1606.14)
Water Utilities: $297,569,000 ($305.37)
- State Intergovernmental - General Local Government Support: $8,704,000 ($8.93)
Highways: $6,638,000 ($6.81)
Other: $1,370,000 ($1.41)
Health and Hospitals: $557,000 ($0.57)
Housing and Community Development: $431,000 ($0.44)
- Tax - Property: $604,970,000 ($620.83)
General Sales and Gross Receipts: $260,017,000 ($266.84)
Other Selective Sales: $116,012,000 ($119.05)
Public Utilities Sales: $50,956,000 ($52.29)
Other License: $50,057,000 ($51.37)
Alcoholic Beverage License: $669,000 ($0.69)
Austin government finances - Debt in 2021 (per resident):
- Long Term Debt - Beginning Outstanding - Unspecified Public Purpose: $2,059,271,000 ($2113.27)
Retired Unspecified Public Purpose: $1,043,309,000 ($1070.67)
Outstanding Unspecified Public Purpose: $1,015,962,000 ($1042.60)
Beginning Outstanding - Public Debt for Private Purpose: $160,900,000 ($165.12)
Outstanding Nonguaranteed - Industrial Revenue: $146,100,000 ($149.93)
Retired Nonguaranteed - Public Debt for Private Purpose: $14,800,000 ($15.19)
Austin government finances - Cash and Securities in 2021 (per resident):
- Bond Funds - Cash and Securities: $845,013,000 ($867.17)
- Other Funds - Cash and Securities: $1,433,532,000 ($1471.12)
- Sinking Funds - Cash and Securities: $541,114,000 ($555.30)
10.48% of this county's 2021 resident taxpayers lived in other counties in 2020 ($119,731 average adjusted gross income)
| Here: | 10.48% |
| Texas average: | 8.12% |
0.01% of residents moved from foreign countries ($116 average AGI)
Travis County: 0.01% Texas average: 0.04%
Top counties from which taxpayers relocated into this county between 2020 and 2021:
| from Williamson County, TX | |
| from Harris County, TX | |
| from Hays County, TX |
10.53% of this county's 2020 resident taxpayers moved to other counties in 2021 ($85,650 average adjusted gross income)
| Here: | 10.53% |
| Texas average: | 7.40% |
0.02% of residents moved to foreign countries ($136 average AGI)
Travis County: 0.02% Texas average: 0.03%
Top counties to which taxpayers relocated from this county between 2020 and 2021:
| to Williamson County, TX | |
| to Hays County, TX | |
| to Harris County, TX |
| Businesses in Austin, TX | ||||
| Name | Count | Name | Count | |
|---|---|---|---|---|
| 24 Hour Fitness | 5 | Journeys | 2 | |
| 7-Eleven | 24 | Juicy Couture | 1 | |
| ALDO | 2 | Justice | 1 | |
| AMF Bowling | 1 | KFC | 9 | |
| AT&T | 18 | Kincaid | 1 | |
| Abercrombie & Fitch | 1 | Kohl's | 2 | |
| Abercrombie Kids | 1 | La Quinta | 10 | |
| Academy Sports + Outdoors | 3 | Lane Bryant | 3 | |
| Advance Auto Parts | 11 | Lane Furniture | 29 | |
| Aeropostale | 3 | LensCrafters | 3 | |
| American Eagle Outfitters | 2 | Little Caesars Pizza | 10 | |
| Ann Taylor | 4 | Long John Silver's | 5 | |
| Apple Store | 2 | Lowe's | 5 | |
| Applebee's | 3 | Macy's | 3 | |
| Arby's | 3 | Marriott | 18 | |
| Ashley Furniture | 1 | Marshalls | 2 | |
| Audi | 2 | MasterBrand Cabinets | 12 | |
| AutoZone | 15 | Maurices | 1 | |
| Avenue | 3 | Mazda | 2 | |
| BMW | 1 | McDonald's | 34 | |
| Bakers | 1 | Men's Wearhouse | 4 | |
| Banana Republic | 2 | Microtel | 1 | |
| Barnes & Noble | 3 | Motel 6 | 4 | |
| Baskin-Robbins | 4 | Motherhood Maternity | 4 | |
| Bath & Body Works | 6 | New Balance | 27 | |
| Baymont Inn | 2 | New York & Co | 1 | |
| Bebe | 1 | Nike | 48 | |
| Bed Bath & Beyond | 5 | Nissan | 2 | |
| Best Western | 2 | Nordstrom | 2 | |
| Blockbuster | 14 | Office Depot | 7 | |
| Brookstone | 2 | OfficeMax | 7 | |
| Budget Car Rental | 4 | Old Navy | 3 | |
| Buffalo Wild Wings | 3 | Olive Garden | 3 | |
| Burger King | 12 | Outback | 2 | |
| Burlington Coat Factory | 2 | Outback Steakhouse | 2 | |
| Buybuy BABY | 1 | Pac Sun | 1 | |
| CVS | 21 | Panda Express | 8 | |
| Cache | 2 | Panera Bread | 4 | |
| Carl\s Jr. | 2 | Papa John's Pizza | 9 | |
| Casual Male XL | 2 | Payless | 12 | |
| Catherines | 3 | Penske | 7 | |
| Chevrolet | 3 | PetSmart | 6 | |
| Chick-Fil-A | 9 | Pier 1 Imports | 3 | |
| Chico's | 3 | Pizza Hut | 16 | |
| Chipotle | 13 | Plato's Closet | 2 | |
| Chuck E. Cheese's | 2 | Popeyes | 7 | |
| Church's Chicken | 12 | Pottery Barn | 2 | |
| Cinnabon | 8 | Pottery Barn Kids | 1 | |
| Circle K | 12 | Qdoba Mexican Grill | 1 | |
| Clarion | 1 | Quiznos | 18 | |
| Clarks | 1 | RadioShack | 16 | |
| Coldwater Creek | 2 | Ramada | 1 | |
| ColorTyme | 1 | Red Lobster | 2 | |
| Comfort Inn | 1 | Red Robin | 3 | |
| Comfort Suites | 3 | Red Roof Inn | 2 | |
| Costco | 1 | Rodeway Inn | 1 | |
| Crate & Barrel | 1 | Rooms To Go | 1 | |
| Cricket Wireless | 52 | Rue21 | 1 | |
| Crossland Economy Studios | 1 | Ryan's Grill | 1 | |
| Curves | 7 | Ryder Rental & Truck Leasing | 1 | |
| DHL | 15 | SAS Shoes | 2 | |
| Days Inn | 3 | SONIC Drive-In | 26 | |
| Decora Cabinetry | 3 | Safeway | 9 | |
| Dennys | 5 | Saks Fifth Avenue | 1 | |
| Discount Tire | 6 | Sam's Club | 3 | |
| Domino's Pizza | 14 | Sears | 8 | |
| DressBarn | 3 | Sephora | 2 | |
| Dressbarn | 3 | Sheraton | 1 | |
| Dunkin Donuts | 1 | Shoe Carnival | 2 | |
| Econo Lodge | 1 | Skechers USA | 1 | |
| Ethan Allen | 1 | Soma Intimates | 2 | |
| Express | 3 | Spencer Gifts | 1 | |
| Extended Stay America | 5 | Sprint Nextel | 18 | |
| Extended Stay Deluxe | 4 | Staples | 2 | |
| Famous Footwear | 1 | Starbucks | 49 | |
| FedEx | 179 | Steak 'n Shake | 2 | |
| Finish Line | 2 | Studio 6 | 2 | |
| Firestone Complete Auto Care | 13 | Subaru | 1 | |
| Foot Locker | 2 | Subway | 55 | |
| Ford | 3 | Super 8 | 5 | |
| Forever 21 | 2 | T-Mobile | 23 | |
| Fredericks Of Hollywood | 1 | T.G.I. Driday's | 2 | |
| GNC | 13 | T.J.Maxx | 2 | |
| GameStop | 13 | Taco Bell | 22 | |
| Gap | 3 | Talbots | 2 | |
| Goodwill | 2 | Target | 9 | |
| Gymboree | 2 | The Cheesecake Factory | 1 | |
| H&R Block | 19 | The Limited | 2 | |
| Havertys Furniture | 1 | The Room Place | 6 | |
| Haworth | 2 | Toyota | 2 | |
| Hilton | 17 | Toys"R"Us | 5 | |
| Hobby Lobby | 5 | Travelodge | 1 | |
| Holiday Inn | 15 | True Value | 2 | |
| Hollister Co. | 1 | U-Haul | 29 | |
| Home Depot | 7 | UPS | 190 | |
| Homestead Studio Suites | 2 | Urban Outfitters | 2 | |
| Honda | 2 | Vans | 16 | |
| Hot Topic | 3 | Verizon Wireless | 4 | |
| Howard Johnson | 3 | Victoria's Secret | 3 | |
| Hyatt | 5 | Volkswagen | 2 | |
| IHOP | 9 | Vons | 9 | |
| InTown Suites | 1 | Waffle House | 2 | |
| J. Jill | 2 | Walgreens | 26 | |
| J.Crew | 2 | Walmart | 8 | |
| JCPenney | 3 | Wendy's | 23 | |
| Jack In The Box | 20 | Westin | 1 | |
| Jamba Juice | 6 | Wet Seal | 1 | |
| Jimmy Jazz | 2 | Whole Foods Market | 3 | |
| Jimmy John's | 11 | YMCA | 7 | |
| JoS. A. Bank | 3 | Z Gallerie | 1 | |
| Jones New York | 15 | |||
Strongest AM radio stations in Austin:
- KVET (1300 AM; 5 kW; AUSTIN, TX; Owner: CAPSTAR TX LIMITED PARTNERSHIP)
- KLBJ (590 AM; 5 kW; AUSTIN, TX; Owner: EMMIS AUSTIN RADIO BROADCASTING COMPANY, L.P.)
- KJCE (1370 AM; 5 kW; ROLLINGWOOD, TX; Owner: TEXAS INFINITY RADIO L.P.)
- KFIT (1060 AM; daytime; 2 kW; LOCKHART, TX; Owner: KFIT, INC..)
- KFON (1490 AM; 1 kW; AUSTIN, TX; Owner: PECAN RADIO PARTNERS, LTD.)
- WMOP (900 AM; 5 kW; OCALA, FL; Owner: FLORIDA SPORTSTALK, INC.)
- KTXZ (1560 AM; 2 kW; WEST LAKE HILLS, TX; Owner: NOGALES BROADCASTING, L.C.)
- KQQA (1530 AM; 10 kW; CREEDMOOR, TX; Owner: YELLOW ROSE COMMUNICATIONS, INC.)
- KOKE (1600 AM; 5 kW; PFLUGERVILLE, TX; Owner: AMIGO RADIO, LTD.)
- KIXL (970 AM; 1 kW; DEL VALLE, TX; Owner: KIXL BROADCASTING, CORPORATION)
- KTKR (760 AM; 50 kW; SAN ANTONIO, TX; Owner: CCB TEXAS LICENSES, L.P.)
- WOAI (1200 AM; 50 kW; SAN ANTONIO, TX; Owner: CCB TEXAS LICENSES, L.P.)
- KKYX (680 AM; 50 kW; SAN ANTONIO, TX; Owner: CXR HOLDINGS, INC.)
Strongest FM radio stations in Austin:
- KLBJ-FM (93.7 FM; AUSTIN, TX; Owner: EMMIS AUSTIN RADIO BROADCASTING COMPANY, L.P.)
- KAMX (94.7 FM; LULING, TX; Owner: TEXAS INFINITY RADIO L.P.)
- KKMJ-FM (95.5 FM; AUSTIN, TX; Owner: TEXAS INFINITY RADIO L.P.)
- KMFA (89.5 FM; AUSTIN, TX; Owner: CAPITOL BROADCASTING ASSOCIATION, INC)
- KASE-FM (100.7 FM; AUSTIN, TX; Owner: CAPSTAR TX LIMITED PARTNERSHIP)
- KVET-FM (98.1 FM; AUSTIN, TX; Owner: CAPSTAR TX LIMITED PARTNERSHIP)
- KUT (90.5 FM; AUSTIN, TX; Owner: THE UNIVERSITY OF TEXAS AT AUSTIN)
- KAZI (88.7 FM; AUSTIN, TX; Owner: AUSTIN COMMUNITY RADIO)
- KPEZ (102.3 FM; AUSTIN, TX; Owner: CCB TEXAS LICENSES, L.P.)
- KFMK (105.9 FM; ROUND ROCK, TX; Owner: CAPSTAR TX LIMITED PARTNERSHIP)
- KHFI-FM (96.7 FM; GEORGETOWN, TX; Owner: CCB TEXAS LICENSES, L.P.)
- KEYI-FM (103.5 FM; SAN MARCOS, TX; Owner: EMMIS AUSTIN RADIO BROADCASTING COMPANY, L.P.)
- KDHT (93.3 FM; CEDAR PARK, TX; Owner: EMMIS AUSTIN RADIO BROADCASTING COMPANY, L.P.)
- KHHL (98.9 FM; LEANDER, TX; Owner: AMIGO RADIO, LTD.)
- KOOP (91.7 FM; HORNSBY, TX; Owner: TEXAS EDUC B/CTING CO-OPERATIVE, INC)
- KVRX (91.7 FM; AUSTIN, TX; Owner: THE UNIVERSITY OF TEXAS AT AUSTIN)
- KQJZ (92.1 FM; HUTTO, TX; Owner: CENTRAL TEXAS RADIO, INC.)
- KNLE-FM (88.1 FM; ROUND ROCK, TX; Owner: IXOYE PRODUCTIONS, INC.)
- KQBT (104.3 FM; TAYLOR, TX; Owner: INFINITY RADIO OPERATIONS INC.)
- K206CF (89.1 FM; AUSTIN, TX; Owner: CALVARY CHAPEL OF TWIN FALLS, INC.)
TV broadcast stations around Austin:
- K09VR (Channel 9; AUSTIN, TX; Owner: THE UNIVERSITY OF TEXAS AT AUSTIN)
- KTBC (Channel 7; AUSTIN, TX; Owner: KTBC LICENSE, INC.)
- KGBS-CA (Channel 65; AUSTIN, TX; Owner: CABALLERO TELEVISION AUSTIN, INC.)
- K34FM (Channel 34; AUSTIN, TX; Owner: TRINITY BROADCASTING NETWORK)
- KEYE-TV (Channel 42; AUSTIN, TX; Owner: CBS STATIONS GROUP OF TEXAS L.P.)
- KQUX-CA (Channel 11; AUSTIN, TX; Owner: LOUIS MARTINEZ FAMILY GROUP, LLC)
- KXAN-TV (Channel 36; AUSTIN, TX; Owner: KXAN, INC.)
- KNVA (Channel 54; AUSTIN, TX; Owner: 54 BROADCASTING, INC.)
- KVUE (Channel 24; AUSTIN, TX; Owner: KVUE TELEVISION, INC.)
- KLRU (Channel 18; AUSTIN, TX; Owner: CAPITAL OF TEXAS PUBLIC TELECOMMUNICATIONS COUNCIL)
- KBVO-CA (Channel 49; AUSTIN, TX; Owner: KXAN, INC.)
- K63AY (Channel 63; MULLIN, TX; Owner: MAKO COMMUNICATIONS, LLC)
- KADF-LP (Channel 20; AUSTIN, TX; Owner: JOSEPH W. SHAFFER)
- KXLK-CA (Channel 67; AUSTIN, TX; Owner: CASA OF AUSTIN, A CALIFORNIA LIMITED PARTNERSHIP)
- KDAS-CA (Channel 31; AUSTIN, TX; Owner: KWEX LICENSE PARTNERSHIP, L.P.)
- KAKW (Channel 62; KILLEEN, TX; Owner: KAKW LICENSE PARTNERSHIP, L.P.)
- KTXU-LP (Channel 38; SAN MARCOS, TX; Owner: GERALD G. BENAVIDES)
- KHPX-CA (Channel 48; GEORGETOWN, TX; Owner: KXAN, INC.)
- KHPZ-CA (Channel 64; ROUND ROCK, TX; Owner: KXAN, INC.)
- KTDF-LP (Channel 18; SAN ANTONIO, TX; Owner: JOSEPH W. SHAFFER)
Medal of Honor Recipients
Medal of Honor Recipients born in Austin: Milton M. Holland, Russell A. Steindam.
- National Bridge Inventory (NBI) Statistics
- 1,635Number of bridges
- 47,585ft / 14,504mTotal length
- $88,672,000Total costs
- 40,979,061Total average daily traffic
- 2,477,736Total average daily truck traffic
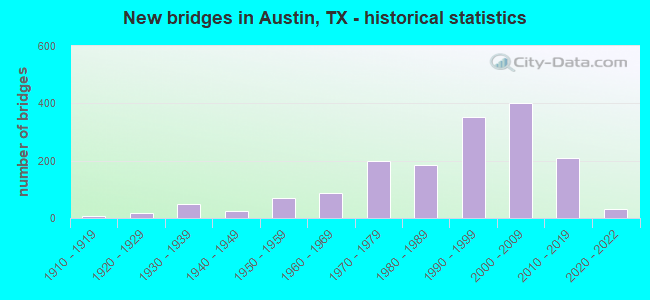
- New bridges - historical statistics
- 11900-1909
- 81910-1919
- 171920-1929
- 481930-1939
- 261940-1949
- 701950-1959
- 861960-1969
- 1991970-1979
- 1861980-1989
- 3531990-1999
- 4002000-2009
- 2092010-2019
- 322020-2022
FCC Registered Antenna Towers: 3,163 (See the full list of FCC Registered Antenna Towers)
FCC Registered Commercial Land Mobile Towers: 24 (See the full list of FCC Registered Commercial Land Mobile Towers in Austin, TX)
FCC Registered Private Land Mobile Towers: 63 (See the full list of FCC Registered Private Land Mobile Towers)
FCC Registered Broadcast Land Mobile Towers: 666 (See the full list of FCC Registered Broadcast Land Mobile Towers)
FCC Registered Microwave Towers: 801 (See the full list of FCC Registered Microwave Towers in this town)
FCC Registered Paging Towers: 83 (See the full list of FCC Registered Paging Towers)
FCC Registered Maritime Coast & Aviation Ground Towers: 66 (See the full list of FCC Registered Maritime Coast & Aviation Ground Towers)
FCC Registered Amateur Radio Licenses: 4,670 (See the full list of FCC Registered Amateur Radio Licenses in Austin)
FAA Registered Aircraft Manufacturers and Dealers: 21 (See the full list of FAA Registered Manufacturers and Dealers in Austin)
FAA Registered Aircraft: 911 (See the full list of FAA Registered Aircraft)
| Home Mortgage Disclosure Act Aggregated Statistics For Year 2009 (Based on 146 full and 29 partial tracts) | ||||||||||||||
| A) FHA, FSA/RHS & VA Home Purchase Loans | B) Conventional Home Purchase Loans | C) Refinancings | D) Home Improvement Loans | E) Loans on Dwellings For 5+ Families | F) Non-occupant Loans on < 5 Family Dwellings (A B C & D) | G) Loans On Manufactured Home Dwelling (A B C & D) | ||||||||
|---|---|---|---|---|---|---|---|---|---|---|---|---|---|---|
| Number | Average Value | Number | Average Value | Number | Average Value | Number | Average Value | Number | Average Value | Number | Average Value | Number | Average Value | |
| LOANS ORIGINATED | 2,387 | $176,912 | 5,694 | $228,903 | 13,498 | $221,542 | 845 | $94,077 | 41 | $6,292,809 | 1,416 | $193,738 | 45 | $56,237 |
| APPLICATIONS APPROVED, NOT ACCEPTED | 92 | $167,519 | 484 | $212,253 | 1,252 | $198,468 | 129 | $86,678 | 3 | $647,000 | 148 | $161,727 | 32 | $40,545 |
| APPLICATIONS DENIED | 703 | $145,947 | 1,067 | $206,969 | 3,571 | $214,089 | 787 | $62,669 | 9 | $4,025,889 | 582 | $168,240 | 60 | $45,408 |
| APPLICATIONS WITHDRAWN | 331 | $171,879 | 747 | $257,254 | 2,724 | $214,550 | 333 | $63,082 | 5 | $20,595,800 | 327 | $191,618 | 7 | $66,499 |
| FILES CLOSED FOR INCOMPLETENESS | 25 | $179,549 | 102 | $299,116 | 659 | $220,515 | 100 | $97,347 | 0 | $0 | 60 | $151,698 | 2 | $38,345 |
Detailed mortgage data for all 175 tracts in Austin, TX
| Private Mortgage Insurance Companies Aggregated Statistics For Year 2009 (Based on 134 full and 29 partial tracts) | ||||||
| A) Conventional Home Purchase Loans | B) Refinancings | C) Non-occupant Loans on < 5 Family Dwellings (A & B) | ||||
|---|---|---|---|---|---|---|
| Number | Average Value | Number | Average Value | Number | Average Value | |
| LOANS ORIGINATED | 783 | $231,184 | 351 | $227,944 | 17 | $244,669 |
| APPLICATIONS APPROVED, NOT ACCEPTED | 204 | $228,389 | 105 | $240,717 | 24 | $201,130 |
| APPLICATIONS DENIED | 126 | $231,554 | 60 | $253,290 | 10 | $252,432 |
| APPLICATIONS WITHDRAWN | 45 | $253,757 | 40 | $235,049 | 2 | $525,500 |
| FILES CLOSED FOR INCOMPLETENESS | 24 | $207,442 | 7 | $269,020 | 2 | $128,500 |
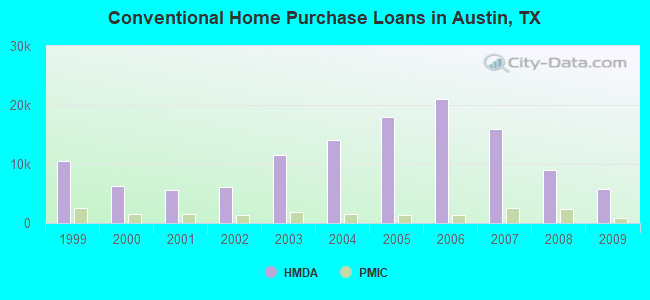
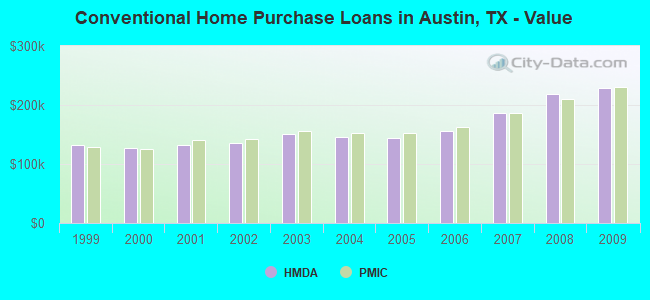
2002 - 2018 National Fire Incident Reporting System (NFIRS) incidents
- Fire incident types reported to NFIRS in Austin, TX
- 20,18351.1%Outside Fires
- 10,68227.1%Structure Fires
- 7,14518.1%Mobile Property/Vehicle Fires
- 1,4763.7%Other
 Based on the data from the years 2002 - 2018 the average number of fires per year is 2323. The highest number of reported fires - 3,415 took place in 2011, and the least - 555 in 2017. The data has an increasing trend.
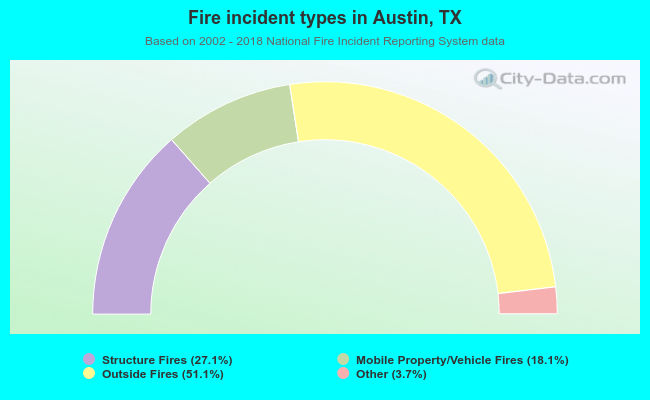 When looking into fire subcategories, the most incidents belonged to: Outside Fires (51.1%), and Structure Fires (27.1%).
Fire-safe hotels and motels in Austin, Texas:
- Hawthorn Suites Austin Central, 935 Ln Posada Dr, Austin, Texas 78752 , Phone: (512) 459-3335, Fax: (512) 467-9736
- Omni Austin Hotel At Southpark, 4140 Governor's Row, Austin, Texas 78744 , Phone: (512) 448-2222, Fax: (512) 448-4744
- Rodeway Inn At University, 2900 Ih-35 N, Austin, Texas 78705 , Phone: (512) 477-6395, Fax: (512) 477-1830
- Lakeway Resort & Spa, 101 Lakeway Dr, Austin, Texas 78734 , Phone: (512) 261-6600, Fax: (512) 261-7322
- Howard Johnson Plaza Austin, 7800 N Ih-35, Austin, Texas 78753 , Phone: (512) 836-8520, Fax: (512) 837-0897
- Holiday Inn Austin Midtown, 6000 Middle Fiskville Rd, Austin, Texas 78752 , Phone: (512) 451-5757, Fax: (512) 206-3017
- The Driskill Hotel, 604 Brazos St, Austin, Texas 78701 , Phone: (512) 474-5911, Fax: (512) 474-2214
- Embassy Suites Austin North, 5901 N Ih-35, Austin, Texas 78723 , Phone: (512) 454-8004, Fax: (512) 454-9047
- 150 other hotels and motels
| Most common first names in Austin, TX among deceased individuals | ||
| Name | Count | Lived (average) |
|---|---|---|
| Mary | 2,084 | 78.7 years |
| John | 1,914 | 73.1 years |
| James | 1,663 | 71.2 years |
| William | 1,646 | 74.0 years |
| Robert | 1,405 | 70.9 years |
| Charles | 968 | 72.7 years |
| George | 806 | 74.9 years |
| Dorothy | 773 | 77.6 years |
| Ruth | 660 | 81.9 years |
| Margaret | 629 | 80.1 years |
| Most common last names in Austin, TX among deceased individuals | ||
| Last name | Count | Lived (average) |
|---|---|---|
| Smith | 1,037 | 76.6 years |
| Johnson | 799 | 75.9 years |
| Williams | 724 | 74.8 years |
| Brown | 578 | 73.0 years |
| Jones | 575 | 74.7 years |
| Davis | 566 | 76.2 years |
| Moore | 401 | 74.6 years |
| Miller | 395 | 75.3 years |
| Anderson | 393 | 76.3 years |
| Jackson | 379 | 74.2 years |
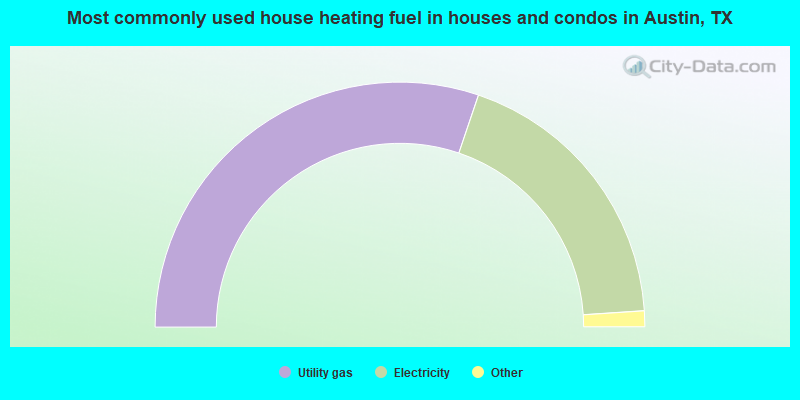
- 59.3%Utility gas
- 38.6%Electricity
- 1.4%Bottled, tank, or LP gas
- 0.4%Solar energy
- 0.1%No fuel used
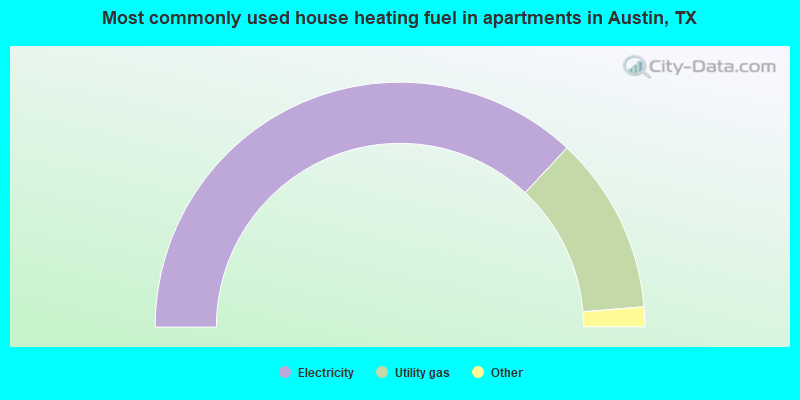
- 73.9%Electricity
- 23.5%Utility gas
- 1.5%Bottled, tank, or LP gas
- 0.6%No fuel used
- 0.2%Other fuel
- 0.1%Solar energy
- 0.1%Fuel oil, kerosene, etc.
Austin compared to Texas state average:
- Median house value above state average.
- Unemployed percentage significantly below state average.
- Foreign-born population percentage above state average.
- Renting percentage above state average.
- Number of rooms per house below state average.
- Number of college students above state average.
- Percentage of population with a bachelor's degree or higher significantly above state average.
Austin, TX compared to other similar cities:
Austin on our top lists:
- #3 on the list of "Top 101 cities with the most mentions on city-data.com forum"
- #16 on the list of "Top 101 biggest cities in 2013"
- #16 on the list of "Top 100 biggest cities"
- #19 on the list of "Top 101 cities with the largest percentage of people in wards in military hospitals for patients who have no usual home elsewhere (population 1,000+)"
- #38 on the list of "Top 101 cities with largest percentage of females in occupations: extraction workers (population 50,000+)"
- #38 on the list of "Top 101 cities with largest percentage of females in occupations: fishing and hunting, and forest and logging workers (population 50,000+)"
- #38 on the list of "Top 101 cities with largest percentage of males in industries: farm product raw materials merchant wholesalers (population 50,000+)"
- #38 on the list of "Top 101 cities with largest percentage of females in industries: farm product raw materials merchant wholesalers (population 50,000+)"
- #39 on the list of "Top 101 cities with the largest percentage of likely homosexual households (counted as self-reported same-sex unmarried-partner households) (population 50,000+)"
- #39 on the list of "Top 101 cities with largest percentage of males in industries: broadcasting, internet publishing, and telecommunications services (population 50,000+)"
- #39 on the list of "Top 101 cities with largest percentage of females in industries: broadcasting, internet publishing, and telecommunications services (population 50,000+)"
- #39 on the list of "Top 101 cities with largest percentage of males in industries: wholesale electronic markets and agents and brokers (population 50,000+)"
- #39 on the list of "Top 101 cities with largest percentage of females in industries: wholesale electronic markets and agents and brokers (population 50,000+)"
- #40 on the list of "Top 101 cities with the largest percentage of likely lesbian couples (counted as self-reported female-female unmarried-partner households) (population 50,000+)"
- #43 on the list of "Top 101 cities with largest percentage of males in occupations: arts, design, entertainment, sports, and media occupations (population 50,000+)"
- #43 on the list of "Top 101 cities with the highest number of thefts per 100,000 residents, excludes tourist destinations and others with a lot of outsiders visiting based on city industries data (population 50,000+)"
- #43 on the list of "Top 101 cities with the lowest percentage of family households, population 100,000+"
- #43 on the list of "Top 100 cities with largest land areas (pop. 50,000+)"
- #54 on the list of "Top 101 cities with the hottest summers (population 50,000+)"
- #55 on the list of "Top 100 cities with the largest percentage of males (pop. 50,000+)"
- #1 (78701) on the list of "Top 101 zip codes with the most alcohol drinking places in 2005"
- #8 (78701) on the list of "Top 101 zip codes with the most offices of lawyers in 2005"
- #16 (78705) on the list of "Top 101 zip codes with the most offices of physicians in 2005"
- #17 (78701) on the list of "Top 101 zip codes with the highest 2012 average reported profit/loss from business (pop 1,000+)"
- #19 (78705) on the list of "Top 101 zip codes with the smallest percentage of taxpayers using paid preparers for 2012 taxes (pop 5,000+)"
- #29 (78719) on the list of "Top 101 zip codes with the lowest charity contributions deductions as a percentage of AGI in 2012 (pop 1,000+)"
- #34 (78746) on the list of "Top 101 zip codes with the highest 2012 average net capital gain/loss (pop 5,000+)"
- #47 (78746) on the list of "Top 101 zip codes with the highest 2012 average Adjusted Gross Income (AGI) for individuals (pop 5,000+)"
- #52 (78759) on the list of "Top 101 zip codes with the most Internet business establishments in 2005"
- #63 (78746) on the list of "Top 101 zip codes with the highest 2012 average taxable interest for individuals (pop 5,000+)"
- #79 (78759) on the list of "Top 101 zip codes with the most finance and insurance companies in 2005"
- #94 (78741) on the list of "Top 101 zip codes with the smallest percentage of taxpayers using charity contributions deductions in 2012 (pop 5,000+)"
- #11 on the list of "Top 101 counties with highest percentage of residents voting for 3rd party candidates in the 2012 Presidential Election (pop. 50,000+)"
- #18 on the list of "Top 101 counties with the largest number of people moving in compared to moving out (pop. 50,000+)"
- #20 on the list of "Top 101 counties with the lowest number of deaths per 1000 residents 2007-2013 (pop. 50,000+)"
- #34 on the list of "Top 101 counties with the most Evangelical Protestant adherents"
- #43 on the list of "Top 101 counties with the most Evangelical Protestant congregations (pop. 50,000+)"

|
|
Total of 30001 patent applications in 2008-2024.