Estimated zip code population in 2022: 27,839 Zip code population in 2010: 20,299 Zip code population in 2000: 17,298
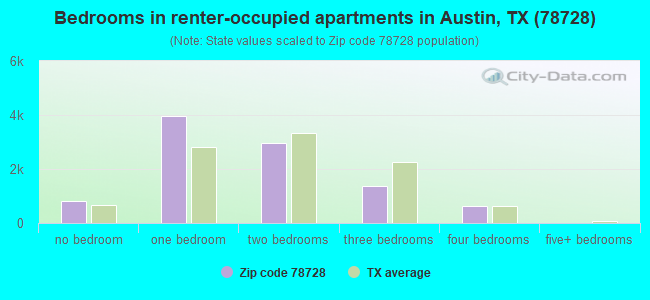
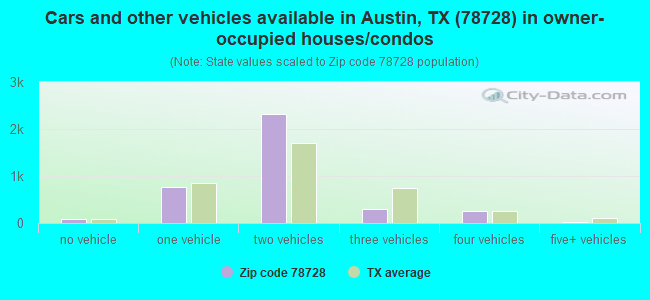
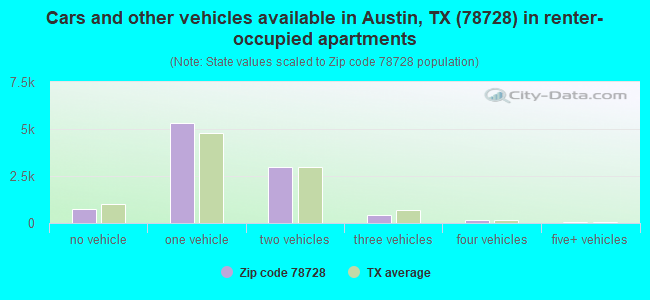
Houses and condos: 14,153 Renter-occupied apartments: 9,687
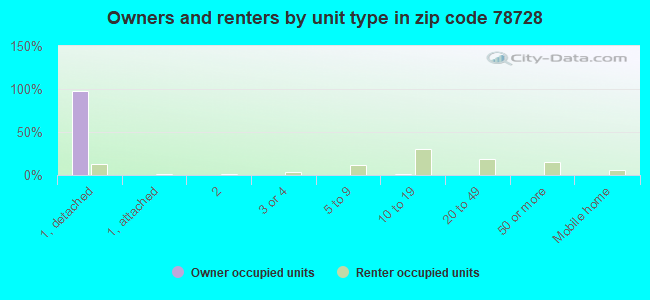
% of renters here:
72%
State:
38%
March 2022 cost of living index in zip code 78728: 94.9 (less than average, U.S. average is 100)
Land area: 8.1 sq. mi. Water area: 0.0 sq. mi.
Population density: 3,433 people per square mile
(average).
OSM Map
General Map
Google Map
MSN Map
OSM Map
General Map
Google Map
MSN Map
OSM Map
General Map
Google Map
MSN Map
OSM Map
General Map
Google Map
MSN Map
Please wait while loading the map...
Real estate property taxes paid for housing units in 2022:
This zip code:
1.6% ($6,385)
Texas:
1.5% ($4,050)
Median real estate property taxes paid for housing units with mortgages in 2022: $6,452 (1.6%) Median real estate property taxes paid for housing units with no mortgage in 2022: $6,386 (1.5%)
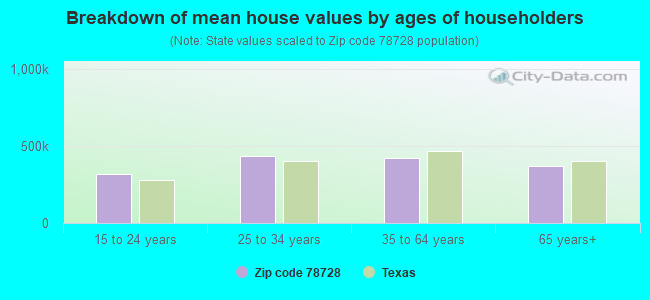
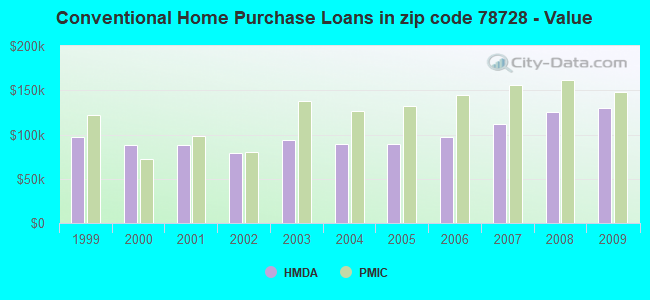
Estimated median house/condo value in 2022: $410,786
78728:
$410,786
Texas:
$275,400
According to our research of Texas and other state lists, there were 35 registered sex offenders living in 78728 zip code as of April 28, 2024. The ratio of all residents to sex offenders in zip code 78728 is 633 to 1. The ratio of registered sex offenders to all residents in this zip code is lower than the state average.
Median resident age:
This zip code:
34.2 years
Texas median age:
35.6 years
Average household size:
This zip code:
2.1 people
Texas:
2.6 people
Averages for the 2020 tax year for zip code 78728, filed in 2021:
Average Adjusted Gross Income (AGI) in 2020: $61,004 (Individual Income Tax Returns)
Here:
$61,004
State:
$77,054
Salary/wage: $57,948 (reported on 88.7% of returns)
Here:
$57,948
State:
$62,766
(% of AGI for various income ranges: 1236.7% for AGIs below $25k, 3795.8% for AGIs $25k-50k, 7022.7% for AGIs $50k-75k, 10533.9% for AGIs $75k-100k, 19326.3% for AGIs $100k-200k, 63581.8% for AGIs over 200k)
Taxable interest for individuals: $702 (reported on 20.7% of returns)
This zip code:
$702
Texas:
$2,665
(% of AGI for various income ranges: 5.6% for AGIs below $25k, 8.2% for AGIs $25k-50k, 14.3% for AGIs $50k-75k, 20.2% for AGIs $75k-100k, 67.9% for AGIs $100k-200k, 212.4% for AGIs over 200k)
Ordinary dividends: $2,907 (reported on 16.2% of returns)
Here:
$2,907
State:
$10,044
(% of AGI for various income ranges: 10.6% for AGIs below $25k, 15.3% for AGIs $25k-50k, 31.7% for AGIs $50k-75k, 110.2% for AGIs $75k-100k, 182.8% for AGIs $100k-200k, 1202.9% for AGIs over 200k)
Net capital gain/loss in AGI: +$10,135 (reported on 16.5% of returns)
Here:
+$10,135
State:
+$39,590
(% of AGI for various income ranges: 8.3% for AGIs below $25k, 13.3% for AGIs $25k-50k, 54.6% for AGIs $50k-75k, 97.8% for AGIs $75k-100k, 442.7% for AGIs $100k-200k, 8744.7% for AGIs over 200k)
Profit/loss from business: +$9,161 (reported on 17.8% of returns)
Here:
+$9,161
State:
+$10,888
(% of AGI for various income ranges: 116.0% for AGIs below $25k, 142.7% for AGIs $25k-50k, 153.8% for AGIs $50k-75k, 364.0% for AGIs $75k-100k, 516.7% for AGIs $100k-200k, 1358.8% for AGIs over 200k)
Taxable individual retirement arrangement distribution: $15,241 (reported on 3.9% of returns)
78728:
$15,241
Texas:
$24,740
(% of AGI for various income ranges: 19.4% for AGIs below $25k, 26.1% for AGIs $25k-50k, 64.9% for AGIs $50k-75k, 221.5% for AGIs $75k-100k, 230.8% for AGIs $100k-200k, 635.9% for AGIs over 200k)
Self-employed (Keogh) retirement plans: $18,133 (reported on 0.2% of returns)
78728:
$18,133
Texas:
$29,298
(% of AGI for various income ranges: 51.3% for AGIs $100k-200k)
Total itemized deductions: $25,089 (reported on 4.7% of returns)
Here:
$25,089
State:
$40,428
(% of AGI for various income ranges: 17.8% for AGIs below $25k, 39.2% for AGIs $25k-50k, 159.0% for AGIs $50k-75k, 301.5% for AGIs $75k-100k, 509.0% for AGIs $100k-200k, 1994.7% for AGIs over 200k)
Charity contributions: $8,470 (reported on 3.5% of returns)
Here:
$8,470
State:
$18,201
(% of AGI for various income ranges: 8.9% for AGIs $25k-50k, 26.2% for AGIs $50k-75k, 47.4% for AGIs $75k-100k, 134.8% for AGIs $100k-200k, 804.7% for AGIs over 200k)
Taxes paid: $6,523 (reported on 4.6% of returns)
78728:
$6,523
State:
$7,821
(% of AGI for various income ranges: 2.6% for AGIs below $25k, 7.3% for AGIs $25k-50k, 39.6% for AGIs $50k-75k, 95.0% for AGIs $75k-100k, 140.3% for AGIs $100k-200k, 421.8% for AGIs over 200k)
Earned income credit: $2,091 (reported on 16.0% of returns)
Here:
$2,091
State:
$2,584
(% of AGI for various income ranges: 88.7% for AGIs below $25k, 54.1% for AGIs $25k-50k)
Percentage of individuals using paid preparers for their 2020 taxes: 93.6%
Here:
94%
State:
92%
(% for various income ranges: 92.6% for AGIs below $25k, 94.2% for AGIs $25k-50k, 94.2% for AGIs $50k-75k, 93.9% for AGIs $75k-100k, 93.7% for AGIs $100k-200k, 91.5% for AGIs over 200k)
Averages for the 2012 tax year for zip code 78728, filed in 2013:
Average Adjusted Gross Income (AGI) in 2012: $47,639 (Individual Income Tax Returns)
Here:
$47,639
State:
$65,384
Salary/wage: $44,470 (reported on 91.1% of returns)
Here:
$44,470
State:
$52,524
(% of AGI for various income ranges: 84.6% for AGIs below $25k, 91.5% for AGIs $25k-50k, 88.9% for AGIs $50k-75k, 88.2% for AGIs $75k-100k, 86.1% for AGIs $100k-200k, 48.6% for AGIs over 200k)
Taxable interest for individuals: $593 (reported on 22.4% of returns)
This zip code:
$593
Texas:
$2,372
(% of AGI for various income ranges: 0.4% for AGIs below $25k, 0.2% for AGIs $25k-50k, 0.4% for AGIs $50k-75k, 0.3% for AGIs $75k-100k, 0.2% for AGIs $100k-200k, 0.4% for AGIs over 200k)
Ordinary dividends: $2,523 (reported on 13.2% of returns)
Here:
$2,523
State:
$9,721
(% of AGI for various income ranges: 1.0% for AGIs below $25k, 0.5% for AGIs $25k-50k, 0.6% for AGIs $50k-75k, 0.7% for AGIs $75k-100k, 0.8% for AGIs $100k-200k, 1.0% for AGIs over 200k)
Net capital gain/loss in AGI: +$3,774 (reported on 10.8% of returns)
Here:
+$3,774
State:
+$35,319
(% of AGI for various income ranges: 0.6% for AGIs $75k-100k, 1.0% for AGIs $100k-200k, 6.3% for AGIs over 200k)
Profit/loss from business: +$10,120 (reported on 13.6% of returns)
Here:
+$10,120
State:
+$13,732
(% of AGI for various income ranges: 7.1% for AGIs below $25k, 2.0% for AGIs $25k-50k, 2.4% for AGIs $50k-75k, 1.9% for AGIs $75k-100k, 2.4% for AGIs $100k-200k, 4.8% for AGIs over 200k)
Taxable individual retirement arrangement distribution: $14,032 (reported on 4.7% of returns)
78728:
$14,032
Texas:
$19,511
(% of AGI for various income ranges: 1.3% for AGIs below $25k, 0.9% for AGIs $25k-50k, 1.3% for AGIs $50k-75k, 1.3% for AGIs $75k-100k, 2.5% for AGIs $100k-200k)
Total itemized deductions: $16,520 (19% of AGI, reported on 18.9% of returns)
Here:
$16,520
State:
$24,724
Here:
18.6% of AGI
State:
15.9% of AGI
(% of AGI for various income ranges: 4.4% for AGIs below $25k, 4.5% for AGIs $25k-50k, 8.0% for AGIs $50k-75k, 8.0% for AGIs $75k-100k, 8.2% for AGIs $100k-200k, 4.7% for AGIs over 200k)
Charity contributions: $3,528 (reported on 14.1% of returns)
Here:
$3,528
State:
$6,808
(% of AGI for various income ranges: 0.4% for AGIs below $25k, 0.5% for AGIs $25k-50k, 1.0% for AGIs $50k-75k, 1.3% for AGIs $75k-100k, 1.7% for AGIs $100k-200k, 1.3% for AGIs over 200k)
Taxes paid: $4,934 (reported on 18.4% of returns)
78728:
$4,934
State:
$6,921
(% of AGI for various income ranges: 0.8% for AGIs below $25k, 1.2% for AGIs $25k-50k, 2.3% for AGIs $50k-75k, 2.4% for AGIs $75k-100k, 2.6% for AGIs $100k-200k, 1.5% for AGIs over 200k)
Earned income credit: $2,088 (reported on 17.2% of returns)
Here:
$2,088
State:
$2,570
(% of AGI for various income ranges: 5.4% for AGIs below $25k, 0.8% for AGIs $25k-50k)
Percentage of individuals using paid preparers for their 2012 taxes: 30.4%
Here:
30%
State:
51%
(% for various income ranges: 31.6% for AGIs below $25k, 26.8% for AGIs $25k-50k, 29.6% for AGIs $50k-75k, 31.4% for AGIs $75k-100k, 36.2% for AGIs $100k-200k, 54.5% for AGIs over 200k)
Averages for the 2004 tax year for zip code 78728, filed in 2005:
Average Adjusted Gross Income (AGI) in 2004: $42,454 (Individual Income Tax Returns)
Here:
$42,454
State:
$47,881
Salary/wage: $41,701 (reported on 93.2% of returns)
Here:
$41,701
State:
$41,947
(% of AGI for various income ranges: 124.4% for AGIs below $10k, 91.4% for AGIs $10k-25k, 92.9% for AGIs $25k-50k, 91.8% for AGIs $50k-75k, 91.7% for AGIs $75k-100k, 87.9% for AGIs over 100k)
Taxable interest for individuals: $631 (reported on 32.4% of returns)
This zip code:
$631
Texas:
$2,255
(% of AGI for various income ranges: 2.6% for AGIs below $10k, 0.6% for AGIs $10k-25k, 0.4% for AGIs $25k-50k, 0.3% for AGIs $50k-75k, 0.4% for AGIs $75k-100k, 0.5% for AGIs over 100k)
Taxable dividends: $1,291 (reported on 16.3% of returns)
Here:
$1,291
State:
$4,261
(% of AGI for various income ranges: 2.1% for AGIs below $10k, 0.3% for AGIs $10k-25k, 0.4% for AGIs $25k-50k, 0.5% for AGIs $50k-75k, 0.6% for AGIs $75k-100k, 0.6% for AGIs over 100k)
Net capital gain/loss: +$2,080 (reported on 16.4% of returns)
Here:
+$2,080
State:
+$16,110
(% of AGI for various income ranges: -2.2% for AGIs below $10k, -0.1% for AGIs $10k-25k, 0.1% for AGIs $25k-50k, 0.3% for AGIs $50k-75k, 0.5% for AGIs $75k-100k, 2.8% for AGIs over 100k)
Profit/loss from business: +$8,151 (reported on 12.4% of returns)
Here:
+$8,151
State:
+$11,013
(% of AGI for various income ranges: 3.9% for AGIs below $10k, 4.1% for AGIs $10k-25k, 2.1% for AGIs $25k-50k, 2.6% for AGIs $50k-75k, 1.6% for AGIs $75k-100k, 2.3% for AGIs over 100k)
IRA payment deduction: $2,599 (reported on 1.9% of returns)
78728:
$2,599
Texas:
$3,120
(% of AGI for various income ranges: 0.1% for AGIs $10k-25k, 0.1% for AGIs $25k-50k, 0.1% for AGIs $50k-75k, 0.1% for AGIs $75k-100k, 0.1% for AGIs over 100k)
Self-employed pension: $8,400 (reported on 0.2% of returns)
Here:
$8,400
Texas:
$16,401
Total itemized deductions: $14,518 (20% of AGI, reported on 29.2% of returns)
Here:
$14,518
State:
$19,631
Here:
19.8% of AGI
State:
18.9% of AGI
(% of AGI for various income ranges: 10.9% for AGIs below $10k, 5.8% for AGIs $10k-25k, 7.3% for AGIs $25k-50k, 11.7% for AGIs $50k-75k, 12.9% for AGIs $75k-100k, 11.0% for AGIs over 100k)
Charity contributions deductions: $2,371 (3% of AGI, reported on 23.1% of returns)
Here:
$2,371
State:
$4,753
Here:
3.1% of AGI
State:
4.2% of AGI
(% of AGI for various income ranges: 0.7% for AGIs below $10k, 0.4% for AGIs $10k-25k, 0.8% for AGIs $25k-50k, 1.3% for AGIs $50k-75k, 1.8% for AGIs $75k-100k, 1.9% for AGIs over 100k)
Total tax: $5,815 (reported on 79.9% of returns)
78728:
$5,815
State:
$9,058
(% of AGI for various income ranges: 2.4% for AGIs below $10k, 4.5% for AGIs $10k-25k, 8.2% for AGIs $25k-50k, 10.8% for AGIs $50k-75k, 11.9% for AGIs $75k-100k, 16.5% for AGIs over 100k)
Earned income credit: $1,631 (reported on 14.0% of returns)
Here:
$1,631
State:
$2,024
Percentage of individuals using paid preparers for their 2004 taxes: 36.6%
Here:
37%
State:
57%
(% for various income ranges: 36.6% for AGIs below $10k, 43.3% for AGIs $10k-25k, 34.9% for AGIs $25k-50k, 31.9% for AGIs $50k-75k, 33.9% for AGIs $75k-100k, 33.5% for AGIs over 100k)
Likely homosexual households (counted as self-reported same-sex unmarried-partner households)
Lesbian couples: 0.2% of all households
Gay men: 0.1% of all households
Household received Food Stamps/SNAP in the past 12 months: 779 Household did not receive Food Stamps/SNAP in the past 12 months: 12,624
Women who had a birth in the past 12 months: 483 (347 now married, 136 unmarried) Women who did not have a birth in the past 12 months: 8,207 (3,950 now married, 4,246 unmarried)
Housing units in zip code 78728 with a mortgage: 2,632 (137 second mortgage, 149 both second mortgage and home equity loan) Houses without a mortgage: 12
Median monthly owner costs for units with a mortgage: $2,025 Median monthly owner costs for units without a mortgage: $872
Residents with income below the poverty level in 2022:
This zip code:
15.2%
Whole state:
14.0%
Residents with income below 50% of the poverty level in 2022:
This zip code:
10.4%
Whole state:
7.4%
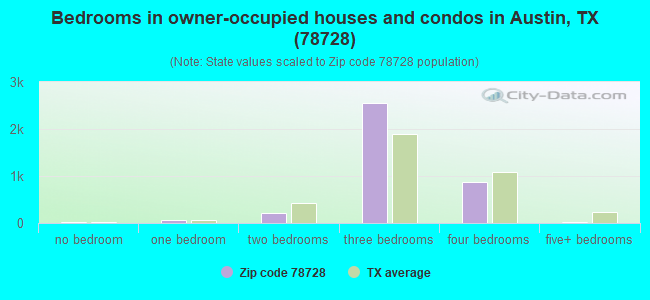
Median number of rooms in houses and condos:
Here:
5.7
State:
6.3
Median number of rooms in apartments:
Here:
3.7
State:
4.0
Notable locations in this zip code not listed on our city pages
Notable locations in zip code 78728: Wells Branch Community Library (A), Travis County Emergency Services District 2 Station 2 (B), Hospira Incorporated (C), Travis County Search and Rescue Team (D). Display/hide their locations on the map
Churches in zip code 78728 include: Calvary Hill Bible Fellowship Church (A), Saint Andrews Presbyterian Church (B), Wells Branch United Methodist Church (C), Apostolic Praise Center (D), Wells Branch Church of Christ (E). Display/hide their locations on the map
3,639 married couples with children.
1,674 single-parent households (562 men, 1,112 women).
65.7% of residents of 78728 zip code speak English at home.
17.7% of residents speak Spanish at home (65% very well, 17% well, 15% not well, 4% not at all).
9.7% of residents speak other Indo-European language at home (60% very well, 24% well, 13% not well, 4% not at all).
5.1% of residents speak Asian or Pacific Island language at home (54% very well, 22% well, 3% not well, 21% not at all).
2.2% of residents speak other language at home (77% very well, 14% well, 9% not well).
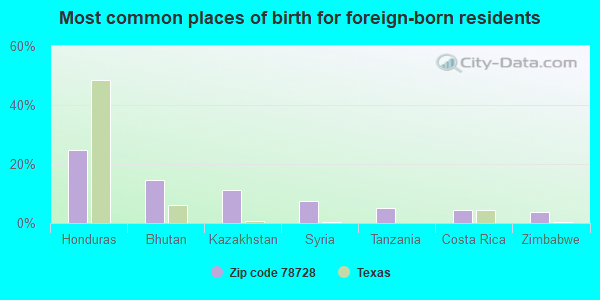
Foreign born population: 6,492 (23.3%) (35.0% of them are naturalized citizens)
This zip code:
23.3%
Whole state:
17.2%
25%Honduras
15%Bhutan
11%Kazakhstan
7%Syria
5%Tanzania
4%Costa Rica
4%Zimbabwe
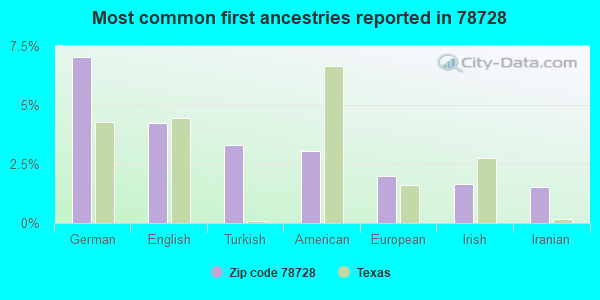
7%German
4%English
3%Turkish
3%American
2%European
2%Irish
2%Iranian
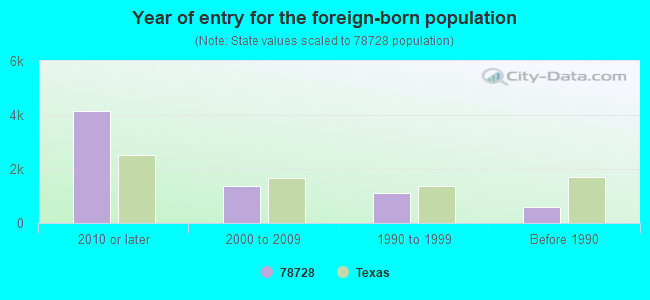
Year of entry for the foreign-born population
4,1422010 or later
1,3872000 to 2009
1,1181990 to 1999
600Before 1990
Facilities with environmental interests located in this zip code:
AMTECH LIGHTING SERVICES (1709 BENCHMARK in AUSTIN, TX)
(Resource Conservation and Recovery Act (tracking hazardous waste)) Business NAICS classification: CONSUMER ELECTRONICS REPAIR AND MAINTENANCE.
AUSTIN MOTOR EXCHANGE (1710 BENCH MARK DRIVE in AUSTIN, TX)
(Resource Conservation and Recovery Act (tracking hazardous waste))
AUSTIN AUTO BODY (1902 FLEISCHER STE 106 in AUSTIN, TX)
(Resource Conservation and Recovery Act (tracking hazardous waste))
AUSTIN WOOD WORKS INC (1806 HYDRO in AUSTIN, TX)
Small Quantity Generators, between 100 kg and 1000 kg of hazardous waste/month (Resource Conservation and Recovery Act (tracking hazardous waste)) - notification Organizations: STEVE ELLIS (CONTACT/OWNER)
Housing units lacking complete plumbing facilities: 0.8% Housing units lacking complete kitchen facilities: 0.8%
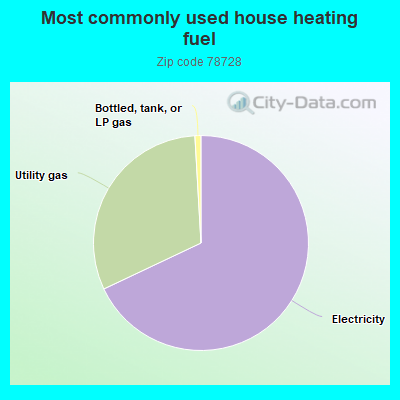
67.9%Electricity
31.1%Utility gas
0.9%Bottled, tank, or LP gas
Population in 1990: 8,051. Population change in the 1990s: +9,247 (+114.9%).
Place of birth for U.S.-born residents:
This state: 12,125
Northeast: 1,594
Midwest: 2,386
South: 2,918
West: 2,115
22% of the 78728 zip code residents lived in the same house 5 years ago. Out of people who lived in different houses, 39% lived in this county. Out of people who lived in different counties, 50% lived in Texas.
79% of the 78728 zip code residents lived in the same house 1 year ago. Out of people who lived in different houses, 42% moved from this county. Out of people who lived in different houses, 20% moved from different county within same state. Out of people who lived in different houses, 24% moved from different state. Out of people who lived in different houses, 15% moved from abroad.
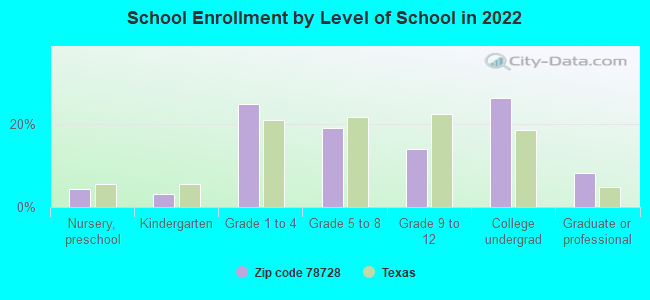
Private vs. public school enrollment:
Students in private schools in grades 1 to 8 (elementary and middle school): 496
Here:
19.8%
Texas:
8.8%
Students in private schools in grades 9 to 12 (high school): 98
Here:
12.4%
Texas:
8.0%
Students in private undergraduate colleges: 658
Here:
44.1%
Texas:
16.2%
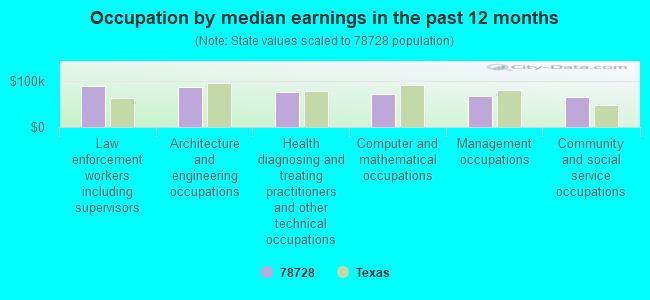
Occupation by median earnings in the past 12 months ($)
89,410Law enforcement workers including supervisors
87,831Architecture and engineering occupations
76,553Health diagnosing and treating practitioners and other technical occupations
71,835Computer and mathematical occupations
68,463Management occupations
66,833Community and social service occupations
Companies with federal contracts located in this zip code (AUSTIN, TX):
FLIGHT DIRECTOR INC (100 MICHAEL ANGELO WAY BLD; small business) : $3,000,857 in 29 contractsfrom 2000 to 2006
Contracts for Aircraft, Fixed Wing, Radar Equipment, Airborne, Automatic Pilot Mechanisms and Airborne Gyro Components, Radio Navigation Equipment, Airborne, and moreby Department of State, Air Force, National Transportation Safety Board, Defense Logistics Agency, and others Signed by year:2000: $0; 2001: $446,001; 2002: $1,476,620; 2003: $848,914; 2004: $112,112; 2005: $86,210; 2006: $31,000.
Biggest contracts:
$995,000 with Department of State for Aircraft, Fixed Wing. Signed on 2002-01-15. Completion date: 2002-02-15.
$389,931 with Air Force for Radar Equipment, Airborne. Signed on 2003-01-24. Completion date: 2003-02-28.
$281,608, same as above.Signed on 2003-05-30. Completion date: 2003-07-31.
$246,743 with Air Force for Automatic Pilot Mechanisms and Airborne Gyro Components. Signed on 2002-08-22. Completion date: 2002-11-29.
ETJ CORPORATION (13807 AVENUE K; small business)
$293,250 with Army for Chain and Wire Rope. Signed on 2006-05-08. Completion date: 2006-09-30.
ALPHA OMEGA CONSTRUCTION, INC (1802 BENCH MARK DR; small business) : $124,559 in 2 contractsin 2001
$99,500 with Air Force for Construction of Structures and Facilities -- Other Administrative Facilities and Service Buildings. Signed on 2001-02-26. Completion date: 2001-06-15.
$25,059, same as above.Signed on 2001-04-25. Completion date: 2001-04-25.
TECHNOLOGY STRATEGIC PLANNING, (14205 BURNET RD)
$119,157 with Navy for Other Defense -- Basic Research (R&D). Signed on 2000-08-29. Completion date: 2000-12-31.
CATERING CO PF AUSTIN (14611 BURNET RD; small business) : $49,652 in 7 contractsfrom 2005 to 2006
Contracts for Condiments and Related Products, Food Services, Food Items For Resale by Army Signed by year:2000: $0; 2001: $0; 2002: $0; 2003: $0; 2004: $0; 2005: $13,300; 2006: $36,352.
Biggest contracts:
$16,160 with Army for Condiments and Related Products. Signed on 2006-06-22. Completion date: 2006-07-01.
$12,992 with Army for Food Services. Signed on 2006-06-09. Completion date: 2006-06-16.
$10,096 with Army for Food Items For Resale. Signed on 2006-06-13. Completion date: 2006-06-16.
$8,000 with Army for Food Services. Signed on 2005-09-28. Completion date: 2005-09-30.
ROLAND BECTON (2215 GRAND AVENUE PKWY; small business) : $39,820 in 2 contractsin 2005
$26,220 with Navy for Electrical and Electronic Properties Measuring and Testing Instruments. Taking place in SC. Signed on 2005-09-12. Completion date: 2005-11-07.
$13,600 with Navy for Electrical and Electronic Properties Measuring and Testing Instruments. Signed on 2005-02-14. Completion date: 2005-04-08.
CLYNCH, JAMES R (14922 DORIA DR; small business)
$17,600 with Navy for Other Professional Services. Signed on 2004-03-31. Completion date: 2004-09-30.
HSB PROFESSIONAL LOSS CONTROL, (4616 W HOWARD LANE BLDG 2)
$16,000 with Army for Nuclear Medicine. Signed on 2002-01-24. Completion date: 2002-02-28.
WIRELESS DATA SOLUTIONS (2023 CERVIN BLVD; small business)
$14,375 with Air Force for ADP Telecommunications and Transmission Services. Signed on 2005-09-14. Completion date: 2005-10-31.
CAD SUPPLY SPECIALTIES, INC (13734 N I H 35; small business) : $10,092 in 4 contractsfrom 2003 to 2004
$9,735 with Army for Office Supplies. Signed on 2003-02-21. Completion date: 2003-02-18.
$1,840 with Army for ADP Supplies. Signed on 2003-04-02. Completion date: 2003-03-16.
$242 with Army for Printing, Duplicating, and Bookbinding Equipment. Signed on 2003-04-15. Completion date: 2003-04-21.
-$1,725 with Army for Office Supplies. Signed on 2004-06-09. Completion date: 2003-02-18.
Top industries in this zip code by the number of employees in 2005:
Finance and Insurance: Direct Property and Casualty Insurance Carriers (over 1000 employees: 1 establishment, 250-499 employees: 1 establishment, 20-49 employees: 1 establishment, 1-4 employees: 1 establishment)
2002 - 2018 National Fire Incident Reporting System (NFIRS) incidents
Based on the data from the years 2002 - 2018 the average number of fire incidents per year is 37. The highest number of fires - 66 took place in 2016, and the least - 7 in 2002. The data has a growing trend.
When looking into fire subcategories, the most incidents belonged to: Outside Fires (40.4%), and Structure Fires (32.5%).
Fire incident types reported to NFIRS in Zip Code 78728

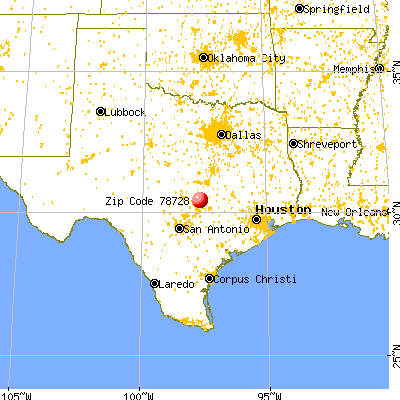


 Nearest zip codes: 78727, 78729, 78664, 78758, 78717, 78753.


 Based on the data from the years 2002 - 2018 the average number of fire incidents per year is 37. The highest number of fires - 66 took place in 2016, and the least - 7 in 2002. The data has a growing trend.
 When looking into fire subcategories, the most incidents belonged to: Outside Fires (40.4%), and Structure Fires (32.5%).