Estimated zip code population in 2022: 52,561 Zip code population in 2010: 44,072 Zip code population in 2000: 42,820
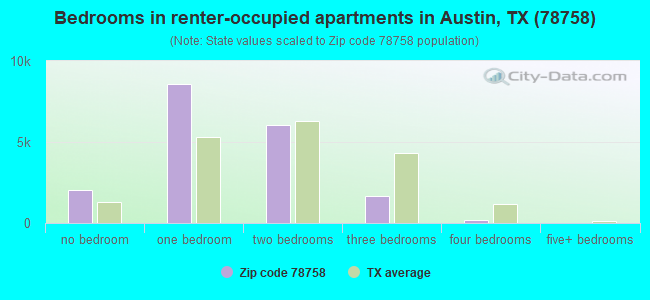
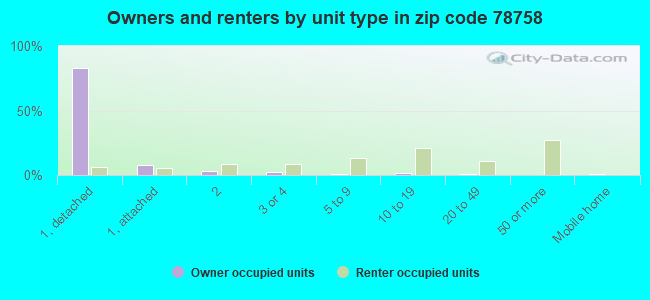
Houses and condos: 26,406 Renter-occupied apartments: 18,326
% of renters here:
73%
State:
38%
March 2022 cost of living index in zip code 78758: 95.3 (near average, U.S. average is 100)
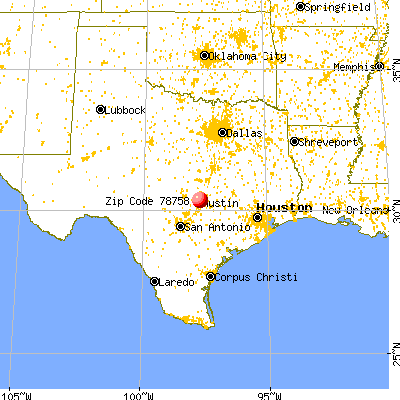
Land area: 9.3 sq. mi. Water area: 0.0 sq. mi.
Population density: 5,662 people per square mile
(average).
OSM Map
General Map
Google Map
MSN Map
OSM Map
General Map
Google Map
MSN Map
OSM Map
General Map
Google Map
MSN Map
OSM Map
General Map
Google Map
MSN Map
Please wait while loading the map...
Real estate property taxes paid for housing units in 2022:
This zip code:
1.3% ($5,370)
Texas:
1.5% ($4,050)
Median real estate property taxes paid for housing units with mortgages in 2022: $6,188 (1.4%) Median real estate property taxes paid for housing units with no mortgage in 2022: $4,563 (1.2%)
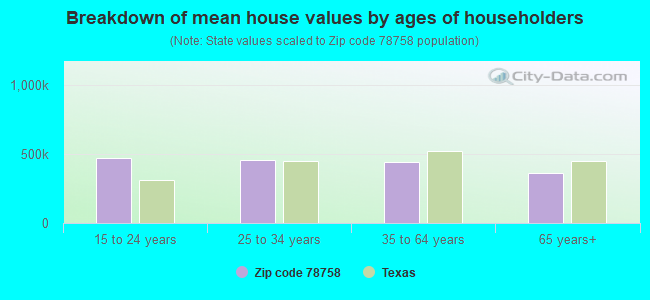
Estimated median house/condo value in 2022: $418,770
78758:
$418,770
Texas:
$275,400
According to our research of Texas and other state lists, there were 94 registered sex offenders living in 78758 zip code as of April 27, 2024. The ratio of all residents to sex offenders in zip code 78758 is 502 to 1. The ratio of registered sex offenders to all residents in this zip code is near the state average.
Median resident age:
This zip code:
32.7 years
Texas median age:
35.6 years
Average household size:
This zip code:
2.1 people
Texas:
2.6 people
Averages for the 2020 tax year for zip code 78758, filed in 2021:
Average Adjusted Gross Income (AGI) in 2020: $60,723 (Individual Income Tax Returns)
Here:
$60,723
State:
$77,054
Salary/wage: $57,066 (reported on 85.8% of returns)
Here:
$57,066
State:
$62,766
(% of AGI for various income ranges: 1302.2% for AGIs below $25k, 3958.2% for AGIs $25k-50k, 7080.4% for AGIs $50k-75k, 10505.6% for AGIs $75k-100k, 19416.9% for AGIs $100k-200k, 80533.9% for AGIs over 200k)
Taxable interest for individuals: $999 (reported on 20.8% of returns)
This zip code:
$999
Texas:
$2,665
(% of AGI for various income ranges: 6.2% for AGIs below $25k, 6.8% for AGIs $25k-50k, 19.4% for AGIs $50k-75k, 28.0% for AGIs $75k-100k, 79.3% for AGIs $100k-200k, 817.0% for AGIs over 200k)
Ordinary dividends: $3,432 (reported on 16.8% of returns)
Here:
$3,432
State:
$10,044
(% of AGI for various income ranges: 10.6% for AGIs below $25k, 14.8% for AGIs $25k-50k, 52.6% for AGIs $50k-75k, 80.6% for AGIs $75k-100k, 241.4% for AGIs $100k-200k, 2351.7% for AGIs over 200k)
Net capital gain/loss in AGI: +$15,040 (reported on 16.8% of returns)
Here:
+$15,040
State:
+$39,590
(% of AGI for various income ranges: 7.8% for AGIs below $25k, 18.9% for AGIs $25k-50k, 69.5% for AGIs $50k-75k, 142.7% for AGIs $75k-100k, 582.6% for AGIs $100k-200k, 18957.0% for AGIs over 200k)
Profit/loss from business: +$10,774 (reported on 20.0% of returns)
Here:
+$10,774
State:
+$10,888
(% of AGI for various income ranges: 246.8% for AGIs below $25k, 185.9% for AGIs $25k-50k, 231.4% for AGIs $50k-75k, 212.5% for AGIs $75k-100k, 563.0% for AGIs $100k-200k, 3631.3% for AGIs over 200k)
Taxable individual retirement arrangement distribution: $19,545 (reported on 3.6% of returns)
78758:
$19,545
Texas:
$24,740
(% of AGI for various income ranges: 18.3% for AGIs below $25k, 31.8% for AGIs $25k-50k, 70.2% for AGIs $50k-75k, 121.9% for AGIs $75k-100k, 321.9% for AGIs $100k-200k, 2087.4% for AGIs over 200k)
Self-employed (Keogh) retirement plans: $18,760 (reported on 0.2% of returns)
78758:
$18,760
Texas:
$29,298
(% of AGI for various income ranges: 20.3% for AGIs $75k-100k, 276.5% for AGIs over 200k)
Total itemized deductions: $26,691 (reported on 4.3% of returns)
Here:
$26,691
State:
$40,428
(% of AGI for various income ranges: 15.7% for AGIs below $25k, 50.8% for AGIs $25k-50k, 129.1% for AGIs $50k-75k, 235.6% for AGIs $75k-100k, 480.6% for AGIs $100k-200k, 3606.5% for AGIs over 200k)
Charity contributions: $11,038 (reported on 3.1% of returns)
Here:
$11,038
State:
$18,201
(% of AGI for various income ranges: 1.2% for AGIs below $25k, 7.2% for AGIs $25k-50k, 23.4% for AGIs $50k-75k, 42.6% for AGIs $75k-100k, 119.4% for AGIs $100k-200k, 1813.9% for AGIs over 200k)
Taxes paid: $7,280 (reported on 4.2% of returns)
78758:
$7,280
State:
$7,821
(% of AGI for various income ranges: 3.6% for AGIs below $25k, 11.6% for AGIs $25k-50k, 39.2% for AGIs $50k-75k, 75.4% for AGIs $75k-100k, 154.6% for AGIs $100k-200k, 701.3% for AGIs over 200k)
Earned income credit: $2,272 (reported on 14.7% of returns)
Here:
$2,272
State:
$2,584
(% of AGI for various income ranges: 107.0% for AGIs below $25k, 41.8% for AGIs $25k-50k)
Percentage of individuals using paid preparers for their 2020 taxes: 90.9%
Here:
91%
State:
92%
(% for various income ranges: 87.4% for AGIs below $25k, 91.6% for AGIs $25k-50k, 92.7% for AGIs $50k-75k, 91.9% for AGIs $75k-100k, 93.8% for AGIs $100k-200k, 94.9% for AGIs over 200k)
Averages for the 2012 tax year for zip code 78758, filed in 2013:
Average Adjusted Gross Income (AGI) in 2012: $39,799 (Individual Income Tax Returns)
Here:
$39,799
State:
$65,384
Salary/wage: $36,801 (reported on 89.3% of returns)
Here:
$36,801
State:
$52,524
(% of AGI for various income ranges: 84.8% for AGIs below $25k, 90.2% for AGIs $25k-50k, 84.8% for AGIs $50k-75k, 81.9% for AGIs $75k-100k, 79.4% for AGIs $100k-200k, 58.3% for AGIs over 200k)
Taxable interest for individuals: $780 (reported on 18.2% of returns)
This zip code:
$780
Texas:
$2,372
(% of AGI for various income ranges: 0.3% for AGIs below $25k, 0.2% for AGIs $25k-50k, 0.3% for AGIs $50k-75k, 0.5% for AGIs $75k-100k, 0.4% for AGIs $100k-200k, 0.7% for AGIs over 200k)
Ordinary dividends: $2,731 (reported on 10.3% of returns)
Here:
$2,731
State:
$9,721
(% of AGI for various income ranges: 0.6% for AGIs below $25k, 0.4% for AGIs $25k-50k, 0.6% for AGIs $50k-75k, 0.9% for AGIs $75k-100k, 1.1% for AGIs $100k-200k, 1.1% for AGIs over 200k)
Net capital gain/loss in AGI: +$4,781 (reported on 8.3% of returns)
Here:
+$4,781
State:
+$35,319
(% of AGI for various income ranges: 0.3% for AGIs $50k-75k, 0.5% for AGIs $75k-100k, 1.3% for AGIs $100k-200k, 7.1% for AGIs over 200k)
Profit/loss from business: +$11,164 (reported on 15.2% of returns)
Here:
+$11,164
State:
+$13,732
(% of AGI for various income ranges: 9.9% for AGIs below $25k, 3.3% for AGIs $25k-50k, 2.6% for AGIs $50k-75k, 2.7% for AGIs $75k-100k, 4.0% for AGIs $100k-200k, 3.2% for AGIs over 200k)
Taxable individual retirement arrangement distribution: $12,100 (reported on 3.9% of returns)
78758:
$12,100
Texas:
$19,511
(% of AGI for various income ranges: 0.8% for AGIs below $25k, 0.8% for AGIs $25k-50k, 1.4% for AGIs $50k-75k, 1.4% for AGIs $75k-100k, 1.7% for AGIs $100k-200k, 1.3% for AGIs over 200k)
Self-employment retirement plans: $14,200 (reported on 0.2% of returns)
78758:
$14,200
Texas:
$23,938
Total itemized deductions: $16,595 (19% of AGI, reported on 14.0% of returns)
Here:
$16,595
State:
$24,724
Here:
19.4% of AGI
State:
15.9% of AGI
(% of AGI for various income ranges: 3.2% for AGIs below $25k, 4.3% for AGIs $25k-50k, 7.1% for AGIs $50k-75k, 7.2% for AGIs $75k-100k, 7.6% for AGIs $100k-200k, 7.7% for AGIs over 200k)
Charity contributions: $3,854 (reported on 9.7% of returns)
Here:
$3,854
State:
$6,808
(% of AGI for various income ranges: 0.2% for AGIs below $25k, 0.4% for AGIs $25k-50k, 0.9% for AGIs $50k-75k, 1.2% for AGIs $75k-100k, 1.5% for AGIs $100k-200k, 2.3% for AGIs over 200k)
Taxes paid: $5,096 (reported on 13.6% of returns)
78758:
$5,096
State:
$6,921
(% of AGI for various income ranges: 0.9% for AGIs below $25k, 1.1% for AGIs $25k-50k, 2.1% for AGIs $50k-75k, 2.2% for AGIs $75k-100k, 2.6% for AGIs $100k-200k, 2.1% for AGIs over 200k)
Earned income credit: $2,294 (reported on 21.1% of returns)
Here:
$2,294
State:
$2,570
(% of AGI for various income ranges: 6.1% for AGIs below $25k, 0.8% for AGIs $25k-50k)
Percentage of individuals using paid preparers for their 2012 taxes: 38.8%
Here:
39%
State:
51%
(% for various income ranges: 42.3% for AGIs below $25k, 36.1% for AGIs $25k-50k, 33.1% for AGIs $50k-75k, 33.9% for AGIs $75k-100k, 36.8% for AGIs $100k-200k, 70.6% for AGIs over 200k)
Averages for the 2004 tax year for zip code 78758, filed in 2005:
Average Adjusted Gross Income (AGI) in 2004: $34,507 (Individual Income Tax Returns)
Here:
$34,507
State:
$47,881
Salary/wage: $32,602 (reported on 90.1% of returns)
Here:
$32,602
State:
$41,947
(% of AGI for various income ranges: 121.0% for AGIs below $10k, 89.5% for AGIs $10k-25k, 90.1% for AGIs $25k-50k, 84.9% for AGIs $50k-75k, 80.8% for AGIs $75k-100k, 72.5% for AGIs over 100k)
Taxable interest for individuals: $910 (reported on 29.2% of returns)
This zip code:
$910
Texas:
$2,255
(% of AGI for various income ranges: 2.3% for AGIs below $10k, 0.5% for AGIs $10k-25k, 0.6% for AGIs $25k-50k, 0.7% for AGIs $50k-75k, 1.0% for AGIs $75k-100k, 1.0% for AGIs over 100k)
Taxable dividends: $1,446 (reported on 14.0% of returns)
Here:
$1,446
State:
$4,261
(% of AGI for various income ranges: 1.4% for AGIs below $10k, 0.3% for AGIs $10k-25k, 0.4% for AGIs $25k-50k, 0.6% for AGIs $50k-75k, 0.7% for AGIs $75k-100k, 1.0% for AGIs over 100k)
Net capital gain/loss: +$4,473 (reported on 12.1% of returns)
Here:
+$4,473
State:
+$16,110
(% of AGI for various income ranges: -1.1% for AGIs below $10k, 0.1% for AGIs $10k-25k, 0.2% for AGIs $25k-50k, 0.5% for AGIs $50k-75k, 0.9% for AGIs $75k-100k, 7.1% for AGIs over 100k)
Profit/loss from business: +$8,462 (reported on 12.9% of returns)
Here:
+$8,462
State:
+$11,013
(% of AGI for various income ranges: 8.0% for AGIs below $10k, 5.0% for AGIs $10k-25k, 2.5% for AGIs $25k-50k, 2.3% for AGIs $50k-75k, 2.4% for AGIs $75k-100k, 3.7% for AGIs over 100k)
IRA payment deduction: $2,763 (reported on 1.6% of returns)
78758:
$2,763
Texas:
$3,120
(% of AGI for various income ranges: 0.2% for AGIs below $10k, 0.1% for AGIs $10k-25k, 0.1% for AGIs $25k-50k, 0.2% for AGIs $50k-75k, 0.1% for AGIs $75k-100k, 0.1% for AGIs over 100k)
Self-employed pension: $9,000 (reported on 0.4% of returns)
Here:
$9,000
Texas:
$16,401
(% of AGI for various income ranges: 0.2% for AGIs below $10k, 0.1% for AGIs $25k-50k, 0.1% for AGIs $50k-75k, 0.3% for AGIs over 100k)
Total itemized deductions: $13,392 (21% of AGI, reported on 19.7% of returns)
Here:
$13,392
State:
$19,631
Here:
21.1% of AGI
State:
18.9% of AGI
(% of AGI for various income ranges: 12.2% for AGIs below $10k, 4.2% for AGIs $10k-25k, 7.1% for AGIs $25k-50k, 8.9% for AGIs $50k-75k, 9.8% for AGIs $75k-100k, 8.2% for AGIs over 100k)
Charity contributions deductions: $2,873 (4% of AGI, reported on 14.6% of returns)
Here:
$2,873
State:
$4,753
Here:
4.3% of AGI
State:
4.2% of AGI
(% of AGI for various income ranges: 0.5% for AGIs below $10k, 0.3% for AGIs $10k-25k, 0.8% for AGIs $25k-50k, 1.3% for AGIs $50k-75k, 2.0% for AGIs $75k-100k, 2.2% for AGIs over 100k)
Total tax: $4,920 (reported on 72.4% of returns)
78758:
$4,920
State:
$9,058
(% of AGI for various income ranges: 3.6% for AGIs below $10k, 4.0% for AGIs $10k-25k, 7.8% for AGIs $25k-50k, 11.1% for AGIs $50k-75k, 12.6% for AGIs $75k-100k, 18.3% for AGIs over 100k)
Earned income credit: $1,822 (reported on 19.5% of returns)
Here:
$1,822
State:
$2,024
Percentage of individuals using paid preparers for their 2004 taxes: 43.8%
Here:
44%
State:
57%
(% for various income ranges: 44.7% for AGIs below $10k, 53.4% for AGIs $10k-25k, 39.2% for AGIs $25k-50k, 34.3% for AGIs $50k-75k, 32.0% for AGIs $75k-100k, 43.2% for AGIs over 100k)
Likely homosexual households (counted as self-reported same-sex unmarried-partner households)
Lesbian couples: 0.2% of all households
Gay men: 0.7% of all households
Household received Food Stamps/SNAP in the past 12 months: 3,022 Household did not receive Food Stamps/SNAP in the past 12 months: 21,947
Women who had a birth in the past 12 months: 942 (657 now married, 285 unmarried) Women who did not have a birth in the past 12 months: 14,237 (5,389 now married, 8,876 unmarried)
Housing units in zip code 78758 with a mortgage: 4,138 (380 second mortgage, 200 both second mortgage and home equity loan) Houses without a mortgage: 36
Median monthly owner costs for units with a mortgage: $1,945 Median monthly owner costs for units without a mortgage: $756
Residents with income below the poverty level in 2022:
This zip code:
23.3%
Whole state:
14.0%
Residents with income below 50% of the poverty level in 2022:
This zip code:
8.6%
Whole state:
7.4%
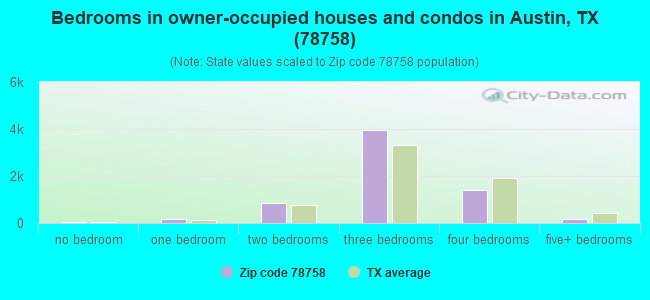
Median number of rooms in houses and condos:
Here:
5.8
State:
6.3
Median number of rooms in apartments:
Here:
3.2
State:
4.0
Notable locations in this zip code not listed on our city pages
Notable locations in zip code 78758: Valley Oak Golf Club (A), Austin Fire Department Station 8 (B), Travis County Fire Control Emergency Services District 4 Station 4 (C), Austin Fire Department Station 30 (D), Applied Research Laboratories University of Texas Emergency Team (E), Active Power Emergency Response Team (F), Austin / Travis County Emergency Medical Service - Medic 07 (G), Austin / Travis County Emergency Medical Service - Medic 18 (H). Display/hide their locations on the map
Churches in zip code 78758 include: Agape Baptist Church (A), High Calling Assembly of God Church (B), The Apostolic Church (C), Saint Albert the Great Catholic Church (D), Gateway Community Church (E), Calvary Chapel of Austin Church (F), Grant African Methodist Episcopal Worship Center (G), North Austin Christian Church (H), Parmer Lane Baptist Church (I). Display/hide their locations on the map
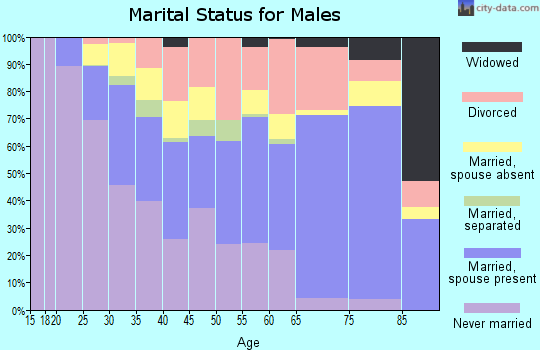
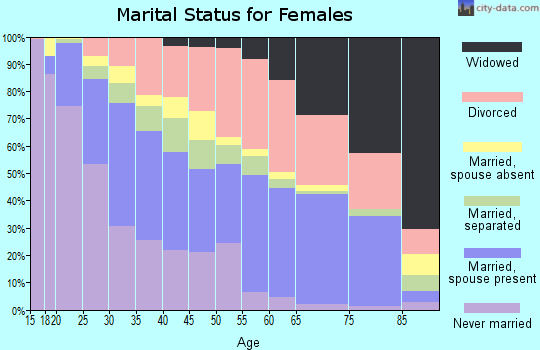
5,838 married couples with children.
3,967 single-parent households (1,038 men, 2,929 women).
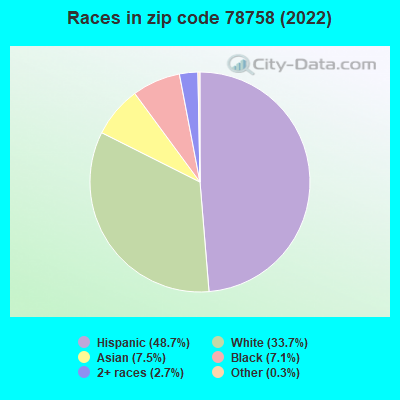
56.7% of residents of 78758 zip code speak English at home.
35.7% of residents speak Spanish at home (50% very well, 17% well, 19% not well, 15% not at all).
2.1% of residents speak other Indo-European language at home (69% very well, 19% well, 8% not well, 4% not at all).
4.3% of residents speak Asian or Pacific Island language at home (74% very well, 19% well, 6% not well, 2% not at all).
0.8% of residents speak other language at home (69% very well, 29% well, 2% not at all).
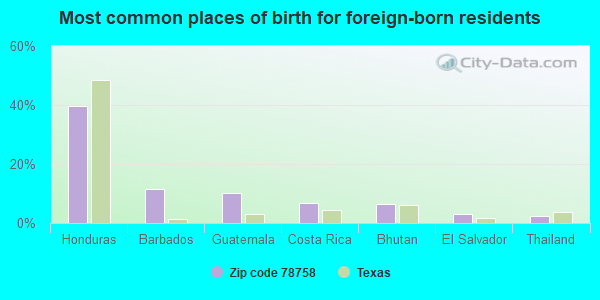
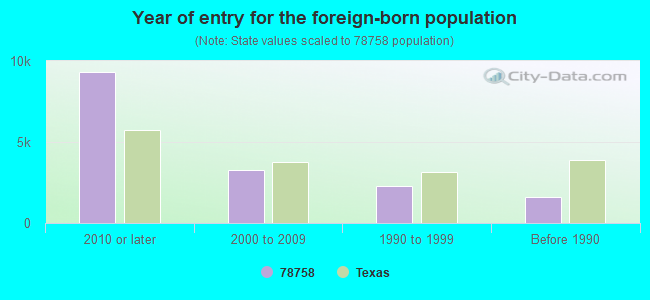
Foreign born population: 14,144 (26.9%) (20.8% of them are naturalized citizens)
AUSTIN COMMUNITY COLLEGE (11928 STONEHOLLOW DRIVE in AUSTIN, TX)
(Resource Conservation and Recovery Act (tracking hazardous waste)) Organizations: SMITHROLAND (CONTACT/OPERATOR)
Alternative names: AUSTIN COMMUNITY COLLEGE NRG
AUSTIN COMMUNITY COLLEGE (11923 STONEHOLLOW DR in AUSTIN, TX)
(Resource Conservation and Recovery Act (tracking hazardous waste))
APPLIED MATERIALS INC (9715 BURNET RD in AUSTIN, TX)
Large Quantity Generators, more that 1000 kg of hazardous waste/month (Resource Conservation and Recovery Act (tracking hazardous waste)) - notification
AUSTIN COCA-COLA BOTTLING (9600 BURNET ROAD in AUSTIN, TX)
Small Quantity Generators, between 100 kg and 1000 kg of hazardous waste/month (Resource Conservation and Recovery Act (tracking hazardous waste)) - notification TRI REPORTER (Tracking of toxic chemicals releasing facilities) Business SIC classification: BOTTLED AND CANNED SOFT DRINKS AND CARBONATED WATERS; GROCERIES AND RELATED PRODUCTS Business NAICS classification: SOFT DRINK MANUFACTURING. Organizations: COCA-COLA BOTTLING COMPANY (CONTACT/OPERATOR)
Alternative names: COCA COLA BOTTLING COMPANY AUSTIN
AUCTION PARTNER (8222 JAMESTOWN DRIVE STE 109A in AUSTIN, TX)
Conditionally Exempt Small Quantity Generators, less than 100 kg/month of hazardous waste (Resource Conservation and Recovery Act (tracking hazardous waste)) - notification TRANSPORTER (Resource Conservation and Recovery Act (tracking hazardous waste)) - notification Organizations: DARLENE MACAULEY (CONTACT/OWNER)
AUSTIN COLD TYPE (7970 SHOAL CREEK in AUSTIN, TX)
(Resource Conservation and Recovery Act (tracking hazardous waste)) Business NAICS classification: PREPRESS SERVICES.
AUSTIN LIGHTING GROUP INC (2011 W RUNDBERG LN in AUSTIN, TX)
Small Quantity Generators, between 100 kg and 1000 kg of hazardous waste/month (Resource Conservation and Recovery Act (tracking hazardous waste)) Organizations: AUSTIN LIGHTING PRODUCTS (CONTACT/OPERATOR)
AUTUMN HEATING & COOLING (9800 BECK CIRCLE in AUSTIN, TX)
AIR MINOR (AIRS/AFS) Business SIC classification: GENERAL AUTOMOTIVE REPAIR SHOPS
Housing units lacking complete plumbing facilities: 0.3% Housing units lacking complete kitchen facilities: 0.4%
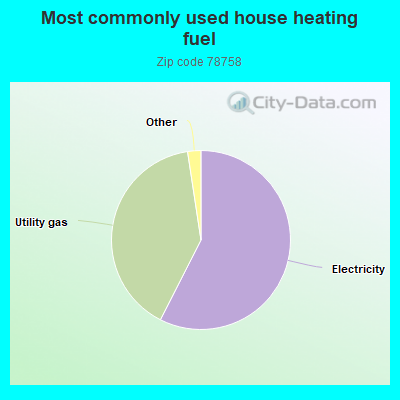
57.5%Electricity
40.1%Utility gas
0.9%Bottled, tank, or LP gas
0.6%Other fuel
0.5%Wood
Population in 1990: 43,246.
Place of birth for U.S.-born residents:
This state: 23,985
Northeast: 2,800
Midwest: 3,351
South: 3,409
West: 3,620
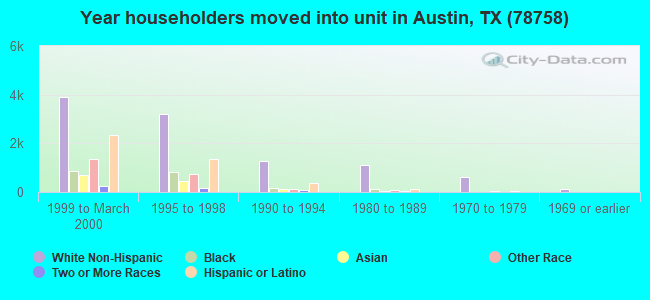
32% of the 78758 zip code residents lived in the same house 5 years ago. Out of people who lived in different houses, 51% lived in this county. Out of people who lived in different counties, 50% lived in Texas.
75% of the 78758 zip code residents lived in the same house 1 year ago. Out of people who lived in different houses, 54% moved from this county. Out of people who lived in different houses, 14% moved from different county within same state. Out of people who lived in different houses, 23% moved from different state. Out of people who lived in different houses, 8% moved from abroad.
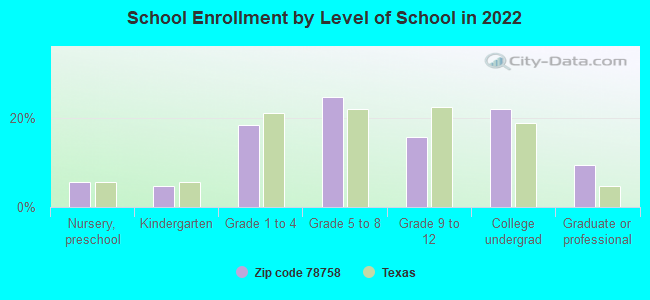
Private vs. public school enrollment:
Students in private schools in grades 1 to 8 (elementary and middle school): 508
Here:
10.0%
Texas:
8.8%
Students in private schools in grades 9 to 12 (high school): 205
Here:
11.0%
Texas:
8.0%
Students in private undergraduate colleges: 279
Here:
10.8%
Texas:
16.2%
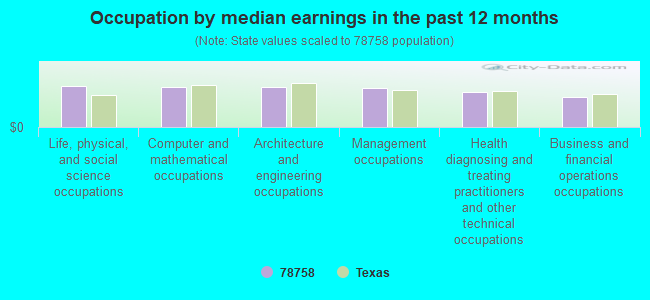
Occupation by median earnings in the past 12 months ($)
93,793Life, physical, and social science occupations
91,870Computer and mathematical occupations
90,651Architecture and engineering occupations
89,134Management occupations
79,183Health diagnosing and treating practitioners and other technical occupations
69,225Business and financial operations occupations
Companies with biggest federal contracts located in this zip code (AUSTIN, TX):
UNIVERSITY OF TEXAS AT AUSTIN (10000 BURNET ROAD) : $309,093,209 in 1121 contractsfrom 2000 to 2006
Contracts for Defense Ships -- Operational Systems Development (R&D), Defense Electronics and Communication Equipment -- Operational Systems Development (R&D), Defense Electronics and Communication Equipment -- Engineering Development (R&D), Other Special Studies and Analyses, and moreby Navy, NASA, Army, Air Force, and others Signed by year:2000: $20,755,458; 2001: $30,434,709; 2002: $60,746,052; 2003: $51,818,664; 2004: $47,957,735; 2005: $53,603,756; 2006: $43,776,835.
Biggest contracts:
$6,000,000 with Navy for Defense Ships -- Operational Systems Development (R&D). Signed on 2003-03-12. Completion date: 2005-02-11.
$4,364,000, same as above.Signed on 2002-12-18. Completion date: 2006-03-19.
$4,238,000 with Navy for Defense Electronics and Communication Equipment -- Operational Systems Development (R&D). Signed on 2005-01-14. Completion date: 2006-12-19.
$4,050,000 with Navy for Defense Ships -- Operational Systems Development (R&D). Signed on 2006-02-23. Completion date: 2007-03-27.
SIEMENS BUILDING TECHNOLOGIES, (1826 D KRAMER LANE) : $12,788,105 in 91 contractsfrom 2000 to 2006
Contracts for Other Utilities, Maintenance, Repair or Alteration of Real Property -- Other Non-Building Facilities, Electric Services, Intercommunication and Public Address Systems, Except Airborne, and moreby Air Force, Public Buildings Service, National Oceanic and Atmospheric Administration/Under Secretary for Oceans and Atmosphere Signed by year:2000: $144,136; 2001: $226,124; 2002: $2,603,803; 2003: $3,308,561; 2004: $2,735,631; 2005: $3,092,990; 2006: $676,860.
Biggest contracts:
$1,300,000 with Air Force for Other Utilities. Signed on 2002-08-15. Completion date: 2002-12-20.
$740,071 with Air Force for Maintenance, Repair or Alteration of Real Property -- Other Non-Building Facilities. Signed on 2004-10-01. Completion date: 2015-08-02.
$732,865, same as above.Signed on 2003-10-01. Completion date: 2015-08-02.
$725,868 with Air Force for Other Utilities. Signed on 2002-10-16. Completion date: 2002-10-16.
PREWITT & ASSOCIATES, INC (2105 DONLEY DRIVE, SUITE 4; small business) : $10,465,011 in 71 contractsfrom 1999 to 2006
Contracts for Other Professional Services, Archeological/Paleontological Studies, Program Review/Development Services, Air Quality Analyses, and moreby Army, U.S. Army Corps of Engineers - civil program financing only Signed by year:2000: $2,722,118; 2001: $934,076; 2002: $849,524; 2003: $875,143; 2004: $3,211,098; 2005: $1,341,841; 2006: $272,998.
Biggest contracts:
$1,424,740 with Army for Other Professional Services. Taking place in NV. Signed on 2004-07-12. Completion date: 2006-07-01.
$670,000 with Army for Other Professional Services. Signed on 2000-09-14. Completion date: 2002-09-23.
$530,751 with Army for Other Professional Services. Taking place in FL. Signed on 2004-09-30. Completion date: 2007-09-21.
$434,250 with Army for Other Professional Services. Taking place in VA. Signed on 2004-09-30. Completion date: 2007-09-21.
MOLECULAR IMPRINTS INC (1807-C W BRAKER LN STE 100; small business) : $5,507,057 in 6 contractsfrom 2002 to 2005
Contracts for Other Research and Development -- Basic Research (R&D) by Navy Signed by year:2000: $0; 2001: $0; 2002: $500,000; 2003: $1,425,000; 2004: $500,000; 2005: $3,082,057; 2006: $0.
Biggest contracts:
$2,600,000 with Navy for Other Research and Development -- Basic Research (R&D). Signed on 2005-11-02. Completion date: 2006-11-01.
$925,000, same as above.Signed on 2003-02-11. Completion date: 2005-06-23.
$500,000, same as above.Signed on 2004-06-29. Completion date: 2005-06-23.
$500,000, same as above.Signed on 2003-12-19. Completion date: 2005-06-23.
RADIANT RESEARCH, INC (1908 KRAMER LANE, SUITE A; small business) : $4,192,126 in 17 contractsfrom 2000 to 2003
Contracts for Physical Sciences -- Applied Research and Exploratory Development (R&D), Defense Missile and Space Systems -- Advanced Development (R&D), Other Defense -- Applied Research and Exploratory Development (R&D), Environmental Sciences -- Applied Research and Exploratory Development (R&D), and moreby Air Force, Army, NASA, Navy, and others Signed by year:2000: $2,505,000; 2001: $1,587,122; 2002: $0; 2003: $100,004; 2004: $0; 2005: $0; 2006: $0.
Biggest contracts:
$750,000 with Air Force for Physical Sciences -- Applied Research and Exploratory Development (R&D). Taking place in WA. Signed on 2000-08-01. Completion date: 2002-07-14.
$500,000 with Army for Defense Missile and Space Systems -- Advanced Development (R&D). Signed on 2001-08-20. Completion date: 2003-08-17.
$399,996, same as above.Signed on 2001-08-20. Completion date: 2003-08-20.
$375,000 with Air Force for Other Defense -- Applied Research and Exploratory Development (R&D). Signed on 2000-03-27. Completion date: 2002-12-31.
BUFFALO GAP JOINT VENTURE (1921 CEDAR BEND DR STE B20; small business) : $3,477,392 in 7 contractsfrom 2005 to 2006
Contracts for Construction of Structures and Facilities -- Miscellaneous Buildings by Army Signed by year:2000: $0; 2001: $0; 2002: $0; 2003: $0; 2004: $0; 2005: $3,438,291; 2006: $39,101.
Biggest contracts:
$3,438,291 with Army for Construction of Structures and Facilities -- Miscellaneous Buildings. Signed on 2005-09-19. Completion date: 2007-09-30.
$25,493, same as above.Signed on 2006-06-08. Completion date: 2007-09-30.
$15,529, same as above.Signed on 2006-07-06. Effective on 2006-07-05. Completion date: 2006-09-14.
$3,953, same as above.Signed on 2006-03-22. Completion date: 2007-09-30.
OMEGA OPTICS, INC (10435 BURNET RD STE 108; small business) : $3,162,385 in 17 contractsfrom 2002 to 2006
Contracts for Defense Aircraft -- Basic Research (R&D), Other Defense -- Applied Research and Exploratory Development (R&D), Physical Sciences -- Management and Support (R&D), Defense Electronics and Communication Equipment -- Management and Support (R&D), and moreby Air Force, Army, Navy, Department of Defense, and others Signed by year:2000: $0; 2001: $0; 2002: $319,938; 2003: $1,019,490; 2004: $449,000; 2005: $625,000; 2006: $748,957.
Biggest contracts:
$375,000 with Air Force for Defense Aircraft -- Basic Research (R&D). Signed on 2006-04-19. Completion date: 2008-08-12.
$375,000 with Army for Other Defense -- Applied Research and Exploratory Development (R&D). Signed on 2005-09-16. Completion date: 2007-12-31.
$373,957 with Air Force for Physical Sciences -- Management and Support (R&D). Signed on 2006-05-11. Completion date: 2007-09-14.
$350,000 with Navy for Defense Electronics and Communication Equipment -- Management and Support (R&D). Signed on 2003-08-28. Completion date: 2004-08-28.
STELLAR MICRO DEVICES (2020 CENTIMETER CIR; small business) : $2,711,025 in 9 contractsfrom 2002 to 2005
Contracts for Defense Missile and Space Systems -- Operational Systems Development (R&D), Defense Missile and Space Systems -- Advanced Development (R&D), Defense Missile and Space Systems -- Basic Research (R&D), Weapons -- Basic Research (R&D), and moreby Air Force, Army, Navy, NASA, and others Signed by year:2000: $0; 2001: $0; 2002: $99,836; 2003: $748,734; 2004: $265,035; 2005: $1,597,420; 2006: $0.
Biggest contracts:
$749,589 with Air Force for Defense Missile and Space Systems -- Operational Systems Development (R&D). Signed on 2005-04-25. Completion date: 2007-07-30.
$749,178 with Army for Defense Missile and Space Systems -- Advanced Development (R&D). Signed on 2005-09-20. Completion date: 2006-05-22.
$375,000 with Air Force for Defense Missile and Space Systems -- Basic Research (R&D). Signed on 2003-05-23. Completion date: 2005-06-30.
$373,734, same as above.Signed on 2003-10-24. Completion date: 2005-06-30.
APPLIED NANOTECH INC (3006 LONGHORN BLVD STE 107; small business) : $2,020,692 in 12 contractsfrom 1999 to 2006
Contracts for Defense Missile and Space Systems -- Basic Research (R&D), Aeronautics and Space Technology -- Basic Research (R&D), Other Research and Development -- Basic Research (R&D), Weapons -- Basic Research (R&D), and moreby Army, NASA, Air Force Signed by year:2000: $0; 2001: $387,827; 2002: $307,000; 2003: $742,171; 2004: $0; 2005: $167,289; 2006: $349,405.
Biggest contracts:
$742,171 with Army for Defense Missile and Space Systems -- Basic Research (R&D). Signed on 2003-02-27. Completion date: 2005-02-25.
$275,000 with NASA for Aeronautics and Space Technology -- Basic Research (R&D). Signed on 2001-01-15. Completion date: 2003-01-15.
$250,000 with Air Force for Other Research and Development -- Basic Research (R&D). Signed on 2006-06-13. Completion date: 2008-01-30.
$150,000 with NASA for Aeronautics and Space Technology -- Basic Research (R&D). Signed on 2002-01-15. Completion date: 2003-01-15.
TRIMBLE NAVIGATION LIMITED INC (2105 DONLEY DR STE 100) : $1,355,727 in 10 contractsfrom 1999 to 2005
Contracts for Radio Navigation Equipment, Airborne, Radio Navigation Equipment, Except Airborne, Miscellaneous Items, Electrical and Electronic assemblies, Boards, Cards, and Associated Hardware, and moreby Army, Navy Signed by year:2000: $722,143; 2001: $692,475; 2002: $0; 2003: $0; 2004: $0; 2005: -$31,391; 2006: $0.
Biggest contracts:
$660,625 with Army for Radio Navigation Equipment, Airborne. Signed on 2001-02-20. Completion date: 2001-06-15.
$528,500, same as above.Signed on 2000-06-19. Completion date: 2001-12-31.
$136,011 with Army for Radio Navigation Equipment, Except Airborne. Signed on 2000-04-19. Completion date: 2000-10-31.
$131,952, same as above.Signed on 2000-09-18. Completion date: 2000-10-31.
Top industries in this zip code by the number of employees in 2005:
Professional, Scientific, and Technical Services: Research and Development in the Social Sciences and Humanities (over 1000 employees: 1 establishment)
Health Care and Social Assistance: General Medical and Surgical Hospitals (over 1000: 1)
Health Care and Social Assistance: Offices of Physicians (except Mental Health Specialists) (500-999: 1, 50-99: 1, 10-19: 5, 5-9: 4, 1-4: 22)
Administrative and Support and Waste Management and Remediation Services: Security Systems Services (except Locksmiths) (100-249: 1, 50-99: 2, 10-19: 5, 5-9: 2, 1-4: 2)
People in group quarters in 2010:
180 people in nursing facilities/skilled-nursing facilities
45 people in group homes intended for adults
35 people in residential treatment centers for juveniles (non-correctional)
11 people in group homes for juveniles (non-correctional)
6 people in other noninstitutional facilities
People in group quarters in 2000:
285 people in nursing homes
119 people in homes for the mentally retarded
86 people in other group homes
32 people in mental (psychiatric) hospitals or wards
14 people in homes for the mentally ill
11 people in other noninstitutional group quarters
7 people in hospitals/wards and hospices for chronically ill
7 people in other hospitals or wards for chronically ill
Fatal accident statistics in 2014:
Fatal accident count: 4
Vehicles involved in fatal accidents: 8
Fatal accidents caused by drunken drivers: 2
Fatalities: 4
Persons involved in fatal accidents: 11
Pedestrians involved in fatal accidents: 1
Fatal accident statistics in 2013:
Fatal accident count: 1
Vehicles involved in fatal accidents: 1
Fatal accidents caused by drunken drivers: 0
Fatalities: 1
Persons involved in fatal accidents: 1
Pedestrians involved in fatal accidents: 0
Home Mortgage Disclosure Act Aggregated Statistics For Year 2009 (Based on 11 full and 8 partial tracts)
A) FHA, FSA/RHS & VA Home Purchase Loans
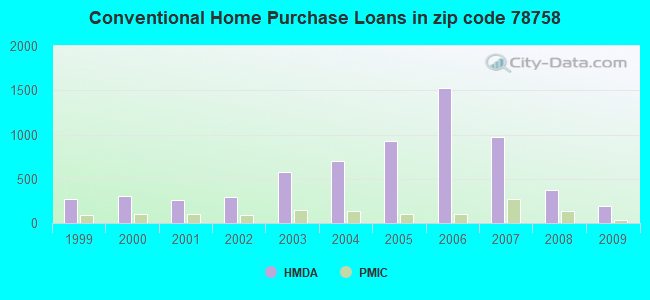
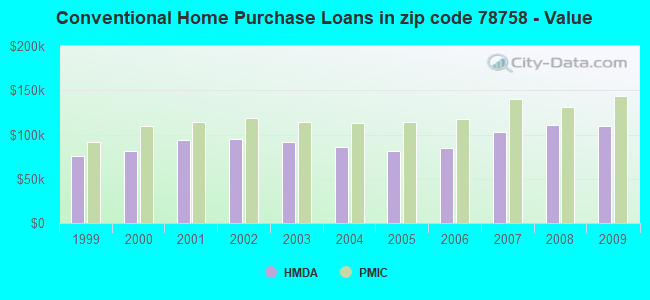
B) Conventional Home Purchase Loans
C) Refinancings
D) Home Improvement Loans
E) Loans on Dwellings For 5+ Families
F) Non-occupant Loans on < 5 Family Dwellings (A B C & D)
G) Loans On Manufactured Home Dwelling (A B C & D)
Number
Average Value
Number
Average Value
Number
Average Value
Number
Average Value
Number
Average Value
Number
Average Value
Number
Average Value
LOANS ORIGINATED
207
$140,652
191
$110,073
388
$110,776
33
$41,618
8
$8,571,766
65
$109,128
0
$0
APPLICATIONS APPROVED, NOT ACCEPTED
6
$154,938
11
$78,513
36
$103,877
6
$34,633
0
$0
12
$71,879
0
$0
APPLICATIONS DENIED
15
$135,935
42
$71,098
147
$115,218
48
$37,528
0
$0
59
$94,472
4
$80,850
APPLICATIONS WITHDRAWN
40
$134,748
30
$102,806
100
$114,154
26
$28,139
0
$0
22
$90,196
0
$0
FILES CLOSED FOR INCOMPLETENESS
2
$214,205
6
$87,683
38
$118,218
4
$49,815
0
$0
3
$63,110
0
$0
Aggregated Statistics For Year 2008 (Based on 11 full and 8 partial tracts)
A) FHA, FSA/RHS & VA Home Purchase Loans
B) Conventional Home Purchase Loans
C) Refinancings
D) Home Improvement Loans
E) Loans on Dwellings For 5+ Families
F) Non-occupant Loans on < 5 Family Dwellings (A B C & D)
G) Loans On Manufactured Home Dwelling (A B C & D)
Number
Average Value
Number
Average Value
Number
Average Value
Number
Average Value
Number
Average Value
Number
Average Value
Number
Average Value
LOANS ORIGINATED
110
$147,244
373
$110,261
250
$107,999
80
$40,057
6
$6,666,535
165
$104,839
0
$0
APPLICATIONS APPROVED, NOT ACCEPTED
12
$140,074
48
$102,487
41
$101,760
15
$26,363
0
$0
14
$92,645
9
$55,080
APPLICATIONS DENIED
11
$160,830
118
$111,789
159
$112,102
81
$14,551
2
$518,000
54
$100,074
12
$39,152
APPLICATIONS WITHDRAWN
8
$148,465
43
$118,214
76
$110,029
33
$30,422
0
$0
18
$102,027
0
$0
FILES CLOSED FOR INCOMPLETENESS
2
$163,395
16
$81,900
37
$107,591
5
$54,008
1
$606,500
14
$59,615
0
$0
Aggregated Statistics For Year 2007 (Based on 11 full and 8 partial tracts)
A) FHA, FSA/RHS & VA Home Purchase Loans
B) Conventional Home Purchase Loans
C) Refinancings
D) Home Improvement Loans
E) Loans on Dwellings For 5+ Families
F) Non-occupant Loans on < 5 Family Dwellings (A B C & D)
G) Loans On Manufactured Home Dwelling (A B C & D)
Number
Average Value
Number
Average Value
Number
Average Value
Number
Average Value
Number
Average Value
Number
Average Value
Number
Average Value
LOANS ORIGINATED
32
$133,305
970
$102,915
293
$113,168
64
$24,624
16
$4,886,744
453
$107,871
3
$49,270
APPLICATIONS APPROVED, NOT ACCEPTED
1
$176,140
145
$97,063
55
$115,145
27
$31,604
0
$0
104
$99,940
5
$73,900
APPLICATIONS DENIED
2
$130,000
435
$114,899
275
$117,463
97
$41,288
0
$0
351
$120,565
26
$46,452
APPLICATIONS WITHDRAWN
7
$126,474
107
$115,451
116
$106,545
26
$46,087
0
$0
77
$117,351
0
$0
FILES CLOSED FOR INCOMPLETENESS
2
$98,870
33
$122,428
45
$136,454
1
$250,940
0
$0
21
$126,710
0
$0
Aggregated Statistics For Year 2006 (Based on 11 full and 8 partial tracts)
A) FHA, FSA/RHS & VA Home Purchase Loans
B) Conventional Home Purchase Loans
C) Refinancings
D) Home Improvement Loans
E) Loans on Dwellings For 5+ Families
F) Non-occupant Loans on < 5 Family Dwellings (A B C & D)
G) Loans On Manufactured Home Dwelling (A B C & D)
Number
Average Value
Number
Average Value
Number
Average Value
Number
Average Value
Number
Average Value
Number
Average Value
Number
Average Value
LOANS ORIGINATED
99
$137,972
1,523
$84,642
309
$100,390
60
$20,993
9
$5,127,267
960
$84,476
8
$95,146
APPLICATIONS APPROVED, NOT ACCEPTED
2
$185,580
425
$85,658
65
$95,309
23
$13,702
0
$0
339
$87,942
8
$32,583
APPLICATIONS DENIED
7
$152,464
288
$78,614
260
$107,574
118
$32,191
0
$0
157
$91,856
16
$37,221
APPLICATIONS WITHDRAWN
4
$149,388
285
$75,401
220
$111,623
18
$46,121
2
$546,505
221
$69,498
1
$136,000
FILES CLOSED FOR INCOMPLETENESS
1
$134,000
45
$103,736
59
$107,563
1
$112,000
0
$0
20
$111,628
1
$110,000
Aggregated Statistics For Year 2005 (Based on 11 full and 8 partial tracts)
A) FHA, FSA/RHS & VA Home Purchase Loans
B) Conventional Home Purchase Loans
C) Refinancings
D) Home Improvement Loans
E) Loans on Dwellings For 5+ Families
F) Non-occupant Loans on < 5 Family Dwellings (A B C & D)
G) Loans On Manufactured Home Dwelling (A B C & D)
Number
Average Value
Number
Average Value
Number
Average Value
Number
Average Value
Number
Average Value
Number
Average Value
Number
Average Value
LOANS ORIGINATED
72
$109,375
926
$80,886
402
$94,003
90
$32,495
11
$2,261,288
365
$86,803
0
$0
APPLICATIONS APPROVED, NOT ACCEPTED
3
$86,227
102
$70,942
66
$91,512
37
$15,144
0
$0
39
$92,339
12
$34,940
APPLICATIONS DENIED
7
$96,661
214
$75,684
431
$99,130
110
$25,794
0
$0
86
$83,750
34
$42,331
APPLICATIONS WITHDRAWN
6
$120,560
141
$84,142
281
$115,768
56
$153,873
2
$539,675
54
$89,120
0
$0
FILES CLOSED FOR INCOMPLETENESS
0
$0
31
$103,880
137
$97,787
3
$21,837
0
$0
19
$103,178
0
$0
Aggregated Statistics For Year 2004 (Based on 11 full and 8 partial tracts)
A) FHA, FSA/RHS & VA Home Purchase Loans
B) Conventional Home Purchase Loans
C) Refinancings
D) Home Improvement Loans
E) Loans on Dwellings For 5+ Families
F) Non-occupant Loans on < 5 Family Dwellings (A B C & D)
G) Loans On Manufactured Home Dwelling (A B C & D)
Number
Average Value
Number
Average Value
Number
Average Value
Number
Average Value
Number
Average Value
Number
Average Value
Number
Average Value
LOANS ORIGINATED
97
$114,736
702
$86,048
766
$91,041
75
$44,518
6
$3,831,170
335
$96,043
3
$57,543
APPLICATIONS APPROVED, NOT ACCEPTED
7
$129,771
79
$70,609
127
$92,701
6
$48,557
0
$0
39
$93,337
5
$34,610
APPLICATIONS DENIED
10
$82,907
145
$78,626
460
$99,466
83
$47,416
0
$0
92
$103,221
28
$47,783
APPLICATIONS WITHDRAWN
8
$114,042
84
$105,212
446
$98,134
23
$45,377
0
$0
49
$103,579
0
$0
FILES CLOSED FOR INCOMPLETENESS
0
$0
16
$97,720
75
$104,303
3
$31,507
0
$0
20
$111,254
0
$0
Aggregated Statistics For Year 2003 (Based on 11 full and 8 partial tracts)
A) FHA, FSA/RHS & VA Home Purchase Loans
B) Conventional Home Purchase Loans
C) Refinancings
D) Home Improvement Loans
E) Loans on Dwellings For 5+ Families
F) Non-occupant Loans on < 5 Family Dwellings (A B C & D)
Number
Average Value
Number
Average Value
Number
Average Value
Number
Average Value
Number
Average Value
Number
Average Value
LOANS ORIGINATED
184
$117,985
572
$92,023
1,769
$91,530
44
$43,571
9
$552,781
409
$98,438
APPLICATIONS APPROVED, NOT ACCEPTED
6
$126,300
67
$87,714
207
$95,005
20
$55,929
0
$0
62
$106,995
APPLICATIONS DENIED
19
$105,469
155
$63,567
546
$91,288
37
$20,486
2
$116,130
98
$87,206
APPLICATIONS WITHDRAWN
10
$124,628
92
$101,615
499
$96,666
12
$21,152
0
$0
77
$100,450
FILES CLOSED FOR INCOMPLETENESS
5
$136,102
24
$102,267
58
$97,112
4
$105,330
0
$0
15
$83,673
Aggregated Statistics For Year 2002 (Based on 5 full and 6 partial tracts)
A) FHA, FSA/RHS & VA Home Purchase Loans
B) Conventional Home Purchase Loans
C) Refinancings
D) Home Improvement Loans
E) Loans on Dwellings For 5+ Families
F) Non-occupant Loans on < 5 Family Dwellings (A B C & D)
Number
Average Value
Number
Average Value
Number
Average Value
Number
Average Value
Number
Average Value
Number
Average Value
LOANS ORIGINATED
108
$113,974
296
$95,206
492
$90,680
31
$29,215
6
$11,526,775
147
$110,580
APPLICATIONS APPROVED, NOT ACCEPTED
5
$108,468
60
$77,818
79
$80,679
8
$21,421
0
$0
13
$121,902
APPLICATIONS DENIED
13
$110,033
164
$63,985
165
$73,706
42
$14,005
1
$5,312,000
28
$95,228
APPLICATIONS WITHDRAWN
9
$131,568
30
$103,649
178
$96,142
5
$12,110
0
$0
18
$101,191
FILES CLOSED FOR INCOMPLETENESS
7
$129,471
20
$73,475
22
$74,382
1
$10,000
0
$0
0
$0
Aggregated Statistics For Year 2001 (Based on 5 full and 6 partial tracts)
A) FHA, FSA/RHS & VA Home Purchase Loans
B) Conventional Home Purchase Loans
C) Refinancings
D) Home Improvement Loans
E) Loans on Dwellings For 5+ Families
F) Non-occupant Loans on < 5 Family Dwellings (A B C & D)
Number
Average Value
Number
Average Value
Number
Average Value
Number
Average Value
Number
Average Value
Number
Average Value
LOANS ORIGINATED
141
$113,762
265
$93,401
354
$88,192
52
$23,174
10
$419,247
122
$96,519
APPLICATIONS APPROVED, NOT ACCEPTED
1
$111,000
83
$76,914
42
$68,667
17
$26,221
1
$730,000
15
$108,923
APPLICATIONS DENIED
5
$94,072
211
$57,744
123
$70,117
36
$18,671
0
$0
21
$85,659
APPLICATIONS WITHDRAWN
26
$101,685
26
$91,908
124
$95,066
12
$10,329
0
$0
18
$98,740
FILES CLOSED FOR INCOMPLETENESS
1
$117,000
17
$107,134
38
$90,764
1
$18,200
0
$0
4
$53,265
Aggregated Statistics For Year 2000 (Based on 5 full and 6 partial tracts)
A) FHA, FSA/RHS & VA Home Purchase Loans
B) Conventional Home Purchase Loans
C) Refinancings
D) Home Improvement Loans
E) Loans on Dwellings For 5+ Families
F) Non-occupant Loans on < 5 Family Dwellings (A B C & D)
Number
Average Value
Number
Average Value
Number
Average Value
Number
Average Value
Number
Average Value
Number
Average Value
LOANS ORIGINATED
162
$102,634
300
$81,044
101
$82,048
30
$24,524
10
$417,203
70
$97,496
APPLICATIONS APPROVED, NOT ACCEPTED
23
$59,463
80
$62,524
24
$73,847
12
$17,136
0
$0
5
$93,526
APPLICATIONS DENIED
30
$61,906
237
$46,793
78
$76,856
39
$16,323
0
$0
12
$88,232
APPLICATIONS WITHDRAWN
20
$95,122
33
$80,441
48
$79,219
0
$0
1
$1,154,780
7
$92,459
FILES CLOSED FOR INCOMPLETENESS
7
$105,489
11
$86,385
23
$74,124
0
$0
4
$8,783,100
14
$81,447
Aggregated Statistics For Year 1999 (Based on 4 full and 6 partial tracts)
A) FHA, FSA/RHS & VA Home Purchase Loans
B) Conventional Home Purchase Loans
C) Refinancings
D) Home Improvement Loans
E) Loans on Dwellings For 5+ Families
F) Non-occupant Loans on < 5 Family Dwellings (A B C & D)
2002 - 2018 National Fire Incident Reporting System (NFIRS) incidents
According to the data from the years 2002 - 2018 the average number of fires per year is 111. The highest number of fire incidents - 152 took place in 2011, and the least - 31 in 2017. The data has an increasing trend.
When looking into fire subcategories, the most incidents belonged to: Outside Fires (45.8%), and Structure Fires (34.3%).
Fire incident types reported to NFIRS in Zip Code 78758


 Nearest zip codes: 78753, 78727, 78757, 78759, 78752, 78728.


 According to the data from the years 2002 - 2018 the average number of fires per year is 111. The highest number of fire incidents - 152 took place in 2011, and the least - 31 in 2017. The data has an increasing trend.
 When looking into fire subcategories, the most incidents belonged to: Outside Fires (45.8%), and Structure Fires (34.3%).