Estimated zip code population in 2022: 31,423 Zip code population in 2010: 26,689 Zip code population in 2000: 22,212
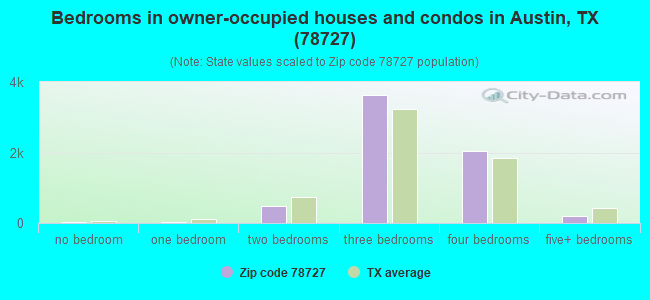
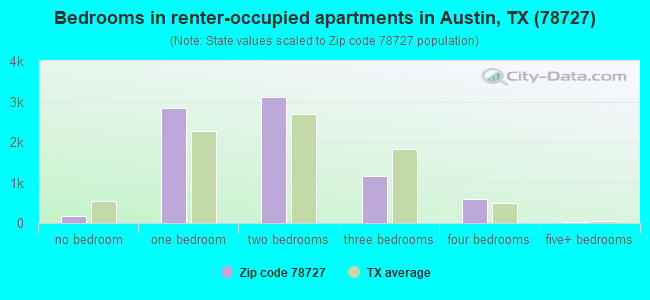
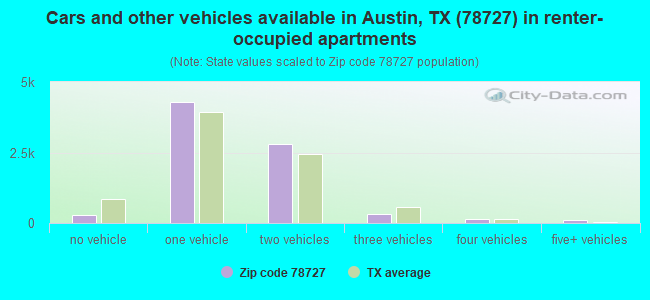
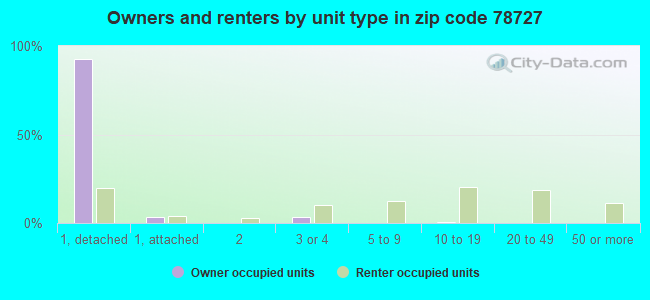
Houses and condos: 15,070 Renter-occupied apartments: 7,981
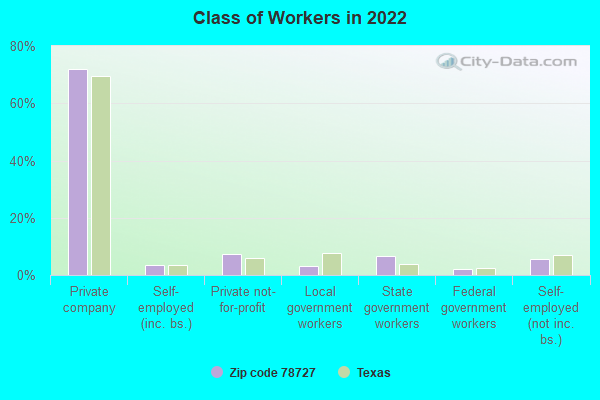
% of renters here:
55%
State:
38%
March 2022 cost of living index in zip code 78727: 94.8 (less than average, U.S. average is 100)
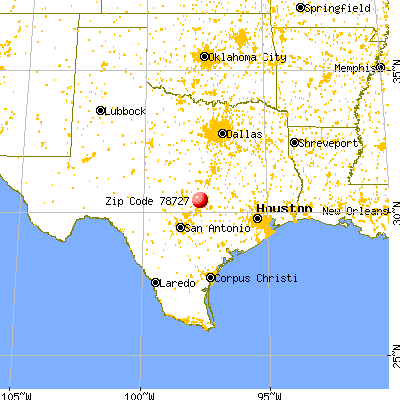
Land area: 8.6 sq. mi. Water area: 0.0 sq. mi.
Population density: 3,664 people per square mile
(average).
OSM Map
General Map
Google Map
MSN Map
OSM Map
General Map
Google Map
MSN Map
OSM Map
General Map
Google Map
MSN Map
OSM Map
General Map
Google Map
MSN Map
Please wait while loading the map...
Real estate property taxes paid for housing units in 2022:
This zip code:
1.5% ($7,132)
Texas:
1.5% ($4,050)
Median real estate property taxes paid for housing units with mortgages in 2022: $7,450 (1.5%) Median real estate property taxes paid for housing units with no mortgage in 2022: $6,273 (1.4%)
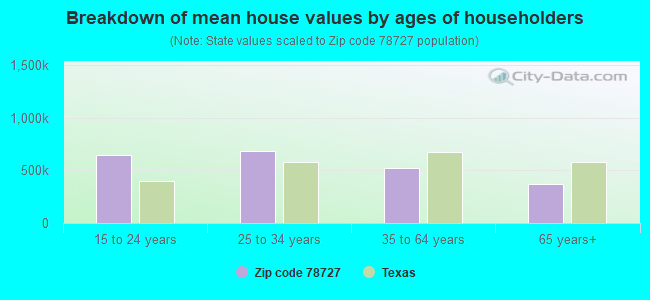
Estimated median house/condo value in 2022: $482,876
78727:
$482,876
Texas:
$275,400
According to our research of Texas and other state lists, there were 27 registered sex offenders living in 78727 zip code as of April 27, 2024. The ratio of all residents to sex offenders in zip code 78727 is 1,093 to 1. The ratio of registered sex offenders to all residents in this zip code is much lower than the state average.
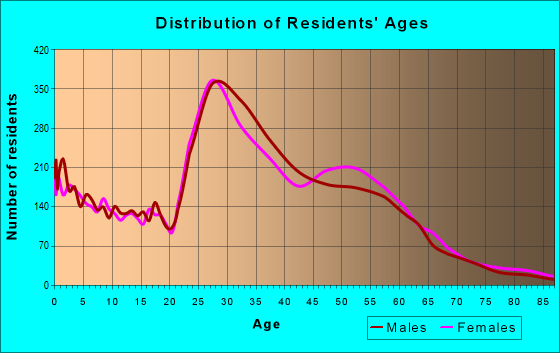
Median resident age:
This zip code:
35.7 years
Texas median age:
35.6 years
Average household size:
This zip code:
2.2 people
Texas:
2.6 people
Averages for the 2020 tax year for zip code 78727, filed in 2021:
Average Adjusted Gross Income (AGI) in 2020: $88,117 (Individual Income Tax Returns)
Here:
$88,117
State:
$77,054
Salary/wage: $79,251 (reported on 86.9% of returns)
Here:
$79,251
State:
$62,766
(% of AGI for various income ranges: 1155.9% for AGIs below $25k, 3786.3% for AGIs $25k-50k, 6816.1% for AGIs $50k-75k, 10078.6% for AGIs $75k-100k, 19133.7% for AGIs $100k-200k, 72559.2% for AGIs over 200k)
Taxable interest for individuals: $1,279 (reported on 32.4% of returns)
This zip code:
$1,279
Texas:
$2,665
(% of AGI for various income ranges: 11.7% for AGIs below $25k, 13.8% for AGIs $25k-50k, 25.3% for AGIs $50k-75k, 52.2% for AGIs $75k-100k, 97.1% for AGIs $100k-200k, 664.2% for AGIs over 200k)
Ordinary dividends: $4,732 (reported on 28.6% of returns)
Here:
$4,732
State:
$10,044
(% of AGI for various income ranges: 25.3% for AGIs below $25k, 33.0% for AGIs $25k-50k, 81.1% for AGIs $50k-75k, 104.7% for AGIs $75k-100k, 282.3% for AGIs $100k-200k, 2722.5% for AGIs over 200k)
Net capital gain/loss in AGI: +$16,299 (reported on 28.1% of returns)
Here:
+$16,299
State:
+$39,590
(% of AGI for various income ranges: 17.8% for AGIs below $25k, 37.5% for AGIs $25k-50k, 78.2% for AGIs $50k-75k, 150.9% for AGIs $75k-100k, 556.5% for AGIs $100k-200k, 13749.2% for AGIs over 200k)
Profit/loss from business: +$13,656 (reported on 17.2% of returns)
Here:
+$13,656
State:
+$10,888
(% of AGI for various income ranges: 166.6% for AGIs below $25k, 177.8% for AGIs $25k-50k, 194.6% for AGIs $50k-75k, 258.1% for AGIs $75k-100k, 472.6% for AGIs $100k-200k, 2744.8% for AGIs over 200k)
Taxable individual retirement arrangement distribution: $20,927 (reported on 6.0% of returns)
78727:
$20,927
Texas:
$24,740
(% of AGI for various income ranges: 38.9% for AGIs below $25k, 59.6% for AGIs $25k-50k, 112.0% for AGIs $50k-75k, 179.9% for AGIs $75k-100k, 370.1% for AGIs $100k-200k, 1212.2% for AGIs over 200k)
Self-employed (Keogh) retirement plans: $21,575 (reported on 0.5% of returns)
78727:
$21,575
Texas:
$29,298
(% of AGI for various income ranges: 42.6% for AGIs $100k-200k, 223.0% for AGIs over 200k)
Total itemized deductions: $27,134 (reported on 7.7% of returns)
Here:
$27,134
State:
$40,428
(% of AGI for various income ranges: 42.1% for AGIs below $25k, 67.3% for AGIs $25k-50k, 162.1% for AGIs $50k-75k, 291.8% for AGIs $75k-100k, 588.7% for AGIs $100k-200k, 2712.0% for AGIs over 200k)
Charity contributions: $10,038 (reported on 5.8% of returns)
Here:
$10,038
State:
$18,201
(% of AGI for various income ranges: 2.9% for AGIs below $25k, 9.9% for AGIs $25k-50k, 29.2% for AGIs $50k-75k, 49.4% for AGIs $75k-100k, 154.5% for AGIs $100k-200k, 1083.8% for AGIs over 200k)
Taxes paid: $7,989 (reported on 7.6% of returns)
78727:
$7,989
State:
$7,821
(% of AGI for various income ranges: 9.3% for AGIs below $25k, 16.6% for AGIs $25k-50k, 48.5% for AGIs $50k-75k, 94.9% for AGIs $75k-100k, 190.7% for AGIs $100k-200k, 680.8% for AGIs over 200k)
Earned income credit: $1,791 (reported on 8.7% of returns)
Here:
$1,791
State:
$2,584
(% of AGI for various income ranges: 66.2% for AGIs below $25k, 30.8% for AGIs $25k-50k)
Percentage of individuals using paid preparers for their 2020 taxes: 92.4%
Here:
92%
State:
92%
(% for various income ranges: 90.5% for AGIs below $25k, 93.6% for AGIs $25k-50k, 93.0% for AGIs $50k-75k, 92.4% for AGIs $75k-100k, 92.2% for AGIs $100k-200k, 92.7% for AGIs over 200k)
Averages for the 2012 tax year for zip code 78727, filed in 2013:
Average Adjusted Gross Income (AGI) in 2012: $64,225 (Individual Income Tax Returns)
Here:
$64,225
State:
$65,384
Salary/wage: $58,580 (reported on 88.9% of returns)
Here:
$58,580
State:
$52,524
(% of AGI for various income ranges: 80.3% for AGIs below $25k, 87.4% for AGIs $25k-50k, 84.7% for AGIs $50k-75k, 85.2% for AGIs $75k-100k, 83.2% for AGIs $100k-200k, 63.1% for AGIs over 200k)
Taxable interest for individuals: $844 (reported on 35.3% of returns)
This zip code:
$844
Texas:
$2,372
(% of AGI for various income ranges: 0.8% for AGIs below $25k, 0.4% for AGIs $25k-50k, 0.5% for AGIs $50k-75k, 0.5% for AGIs $75k-100k, 0.4% for AGIs $100k-200k, 0.6% for AGIs over 200k)
Ordinary dividends: $3,421 (reported on 23.0% of returns)
Here:
$3,421
State:
$9,721
(% of AGI for various income ranges: 1.9% for AGIs below $25k, 0.9% for AGIs $25k-50k, 0.8% for AGIs $50k-75k, 1.0% for AGIs $75k-100k, 1.3% for AGIs $100k-200k, 1.8% for AGIs over 200k)
Net capital gain/loss in AGI: +$5,751 (reported on 19.9% of returns)
Here:
+$5,751
State:
+$35,319
(% of AGI for various income ranges: 0.3% for AGIs $25k-50k, 0.4% for AGIs $50k-75k, 0.4% for AGIs $75k-100k, 1.4% for AGIs $100k-200k, 7.4% for AGIs over 200k)
Profit/loss from business: +$14,398 (reported on 16.5% of returns)
Here:
+$14,398
State:
+$13,732
(% of AGI for various income ranges: 8.8% for AGIs below $25k, 3.5% for AGIs $25k-50k, 3.1% for AGIs $50k-75k, 2.2% for AGIs $75k-100k, 3.2% for AGIs $100k-200k, 5.3% for AGIs over 200k)
Taxable individual retirement arrangement distribution: $16,894 (reported on 6.4% of returns)
78727:
$16,894
Texas:
$19,511
(% of AGI for various income ranges: 1.9% for AGIs below $25k, 1.3% for AGIs $25k-50k, 1.5% for AGIs $50k-75k, 1.8% for AGIs $75k-100k, 1.8% for AGIs $100k-200k, 1.7% for AGIs over 200k)
Self-employment retirement plans: $16,536 (reported on 0.8% of returns)
78727:
$16,536
Texas:
$23,938
(% of AGI for various income ranges: 0.2% for AGIs $25k-50k, 0.3% for AGIs $100k-200k, 0.5% for AGIs over 200k)
Total itemized deductions: $17,995 (17% of AGI, reported on 30.5% of returns)
Here:
$17,995
State:
$24,724
Here:
17.4% of AGI
State:
15.9% of AGI
(% of AGI for various income ranges: 8.4% for AGIs below $25k, 7.0% for AGIs $25k-50k, 9.3% for AGIs $50k-75k, 9.2% for AGIs $75k-100k, 9.4% for AGIs $100k-200k, 7.0% for AGIs over 200k)
Charity contributions: $3,625 (reported on 23.3% of returns)
Here:
$3,625
State:
$6,808
(% of AGI for various income ranges: 0.5% for AGIs below $25k, 0.6% for AGIs $25k-50k, 1.1% for AGIs $50k-75k, 1.3% for AGIs $75k-100k, 1.7% for AGIs $100k-200k, 1.7% for AGIs over 200k)
Taxes paid: $6,504 (reported on 30.0% of returns)
78727:
$6,504
State:
$6,921
(% of AGI for various income ranges: 2.3% for AGIs below $25k, 2.3% for AGIs $25k-50k, 3.0% for AGIs $50k-75k, 3.1% for AGIs $75k-100k, 3.4% for AGIs $100k-200k, 3.3% for AGIs over 200k)
Earned income credit: $1,849 (reported on 10.7% of returns)
Here:
$1,849
State:
$2,570
(% of AGI for various income ranges: 4.3% for AGIs below $25k, 0.5% for AGIs $25k-50k)
Percentage of individuals using paid preparers for their 2012 taxes: 31.5%
Here:
32%
State:
51%
(% for various income ranges: 30.9% for AGIs below $25k, 27.5% for AGIs $25k-50k, 31.6% for AGIs $50k-75k, 30.7% for AGIs $75k-100k, 36.2% for AGIs $100k-200k, 52.4% for AGIs over 200k)
Averages for the 2004 tax year for zip code 78727, filed in 2005:
Average Adjusted Gross Income (AGI) in 2004: $53,594 (Individual Income Tax Returns)
Here:
$53,594
State:
$47,881
Salary/wage: $50,567 (reported on 90.9% of returns)
Here:
$50,567
State:
$41,947
(% of AGI for various income ranges: 146.6% for AGIs below $10k, 87.3% for AGIs $10k-25k, 89.8% for AGIs $25k-50k, 88.0% for AGIs $50k-75k, 87.5% for AGIs $75k-100k, 80.1% for AGIs over 100k)
Taxable interest for individuals: $922 (reported on 45.1% of returns)
This zip code:
$922
Texas:
$2,255
(% of AGI for various income ranges: 4.7% for AGIs below $10k, 1.2% for AGIs $10k-25k, 0.7% for AGIs $25k-50k, 0.7% for AGIs $50k-75k, 0.7% for AGIs $75k-100k, 0.8% for AGIs over 100k)
Taxable dividends: $1,638 (reported on 26.4% of returns)
Here:
$1,638
State:
$4,261
(% of AGI for various income ranges: 4.1% for AGIs below $10k, 0.9% for AGIs $10k-25k, 0.6% for AGIs $25k-50k, 0.5% for AGIs $50k-75k, 0.7% for AGIs $75k-100k, 1.1% for AGIs over 100k)
Net capital gain/loss: +$3,937 (reported on 24.3% of returns)
Here:
+$3,937
State:
+$16,110
(% of AGI for various income ranges: -3.8% for AGIs below $10k, -0.1% for AGIs $10k-25k, 0.3% for AGIs $25k-50k, 0.6% for AGIs $50k-75k, 0.9% for AGIs $75k-100k, 4.0% for AGIs over 100k)
Profit/loss from business: +$11,585 (reported on 15.6% of returns)
Here:
+$11,585
State:
+$11,013
(% of AGI for various income ranges: 16.4% for AGIs below $10k, 5.2% for AGIs $10k-25k, 2.9% for AGIs $25k-50k, 2.9% for AGIs $50k-75k, 2.6% for AGIs $75k-100k, 3.7% for AGIs over 100k)
IRA payment deduction: $2,976 (reported on 2.6% of returns)
78727:
$2,976
Texas:
$3,120
(% of AGI for various income ranges: 0.3% for AGIs $10k-25k, 0.2% for AGIs $25k-50k, 0.1% for AGIs $50k-75k, 0.2% for AGIs $75k-100k, 0.1% for AGIs over 100k)
Self-employed pension: $10,330 (reported on 0.9% of returns)
Here:
$10,330
Texas:
$16,401
(% of AGI for various income ranges: 0.1% for AGIs $25k-50k, 0.1% for AGIs $50k-75k, 0.1% for AGIs $75k-100k, 0.3% for AGIs over 100k)
Total itemized deductions: $15,643 (19% of AGI, reported on 36.9% of returns)
Here:
$15,643
State:
$19,631
Here:
19.4% of AGI
State:
18.9% of AGI
(% of AGI for various income ranges: 22.7% for AGIs below $10k, 10.1% for AGIs $10k-25k, 9.9% for AGIs $25k-50k, 11.8% for AGIs $50k-75k, 12.3% for AGIs $75k-100k, 9.8% for AGIs over 100k)
Charity contributions deductions: $2,635 (3% of AGI, reported on 29.8% of returns)
Here:
$2,635
State:
$4,753
Here:
3.1% of AGI
State:
4.2% of AGI
(% of AGI for various income ranges: 0.8% for AGIs below $10k, 0.8% for AGIs $10k-25k, 0.9% for AGIs $25k-50k, 1.3% for AGIs $50k-75k, 1.8% for AGIs $75k-100k, 1.8% for AGIs over 100k)
Total tax: $8,442 (reported on 84.9% of returns)
78727:
$8,442
State:
$9,058
(% of AGI for various income ranges: 5.2% for AGIs below $10k, 5.2% for AGIs $10k-25k, 8.8% for AGIs $25k-50k, 11.7% for AGIs $50k-75k, 12.7% for AGIs $75k-100k, 18.4% for AGIs over 100k)
Earned income credit: $1,466 (reported on 8.5% of returns)
Here:
$1,466
State:
$2,024
Percentage of individuals using paid preparers for their 2004 taxes: 34.5%
Here:
34%
State:
57%
(% for various income ranges: 32.5% for AGIs below $10k, 39.6% for AGIs $10k-25k, 32.7% for AGIs $25k-50k, 32.5% for AGIs $50k-75k, 31.5% for AGIs $75k-100k, 38.6% for AGIs over 100k)
Likely homosexual households (counted as self-reported same-sex unmarried-partner households)
Lesbian couples: 0.4% of all households
Gay men: 0.2% of all households
Household received Food Stamps/SNAP in the past 12 months: 495 Household did not receive Food Stamps/SNAP in the past 12 months: 13,844
Women who had a birth in the past 12 months: 720 (632 now married, 96 unmarried) Women who did not have a birth in the past 12 months: 7,270 (3,768 now married, 3,483 unmarried)
Housing units in zip code 78727 with a mortgage: 4,362 (274 second mortgage, 243 both second mortgage and home equity loan) Houses without a mortgage: 42
Median monthly owner costs for units with a mortgage: $2,269 Median monthly owner costs for units without a mortgage: $915
Residents with income below the poverty level in 2022:
This zip code:
6.0%
Whole state:
14.0%
Residents with income below 50% of the poverty level in 2022:
This zip code:
2.4%
Whole state:
7.4%
Median number of rooms in houses and condos:
Here:
6.4
State:
6.3
Median number of rooms in apartments:
Here:
3.7
State:
4.0
Notable locations in this zip code not listed on our city pages
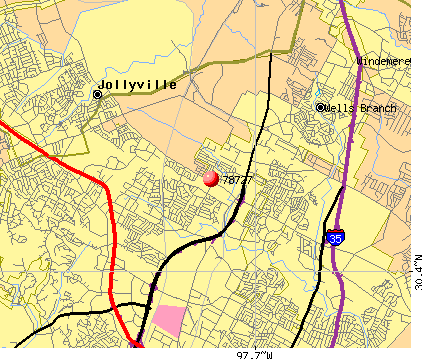
Notable locations in zip code 78727: Austin Fire Department Station 25 (A), Milwood Branch Austin City Library (B), Austin Fire Department Station 28 (C), 3M Austin Plant Emergency Response Team (D), Austin / Travis County Emergency Medical Service - Medic 10 (E). Display/hide their locations on the map
Shopping Centers: McNeil Crossing Shopping Center (1), Parmer Crossing Shopping Center (2), The Market at Wells Branch Shopping Center (3). Display/hide their locations on the map
Churches in zip code 78727 include: Milwood Baptist Church (A), Covenant United Methodist Church (B), Saint John the Forerunner Orthodox Church (C), First Church of God (D), Church of Christ Wells Branch (E), Austin Taiwanese Presbyterian Church (F), New Life United Pentecostal Church (G), Northwest Church of Christ (H), Saint Stephens Baptist Church (I). Display/hide their locations on the map
4,441 married couples with children.
795 single-parent households (279 men, 516 women).
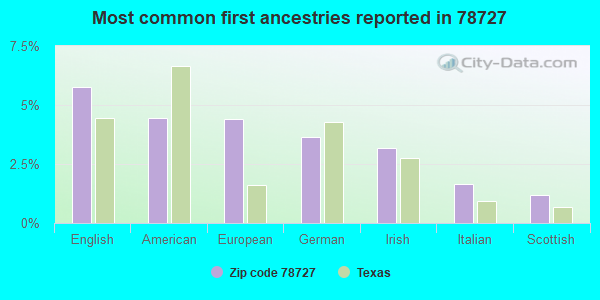
71.5% of residents of 78727 zip code speak English at home.
9.2% of residents speak Spanish at home (83% very well, 10% well, 5% not well, 2% not at all).
9.0% of residents speak other Indo-European language at home (85% very well, 10% well, 5% not well).
10.5% of residents speak Asian or Pacific Island language at home (59% very well, 24% well, 14% not well, 3% not at all).
0.5% of residents speak other language at home (93% very well, 7% well).
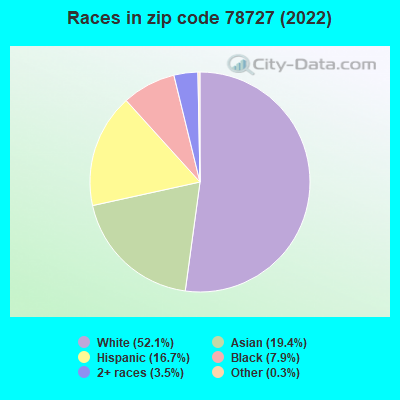
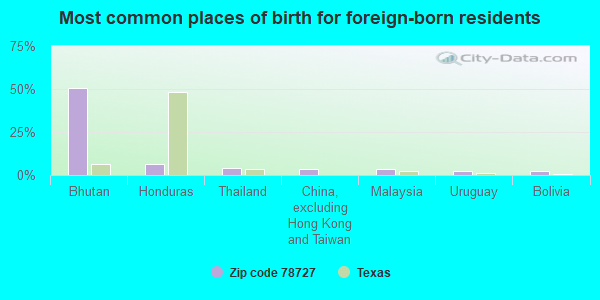
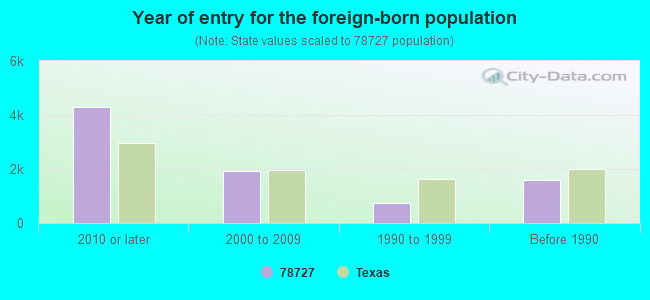
Foreign born population: 7,304 (23.2%) (41.3% of them are naturalized citizens)
Facilities with environmental interests located in this zip code:
AUSTIN WHITE LIME COMPANY (14001 MCNEIL ROAD in AUSTIN, TX)
AIR MAJOR (AIRS/AFS) COMPLIANCE ACTIVITY (Tracking inspections of insecticide, fungicide, and rodenticide, and toxic substances) Small Quantity Generators, between 100 kg and 1000 kg of hazardous waste/month (Resource Conservation and Recovery Act (tracking hazardous waste)) - notification TRI REPORTER (Tracking of toxic chemicals releasing facilities) Business SIC classification: LIME; CUT STONE AND STONE PRODUCTS; WATER SUPPLY Alternative names: TOM TURNER
AUSTIN AMERICAN TECHNOLOGY CORP (12201 TECHNOLOGY BLVD STE 160 in AUSTIN, TX)
Conditionally Exempt Small Quantity Generators, less than 100 kg/month of hazardous waste (Resource Conservation and Recovery Act (tracking hazardous waste)) - notification
Housing units lacking complete kitchen facilities: 0.5%
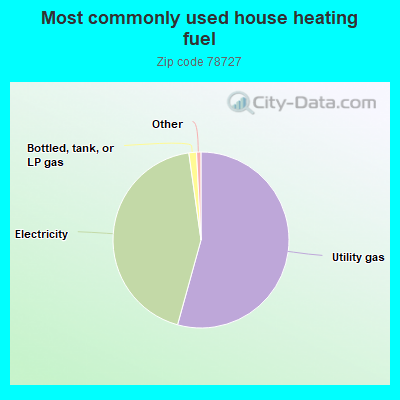
54.3%Utility gas
43.5%Electricity
1.4%Bottled, tank, or LP gas
Population in 1990: 14,276. Population change in the 1990s: +7,936 (+55.6%).
Place of birth for U.S.-born residents:
This state: 12,839
Northeast: 1,640
Midwest: 2,151
South: 2,956
West: 3,845
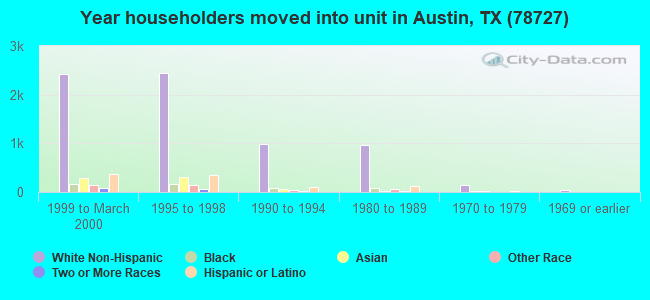
40% of the 78727 zip code residents lived in the same house 5 years ago. Out of people who lived in different houses, 50% lived in this county. Out of people who lived in different counties, 50% lived in Texas.
80% of the 78727 zip code residents lived in the same house 1 year ago. Out of people who lived in different houses, 48% moved from this county. Out of people who lived in different houses, 26% moved from different county within same state. Out of people who lived in different houses, 17% moved from different state. Out of people who lived in different houses, 9% moved from abroad.
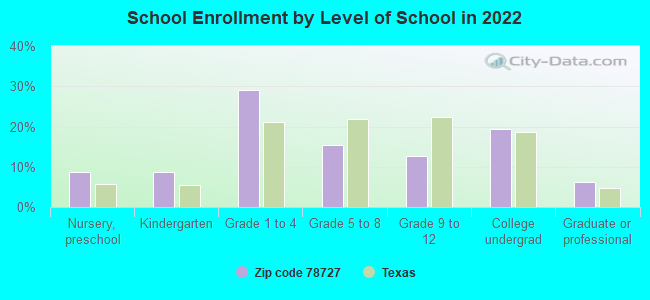
Private vs. public school enrollment:
Students in private schools in grades 1 to 8 (elementary and middle school): 439
Here:
18.5%
Texas:
8.8%
Students in private schools in grades 9 to 12 (high school): 94
Here:
13.9%
Texas:
8.0%
Students in private undergraduate colleges: 103
Here:
10.1%
Texas:
16.2%
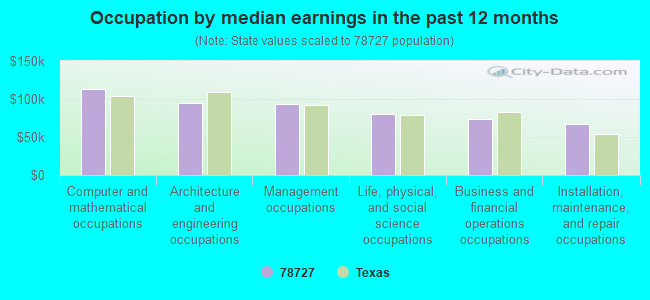
Occupation by median earnings in the past 12 months ($)
112,757Computer and mathematical occupations
94,323Architecture and engineering occupations
93,210Management occupations
80,024Life, physical, and social science occupations
73,141Business and financial operations occupations
67,252Installation, maintenance, and repair occupations
Companies with federal contracts located in this zip code (AUSTIN, TX):
LUMINEX CORPORATION (12212; small business) : $739,440 in 46 contractsfrom 2000 to 2006
Contracts for Equipment and Materials Testing -- Medical, Dental, and Veterinary Equipment and Supplies, Laboratory Equipment and Supplies, Medical and Surgical Instruments, Equipment, and Supplies, ADP Software, and moreby Army, Public Buildings Service, National Institutes of Health, Department of Veterans Affairs, and others Signed by year:2000: $179,495; 2001: $205,485; 2002: $70,501; 2003: $34,437; 2004: $21,465; 2005: $142,973; 2006: $85,084.
Biggest contracts:
$75,000 with Army for Equipment and Materials Testing -- Medical, Dental, and Veterinary Equipment and Supplies. Taking place in UT. Signed on 2005-05-05. Completion date: 2005-08-31.
$49,000 with Public Buildings Service for Laboratory Equipment and Supplies. Taking place in GA. Signed on 2000-08-15. Completion date: 2000-08-15.
$47,000 with National Institutes of Health for Medical and Surgical Instruments, Equipment, and Supplies. Taking place in MD. Signed on 2001-08-15. Completion date: 2001-09-15.
$45,000 with Department of Veterans Affairs for Medical and Surgical Instruments, Equipment, and Supplies. Taking place in NJ. Signed on 2001-06-15. Completion date: 2001-07-15.
ABBOTT SPINE, INC (5301 RIATA PARK CT BLDG F) : $398,103 in 45 contractsfrom 2002 to 2006
Contracts for Medical and Surgical Instruments, Equipment, and Supplies, Maintenance, Repair and Rebuilding of Equipment -- Medical, Dental, and Veterinary Equipment and Supplies by Army, Air Force, Department of Veterans Affairs Signed by year:2000: $0; 2001: $0; 2002: $8,760; 2003: $89,570; 2004: $53,505; 2005: $188,741; 2006: $57,527.
Biggest contracts:
$60,000 with Army for Medical and Surgical Instruments, Equipment, and Supplies. Signed on 2003-10-29. Completion date: 2004-09-30.
$60,000, same as above.Signed on 2002-05-20. Completion date: 2002-05-01.
$25,105 with Air Force for Medical and Surgical Instruments, Equipment, and Supplies. Signed on 2005-12-01. Completion date: 2005-12-02.
$25,000 with Army for Medical and Surgical Instruments, Equipment, and Supplies. Signed on 2003-11-04. Completion date: 2004-09-30.
BARR & BARR COMMUNICATION CONS (4109 COLUMBINE DR; small business) : $128,069 in 22 contractsfrom 2002 to 2006
Contracts for Other Professional Services, Training/Curriculum Development, Other Education and Training Services, Other Management Support Services, and moreby Uniformed Services University of the Health Sciences, National Oceanic and Atmospheric Administration/Under Secretary for Oceans and Atmosphere, Army, U.S. Army Corps of Engineers - civil program financing only, and others Signed by year:2000: $0; 2001: $0; 2002: $2,641; 2003: $19,555; 2004: $27,930; 2005: $70,139; 2006: $7,804.
Biggest contracts:
$47,500 with Uniformed Services University of the Health Sciences for Other Professional Services. Taking place in MD. Signed on 2005-10-25. Completion date: 2006-07-15.
$12,000 with National Oceanic and Atmospheric Administration/Under Secretary for Oceans and Atmosphere for Training/Curriculum Development. Taking place in MO. Signed on 2004-04-09. Completion date: 2004-04-21.
$7,500 with Army for Other Education and Training Services. Signed on 2003-02-27. Completion date: 2003-09-30.
$6,971 with Army for Other Management Support Services. Taking place in DC. Signed on 2005-01-05. Completion date: 2004-12-16.
AUSTIN AMERICAN TECHNOLOGY COR (12201 TECHNOLOGY BLVD ST; small business)
$99,800 with Army for Specialized Semiconductor, Microcircuit, and Printed Circuit Board Manufacturing Machinery. Signed on 2001-12-28. Completion date: 2002-03-15.
AGILE TECHNOLOGY, INCORPORATED (4317 GANYMEDE DRIVE; small business)
$29,500 with Navy for Communications Services. Signed on 2001-10-24. Completion date: 2001-12-31.
Top industries in this zip code by the number of employees in 2005:
Administrative and Support and Waste Management and Remediation Services: Temporary Help Services (over 1000 employees: 1 establishment, 250-499 employees: 1 establishment, 50-99 employees: 1 establishment, 1-4 employees: 3 establishments)
Wholesale Trade: Computer and Computer Peripheral Equipment and Software Merchant Wholesalers (over 1000: 1, 10-19: 1, 1-4: 1)
2002 - 2018 National Fire Incident Reporting System (NFIRS) incidents
Based on the data from the years 2002 - 2018 the average number of fire incidents per year is 38. The highest number of fires - 58 took place in 2008, and the least - 7 in 2017. The data has a growing trend.
When looking into fire subcategories, the most incidents belonged to: Outside Fires (49.1%), and Structure Fires (31.4%).
Fire incident types reported to NFIRS in Zip Code 78727


 Nearest zip codes: 78728, 78758, 78729, 78759, 78753, 78717.
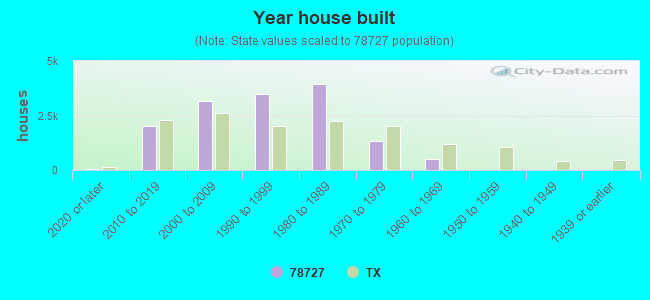


 Based on the data from the years 2002 - 2018 the average number of fire incidents per year is 38. The highest number of fires - 58 took place in 2008, and the least - 7 in 2017. The data has a growing trend.
 When looking into fire subcategories, the most incidents belonged to: Outside Fires (49.1%), and Structure Fires (31.4%).