Estimated zip code population in 2022: 32,150 Zip code population in 2010: 27,108 Zip code population in 2000: 24,561
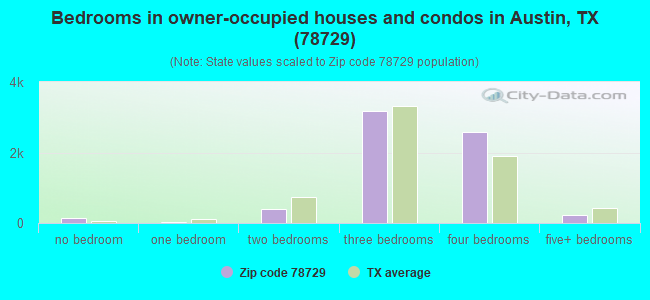
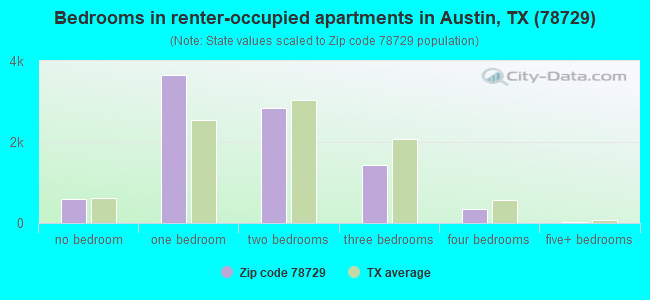
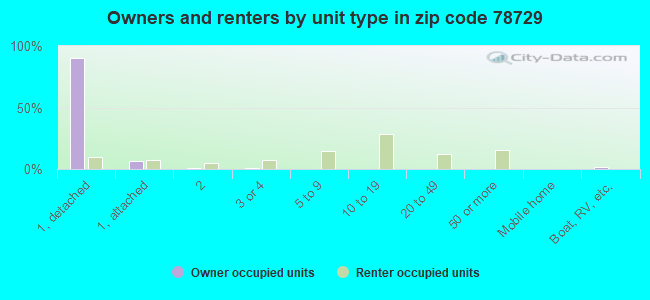
Houses and condos: 16,297 Renter-occupied apartments: 8,890
% of renters here:
58%
State:
38%
March 2022 cost of living index in zip code 78729: 94.9 (less than average, U.S. average is 100)
Land area: 9.2 sq. mi. Water area: 0.1 sq. mi.
Population density: 3,501 people per square mile
(average).
OSM Map
General Map
Google Map
MSN Map
OSM Map
General Map
Google Map
MSN Map
OSM Map
General Map
Google Map
MSN Map
OSM Map
General Map
Google Map
MSN Map
Please wait while loading the map...
Real estate property taxes paid for housing units in 2022:
This zip code:
1.6% ($7,221)
Texas:
1.5% ($4,050)
Median real estate property taxes paid for housing units with mortgages in 2022: $7,629 (1.7%) Median real estate property taxes paid for housing units with no mortgage in 2022: $6,286 (1.4%)
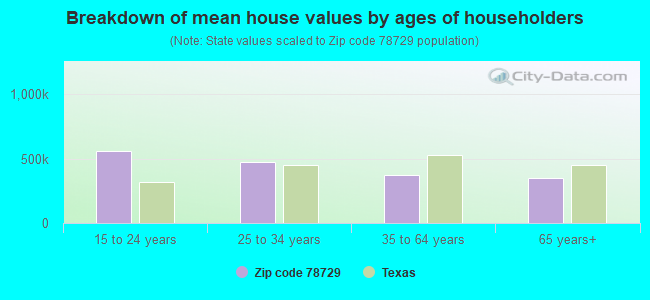
Estimated median house/condo value in 2022: $441,566
78729:
$441,566
Texas:
$275,400
According to our research of Texas and other state lists, there were 30 registered sex offenders living in 78729 zip code as of April 27, 2024. The ratio of all residents to sex offenders in zip code 78729 is 1,019 to 1. The ratio of registered sex offenders to all residents in this zip code is lower than the state average.
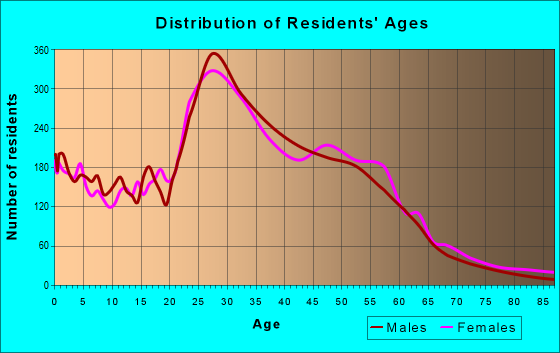
Median resident age:
This zip code:
35.1 years
Texas median age:
35.6 years
Average household size:
This zip code:
2.1 people
Texas:
2.6 people
Averages for the 2020 tax year for zip code 78729, filed in 2021:
Average Adjusted Gross Income (AGI) in 2020: $72,557 (Individual Income Tax Returns)
Here:
$72,557
State:
$77,054
Salary/wage: $67,387 (reported on 88.3% of returns)
Here:
$67,387
State:
$62,766
(% of AGI for various income ranges: 1215.8% for AGIs below $25k, 3823.6% for AGIs $25k-50k, 6815.2% for AGIs $50k-75k, 10420.3% for AGIs $75k-100k, 19470.3% for AGIs $100k-200k, 65541.0% for AGIs over 200k)
Taxable interest for individuals: $1,078 (reported on 26.4% of returns)
This zip code:
$1,078
Texas:
$2,665
(% of AGI for various income ranges: 11.8% for AGIs below $25k, 12.0% for AGIs $25k-50k, 29.3% for AGIs $50k-75k, 32.0% for AGIs $75k-100k, 98.8% for AGIs $100k-200k, 385.5% for AGIs over 200k)
Ordinary dividends: $3,445 (reported on 22.0% of returns)
Here:
$3,445
State:
$10,044
(% of AGI for various income ranges: 22.6% for AGIs below $25k, 18.9% for AGIs $25k-50k, 63.4% for AGIs $50k-75k, 113.6% for AGIs $75k-100k, 225.1% for AGIs $100k-200k, 1444.5% for AGIs over 200k)
Net capital gain/loss in AGI: +$12,602 (reported on 21.0% of returns)
Here:
+$12,602
State:
+$39,590
(% of AGI for various income ranges: 9.2% for AGIs below $25k, 24.4% for AGIs $25k-50k, 90.3% for AGIs $50k-75k, 141.9% for AGIs $75k-100k, 468.4% for AGIs $100k-200k, 9617.1% for AGIs over 200k)
Profit/loss from business: +$11,664 (reported on 17.9% of returns)
Here:
+$11,664
State:
+$10,888
(% of AGI for various income ranges: 170.5% for AGIs below $25k, 130.3% for AGIs $25k-50k, 226.8% for AGIs $50k-75k, 238.4% for AGIs $75k-100k, 573.4% for AGIs $100k-200k, 2259.4% for AGIs over 200k)
Taxable individual retirement arrangement distribution: $17,741 (reported on 5.1% of returns)
78729:
$17,741
Texas:
$24,740
(% of AGI for various income ranges: 32.5% for AGIs below $25k, 45.3% for AGIs $25k-50k, 104.7% for AGIs $50k-75k, 203.0% for AGIs $75k-100k, 296.2% for AGIs $100k-200k, 862.3% for AGIs over 200k)
Self-employed (Keogh) retirement plans: $19,183 (reported on 0.4% of returns)
78729:
$19,183
Texas:
$29,298
(% of AGI for various income ranges: 26.3% for AGIs $100k-200k, 232.3% for AGIs over 200k)
Total itemized deductions: $26,023 (reported on 6.9% of returns)
Here:
$26,023
State:
$40,428
(% of AGI for various income ranges: 25.7% for AGIs below $25k, 76.5% for AGIs $25k-50k, 200.4% for AGIs $50k-75k, 313.6% for AGIs $75k-100k, 669.3% for AGIs $100k-200k, 2108.7% for AGIs over 200k)
Charity contributions: $8,781 (reported on 5.1% of returns)
Here:
$8,781
State:
$18,201
(% of AGI for various income ranges: 11.9% for AGIs $25k-50k, 35.5% for AGIs $50k-75k, 51.7% for AGIs $75k-100k, 167.0% for AGIs $100k-200k, 838.1% for AGIs over 200k)
Taxes paid: $7,588 (reported on 6.7% of returns)
78729:
$7,588
State:
$7,821
(% of AGI for various income ranges: 7.9% for AGIs below $25k, 16.4% for AGIs $25k-50k, 54.3% for AGIs $50k-75k, 107.7% for AGIs $75k-100k, 202.0% for AGIs $100k-200k, 536.5% for AGIs over 200k)
Earned income credit: $1,778 (reported on 11.0% of returns)
Here:
$1,778
State:
$2,584
(% of AGI for various income ranges: 66.0% for AGIs below $25k, 33.7% for AGIs $25k-50k)
Percentage of individuals using paid preparers for their 2020 taxes: 93.0%
Here:
93%
State:
92%
(% for various income ranges: 91.4% for AGIs below $25k, 94.2% for AGIs $25k-50k, 93.8% for AGIs $50k-75k, 91.2% for AGIs $75k-100k, 93.0% for AGIs $100k-200k, 94.3% for AGIs over 200k)
Averages for the 2012 tax year for zip code 78729, filed in 2013:
Average Adjusted Gross Income (AGI) in 2012: $56,295 (Individual Income Tax Returns)
Here:
$56,295
State:
$65,384
Salary/wage: $52,196 (reported on 90.5% of returns)
Here:
$52,196
State:
$52,524
(% of AGI for various income ranges: 84.0% for AGIs below $25k, 88.8% for AGIs $25k-50k, 85.5% for AGIs $50k-75k, 86.5% for AGIs $75k-100k, 85.4% for AGIs $100k-200k, 64.9% for AGIs over 200k)
Taxable interest for individuals: $754 (reported on 29.2% of returns)
This zip code:
$754
Texas:
$2,372
(% of AGI for various income ranges: 0.8% for AGIs below $25k, 0.3% for AGIs $25k-50k, 0.3% for AGIs $50k-75k, 0.4% for AGIs $75k-100k, 0.3% for AGIs $100k-200k, 0.6% for AGIs over 200k)
Ordinary dividends: $2,942 (reported on 18.5% of returns)
Here:
$2,942
State:
$9,721
(% of AGI for various income ranges: 2.3% for AGIs below $25k, 0.5% for AGIs $25k-50k, 0.6% for AGIs $50k-75k, 0.6% for AGIs $75k-100k, 1.1% for AGIs $100k-200k, 1.4% for AGIs over 200k)
Net capital gain/loss in AGI: +$5,851 (reported on 15.3% of returns)
Here:
+$5,851
State:
+$35,319
(% of AGI for various income ranges: 0.2% for AGIs $25k-50k, 0.3% for AGIs $50k-75k, 0.6% for AGIs $75k-100k, 0.9% for AGIs $100k-200k, 10.7% for AGIs over 200k)
Profit/loss from business: +$13,642 (reported on 15.5% of returns)
Here:
+$13,642
State:
+$13,732
(% of AGI for various income ranges: 6.9% for AGIs below $25k, 3.8% for AGIs $25k-50k, 3.7% for AGIs $50k-75k, 3.2% for AGIs $75k-100k, 3.5% for AGIs $100k-200k, 3.0% for AGIs over 200k)
Taxable individual retirement arrangement distribution: $14,544 (reported on 6.0% of returns)
78729:
$14,544
Texas:
$19,511
(% of AGI for various income ranges: 1.4% for AGIs below $25k, 1.2% for AGIs $25k-50k, 1.6% for AGIs $50k-75k, 1.5% for AGIs $75k-100k, 1.7% for AGIs $100k-200k, 1.8% for AGIs over 200k)
Self-employment retirement plans: $10,700 (reported on 0.5% of returns)
78729:
$10,700
Texas:
$23,938
Total itemized deductions: $17,272 (18% of AGI, reported on 26.6% of returns)
Here:
$17,272
State:
$24,724
Here:
17.7% of AGI
State:
15.9% of AGI
(% of AGI for various income ranges: 6.7% for AGIs below $25k, 5.9% for AGIs $25k-50k, 8.7% for AGIs $50k-75k, 10.2% for AGIs $75k-100k, 9.2% for AGIs $100k-200k, 6.2% for AGIs over 200k)
Charity contributions: $3,418 (reported on 20.2% of returns)
Here:
$3,418
State:
$6,808
(% of AGI for various income ranges: 0.4% for AGIs below $25k, 0.7% for AGIs $25k-50k, 1.0% for AGIs $50k-75k, 1.3% for AGIs $75k-100k, 1.6% for AGIs $100k-200k, 1.9% for AGIs over 200k)
Taxes paid: $5,806 (reported on 25.9% of returns)
78729:
$5,806
State:
$6,921
(% of AGI for various income ranges: 1.5% for AGIs below $25k, 1.6% for AGIs $25k-50k, 2.7% for AGIs $50k-75k, 3.4% for AGIs $75k-100k, 3.3% for AGIs $100k-200k, 2.4% for AGIs over 200k)
Earned income credit: $1,844 (reported on 12.9% of returns)
Here:
$1,844
State:
$2,570
(% of AGI for various income ranges: 4.1% for AGIs below $25k, 0.7% for AGIs $25k-50k)
Percentage of individuals using paid preparers for their 2012 taxes: 29.8%
Here:
30%
State:
51%
(% for various income ranges: 28.2% for AGIs below $25k, 27.0% for AGIs $25k-50k, 30.1% for AGIs $50k-75k, 31.8% for AGIs $75k-100k, 35.1% for AGIs $100k-200k, 50.0% for AGIs over 200k)
Averages for the 2004 tax year for zip code 78729, filed in 2005:
Average Adjusted Gross Income (AGI) in 2004: $49,142 (Individual Income Tax Returns)
Here:
$49,142
State:
$47,881
Salary/wage: $47,524 (reported on 91.2% of returns)
Here:
$47,524
State:
$41,947
(% of AGI for various income ranges: 109.7% for AGIs below $10k, 89.0% for AGIs $10k-25k, 89.9% for AGIs $25k-50k, 89.0% for AGIs $50k-75k, 89.2% for AGIs $75k-100k, 85.5% for AGIs over 100k)
Taxable interest for individuals: $699 (reported on 40.1% of returns)
This zip code:
$699
Texas:
$2,255
(% of AGI for various income ranges: 2.6% for AGIs below $10k, 0.9% for AGIs $10k-25k, 0.4% for AGIs $25k-50k, 0.6% for AGIs $50k-75k, 0.5% for AGIs $75k-100k, 0.5% for AGIs over 100k)
Taxable dividends: $1,186 (reported on 23.0% of returns)
Here:
$1,186
State:
$4,261
(% of AGI for various income ranges: 2.5% for AGIs below $10k, 0.8% for AGIs $10k-25k, 0.5% for AGIs $25k-50k, 0.4% for AGIs $50k-75k, 0.4% for AGIs $75k-100k, 0.7% for AGIs over 100k)
Net capital gain/loss: +$3,812 (reported on 20.9% of returns)
Here:
+$3,812
State:
+$16,110
(% of AGI for various income ranges: -3.0% for AGIs below $10k, -0.0% for AGIs $10k-25k, 0.2% for AGIs $25k-50k, 0.2% for AGIs $50k-75k, 0.8% for AGIs $75k-100k, 4.2% for AGIs over 100k)
Profit/loss from business: +$10,046 (reported on 15.5% of returns)
Here:
+$10,046
State:
+$11,013
(% of AGI for various income ranges: 5.3% for AGIs below $10k, 5.2% for AGIs $10k-25k, 3.4% for AGIs $25k-50k, 2.9% for AGIs $50k-75k, 2.9% for AGIs $75k-100k, 2.8% for AGIs over 100k)
IRA payment deduction: $2,826 (reported on 2.5% of returns)
78729:
$2,826
Texas:
$3,120
(% of AGI for various income ranges: 0.2% for AGIs $10k-25k, 0.2% for AGIs $25k-50k, 0.2% for AGIs $50k-75k, 0.1% for AGIs $75k-100k, 0.1% for AGIs over 100k)
Self-employed pension: $9,815 (reported on 0.7% of returns)
Here:
$9,815
Texas:
$16,401
(% of AGI for various income ranges: 0.1% for AGIs $25k-50k, 0.1% for AGIs $50k-75k, 0.1% for AGIs $75k-100k, 0.2% for AGIs over 100k)
Total itemized deductions: $15,794 (19% of AGI, reported on 35.9% of returns)
Here:
$15,794
State:
$19,631
Here:
19.4% of AGI
State:
18.9% of AGI
(% of AGI for various income ranges: 15.5% for AGIs below $10k, 7.1% for AGIs $10k-25k, 9.8% for AGIs $25k-50k, 13.0% for AGIs $50k-75k, 14.5% for AGIs $75k-100k, 11.0% for AGIs over 100k)
Charity contributions deductions: $2,600 (3% of AGI, reported on 29.6% of returns)
Here:
$2,600
State:
$4,753
Here:
3.1% of AGI
State:
4.2% of AGI
(% of AGI for various income ranges: 0.7% for AGIs below $10k, 0.7% for AGIs $10k-25k, 1.0% for AGIs $25k-50k, 1.4% for AGIs $50k-75k, 2.0% for AGIs $75k-100k, 2.0% for AGIs over 100k)
Total tax: $7,129 (reported on 82.9% of returns)
78729:
$7,129
State:
$9,058
(% of AGI for various income ranges: 3.1% for AGIs below $10k, 5.3% for AGIs $10k-25k, 8.3% for AGIs $25k-50k, 10.6% for AGIs $50k-75k, 11.6% for AGIs $75k-100k, 16.9% for AGIs over 100k)
Earned income credit: $1,445 (reported on 9.7% of returns)
Here:
$1,445
State:
$2,024
Percentage of individuals using paid preparers for their 2004 taxes: 33.4%
Here:
33%
State:
57%
(% for various income ranges: 31.0% for AGIs below $10k, 36.9% for AGIs $10k-25k, 31.6% for AGIs $25k-50k, 33.9% for AGIs $50k-75k, 32.1% for AGIs $75k-100k, 35.2% for AGIs over 100k)
Likely homosexual households (counted as self-reported same-sex unmarried-partner households)
Lesbian couples: 0.2% of all households
Gay men: 0.4% of all households
Household received Food Stamps/SNAP in the past 12 months: 695 Household did not receive Food Stamps/SNAP in the past 12 months: 14,676
Women who had a birth in the past 12 months: 502 (386 now married, 118 unmarried) Women who did not have a birth in the past 12 months: 8,875 (4,220 now married, 4,645 unmarried)
Housing units in zip code 78729 with a mortgage: 4,586 (478 second mortgage, 429 both second mortgage and home equity loan) Houses without a mortgage: 171
Median monthly owner costs for units with a mortgage: $2,204 Median monthly owner costs for units without a mortgage: $856
Residents with income below the poverty level in 2022:
This zip code:
6.8%
Whole state:
14.0%
Residents with income below 50% of the poverty level in 2022:
This zip code:
2.7%
Whole state:
7.4%
Median number of rooms in houses and condos:
Here:
6.7
State:
6.3
Median number of rooms in apartments:
Here:
3.5
State:
4.0
Notable locations in this zip code not listed on our city pages
Notable locations in zip code 78729: Austin Fire Department Station 34 (A), Jollyville Volunteer Fire Department Station 1 (B), Austin / Travis County Emergency Medical Service - Medic 27 (C). Display/hide their locations on the map
Churches in zip code 78729 include: North Austin Community Church (A), Church of Christ - Pond Springs (B), Kingdom Hall of Jehovah's Witnesses (C), Nevertheless Community Church (D), Northwest Fellowship Church (E), Pond Springs Baptist Church (F), Tree of Life International Prayer and Praise Center (G). Display/hide their locations on the map
4,034 married couples with children.
1,480 single-parent households (369 men, 1,111 women).
74.8% of residents of 78729 zip code speak English at home.
9.4% of residents speak Spanish at home (72% very well, 15% well, 5% not well, 7% not at all).
6.3% of residents speak other Indo-European language at home (66% very well, 15% well, 17% not well, 2% not at all).
7.3% of residents speak Asian or Pacific Island language at home (64% very well, 24% well, 12% not well).
2.4% of residents speak other language at home (94% very well, 6% well).
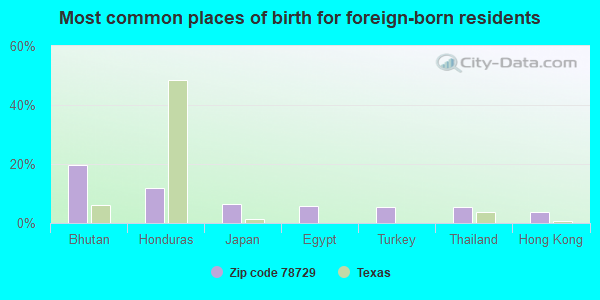
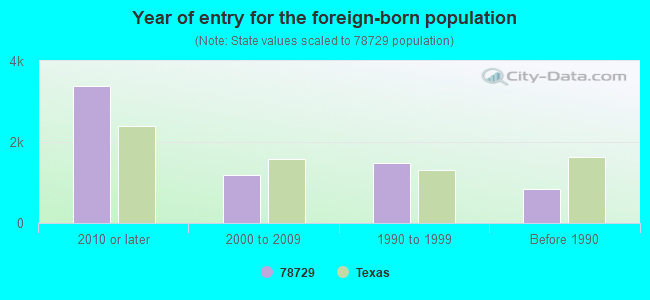
Foreign born population: 6,056 (18.8%) (49.2% of them are naturalized citizens)
This zip code:
18.8%
Whole state:
17.2%
20%Bhutan
12%Honduras
7%Japan
6%Egypt
6%Turkey
5%Thailand
4%Hong Kong
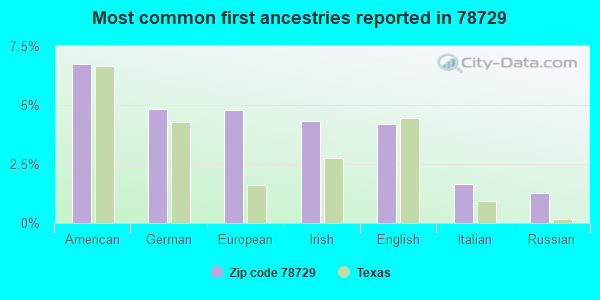
7%American
5%German
5%European
4%Irish
4%English
2%Italian
1%Russian
Year of entry for the foreign-born population
3,3822010 or later
1,1782000 to 2009
1,4761990 to 1999
843Before 1990
Housing units lacking complete kitchen facilities: 1.4%
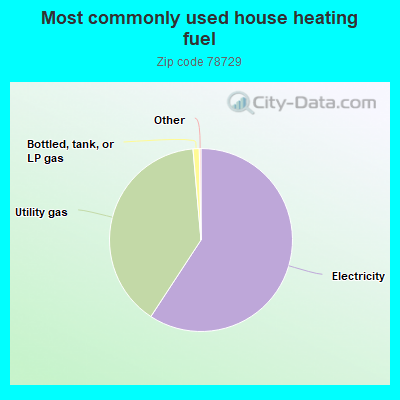
59.3%Electricity
39.4%Utility gas
1.1%Bottled, tank, or LP gas
Population in 1990: 16,611. Population change in the 1990s: +7,950 (+47.9%).
Place of birth for U.S.-born residents:
This state: 15,313
Northeast: 1,859
Midwest: 3,092
South: 2,481
West: 2,925
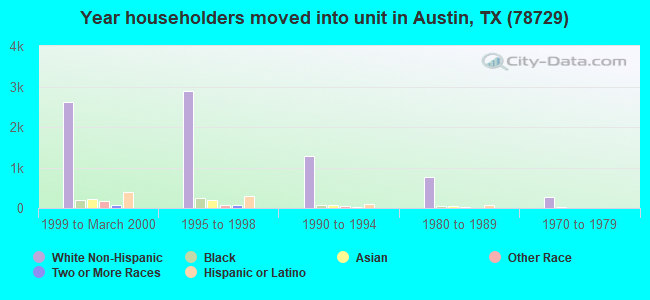
37% of the 78729 zip code residents lived in the same house 5 years ago. Out of people who lived in different houses, 22% lived in this county. Out of people who lived in different counties, 50% lived in Texas.
82% of the 78729 zip code residents lived in the same house 1 year ago. Out of people who lived in different houses, 30% moved from this county. Out of people who lived in different houses, 46% moved from different county within same state. Out of people who lived in different houses, 22% moved from different state. Out of people who lived in different houses, 4% moved from abroad.
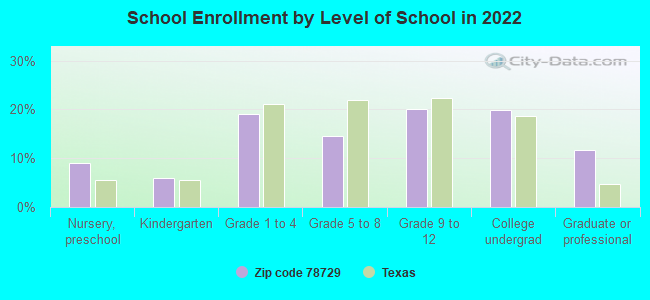
Private vs. public school enrollment:
Students in private schools in grades 1 to 8 (elementary and middle school): 212
Here:
9.8%
Texas:
8.8%
Students in private schools in grades 9 to 12 (high school): 69
Here:
5.4%
Texas:
8.0%
Students in private undergraduate colleges: 67
Here:
5.3%
Texas:
16.2%
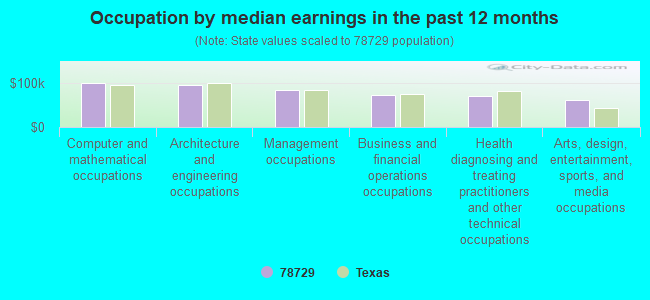
Occupation by median earnings in the past 12 months ($)
98,662Computer and mathematical occupations
95,523Architecture and engineering occupations
84,359Management occupations
71,509Business and financial operations occupations
70,361Health diagnosing and treating practitioners and other technical occupations
60,325Arts, design, entertainment, sports, and media occupations
Companies with federal contracts located in this zip code (AUSTIN, TX):
THE MCCARTY CORPORATION (13494 POND SPRINGS RD) : $193,385,147 in 289 contractsfrom 1999 to 2006
Contracts for Construction of Structures and Facilities -- Troop Housing Facilities, Construction of Structures and Facilities -- Miscellaneous Buildings, Construction of Structures and Facilities -- Other Residential Buildings, Maintenance, Repair or Alteration of Real Property -- Troop Housing Facilities, and moreby Army, Air Force Signed by year:2000: $25,337,476; 2001: $38,389,178; 2002: $9,951,636; 2003: $69,927,865; 2004: $41,344,591; 2005: $759,246; 2006: $228,667.
Biggest contracts:
$37,791,000 with Army for Construction of Structures and Facilities -- Troop Housing Facilities. Taking place in NC. Signed on 2003-08-27. Completion date: 2005-08-19.
$23,293,000, same as above.Signed on 2003-12-10. Completion date: 2005-08-19.
$16,824,000 with Army for Construction of Structures and Facilities -- Miscellaneous Buildings. Taking place in NC. Signed on 2004-06-21. Completion date: 2005-12-31.
$14,918,000 with Army for Construction of Structures and Facilities -- Other Residential Buildings. Taking place in NC. Signed on 2004-12-20. Completion date: 2006-09-30.
URS GROUP, INC (9400 AMBERGLEN BOULEVARD) : $23,935,220 in 208 contractsfrom 2000 to 2006
Contracts for Other Architect and Engineering Services, Architect - Engineer Services (including landscaping, interior layout, and designing), Maintenance, Repair and Rebuilding of Equipment -- Automatic Data Processing Equipment (Including Firmware), Software, Supplies and Support Equipment, A&E Inspection Services (non-construction), and moreby Air Force, Army, Navy, Minerals Management Service, and others Signed by year:2000: $1,919,710; 2001: $3,852,014; 2002: $4,465,799; 2003: $4,379,208; 2004: $7,030,953; 2005: $2,045,798; 2006: $241,738.
Biggest contracts:
$1,380,000 with Air Force for Other Architect and Engineering Services. Taking place in CO. Signed on 2004-05-07. Completion date: 2005-01-31.
$1,374,059 with Army for Architect - Engineer Services (including landscaping, interior layout, and designing). Taking place in AR. Signed on 2001-03-21. Completion date: 2001-01-22.
$1,059,329 with Army for Architect - Engineer Services (including landscaping, interior layout, and designing). Taking place in LA. Signed on 2002-08-12. Completion date: 2003-08-08.
$908,610 with Army for Architect - Engineer Services (including landscaping, interior layout, and designing). Taking place in AR. Signed on 2001-08-21. Completion date: 2001-01-22.
DAC INTERNATIONAL, INC (6702 MCNEIL DRIVE; small business) : $2,416,065 in 12 contractsfrom 1999 to 2004
Contracts for Radio Navigation Equipment, Airborne, Sound Recording and Reproducing Equipment, Radio and Television Communication Equipment, Airborne, Aircraft Maintenance and Repair Shop Specialized Equipment, and moreby NASA, Army, Air Force, Bureau of Immigration and Customs Enforcement, and others Signed by year:2000: $96,000; 2001: $1,691,000; 2002: $40,640; 2003: $363,230; 2004: $57,000; 2005: $0; 2006: $0.
Biggest contracts:
$1,691,000 with NASA for Radio Navigation Equipment, Airborne. Signed on 2001-09-15. Completion date: 2001-09-15.
$222,430 with Army for Radio Navigation Equipment, Airborne. Signed on 2003-05-07. Completion date: 2003-06-06.
$168,195 with Air Force for Sound Recording and Reproducing Equipment. Signed on 1999-12-22. Completion date: 2000-04-28.
$59,885 with Army for Radio Navigation Equipment, Airborne. Signed on 2003-09-15. Completion date: 2003-09-30.
TEXAS-CAPITAL CONTRACTORS INC (13494 POND SPRINGS ROAD; small business) : $2,303,702 in 49 contractsfrom 1999 to 2000
Contracts for Construction of Structures and Facilities -- Troop Housing Facilities, Maintenance, Repair or Alteration of Real Property -- Troop Housing Facilities, Maintenance, Repair or Alteration of Real Property -- Family Housing Facilities by Army, Navy Signed by year:2000: $2,214,822; 2001: $0; 2002: $0; 2003: $0; 2004: $0; 2005: $0; 2006: $0.
Biggest contracts:
$700,000 with Army for Construction of Structures and Facilities -- Troop Housing Facilities. Taking place in KY. Signed on 2000-04-19. Completion date: 2002-04-01.
$173,379, same as above.Signed on 2000-05-17. Completion date: 2002-04-01.
$102,400 with Army for Maintenance, Repair or Alteration of Real Property -- Troop Housing Facilities. Taking place in OK. Signed on 2000-05-17. Completion date: 2000-12-04.
$99,500 with Army for Construction of Structures and Facilities -- Troop Housing Facilities. Taking place in KY. Signed on 2000-06-06. Completion date: 2002-04-01.
ZETA CONSTRUCTION CORPORATION (13091 STE A 100 POND SPRI; small business) : $1,763,719 in 3 contractsfrom 1999 to 2001
$614,360 with Air Force for Warehousing and Storage Services. Signed on 2001-11-07. Completion date: 2002-09-30.
$591,633 with Air Force for Warehousing and Storage Services. Taking place in AL. Signed on 2001-08-29. Completion date: 2001-09-30.
$557,726, same as above.Signed on 1999-10-14. Completion date: 2000-09-30.
CAMBRIDGE CONSTRUCTION SERVICE (13581 POND SPRINGS ROAD, S; small business) : $576,312 in 83 contractsfrom 2000 to 2001
Contracts for Maintenance, Repair or Alteration of Real Property -- Other Non-Building Facilities, Maintenance, Repair or Alteration of Real Property -- Miscellaneous Buildings by U.S. Army Corps of Engineers - civil program financing only, Army Signed by year:2000: $150,583; 2001: $425,729; 2002: $0; 2003: $0; 2004: $0; 2005: $0; 2006: $0.
Biggest contracts:
$69,162 with U.S. Army Corps of Engineers - civil program financing only for Maintenance, Repair or Alteration of Real Property -- Other Non-Building Facilities. Signed on 2001-06-28. Completion date: 2001-10-01.
$49,187 with U.S. Army Corps of Engineers - civil program financing only for Maintenance, Repair or Alteration of Real Property -- Miscellaneous Buildings. Signed on 2000-10-26. Completion date: 2002-01-29.
$42,990, same as above.Signed on 2001-01-22. Completion date: 2001-04-27.
$40,088, same as above.Signed on 2000-12-05. Completion date: 2001-03-10.
METROWERKS CORPORATION (7700 WEST PARMER LANE) : $95,630 in 9 contractsfrom 2001 to 2005
Contracts for ADPE System Configuration, , Other ADP and Telecommunications Services (includes data storage on tapes, compact disks, etc.), Maintenance, Repair and Rebuilding of Equipment -- Automatic Data Processing Equipment (Including Firmware), Software, Supplies and Support Equipment, and moreby Navy, NASA, Minerals Management Service, Air Force, and others Signed by year:2000: $0; 2001: $14,000; 2002: $0; 2003: $39,709; 2004: $8,998; 2005: $32,923; 2006: $0.
Biggest contracts:
$28,720 with Navy for ADPE System Configuration. Taking place in CA. Signed on 2003-03-11. Completion date: 2003-04-15.
$15,590 with NASA for . Signed on 2005-05-09. Completion date: 2006-05-09.
$14,000 with Minerals Management Service for Other ADP and Telecommunications Services (includes data storage on tapes, compact disks, etc.). Signed on 2001-01-15. Completion date: 2001-01-15.
$9,258 with Air Force for Maintenance, Repair and Rebuilding of Equipment -- Automatic Data Processing Equipment (Including Firmware), Software, Supplies and Support Equipment. Taking place in NY. Signed on 2005-06-15. Completion date: 2006-06-14.
CAMBRIDGE CONSTRUCTIONS SERVIC (12215 ROXIE DRIVE; small business) : $94,801 in 5 contractsin 2000
Contracts for Maintenance, Repair or Alteration of Real Property -- Miscellaneous Buildings by U.S. Army Corps of Engineers - civil program financing only, Army Signed by year:2000: $94,801; 2001: $0; 2002: $0; 2003: $0; 2004: $0; 2005: $0; 2006: $0.
Biggest contracts:
$79,086 with U.S. Army Corps of Engineers - civil program financing only for Maintenance, Repair or Alteration of Real Property -- Miscellaneous Buildings. Signed on 2000-06-30. Completion date: 2000-09-18.
$15,715, same as above.Signed on 2000-06-16. Completion date: 2000-06-25.
$7,000 with Army for Maintenance, Repair or Alteration of Real Property -- Miscellaneous Buildings. Signed on 2000-02-24. Completion date: 2000-11-28.
$0 with U.S. Army Corps of Engineers - civil program financing only for Maintenance, Repair or Alteration of Real Property -- Miscellaneous Buildings. Signed on 2000-07-03. Completion date: 2000-11-28.
WASH ME (7014 RIVERTON DR; small business)
$19,148 with Army for Custodial Janitorial Services. Signed on 2003-08-21. Completion date: 2003-09-12.
A R M OF TEXAS, INC (12131 ROXIE DR)
$5,000 with Navy for Maintenance, Repair or Alteration of Real Property -- Office Buildings. Taking place in FL. Signed on 2000-04-13. Completion date: 2000-04-30.
Top industries in this zip code by the number of employees in 2005:
Finance and Insurance: Direct Property and Casualty Insurance Carriers (over 1000 employees: 1 establishment, 500-999 employees: 1 establishment)
2002 - 2018 National Fire Incident Reporting System (NFIRS) incidents
Based on the data from the years 2002 - 2018 the average number of fire incidents per year is 66. The highest number of fires - 117 took place in 2011, and the least - 38 in 2017. The data has a growing trend.
When looking into fire subcategories, the most incidents belonged to: Outside Fires (40.1%), and Structure Fires (39.3%).
Fire incident types reported to NFIRS in Zip Code 78729
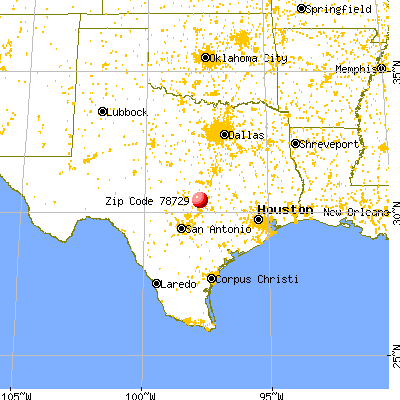


 Nearest zip codes: 78717, 78727, 78759, 78750, 78728, 78681.


 : $193,385,147 in 289 contracts from 1999 to 2006
 Based on the data from the years 2002 - 2018 the average number of fire incidents per year is 66. The highest number of fires - 117 took place in 2011, and the least - 38 in 2017. The data has a growing trend.
 When looking into fire subcategories, the most incidents belonged to: Outside Fires (40.1%), and Structure Fires (39.3%).