Estimated zip code population in 2022: 29,331 Zip code population in 2010: 26,814 Zip code population in 2000: 23,476
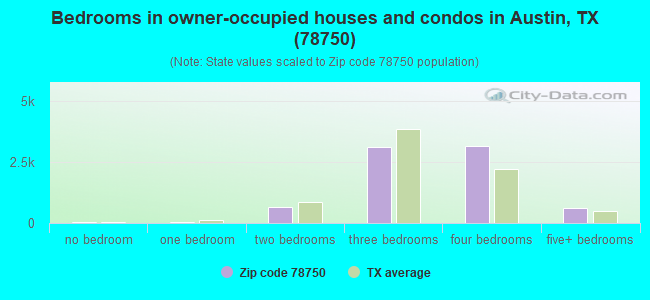
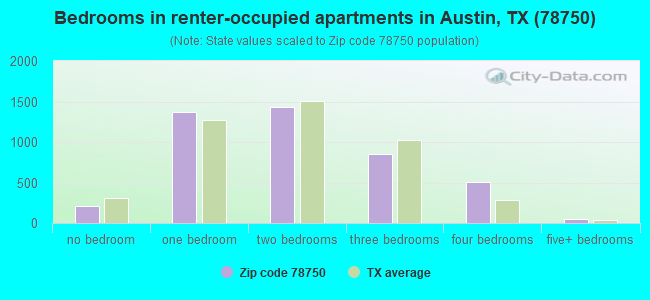
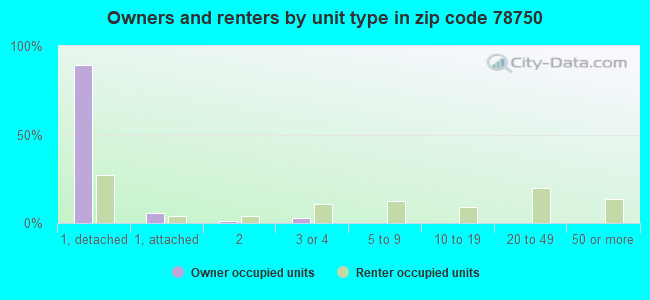
Houses and condos: 12,244 Renter-occupied apartments: 4,437
% of renters here:
37%
State:
38%
March 2022 cost of living index in zip code 78750: 95.3 (near average, U.S. average is 100)
Land area: 13.4 sq. mi. Water area: 0.0 sq. mi.
Population density: 2,188 people per square mile
(low).
OSM Map
General Map
Google Map
MSN Map
OSM Map
General Map
Google Map
MSN Map
OSM Map
General Map
Google Map
MSN Map
OSM Map
General Map
Google Map
MSN Map
Please wait while loading the map...
Real estate property taxes paid for housing units in 2022:
This zip code:
1.5% ($9,248)
Texas:
1.5% ($4,050)
Median real estate property taxes paid for housing units with mortgages in 2022: $9,168 (1.5%) Median real estate property taxes paid for housing units with no mortgage in 2022: $9,693 (1.5%)
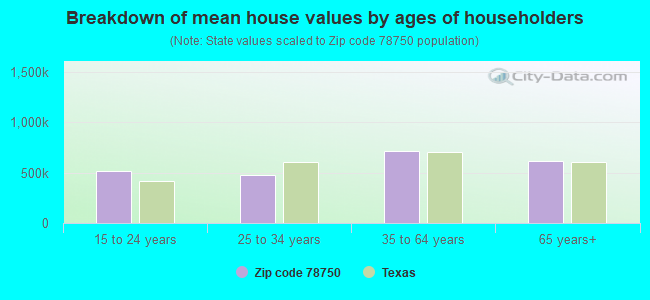
Estimated median house/condo value in 2022: $615,253
78750:
$615,253
Texas:
$275,400
According to our research of Texas and other state lists, there were 27 registered sex offenders living in 78750 zip code as of May 04, 2024. The ratio of all residents to sex offenders in zip code 78750 is 1,127 to 1. The ratio of registered sex offenders to all residents in this zip code is much lower than the state average.
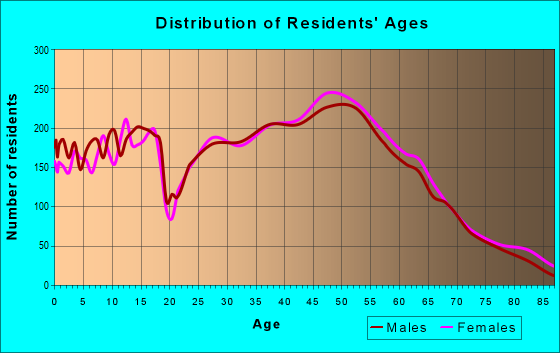
Median resident age:
This zip code:
40.3 years
Texas median age:
35.6 years
Average household size:
This zip code:
2.4 people
Texas:
2.6 people
Averages for the 2020 tax year for zip code 78750, filed in 2021:
Average Adjusted Gross Income (AGI) in 2020: $130,481 (Individual Income Tax Returns)
Here:
$130,481
State:
$77,054
Salary/wage: $108,833 (reported on 82.2% of returns)
Here:
$108,833
State:
$62,766
(% of AGI for various income ranges: 1164.5% for AGIs below $25k, 3704.6% for AGIs $25k-50k, 6509.9% for AGIs $50k-75k, 9713.5% for AGIs $75k-100k, 18808.7% for AGIs $100k-200k, 90675.3% for AGIs over 200k)
Taxable interest for individuals: $2,009 (reported on 42.0% of returns)
This zip code:
$2,009
Texas:
$2,665
(% of AGI for various income ranges: 19.6% for AGIs below $25k, 24.9% for AGIs $25k-50k, 47.1% for AGIs $50k-75k, 105.3% for AGIs $75k-100k, 191.3% for AGIs $100k-200k, 844.1% for AGIs over 200k)
Ordinary dividends: $8,347 (reported on 37.2% of returns)
Here:
$8,347
State:
$10,044
(% of AGI for various income ranges: 51.2% for AGIs below $25k, 62.3% for AGIs $25k-50k, 156.0% for AGIs $50k-75k, 348.3% for AGIs $75k-100k, 734.6% for AGIs $100k-200k, 3236.8% for AGIs over 200k)
Net capital gain/loss in AGI: +$36,692 (reported on 35.9% of returns)
Here:
+$36,692
State:
+$39,590
(% of AGI for various income ranges: 27.6% for AGIs below $25k, 51.9% for AGIs $25k-50k, 177.2% for AGIs $50k-75k, 350.1% for AGIs $75k-100k, 1061.8% for AGIs $100k-200k, 20395.4% for AGIs over 200k)
Profit/loss from business: +$22,229 (reported on 19.5% of returns)
Here:
+$22,229
State:
+$10,888
(% of AGI for various income ranges: 135.4% for AGIs below $25k, 181.2% for AGIs $25k-50k, 317.6% for AGIs $50k-75k, 563.3% for AGIs $75k-100k, 784.2% for AGIs $100k-200k, 4309.4% for AGIs over 200k)
Taxable individual retirement arrangement distribution: $28,960 (reported on 9.9% of returns)
78750:
$28,960
Texas:
$24,740
(% of AGI for various income ranges: 50.7% for AGIs below $25k, 104.6% for AGIs $25k-50k, 230.0% for AGIs $50k-75k, 484.2% for AGIs $75k-100k, 969.2% for AGIs $100k-200k, 2060.1% for AGIs over 200k)
Self-employed (Keogh) retirement plans: $26,806 (reported on 1.3% of returns)
78750:
$26,806
Texas:
$29,298
(% of AGI for various income ranges: 8.9% for AGIs $25k-50k, 44.5% for AGIs $100k-200k, 514.2% for AGIs over 200k)
Total itemized deductions: $33,398 (reported on 13.8% of returns)
Here:
$33,398
State:
$40,428
(% of AGI for various income ranges: 81.1% for AGIs below $25k, 136.6% for AGIs $25k-50k, 300.2% for AGIs $50k-75k, 569.7% for AGIs $75k-100k, 1039.4% for AGIs $100k-200k, 4617.3% for AGIs over 200k)
Charity contributions: $11,572 (reported on 11.2% of returns)
Here:
$11,572
State:
$18,201
(% of AGI for various income ranges: 4.5% for AGIs below $25k, 14.1% for AGIs $25k-50k, 34.0% for AGIs $50k-75k, 85.8% for AGIs $75k-100k, 230.8% for AGIs $100k-200k, 1667.3% for AGIs over 200k)
Taxes paid: $8,913 (reported on 13.6% of returns)
78750:
$8,913
State:
$7,821
(% of AGI for various income ranges: 15.8% for AGIs below $25k, 33.0% for AGIs $25k-50k, 83.4% for AGIs $50k-75k, 174.2% for AGIs $75k-100k, 324.2% for AGIs $100k-200k, 1112.2% for AGIs over 200k)
Earned income credit: $1,801 (reported on 7.9% of returns)
Here:
$1,801
State:
$2,584
(% of AGI for various income ranges: 53.3% for AGIs below $25k, 38.7% for AGIs $25k-50k)
Percentage of individuals using paid preparers for their 2020 taxes: 91.8%
Here:
92%
State:
92%
(% for various income ranges: 90.6% for AGIs below $25k, 92.0% for AGIs $25k-50k, 92.5% for AGIs $50k-75k, 92.2% for AGIs $75k-100k, 90.1% for AGIs $100k-200k, 93.9% for AGIs over 200k)
Averages for the 2012 tax year for zip code 78750, filed in 2013:
Average Adjusted Gross Income (AGI) in 2012: $90,648 (Individual Income Tax Returns)
Here:
$90,648
State:
$65,384
Salary/wage: $76,731 (reported on 85.2% of returns)
Here:
$76,731
State:
$52,524
(% of AGI for various income ranges: 80.8% for AGIs below $25k, 81.6% for AGIs $25k-50k, 74.6% for AGIs $50k-75k, 73.8% for AGIs $75k-100k, 76.4% for AGIs $100k-200k, 65.4% for AGIs over 200k)
Taxable interest for individuals: $1,556 (reported on 43.8% of returns)
This zip code:
$1,556
Texas:
$2,372
(% of AGI for various income ranges: 1.1% for AGIs below $25k, 0.7% for AGIs $25k-50k, 1.0% for AGIs $50k-75k, 0.6% for AGIs $75k-100k, 0.7% for AGIs $100k-200k, 0.8% for AGIs over 200k)
Ordinary dividends: $5,838 (reported on 34.6% of returns)
Here:
$5,838
State:
$9,721
(% of AGI for various income ranges: 3.2% for AGIs below $25k, 1.6% for AGIs $25k-50k, 2.1% for AGIs $50k-75k, 1.8% for AGIs $75k-100k, 2.1% for AGIs $100k-200k, 2.5% for AGIs over 200k)
Net capital gain/loss in AGI: +$13,963 (reported on 29.7% of returns)
Here:
+$13,963
State:
+$35,319
(% of AGI for various income ranges: 0.3% for AGIs below $25k, 0.4% for AGIs $25k-50k, 0.6% for AGIs $50k-75k, 0.7% for AGIs $75k-100k, 1.7% for AGIs $100k-200k, 9.7% for AGIs over 200k)
Profit/loss from business: +$23,344 (reported on 19.1% of returns)
Here:
+$23,344
State:
+$13,732
(% of AGI for various income ranges: 7.4% for AGIs below $25k, 4.8% for AGIs $25k-50k, 4.1% for AGIs $50k-75k, 4.1% for AGIs $75k-100k, 4.3% for AGIs $100k-200k, 5.5% for AGIs over 200k)
Taxable individual retirement arrangement distribution: $22,459 (reported on 11.1% of returns)
78750:
$22,459
Texas:
$19,511
(% of AGI for various income ranges: 2.6% for AGIs below $25k, 2.3% for AGIs $25k-50k, 3.4% for AGIs $50k-75k, 3.5% for AGIs $75k-100k, 3.2% for AGIs $100k-200k, 2.2% for AGIs over 200k)
Self-employment retirement plans: $21,113 (reported on 1.7% of returns)
78750:
$21,113
Texas:
$23,938
(% of AGI for various income ranges: 0.4% for AGIs $50k-75k, 0.4% for AGIs $100k-200k, 0.6% for AGIs over 200k)
Total itemized deductions: $22,967 (15% of AGI, reported on 41.0% of returns)
Here:
$22,967
State:
$24,724
Here:
14.6% of AGI
State:
15.9% of AGI
(% of AGI for various income ranges: 10.2% for AGIs below $25k, 8.7% for AGIs $25k-50k, 12.5% for AGIs $50k-75k, 12.1% for AGIs $75k-100k, 12.6% for AGIs $100k-200k, 8.3% for AGIs over 200k)
Charity contributions: $4,537 (reported on 34.0% of returns)
Here:
$4,537
State:
$6,808
(% of AGI for various income ranges: 0.7% for AGIs below $25k, 0.8% for AGIs $25k-50k, 1.4% for AGIs $50k-75k, 1.6% for AGIs $75k-100k, 1.9% for AGIs $100k-200k, 1.9% for AGIs over 200k)
Taxes paid: $9,015 (reported on 40.6% of returns)
78750:
$9,015
State:
$6,921
(% of AGI for various income ranges: 2.8% for AGIs below $25k, 2.7% for AGIs $25k-50k, 4.2% for AGIs $50k-75k, 4.5% for AGIs $75k-100k, 5.1% for AGIs $100k-200k, 3.4% for AGIs over 200k)
Earned income credit: $1,774 (reported on 9.4% of returns)
Here:
$1,774
State:
$2,570
(% of AGI for various income ranges: 3.6% for AGIs below $25k, 0.7% for AGIs $25k-50k)
Percentage of individuals using paid preparers for their 2012 taxes: 35.5%
Here:
35%
State:
51%
(% for various income ranges: 30.6% for AGIs below $25k, 29.5% for AGIs $25k-50k, 34.7% for AGIs $50k-75k, 34.8% for AGIs $75k-100k, 39.4% for AGIs $100k-200k, 55.1% for AGIs over 200k)
Averages for the 2004 tax year for zip code 78750, filed in 2005:
Average Adjusted Gross Income (AGI) in 2004: $74,689 (Individual Income Tax Returns)
Here:
$74,689
State:
$47,881
Salary/wage: $66,272 (reported on 84.3% of returns)
Here:
$66,272
State:
$41,947
(% of AGI for various income ranges: 301.7% for AGIs below $10k, 77.3% for AGIs $10k-25k, 79.6% for AGIs $25k-50k, 73.8% for AGIs $50k-75k, 75.0% for AGIs $75k-100k, 73.0% for AGIs over 100k)
Taxable interest for individuals: $1,713 (reported on 56.0% of returns)
This zip code:
$1,713
Texas:
$2,255
(% of AGI for various income ranges: 22.6% for AGIs below $10k, 2.8% for AGIs $10k-25k, 1.2% for AGIs $25k-50k, 1.5% for AGIs $50k-75k, 1.3% for AGIs $75k-100k, 1.1% for AGIs over 100k)
Taxable dividends: $3,246 (reported on 40.6% of returns)
Here:
$3,246
State:
$4,261
(% of AGI for various income ranges: 21.9% for AGIs below $10k, 2.0% for AGIs $10k-25k, 1.4% for AGIs $25k-50k, 1.7% for AGIs $50k-75k, 1.6% for AGIs $75k-100k, 1.7% for AGIs over 100k)
Net capital gain/loss: +$11,909 (reported on 35.0% of returns)
Here:
+$11,909
State:
+$16,110
(% of AGI for various income ranges: 22.9% for AGIs below $10k, 0.5% for AGIs $10k-25k, 0.5% for AGIs $25k-50k, 1.2% for AGIs $50k-75k, 0.9% for AGIs $75k-100k, 8.0% for AGIs over 100k)
Profit/loss from business: +$19,028 (reported on 19.3% of returns)
Here:
+$19,028
State:
+$11,013
(% of AGI for various income ranges: 24.1% for AGIs below $10k, 7.2% for AGIs $10k-25k, 4.5% for AGIs $25k-50k, 4.9% for AGIs $50k-75k, 4.3% for AGIs $75k-100k, 4.9% for AGIs over 100k)
IRA payment deduction: $3,301 (reported on 3.7% of returns)
78750:
$3,301
Texas:
$3,120
(% of AGI for various income ranges: 0.2% for AGIs $10k-25k, 0.3% for AGIs $25k-50k, 0.2% for AGIs $50k-75k, 0.2% for AGIs $75k-100k, 0.1% for AGIs over 100k)
Self-employed pension: $15,119 (reported on 2.2% of returns)
Here:
$15,119
Texas:
$16,401
(% of AGI for various income ranges: 0.2% for AGIs $25k-50k, 0.1% for AGIs $50k-75k, 0.2% for AGIs $75k-100k, 0.6% for AGIs over 100k)
Total itemized deductions: $20,777 (18% of AGI, reported on 47.6% of returns)
Here:
$20,777
State:
$19,631
Here:
17.6% of AGI
State:
18.9% of AGI
(% of AGI for various income ranges: 49.6% for AGIs below $10k, 15.5% for AGIs $10k-25k, 15.2% for AGIs $25k-50k, 16.8% for AGIs $50k-75k, 17.3% for AGIs $75k-100k, 11.4% for AGIs over 100k)
Charity contributions deductions: $3,665 (3% of AGI, reported on 41.5% of returns)
Here:
$3,665
State:
$4,753
Here:
3.0% of AGI
State:
4.2% of AGI
(% of AGI for various income ranges: 2.3% for AGIs below $10k, 1.2% for AGIs $10k-25k, 1.6% for AGIs $25k-50k, 2.0% for AGIs $50k-75k, 2.4% for AGIs $75k-100k, 2.1% for AGIs over 100k)
Total tax: $14,507 (reported on 81.3% of returns)
78750:
$14,507
State:
$9,058
(% of AGI for various income ranges: 9.9% for AGIs below $10k, 4.9% for AGIs $10k-25k, 7.8% for AGIs $25k-50k, 10.2% for AGIs $50k-75k, 11.2% for AGIs $75k-100k, 19.3% for AGIs over 100k)
Earned income credit: $1,511 (reported on 7.8% of returns)
Here:
$1,511
State:
$2,024
Percentage of individuals using paid preparers for their 2004 taxes: 38.9%
Here:
39%
State:
57%
(% for various income ranges: 33.4% for AGIs below $10k, 41.1% for AGIs $10k-25k, 37.5% for AGIs $25k-50k, 38.2% for AGIs $50k-75k, 37.1% for AGIs $75k-100k, 43.7% for AGIs over 100k)
Likely homosexual households (counted as self-reported same-sex unmarried-partner households)
Lesbian couples: 0.2% of all households
Gay men: 0.7% of all households
Household received Food Stamps/SNAP in the past 12 months: 300 Household did not receive Food Stamps/SNAP in the past 12 months: 11,684
Women who had a birth in the past 12 months: 285 (180 now married, 104 unmarried) Women who did not have a birth in the past 12 months: 6,713 (3,436 now married, 3,261 unmarried)
Housing units in zip code 78750 with a mortgage: 4,638 (519 second mortgage, 455 both second mortgage and home equity loan) Houses without a mortgage: 89
Median monthly owner costs for units with a mortgage: $2,712 Median monthly owner costs for units without a mortgage: $1,237
Residents with income below the poverty level in 2022:
This zip code:
4.1%
Whole state:
14.0%
Residents with income below 50% of the poverty level in 2022:
This zip code:
1.9%
Whole state:
7.4%
Median number of rooms in houses and condos:
Here:
7.0
State:
6.3
Median number of rooms in apartments:
Here:
4.2
State:
4.0
Notable locations in this zip code not listed on our city pages
Notable locations in zip code 78750: Balcones Country Club (A), Austin Fire Department Station 38 (B), Jollyville Volunteer Fire Department (C), Austin Fire Department Station 44 (D), Austin / Travis County Emergency Medical Service - Medic 19 (E), Williamson County Emergency Medical Services Austin (F). Display/hide their locations on the map
Shopping Centers: Lakeline Shopping Center (1), Anderson Mill Center Shopping Center (2), Lakeline Plaza Shopping Center (3), The Woodland Shopping Center (4). Display/hide their locations on the map
Churches in zip code 78750 include: Saint Vincent de Paul Catholic Church (A), Hallmark Baptist Church (B), Imani Community Church (C), Presbyterian Church of the Hills (D), Hope Presbyterian Church (E), Grace Community Church (F), House of Divine Purpose Ministries (G), Pond Springs Church of Christ (H), Anderson Mill Baptist Church (I). Display/hide their locations on the map
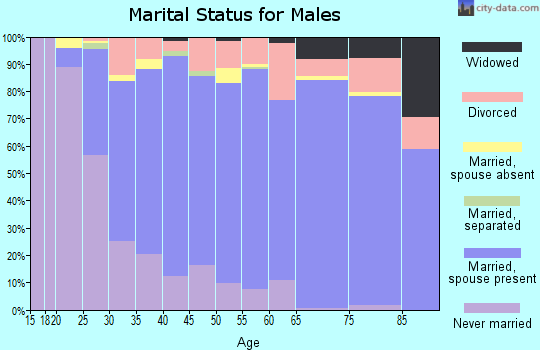
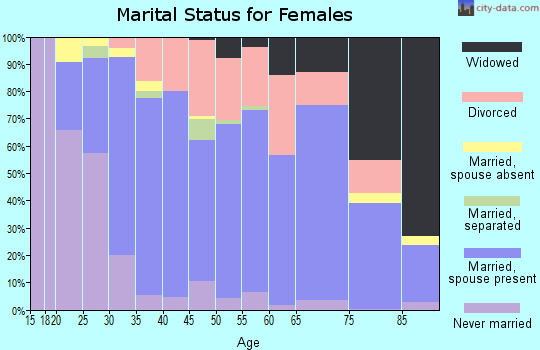
5,356 married couples with children.
652 single-parent households (112 men, 540 women).
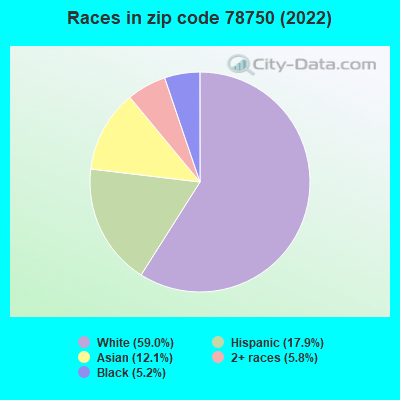
78.7% of residents of 78750 zip code speak English at home.
8.0% of residents speak Spanish at home (91% very well, 9% well).
7.1% of residents speak other Indo-European language at home (81% very well, 16% well, 2% not well, 1% not at all).
6.5% of residents speak Asian or Pacific Island language at home (71% very well, 17% well, 5% not well, 6% not at all).
0.2% of residents speak other language at home (100% very well).
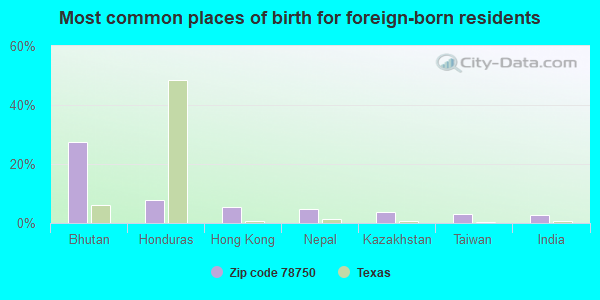
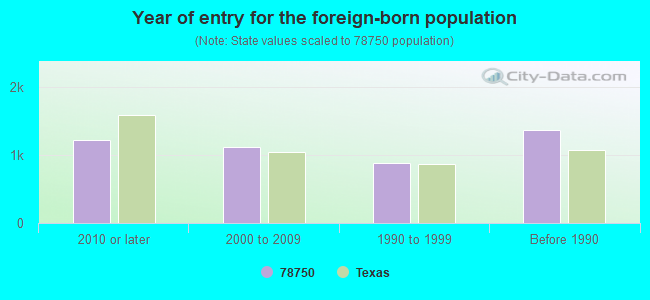
Foreign born population: 4,261 (14.5%) (69.0% of them are naturalized citizens)
Facilities with environmental interests located in this zip code:
AJC AUSTIN (8340 FATHOM CIR STE 701 in AUSTIN, TX)
(Resource Conservation and Recovery Act (tracking hazardous waste))
ANDERSON MILL MUD WWTP (1700' SW INTX USHWY 183/FM 620 in AUSTIN, TX)
National Pollutant Discharge Elimination System MAJOR (Tracking pollutant discharge elimination systems) - permit Business SIC classification: SEWERAGE SYSTEMS
ANTHEATER CO INC (12110 GREY ROCK LANE in AUSTIN, TX)
COMPLIANCE ACTIVITY (Tracking inspections of insecticide, fungicide, and rodenticide, and toxic substances)
Housing units lacking complete plumbing facilities: 0.3% Housing units lacking complete kitchen facilities: 0.3%
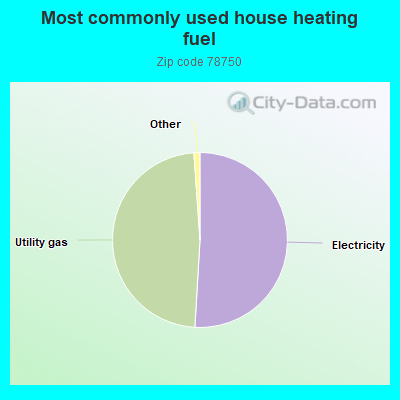
51.0%Electricity
48.0%Utility gas
0.6%No fuel used
0.5%Bottled, tank, or LP gas
Population in 1990: 8,867. Population change in the 1990s: +14,609 (+164.8%).
Place of birth for U.S.-born residents:
This state: 15,147
Northeast: 1,676
Midwest: 2,733
South: 2,522
West: 2,660
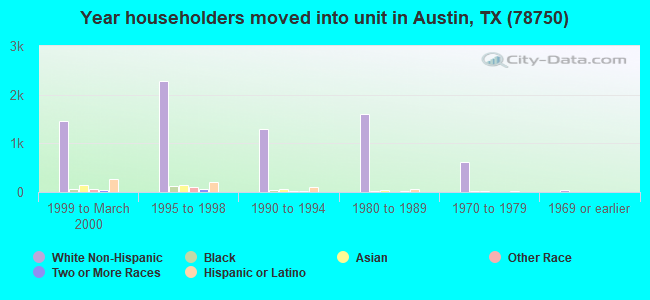
48% of the 78750 zip code residents lived in the same house 5 years ago. Out of people who lived in different houses, 33% lived in this county. Out of people who lived in different counties, 50% lived in Texas.
85% of the 78750 zip code residents lived in the same house 1 year ago. Out of people who lived in different houses, 43% moved from this county. Out of people who lived in different houses, 31% moved from different county within same state. Out of people who lived in different houses, 20% moved from different state. Out of people who lived in different houses, 8% moved from abroad.
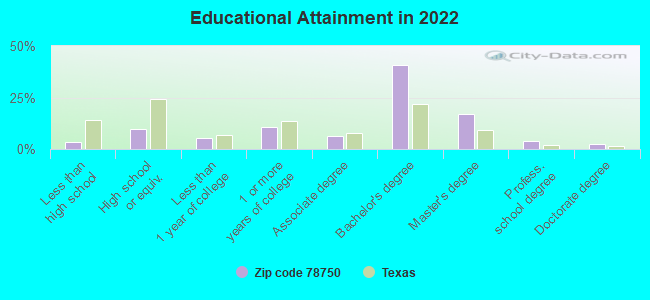
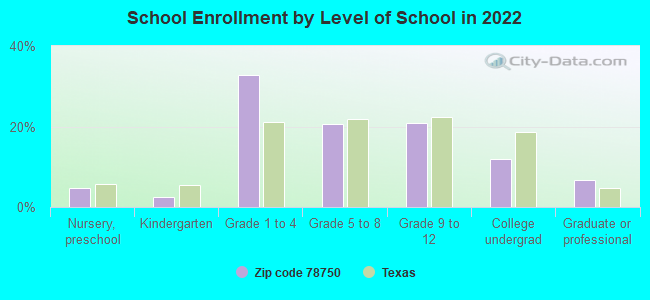
Private vs. public school enrollment:
Students in private schools in grades 1 to 8 (elementary and middle school): 293
Here:
8.0%
Texas:
8.8%
Students in private schools in grades 9 to 12 (high school): 114
Here:
8.0%
Texas:
8.0%
Students in private undergraduate colleges: 41
Here:
5.1%
Texas:
16.2%
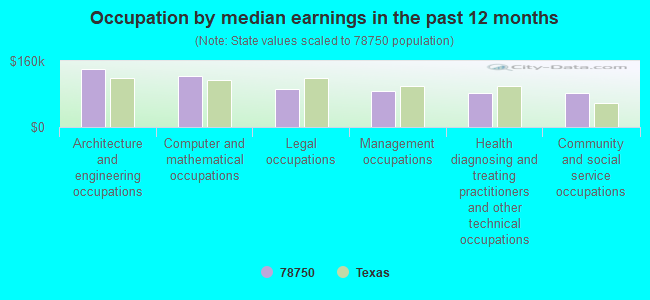
Occupation by median earnings in the past 12 months ($)
140,311Architecture and engineering occupations
124,373Computer and mathematical occupations
92,929Legal occupations
86,266Management occupations
82,881Health diagnosing and treating practitioners and other technical occupations
82,548Community and social service occupations
Companies with federal contracts located in this zip code (AUSTIN, TX):
INFOEDGE TECHNOLOGY, INC (9101 BURNET RD; small business) : $62,065,942 in 244 contractsfrom 1999 to 2006
Contracts for Legal Services, ADP Optical Scanning Services, ADP Data Conversion Services, Program Management/Support Services, and moreby Navy, Air Force, Bureau of Reclamation, Offices, Boards and Divisions (includes Attorney General, Deputy Attorney General, etc.), and others Signed by year:2000: $13,638,025; 2001: $6,112,166; 2002: $14,332,611; 2003: $9,240,439; 2004: $9,599,185; 2005: $8,227,260; 2006: $61,615.
Biggest contracts:
$7,049,037 with Navy for Legal Services. Signed on 2002-09-16. Completion date: 2003-09-30.
$2,979,028, same as above.Signed on 2000-11-15. Completion date: 2001-12-15.
$1,864,795, same as above.Signed on 2000-05-04. Completion date: 2000-09-30.
$1,775,746, same as above.Signed on 2002-04-12. Completion date: 2002-08-02.
GLOBAL INFORMATION TECHNOLOGIE (13740 RESEARCH BLVD , BLDG; small business) : $67,726 in 11 contractsfrom 2003 to 2006
Contracts for Telephone and Telegraph Equipment, Communications Security Equipment and Components, Other Cryptologic Equipment and Components, Cable, Cord, and Wire Assemblies: Communications Equipment, and moreby Army, Navy, U.S. Army Corps of Engineers - civil program financing only, Bureau of Prisoners/Federal Prison System, and others Signed by year:2000: $0; 2001: $0; 2002: $0; 2003: $18,550; 2004: $4,018; 2005: $42,652; 2006: $2,506.
Biggest contracts:
$20,100 with Army for Telephone and Telegraph Equipment. Signed on 2005-03-11. Completion date: 2005-03-18.
$12,065 with Navy for Communications Security Equipment and Components. Signed on 2005-05-05. Completion date: 2005-05-15.
$9,275 with U.S. Army Corps of Engineers - civil program financing only for Other Cryptologic Equipment and Components. Taking place in PA. Signed on 2003-12-31. Completion date: 2003-12-24.
$9,275 with Army for Other Cryptologic Equipment and Components. Taking place in PA. Signed on 2003-12-31. Completion date: 2003-12-24.
THE FAMOUS CONSTRUCTION CORPOR (13809 RESEARCH BLVD, SUITE; small business) : $46,695 in 5 contractsfrom 1999 to 2000
Contracts for Maintenance, Repair or Alteration of Real Property -- Other Industrial Buildings, Construction of Structures and Facilities -- Fuel Supply Facilities, Maintenance, Repair or Alteration of Real Property -- Office Buildings, Construction of Structures and Facilities -- Laboratories and Clinics by Navy, Army Signed by year:2000: $29,236; 2001: $0; 2002: $0; 2003: $0; 2004: $0; 2005: $0; 2006: $0.
Biggest contracts:
$22,690 with Navy for Maintenance, Repair or Alteration of Real Property -- Other Industrial Buildings. Taking place in IN. Signed on 2000-09-29. Completion date: 1999-07-12.
$17,459 with Navy for Construction of Structures and Facilities -- Fuel Supply Facilities. Taking place in NC. Signed on 1999-10-12. Completion date: 1999-11-16.
$4,046 with Navy for Maintenance, Repair or Alteration of Real Property -- Office Buildings. Taking place in WV. Signed on 2000-02-17. Completion date: 1999-08-16.
$3,500 with Army for Construction of Structures and Facilities -- Laboratories and Clinics. Taking place in AL. Signed on 2000-02-14. Completion date: 2000-02-14.
REED ENGENEERING (12233 RANCH RD; small business) 12 employees, $640000 revenue. : $40,000 in 2 contractsin 2002
$32,000 with Offices, Boards and Divisions (includes Attorney General, Deputy Attorney General, etc.) for Expert Witness. Taking place in AZ. Signed on 2002-01-15. Completion date: 2002-09-15.
$8,000, same as above.Signed on 2002-02-15. Completion date: 2002-09-15.
ERNEST B ANGUIANO (13740 HIGHWAY 183 NORTH K7; small business)
$8,945 with Army for Miscellaneous Special Industry Machinery. Signed on 2002-06-17. Completion date: 2002-07-09.
PROTELLIGENT INC (13740 N HIGHWAY 183; small business)
$8,750 with Army for ADP Software. Signed on 2004-09-16. Completion date: 2004-09-30.
PAUL, R A & ASSOCIATES INC (12335 HYMEADOW DRIVE STE 2; small business)
$2,500 with Army for Other Architect and Engineering Services. Signed on 2005-09-21. Completion date: 2005-10-28.
PRO CONTROLS CORPORATION (13809 RES BLVD STE 904; small business)
-$100 with Navy for Maintenance, Repair or Alteration of Real Property -- Miscellaneous Buildings. Taking place in TN. Signed on 2002-04-04. Completion date: 1997-05-05.
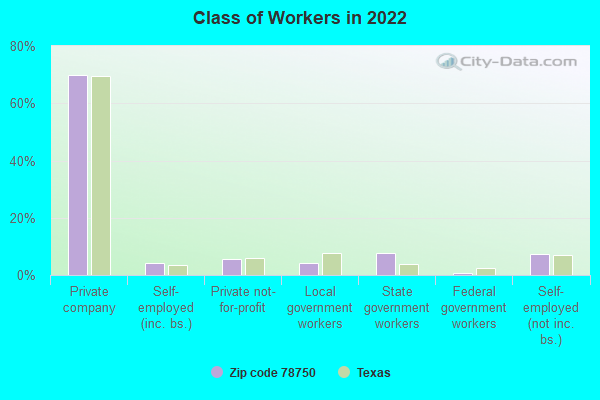
Top industries in this zip code by the number of employees in 2005:
2002 - 2018 National Fire Incident Reporting System (NFIRS) incidents
Based on the data from the years 2002 - 2018 the average number of fires per year is 42. The highest number of fire incidents - 91 took place in 2009, and the least - 8 in 2017. The data has a dropping trend.
When looking into fire subcategories, the most incidents belonged to: Structure Fires (46.1%), and Outside Fires (34.1%).
Fire incident types reported to NFIRS in Zip Code 78750
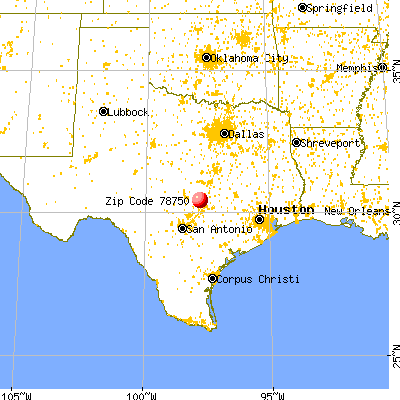


 Nearest zip codes: 78726, 78759, 78730, 78729, 78731, 78727.
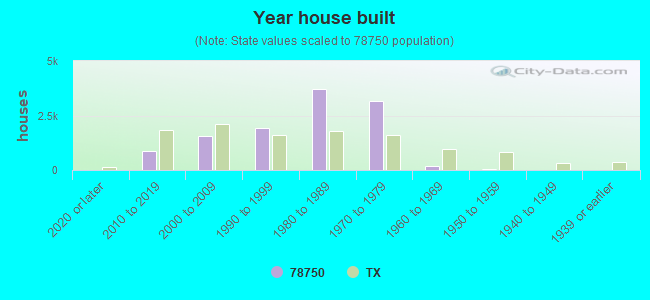


 Based on the data from the years 2002 - 2018 the average number of fires per year is 42. The highest number of fire incidents - 91 took place in 2009, and the least - 8 in 2017. The data has a dropping trend.
 When looking into fire subcategories, the most incidents belonged to: Structure Fires (46.1%), and Outside Fires (34.1%).