Estimated zip code population in 2022: 10,008 Zip code population in 2010: 7,955 Zip code population in 2000: 4,885
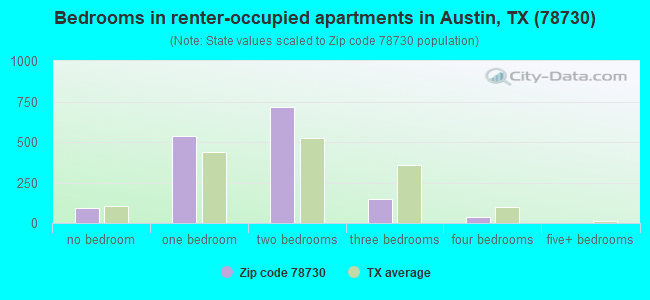
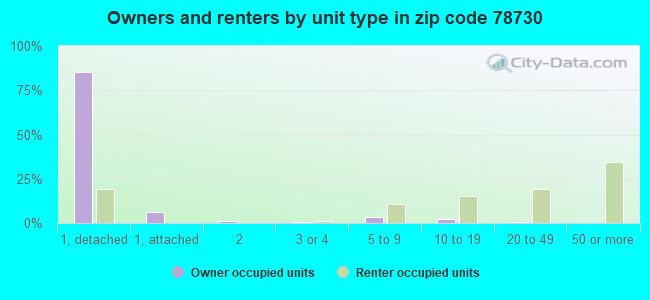
Houses and condos: 4,616 Renter-occupied apartments: 1,537
% of renters here:
35%
State:
38%
March 2022 cost of living index in zip code 78730: 97.1 (near average, U.S. average is 100)
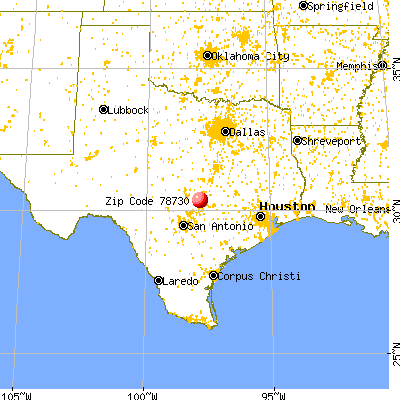
Land area: 14.4 sq. mi. Water area: 0.5 sq. mi.
Population density: 696 people per square mile
(low).
OSM Map
General Map
Google Map
MSN Map
OSM Map
General Map
Google Map
MSN Map
OSM Map
General Map
Google Map
MSN Map
OSM Map
General Map
Google Map
MSN Map
Please wait while loading the map...
Real estate property taxes paid for housing units in 2022:
This zip code:
1.0% ($10,460)
Texas:
1.5% ($4,050)
Median real estate property taxes paid for housing units with mortgages in 2022: $10,505 (1.0%) Median real estate property taxes paid for housing units with no mortgage in 2022: $10,700 (1.0%)
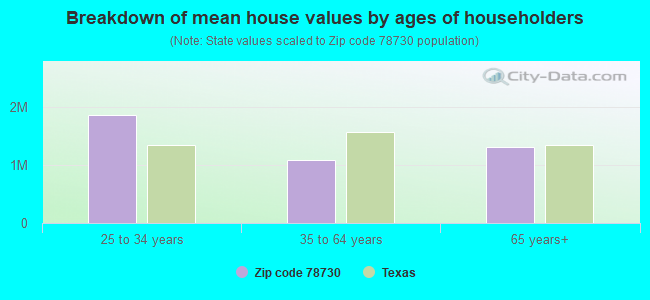
Estimated median house/condo value in 2022: $1,075,564
78730:
$1,075,564
Texas:
$275,400
According to our research of Texas and other state lists, there were 3 registered sex offenders living in 78730 zip code as of April 27, 2024. The ratio of all residents to sex offenders in zip code 78730 is 3,056 to 1. The ratio of registered sex offenders to all residents in this zip code is much lower than the state average.
Median resident age:
This zip code:
44.9 years
Texas median age:
35.6 years
Average household size:
This zip code:
2.3 people
Texas:
2.6 people
Averages for the 2020 tax year for zip code 78730, filed in 2021:
Average Adjusted Gross Income (AGI) in 2020: $322,262 (Individual Income Tax Returns)
Here:
$322,262
State:
$77,054
Salary/wage: $218,835 (reported on 81.5% of returns)
Here:
$218,835
State:
$62,766
(% of AGI for various income ranges: 1145.4% for AGIs below $25k, 3840.8% for AGIs $25k-50k, 7237.4% for AGIs $50k-75k, 10286.5% for AGIs $75k-100k, 19476.9% for AGIs $100k-200k, 182598.1% for AGIs over 200k)
Taxable interest for individuals: $8,914 (reported on 50.3% of returns)
This zip code:
$8,914
Texas:
$2,665
(% of AGI for various income ranges: 38.9% for AGIs below $25k, 34.1% for AGIs $25k-50k, 82.4% for AGIs $50k-75k, 228.2% for AGIs $75k-100k, 408.0% for AGIs $100k-200k, 4844.6% for AGIs over 200k)
Ordinary dividends: $22,085 (reported on 49.2% of returns)
Here:
$22,085
State:
$10,044
(% of AGI for various income ranges: 67.3% for AGIs below $25k, 133.1% for AGIs $25k-50k, 203.8% for AGIs $50k-75k, 602.4% for AGIs $75k-100k, 1343.7% for AGIs $100k-200k, 11349.7% for AGIs over 200k)
Net capital gain/loss in AGI: +$126,619 (reported on 48.8% of returns)
Here:
+$126,619
State:
+$39,590
(% of AGI for various income ranges: 88.9% for AGIs below $25k, 93.9% for AGIs $25k-50k, 254.7% for AGIs $50k-75k, 649.4% for AGIs $75k-100k, 1466.6% for AGIs $100k-200k, 73787.8% for AGIs over 200k)
Profit/loss from business: +$35,099 (reported on 22.4% of returns)
Here:
+$35,099
State:
+$10,888
(% of AGI for various income ranges: 155.5% for AGIs below $25k, 347.5% for AGIs $25k-50k, 291.8% for AGIs $50k-75k, 380.0% for AGIs $75k-100k, 1379.1% for AGIs $100k-200k, 7214.3% for AGIs over 200k)
Taxable individual retirement arrangement distribution: $50,764 (reported on 10.3% of returns)
78730:
$50,764
Texas:
$24,740
(% of AGI for various income ranges: 67.3% for AGIs below $25k, 103.9% for AGIs $25k-50k, 198.5% for AGIs $50k-75k, 714.7% for AGIs $75k-100k, 1326.0% for AGIs $100k-200k, 4438.1% for AGIs over 200k)
Self-employed (Keogh) retirement plans: $31,836 (reported on 2.4% of returns)
78730:
$31,836
Texas:
$29,298
(% of AGI for various income ranges: 946.5% for AGIs over 200k)
Total itemized deductions: $44,268 (reported on 25.7% of returns)
Here:
$44,268
State:
$40,428
(% of AGI for various income ranges: 355.7% for AGIs $25k-50k, 302.1% for AGIs $50k-75k, 649.4% for AGIs $75k-100k, 1901.7% for AGIs $100k-200k, 11133.2% for AGIs over 200k)
Charity contributions: $15,146 (reported on 22.4% of returns)
Here:
$15,146
State:
$18,201
(% of AGI for various income ranges: 24.5% for AGIs $25k-50k, 62.9% for AGIs $50k-75k, 50.0% for AGIs $75k-100k, 355.7% for AGIs $100k-200k, 3724.3% for AGIs over 200k)
Taxes paid: $9,283 (reported on 25.7% of returns)
78730:
$9,283
State:
$7,821
(% of AGI for various income ranges: 23.8% for AGIs below $25k, 57.3% for AGIs $25k-50k, 87.6% for AGIs $50k-75k, 181.2% for AGIs $75k-100k, 520.6% for AGIs $100k-200k, 2164.3% for AGIs over 200k)
Earned income credit: $1,347 (reported on 4.2% of returns)
Here:
$1,347
State:
$2,584
(% of AGI for various income ranges: 30.5% for AGIs below $25k, 16.7% for AGIs $25k-50k)
Percentage of individuals using paid preparers for their 2020 taxes: 92.3%
Here:
92%
State:
92%
(% for various income ranges: 89.4% for AGIs below $25k, 94.1% for AGIs $25k-50k, 94.1% for AGIs $50k-75k, 89.7% for AGIs $75k-100k, 91.7% for AGIs $100k-200k, 93.3% for AGIs over 200k)
Averages for the 2012 tax year for zip code 78730, filed in 2013:
Average Adjusted Gross Income (AGI) in 2012: $243,044 (Individual Income Tax Returns)
Here:
$243,044
State:
$65,384
Salary/wage: $160,882 (reported on 83.2% of returns)
Here:
$160,882
State:
$52,524
(% of AGI for various income ranges: 73.6% for AGIs below $25k, 84.4% for AGIs $25k-50k, 79.1% for AGIs $50k-75k, 74.1% for AGIs $75k-100k, 69.6% for AGIs $100k-200k, 50.4% for AGIs over 200k)
Taxable interest for individuals: $4,983 (reported on 55.5% of returns)
This zip code:
$4,983
Texas:
$2,372
(% of AGI for various income ranges: 2.4% for AGIs below $25k, 1.1% for AGIs $25k-50k, 0.6% for AGIs $50k-75k, 0.9% for AGIs $75k-100k, 1.2% for AGIs $100k-200k, 1.1% for AGIs over 200k)
Ordinary dividends: $15,281 (reported on 48.3% of returns)
Here:
$15,281
State:
$9,721
(% of AGI for various income ranges: 6.4% for AGIs below $25k, 2.6% for AGIs $25k-50k, 3.0% for AGIs $50k-75k, 3.5% for AGIs $75k-100k, 3.6% for AGIs $100k-200k, 2.9% for AGIs over 200k)
Net capital gain/loss in AGI: +$104,631 (reported on 46.8% of returns)
Here:
+$104,631
State:
+$35,319
(% of AGI for various income ranges: 1.9% for AGIs below $25k, 1.1% for AGIs $25k-50k, 0.9% for AGIs $50k-75k, 1.5% for AGIs $75k-100k, 2.8% for AGIs $100k-200k, 24.8% for AGIs over 200k)
Profit/loss from business: +$32,713 (reported on 21.9% of returns)
Here:
+$32,713
State:
+$13,732
(% of AGI for various income ranges: 8.7% for AGIs below $25k, 3.7% for AGIs $25k-50k, 4.5% for AGIs $50k-75k, 6.8% for AGIs $75k-100k, 5.0% for AGIs $100k-200k, 2.4% for AGIs over 200k)
Taxable individual retirement arrangement distribution: $37,429 (reported on 13.2% of returns)
78730:
$37,429
Texas:
$19,511
(% of AGI for various income ranges: 4.2% for AGIs below $25k, 2.8% for AGIs $25k-50k, 3.9% for AGIs $50k-75k, 3.6% for AGIs $75k-100k, 5.0% for AGIs $100k-200k, 1.4% for AGIs over 200k)
Self-employment retirement plans: $23,160 (reported on 2.5% of returns)
78730:
$23,160
Texas:
$23,938
Total itemized deductions: $40,499 (10% of AGI, reported on 56.0% of returns)
Here:
$40,499
State:
$24,724
Here:
10.4% of AGI
State:
15.9% of AGI
(% of AGI for various income ranges: 17.2% for AGIs below $25k, 14.5% for AGIs $25k-50k, 13.6% for AGIs $50k-75k, 15.6% for AGIs $75k-100k, 16.7% for AGIs $100k-200k, 7.6% for AGIs over 200k)
Charity contributions: $8,583 (reported on 49.1% of returns)
Here:
$8,583
State:
$6,808
(% of AGI for various income ranges: 1.0% for AGIs below $25k, 1.3% for AGIs $25k-50k, 1.2% for AGIs $50k-75k, 2.0% for AGIs $75k-100k, 2.1% for AGIs $100k-200k, 1.7% for AGIs over 200k)
Taxes paid: $16,162 (reported on 55.2% of returns)
78730:
$16,162
State:
$6,921
(% of AGI for various income ranges: 4.9% for AGIs below $25k, 4.2% for AGIs $25k-50k, 4.8% for AGIs $50k-75k, 5.7% for AGIs $75k-100k, 6.8% for AGIs $100k-200k, 3.1% for AGIs over 200k)
Earned income credit: $1,038 (reported on 4.1% of returns)
Here:
$1,038
State:
$2,570
(% of AGI for various income ranges: 1.5% for AGIs below $25k, 0.2% for AGIs $25k-50k)
Percentage of individuals using paid preparers for their 2012 taxes: 46.8%
Here:
47%
State:
51%
(% for various income ranges: 34.7% for AGIs below $25k, 31.0% for AGIs $25k-50k, 33.3% for AGIs $50k-75k, 43.3% for AGIs $75k-100k, 50.0% for AGIs $100k-200k, 67.3% for AGIs over 200k)
Averages for the 2004 tax year for zip code 78730, filed in 2005:
Average Adjusted Gross Income (AGI) in 2004: $151,666 (Individual Income Tax Returns)
Here:
$151,666
State:
$47,881
Salary/wage: $125,477 (reported on 84.7% of returns)
Here:
$125,477
State:
$41,947
(% of AGI for various income ranges: 82.6% for AGIs $10k-25k, 84.0% for AGIs $25k-50k, 75.8% for AGIs $50k-75k, 67.2% for AGIs $75k-100k, 68.0% for AGIs over 100k)
Taxable interest for individuals: $4,432 (reported on 61.3% of returns)
This zip code:
$4,432
Texas:
$2,255
(% of AGI for various income ranges: 1.9% for AGIs $10k-25k, 1.6% for AGIs $25k-50k, 2.1% for AGIs $50k-75k, 2.9% for AGIs $75k-100k, 1.7% for AGIs over 100k)
Taxable dividends: $7,187 (reported on 52.3% of returns)
Here:
$7,187
State:
$4,261
(% of AGI for various income ranges: 1.7% for AGIs $10k-25k, 2.1% for AGIs $25k-50k, 3.5% for AGIs $50k-75k, 4.3% for AGIs $75k-100k, 2.3% for AGIs over 100k)
Net capital gain/loss: +$29,675 (reported on 53.0% of returns)
Here:
+$29,675
State:
+$16,110
(% of AGI for various income ranges: 1.0% for AGIs $10k-25k, 0.7% for AGIs $25k-50k, 2.3% for AGIs $50k-75k, 1.5% for AGIs $75k-100k, 11.5% for AGIs over 100k)
Profit/loss from business: +$31,204 (reported on 21.8% of returns)
Here:
+$31,204
State:
+$11,013
(% of AGI for various income ranges: 7.0% for AGIs $10k-25k, 5.5% for AGIs $25k-50k, 4.2% for AGIs $50k-75k, 7.5% for AGIs $75k-100k, 4.2% for AGIs over 100k)
IRA payment deduction: $3,740 (reported on 4.1% of returns)
78730:
$3,740
Texas:
$3,120
(% of AGI for various income ranges: 0.4% for AGIs $25k-50k, 0.4% for AGIs $50k-75k, 0.3% for AGIs $75k-100k, 0.1% for AGIs over 100k)
Self-employed pension: $20,510 (reported on 3.5% of returns)
Here:
$20,510
Texas:
$16,401
Total itemized deductions: $36,131 (16% of AGI, reported on 54.6% of returns)
Here:
$36,131
State:
$19,631
Here:
15.8% of AGI
State:
18.9% of AGI
(% of AGI for various income ranges: 15.2% for AGIs $10k-25k, 12.3% for AGIs $25k-50k, 16.9% for AGIs $50k-75k, 24.7% for AGIs $75k-100k, 12.1% for AGIs over 100k)
Charity contributions deductions: $6,237 (3% of AGI, reported on 50.3% of returns)
Here:
$6,237
State:
$4,753
Here:
2.6% of AGI
State:
4.2% of AGI
(% of AGI for various income ranges: 1.0% for AGIs $10k-25k, 1.1% for AGIs $25k-50k, 1.6% for AGIs $50k-75k, 2.5% for AGIs $75k-100k, 2.1% for AGIs over 100k)
Total tax: $35,562 (reported on 88.5% of returns)
78730:
$35,562
State:
$9,058
(% of AGI for various income ranges: 6.0% for AGIs $10k-25k, 10.3% for AGIs $25k-50k, 11.5% for AGIs $50k-75k, 11.2% for AGIs $75k-100k, 22.0% for AGIs over 100k)
Earned income credit: $1,069 (reported on 2.9% of returns)
Here:
$1,069
State:
$2,024
Percentage of individuals using paid preparers for their 2004 taxes: 46.4%
Here:
46%
State:
57%
(% for various income ranges: 45.1% for AGIs below $10k, 37.7% for AGIs $10k-25k, 32.2% for AGIs $25k-50k, 34.6% for AGIs $50k-75k, 45.8% for AGIs $75k-100k, 56.7% for AGIs over 100k)
Household received Food Stamps/SNAP in the past 12 months: 0 Household did not receive Food Stamps/SNAP in the past 12 months: 4,359
Women who had a birth in the past 12 months: 100 (102 now married, 0 unmarried) Women who did not have a birth in the past 12 months: 2,268 (1,406 now married, 849 unmarried)
Housing units in zip code 78730 with a mortgage: 1,954 (194 second mortgage, 19 home equity loan, 172 both second mortgage and home equity loan) Houses without a mortgage: 27
Median monthly owner costs for units with a mortgage: $3,982 Median monthly owner costs for units without a mortgage: $1,537
Residents with income below the poverty level in 2022:
This zip code:
4.4%
Whole state:
14.0%
Residents with income below 50% of the poverty level in 2022:
This zip code:
1.0%
Whole state:
7.4%
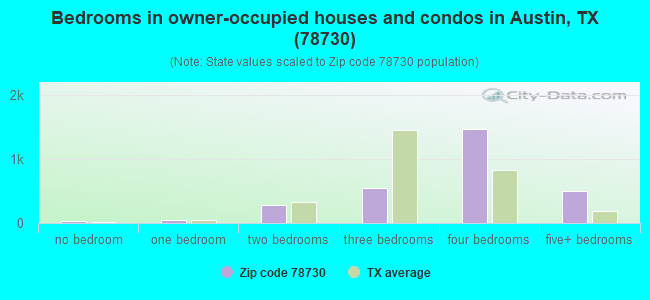
Median number of rooms in houses and condos:
Here:
8.4
State:
6.3
Median number of rooms in apartments:
Here:
3.4
State:
4.0
Notable locations in this zip code not listed on our city pages
Notable locations in zip code 78730: Travis County Fire Control Emergency Services District 4 Station 7 (A), Travis County Fire Control Emergency Services District 4 Station 6 (B). Display/hide their locations on the map
Churches in zip code 78730 include: Texas Interfaith Disaster Response Christian Church (A), Armenian Church of Austin (B), Austin Christian Fellowship Church (C), Austin Christina Fellowship (D). Display/hide their locations on the map
Size of family households: 1,405 2-persons, 626 3-persons, 807 4-persons, 79 5-persons, 48 6-persons
Size of nonfamily households: 1,193 1-person, 229 2-persons
1,974 married couples with children.
133 single-parent households (81 men, 52 women).
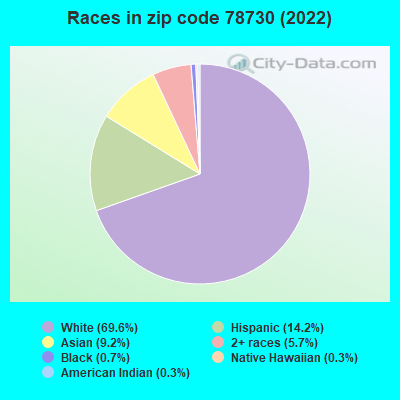
84.3% of residents of 78730 zip code speak English at home.
6.5% of residents speak Spanish at home (77% very well, 18% well, 5% not well).
5.8% of residents speak other Indo-European language at home (88% very well, 8% well, 4% not well).
3.4% of residents speak Asian or Pacific Island language at home (73% very well, 14% well, 14% not well).
0.8% of residents speak other language at home (27% very well, 73% well).
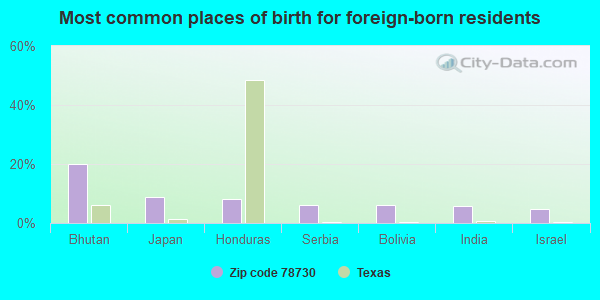
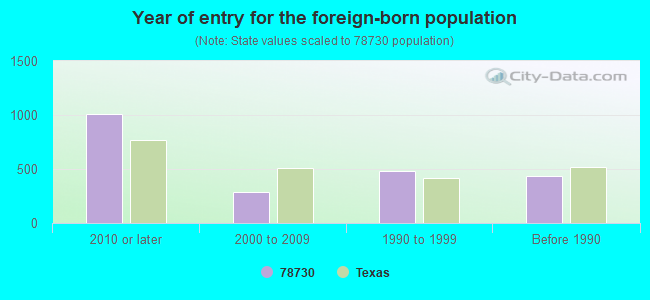
Foreign born population: 1,739 (17.4%) (52.8% of them are naturalized citizens)
Facilities with environmental interests located in this zip code:
2222 SERVICE CENTER (11111 RANCH ROAD 2222 in AUSTIN, TX)
(Resource Conservation and Recovery Act (tracking hazardous waste))
Housing units lacking complete plumbing facilities: 0.3%
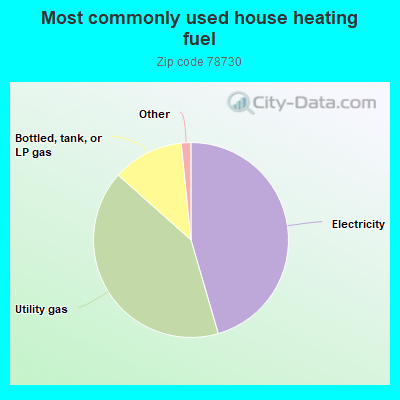
45.5%Electricity
41.1%Utility gas
11.8%Bottled, tank, or LP gas
0.9%Fuel oil, kerosene, etc.
0.7%Wood
Population in 1990: 1,021. Population change in the 1990s: +3,864 (+378.5%).
Place of birth for U.S.-born residents:
This state: 3,534
Northeast: 946
Midwest: 1,121
South: 1,062
West: 1,282
36% of the 78730 zip code residents lived in the same house 5 years ago. Out of people who lived in different houses, 28% lived in this county. Out of people who lived in different counties, 50% lived in Texas.
86% of the 78730 zip code residents lived in the same house 1 year ago. Out of people who lived in different houses, 56% moved from this county. Out of people who lived in different houses, 15% moved from different county within same state. Out of people who lived in different houses, 24% moved from different state. Out of people who lived in different houses, 5% moved from abroad.
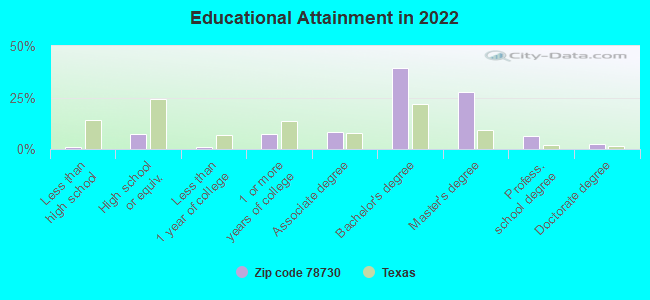
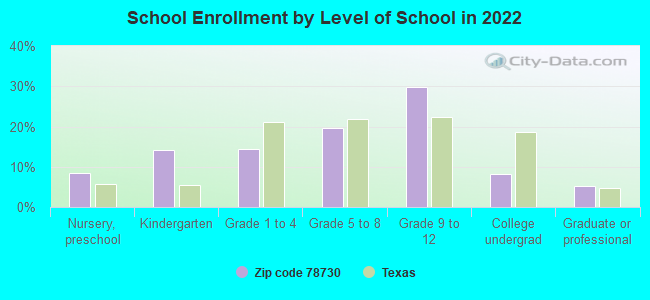
Private vs. public school enrollment:
Students in private schools in grades 1 to 8 (elementary and middle school): 129
Here:
16.6%
Texas:
8.8%
Students in private schools in grades 9 to 12 (high school): 126
Here:
18.7%
Texas:
8.0%
Students in private undergraduate colleges: 34
Here:
18.9%
Texas:
16.2%
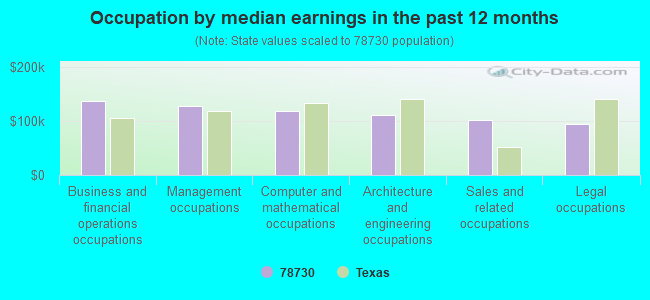
Occupation by median earnings in the past 12 months ($)
136,668Business and financial operations occupations
127,589Management occupations
118,316Computer and mathematical occupations
111,886Architecture and engineering occupations
102,638Sales and related occupations
95,363Legal occupations
Companies with federal contracts located in this zip code (AUSTIN, TX):
POST, BUCKLEY, SCHUH & JERNIGA (PBS&J) : $5,807,104 in 121 contractsfrom 1999 to 2006
Contracts for Environmental Studies and Assessments, Historical Studies, Air Quality Analyses, Other Special Studies and Analyses, and moreby U.S. Army Corps of Engineers - civil program financing only, Army, Minerals Management Service Signed by year:2000: $829,224; 2001: $1,142,485; 2002: $267,987; 2003: $189,196; 2004: $658,527; 2005: $2,081,059; 2006: $549,316.
Biggest contracts:
$260,348 with U.S. Army Corps of Engineers - civil program financing only for Environmental Studies and Assessments. Signed on 2005-03-24. Completion date: 2005-09-30.
$260,348 with Army for Environmental Studies and Assessments. Signed on 2005-03-24. Completion date: 2005-09-30.
$190,478 with U.S. Army Corps of Engineers - civil program financing only for Historical Studies. Signed on 2001-05-14. Completion date: 2001-05-14.
$155,373 with Army for Environmental Studies and Assessments. Signed on 2005-11-03. Completion date: 2006-04-27.
MOTION COMPUTING, INC (8601 RR 2222; small business) : $114,544 in 15 contractsfrom 2003 to 2006
Contracts for Other ADP and Telecommunications Services (includes data storage on tapes, compact disks, etc.), ADP Input/Output and Storage Devices, ADP Central Processing Unit (CPU, Computer), Digital, , and moreby Department of Defense, Army, NASA, National Institutes of Health, and others Signed by year:2000: $0; 2001: $0; 2002: $0; 2003: $2,525; 2004: $44,030; 2005: $47,824; 2006: $20,165.
Biggest contracts:
$21,033 with Department of Defense for Other ADP and Telecommunications Services (includes data storage on tapes, compact disks, etc.). Taking place in DC. Signed on 2005-09-15. Completion date: 2005-11-15.
$13,118 with Army for ADP Input/Output and Storage Devices. Signed on 2004-02-12. Completion date: 2004-03-15.
$10,544 with Army for ADP Central Processing Unit (CPU, Computer), Digital. Signed on 2005-03-09. Completion date: 2005-04-15.
$8,591 with NASA for . Signed on 2006-07-20. Completion date: 2006-08-11.
CORETRACE CORPORATION (6808 W COURTYARD DR)
$78,666 with Air Force for Engineering and Technical Services. Signed on 2005-09-12. Completion date: 2006-09-11.
NOVUSEDGE, INC (5918 WEST COURTYARD DRIVE; small business) : $39,547 in 4 contractsfrom 2003 to 2005
$18,501 with Army for ADP Components. Signed on 2005-03-29. Completion date: 2005-06-29.
$7,587 with Army for ADP Backup and Security Services. Signed on 2005-12-19. Completion date: 2006-12-31.
$7,015, same as above.Signed on 2004-11-10. Completion date: 2005-12-31.
$6,444 with Army for ADPE System Configuration. Signed on 2003-12-22. Completion date: 2004-12-31.
COVI TECHNOLOGIES INC (6300 BRIDGEPOINT PKWY, STE; small business)
$5,263 with Navy for Cameras, Still Picture. Signed on 2005-06-29. Completion date: 2005-07-08.
LONERGAN, GAEL (9008 BELL MOUNTAIN DR; small business)
$5,000 with Navy for Expert Witness. Taking place in HI. Signed on 2005-07-08. Completion date: 2005-07-29.
Top industries in this zip code by the number of employees in 2005:
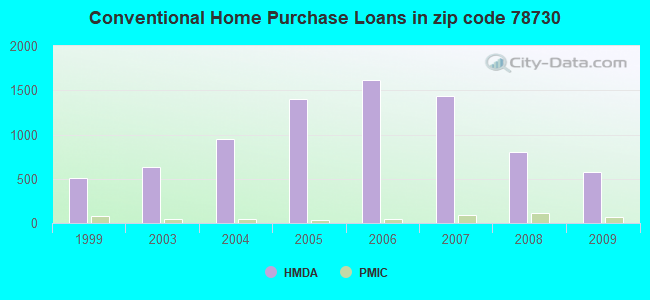
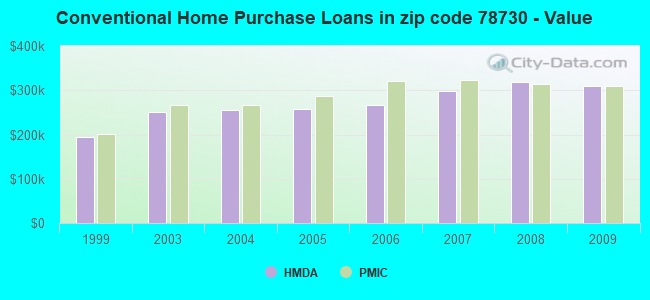
Detailed PMIC statistics for the following Tracts:0017.60
, 0017.61
2002 - 2018 National Fire Incident Reporting System (NFIRS) incidents
Based on the data from the years 2002 - 2018 the average number of fire incidents per year is 10. The highest number of fires - 27 took place in 2014, and the least - 2 in 2017. The data has a growing trend.
When looking into fire subcategories, the most incidents belonged to: Outside Fires (42.2%), and Structure Fires (27.7%).
Fire incident types reported to NFIRS in Zip Code 78730


 Nearest zip codes: 78750, 78732, 78726, 78733, 78731, 78746.
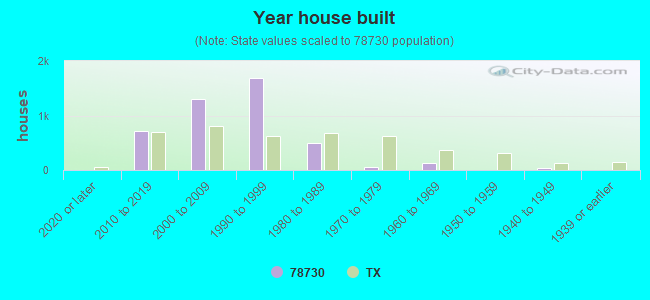


 Based on the data from the years 2002 - 2018 the average number of fire incidents per year is 10. The highest number of fires - 27 took place in 2014, and the least - 2 in 2017. The data has a growing trend.
 When looking into fire subcategories, the most incidents belonged to: Outside Fires (42.2%), and Structure Fires (27.7%).