Estimated zip code population in 2022: 29,090 Zip code population in 2010: 26,928 Zip code population in 2000: 26,023
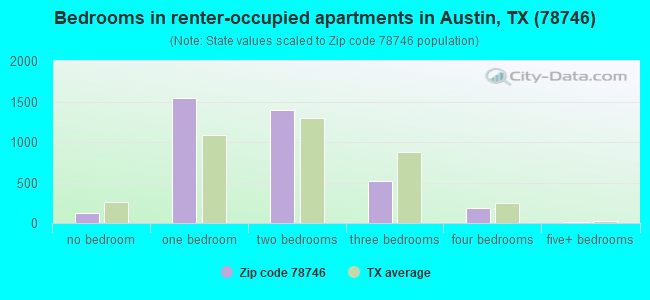
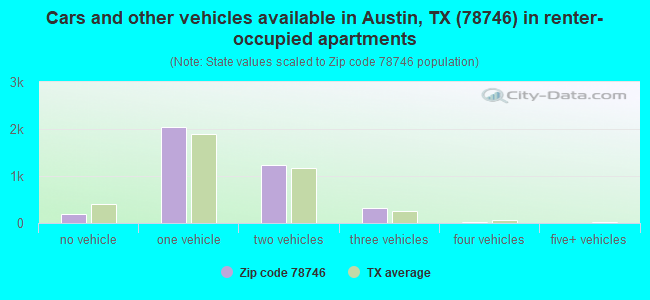
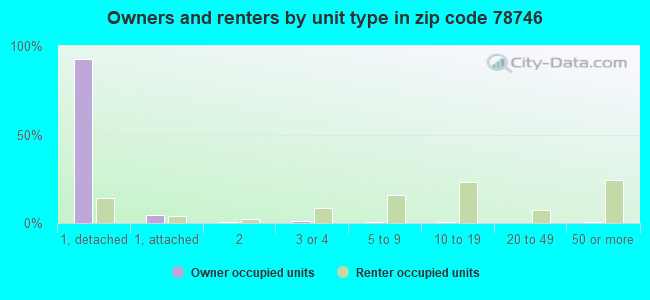
Houses and condos: 12,197 Renter-occupied apartments: 3,820
% of renters here:
33%
State:
38%
March 2022 cost of living index in zip code 78746: 98.7 (near average, U.S. average is 100)
Land area: 22.5 sq. mi. Water area: 0.9 sq. mi.
Population density: 1,293 people per square mile
(low).
OSM Map
General Map
Google Map
MSN Map
OSM Map
General Map
Google Map
MSN Map
OSM Map
General Map
Google Map
MSN Map
OSM Map
General Map
Google Map
MSN Map
Please wait while loading the map...
Real estate property taxes paid for housing units in 2022:
This zip code:
0.7% ($10,460)
Texas:
1.5% ($4,050)
Median real estate property taxes paid for housing units with mortgages in 2022: $10,505 (0.8%) Median real estate property taxes paid for housing units with no mortgage in 2022: $10,700 (0.7%)
Estimated median house/condo value in 2022: $1,399,333
78746:
$1,399,333
Texas:
$275,400
According to our research of Texas and other state lists, there were 3 registered sex offenders living in 78746 zip code as of April 27, 2024. The ratio of all residents to sex offenders in zip code 78746 is 9,457 to 1. The ratio of registered sex offenders to all residents in this zip code is much lower than the state average.
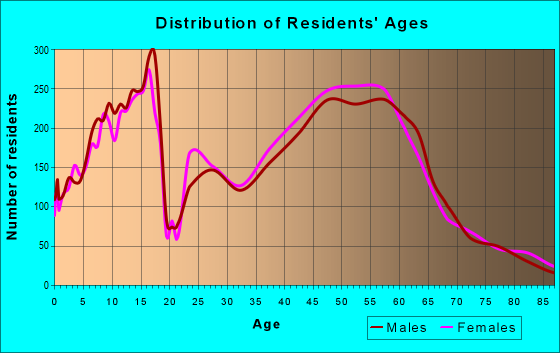
Median resident age:
This zip code:
42.6 years
Texas median age:
35.6 years
Average household size:
This zip code:
2.5 people
Texas:
2.6 people
Averages for the 2020 tax year for zip code 78746, filed in 2021:
Average Adjusted Gross Income (AGI) in 2020: $715,372 (Individual Income Tax Returns)
Here:
$715,372
State:
$77,054
Salary/wage: $314,537 (reported on 72.9% of returns)
Here:
$314,537
State:
$62,766
(% of AGI for various income ranges: 1262.0% for AGIs below $25k, 3845.4% for AGIs $25k-50k, 7013.8% for AGIs $50k-75k, 10498.1% for AGIs $75k-100k, 17625.9% for AGIs $100k-200k, 238956.7% for AGIs over 200k)
Taxable interest for individuals: $19,187 (reported on 62.0% of returns)
This zip code:
$19,187
Texas:
$2,665
(% of AGI for various income ranges: 74.6% for AGIs below $25k, 133.5% for AGIs $25k-50k, 173.9% for AGIs $50k-75k, 253.3% for AGIs $75k-100k, 618.2% for AGIs $100k-200k, 12940.2% for AGIs over 200k)
Ordinary dividends: $52,089 (reported on 59.1% of returns)
Here:
$52,089
State:
$10,044
(% of AGI for various income ranges: 194.8% for AGIs below $25k, 320.0% for AGIs $25k-50k, 464.7% for AGIs $50k-75k, 940.4% for AGIs $75k-100k, 2255.9% for AGIs $100k-200k, 32818.8% for AGIs over 200k)
Net capital gain/loss in AGI: +$524,896 (reported on 58.3% of returns)
Here:
+$524,896
State:
+$39,590
(% of AGI for various income ranges: 158.9% for AGIs below $25k, 347.1% for AGIs $25k-50k, 342.1% for AGIs $50k-75k, 854.2% for AGIs $75k-100k, 2430.0% for AGIs $100k-200k, 353602.8% for AGIs over 200k)
Profit/loss from business: +$61,864 (reported on 28.0% of returns)
Here:
+$61,864
State:
+$10,888
(% of AGI for various income ranges: 225.5% for AGIs below $25k, 525.8% for AGIs $25k-50k, 481.3% for AGIs $50k-75k, 854.2% for AGIs $75k-100k, 2777.2% for AGIs $100k-200k, 16528.5% for AGIs over 200k)
Taxable individual retirement arrangement distribution: $49,019 (reported on 11.7% of returns)
78746:
$49,019
Texas:
$24,740
(% of AGI for various income ranges: 62.9% for AGIs below $25k, 155.5% for AGIs $25k-50k, 278.6% for AGIs $50k-75k, 832.9% for AGIs $75k-100k, 1758.9% for AGIs $100k-200k, 4506.3% for AGIs over 200k)
Self-employed (Keogh) retirement plans: $38,269 (reported on 5.9% of returns)
78746:
$38,269
Texas:
$29,298
(% of AGI for various income ranges: 87.2% for AGIs $50k-75k, 217.8% for AGIs $100k-200k, 2390.9% for AGIs over 200k)
Total itemized deductions: $113,954 (reported on 33.4% of returns)
Here:
$113,954
State:
$40,428
(% of AGI for various income ranges: 228.3% for AGIs below $25k, 454.0% for AGIs $25k-50k, 645.5% for AGIs $50k-75k, 1160.0% for AGIs $75k-100k, 2522.6% for AGIs $100k-200k, 40747.9% for AGIs over 200k)
Charity contributions: $74,972 (reported on 29.6% of returns)
Here:
$74,972
State:
$18,201
(% of AGI for various income ranges: 12.3% for AGIs below $25k, 34.3% for AGIs $25k-50k, 80.5% for AGIs $50k-75k, 186.5% for AGIs $75k-100k, 533.8% for AGIs $100k-200k, 25222.0% for AGIs over 200k)
Taxes paid: $9,459 (reported on 33.3% of returns)
78746:
$9,459
State:
$7,821
(% of AGI for various income ranges: 51.4% for AGIs below $25k, 85.1% for AGIs $25k-50k, 147.9% for AGIs $50k-75k, 284.2% for AGIs $75k-100k, 614.6% for AGIs $100k-200k, 2814.2% for AGIs over 200k)
Earned income credit: $1,302 (reported on 3.4% of returns)
Here:
$1,302
State:
$2,584
(% of AGI for various income ranges: 36.3% for AGIs below $25k, 16.8% for AGIs $25k-50k)
Percentage of individuals using paid preparers for their 2020 taxes: 91.5%
Here:
91%
State:
92%
(% for various income ranges: 90.1% for AGIs below $25k, 90.3% for AGIs $25k-50k, 92.7% for AGIs $50k-75k, 90.0% for AGIs $75k-100k, 90.7% for AGIs $100k-200k, 92.8% for AGIs over 200k)
Averages for the 2012 tax year for zip code 78746, filed in 2013:
Average Adjusted Gross Income (AGI) in 2012: $412,333 (Individual Income Tax Returns)
Here:
$412,333
State:
$65,384
Salary/wage: $173,133 (reported on 75.7% of returns)
Here:
$173,133
State:
$52,524
(% of AGI for various income ranges: 68.1% for AGIs below $25k, 72.7% for AGIs $25k-50k, 65.0% for AGIs $50k-75k, 58.8% for AGIs $75k-100k, 61.4% for AGIs $100k-200k, 27.9% for AGIs over 200k)
Taxable interest for individuals: $17,783 (reported on 61.3% of returns)
This zip code:
$17,783
Texas:
$2,372
(% of AGI for various income ranges: 2.6% for AGIs below $25k, 2.1% for AGIs $25k-50k, 2.0% for AGIs $50k-75k, 2.3% for AGIs $75k-100k, 1.9% for AGIs $100k-200k, 2.7% for AGIs over 200k)
Ordinary dividends: $32,656 (reported on 54.3% of returns)
Here:
$32,656
State:
$9,721
(% of AGI for various income ranges: 12.0% for AGIs below $25k, 4.8% for AGIs $25k-50k, 5.5% for AGIs $50k-75k, 5.2% for AGIs $75k-100k, 4.6% for AGIs $100k-200k, 4.2% for AGIs over 200k)
Net capital gain/loss in AGI: +$261,102 (reported on 51.9% of returns)
Here:
+$261,102
State:
+$35,319
(% of AGI for various income ranges: 3.3% for AGIs below $25k, 2.3% for AGIs $25k-50k, 2.5% for AGIs $50k-75k, 3.6% for AGIs $75k-100k, 3.8% for AGIs $100k-200k, 36.5% for AGIs over 200k)
Profit/loss from business: +$58,996 (reported on 27.1% of returns)
Here:
+$58,996
State:
+$13,732
(% of AGI for various income ranges: 11.2% for AGIs below $25k, 5.8% for AGIs $25k-50k, 7.2% for AGIs $50k-75k, 6.4% for AGIs $75k-100k, 9.4% for AGIs $100k-200k, 3.3% for AGIs over 200k)
Taxable individual retirement arrangement distribution: $42,946 (reported on 13.3% of returns)
78746:
$42,946
Texas:
$19,511
(% of AGI for various income ranges: 3.6% for AGIs below $25k, 2.4% for AGIs $25k-50k, 3.1% for AGIs $50k-75k, 4.3% for AGIs $75k-100k, 3.8% for AGIs $100k-200k, 1.1% for AGIs over 200k)
Self-employment retirement plans: $32,915 (reported on 5.6% of returns)
78746:
$32,915
Texas:
$23,938
(% of AGI for various income ranges: 1.0% for AGIs $50k-75k, 0.8% for AGIs $100k-200k, 0.4% for AGIs over 200k)
Total itemized deductions: $89,618 (13% of AGI, reported on 54.7% of returns)
Here:
$89,618
State:
$24,724
Here:
12.6% of AGI
State:
15.9% of AGI
(% of AGI for various income ranges: 24.4% for AGIs below $25k, 13.3% for AGIs $25k-50k, 15.8% for AGIs $50k-75k, 17.8% for AGIs $75k-100k, 17.3% for AGIs $100k-200k, 11.2% for AGIs over 200k)
Charity contributions: $25,132 (reported on 48.5% of returns)
Here:
$25,132
State:
$6,808
(% of AGI for various income ranges: 1.2% for AGIs below $25k, 1.2% for AGIs $25k-50k, 1.5% for AGIs $50k-75k, 2.0% for AGIs $75k-100k, 2.4% for AGIs $100k-200k, 3.1% for AGIs over 200k)
Taxes paid: $21,939 (reported on 54.1% of returns)
78746:
$21,939
State:
$6,921
(% of AGI for various income ranges: 6.3% for AGIs below $25k, 4.2% for AGIs $25k-50k, 5.7% for AGIs $50k-75k, 6.1% for AGIs $75k-100k, 6.8% for AGIs $100k-200k, 2.5% for AGIs over 200k)
Earned income credit: $1,050 (reported on 3.9% of returns)
Here:
$1,050
State:
$2,570
(% of AGI for various income ranges: 1.4% for AGIs below $25k, 0.2% for AGIs $25k-50k)
Percentage of individuals using paid preparers for their 2012 taxes: 56.8%
Here:
57%
State:
51%
(% for various income ranges: 45.7% for AGIs below $25k, 40.9% for AGIs $25k-50k, 46.8% for AGIs $50k-75k, 54.1% for AGIs $75k-100k, 58.4% for AGIs $100k-200k, 75.5% for AGIs over 200k)
Averages for the 2004 tax year for zip code 78746, filed in 2005:
Average Adjusted Gross Income (AGI) in 2004: $204,047 (Individual Income Tax Returns)
Here:
$204,047
State:
$47,881
Salary/wage: $133,728 (reported on 74.0% of returns)
Here:
$133,728
State:
$41,947
(% of AGI for various income ranges: 69.7% for AGIs $10k-25k, 70.1% for AGIs $25k-50k, 59.8% for AGIs $50k-75k, 62.0% for AGIs $75k-100k, 45.7% for AGIs over 100k)
Taxable interest for individuals: $9,689 (reported on 68.4% of returns)
This zip code:
$9,689
Texas:
$2,255
(% of AGI for various income ranges: 5.4% for AGIs $10k-25k, 3.2% for AGIs $25k-50k, 3.6% for AGIs $50k-75k, 4.1% for AGIs $75k-100k, 3.0% for AGIs over 100k)
Taxable dividends: $12,029 (reported on 59.8% of returns)
Here:
$12,029
State:
$4,261
(% of AGI for various income ranges: 6.8% for AGIs $10k-25k, 4.3% for AGIs $25k-50k, 4.9% for AGIs $50k-75k, 4.8% for AGIs $75k-100k, 3.2% for AGIs over 100k)
Net capital gain/loss: +$97,280 (reported on 56.0% of returns)
Here:
+$97,280
State:
+$16,110
(% of AGI for various income ranges: 4.0% for AGIs $10k-25k, 2.0% for AGIs $25k-50k, 2.9% for AGIs $50k-75k, 3.8% for AGIs $75k-100k, 28.5% for AGIs over 100k)
Profit/loss from business: +$41,462 (reported on 26.7% of returns)
Here:
+$41,462
State:
+$11,013
(% of AGI for various income ranges: 7.5% for AGIs $10k-25k, 7.7% for AGIs $25k-50k, 7.3% for AGIs $50k-75k, 10.0% for AGIs $75k-100k, 5.1% for AGIs over 100k)
IRA payment deduction: $3,687 (reported on 3.5% of returns)
78746:
$3,687
Texas:
$3,120
(% of AGI for various income ranges: 0.3% for AGIs $10k-25k, 0.4% for AGIs $25k-50k, 0.3% for AGIs $50k-75k, 0.3% for AGIs $75k-100k, 0.0% for AGIs over 100k)
Self-employed pension: $24,174 (reported on 6.4% of returns)
Here:
$24,174
Texas:
$16,401
(% of AGI for various income ranges: 0.3% for AGIs $25k-50k, 0.5% for AGIs $50k-75k, 1.1% for AGIs $75k-100k, 0.8% for AGIs over 100k)
Total itemized deductions: $45,690 (14% of AGI, reported on 53.2% of returns)
Here:
$45,690
State:
$19,631
Here:
14.0% of AGI
State:
18.9% of AGI
(% of AGI for various income ranges: 27.3% for AGIs $10k-25k, 19.0% for AGIs $25k-50k, 22.0% for AGIs $50k-75k, 21.6% for AGIs $75k-100k, 10.7% for AGIs over 100k)
Charity contributions deductions: $16,263 (5% of AGI, reported on 48.0% of returns)
Here:
$16,263
State:
$4,753
Here:
4.7% of AGI
State:
4.2% of AGI
(% of AGI for various income ranges: 1.7% for AGIs $10k-25k, 1.8% for AGIs $25k-50k, 2.4% for AGIs $50k-75k, 2.6% for AGIs $75k-100k, 3.9% for AGIs over 100k)
Total tax: $53,812 (reported on 82.4% of returns)
78746:
$53,812
State:
$9,058
(% of AGI for various income ranges: 6.1% for AGIs $10k-25k, 9.1% for AGIs $25k-50k, 10.9% for AGIs $50k-75k, 11.8% for AGIs $75k-100k, 22.5% for AGIs over 100k)
Earned income credit: $1,071 (reported on 3.1% of returns)
Here:
$1,071
State:
$2,024
Percentage of individuals using paid preparers for their 2004 taxes: 56.6%
Here:
57%
State:
57%
(% for various income ranges: 52.1% for AGIs below $10k, 45.7% for AGIs $10k-25k, 44.3% for AGIs $25k-50k, 53.5% for AGIs $50k-75k, 56.1% for AGIs $75k-100k, 67.2% for AGIs over 100k)
Likely homosexual households (counted as self-reported same-sex unmarried-partner households)
Lesbian couples: 0.1% of all households
Gay men: 0.6% of all households
Household received Food Stamps/SNAP in the past 12 months: 70 Household did not receive Food Stamps/SNAP in the past 12 months: 11,391
Women who had a birth in the past 12 months: 196 (190 now married, 8 unmarried) Women who did not have a birth in the past 12 months: 6,890 (3,174 now married, 3,710 unmarried)
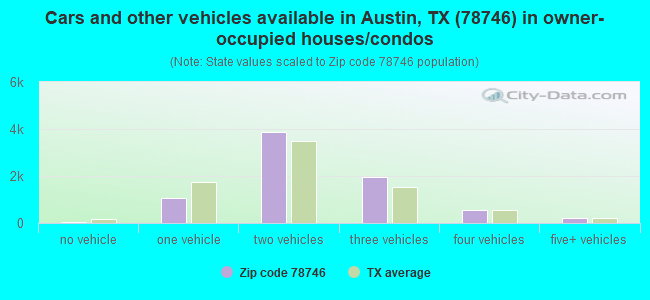
Housing units in zip code 78746 with a mortgage: 4,299 (376 second mortgage, 279 both second mortgage and home equity loan) Houses without a mortgage: 244
Median monthly owner costs for units with a mortgage: $3,982 Median monthly owner costs for units without a mortgage: $1,537
Residents with income below the poverty level in 2022:
This zip code:
5.0%
Whole state:
14.0%
Residents with income below 50% of the poverty level in 2022:
This zip code:
1.4%
Whole state:
7.4%
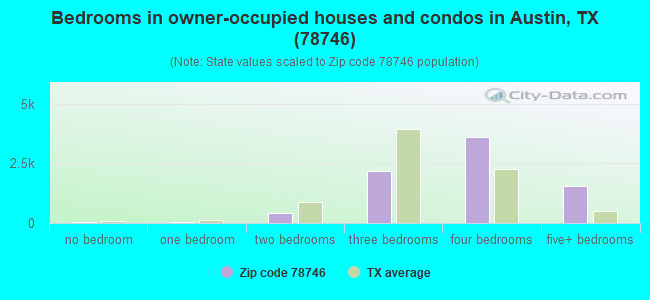
Median number of rooms in houses and condos:
Here:
8.2
State:
6.3
Median number of rooms in apartments:
Here:
3.7
State:
4.0
Notable locations in this zip code not listed on our city pages
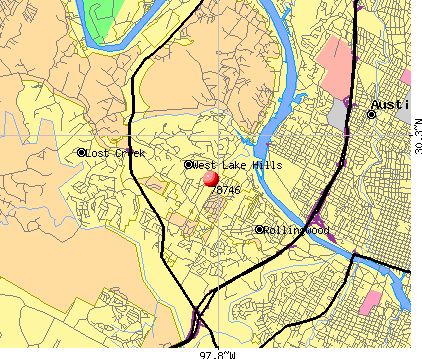
Notable locations in zip code 78746: Zilker Park Historic District (A), Austin Fire Department Station 32 (B), Westbank Community Library (C), Eanes History Center (D), Austin Nature and Science Center (E), Travis County Emergency Services District 9 Station 2 Westlake (F), Travis County Emergency Services District 9 Station 1 (G), Austin / Travis County Emergency Medical Service - Medic 21 (H). Display/hide their locations on the map
Shopping Centers: Barton Creek Square Shopping Center (1), The Village at Westlake Shopping Center (2), West Bank Market Shopping Center (3), West Woods Shopping Center (4). Display/hide their locations on the map
Churches in zip code 78746 include: Park Hills Baptist Church (A), Shepherd of the Hills Lutheran Church (B), Johnson Institute (C), Saint Michael's Episcopal Church (D), Capital Vineyard Church (E), Cathedral of Praise (F), Church of Conscious Harmony (G), Faith Partners Church (H), Westlake United Methodist Church (I). Display/hide their locations on the map
Parks in zip code 78746 include: Zilker Park (1), Wild Basin Wilderness Park (2), Westlake Stadium (3), Saint Stephens Episcopal School Football Stadium (4), Saint Stephens Episcopal School Baseball Field (5), Gus Fruh Park (6), Bee Caves Preserve (7). Display/hide their locations on the map
Tourist attraction (not listed on the city page) : Austin City - Children- Learning Centers- Zilker Botanical Gardens- Parks- Recrea (Cultural Attractions- Events- & Facilities; 2220 Barton Springs Road) (1). Display/hide its approximate location on the map
5,777 married couples with children.
1,068 single-parent households (160 men, 908 women).
84.8% of residents of 78746 zip code speak English at home.
6.2% of residents speak Spanish at home (86% very well, 8% well, 6% not well).
6.0% of residents speak other Indo-European language at home (95% very well, 4% well, 1% not well).
3.3% of residents speak Asian or Pacific Island language at home (78% very well, 16% well, 6% not well).
0.3% of residents speak other language at home (100% very well).
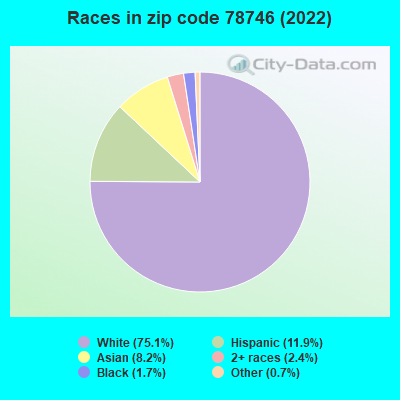
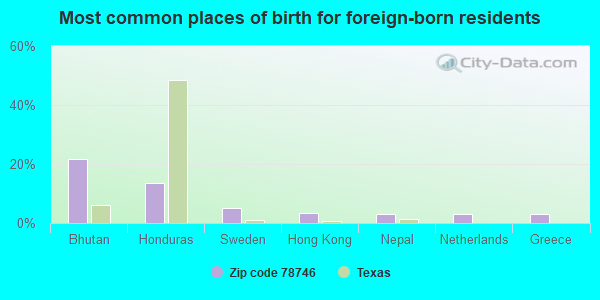
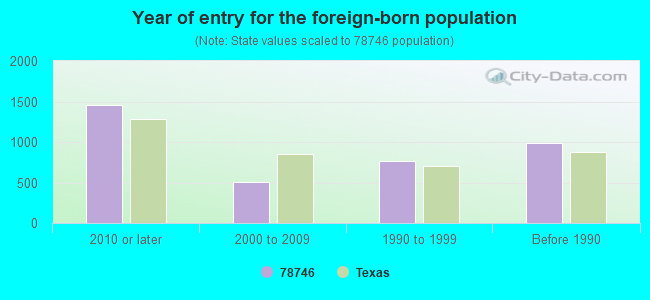
Foreign born population: 3,212 (11.0%) (65.2% of them are naturalized citizens)
Facilities with environmental interests located in this zip code:
AUSTIN COMMERCIAL, INC. (1601 SOUTH MOPAC in AUSTIN, TX)
(Integrated Compliance Information System) - ICIS-06-2001-0097, FORMAL ENFORCEMENT ACTION, ICIS-06-2002-1727, National Pollutant Discharge Elimination System NON-MAJOR (Tracking pollutant discharge elimination systems) - permit National Pollutant Discharge Elimination System NON-MAJOR (Tracking pollutant discharge elimination systems) - permit Business SIC classification: GENERAL CONTRACTORS-NONRESIDENTIAL BUILDINGS, OTHER THAN INDUSTRIAL BUILDINGS AND WAREHOUSES Alternative names: 11 BARTON SKYWAY, II BARTON SKYWAY CONSTR SITE, PRENTISS PROPERTIES, INC
BARTON OAKS - PHASE II & III (3815 S. CAPITOL OF TEXAS HWY. in AUSTIN, TX)
National Pollutant Discharge Elimination System NON-MAJOR (Tracking pollutant discharge elimination systems) - permit National Pollutant Discharge Elimination System NON-MAJOR (Tracking pollutant discharge elimination systems) - permit Business SIC classification: GENERAL CONTRACTORS-SINGLE-FAMILY HOUSES Alternative names: BROWNING CONSTRUCTION COMPANY, TRAMMELL CROW COMPANY
ALBERTSONS 4049 (701 CAPITAL OF TEXAS HWY BLDG C in WEST LAKE HILLS, TX)
(Resource Conservation and Recovery Act (tracking hazardous waste)) Organizations: QUALEX (CONTACT/OPERATOR)
Alternative names: ALBERTSONS NO 4049
AUSTIN TESTING ENGINEERS (2600 DELLANA LN in AUSTIN, TX)
(Resource Conservation and Recovery Act (tracking hazardous waste)) Alternative names: AUSTIN TESTING ENGRS
AUSTIN, CITY OF (PWS) (8660 WEST HIGHWAY 71 in AUSTIN, TX)
National Pollutant Discharge Elimination System NON-MAJOR (Tracking pollutant discharge elimination systems) - permit Alternative names: CITY OF AUSTIN - PWS
ALEXANDER CONSULTING ENGINEERS INC (3823 BEE CAVE RD in AUSTIN, TX)
TRANSPORTER (Resource Conservation and Recovery Act (tracking hazardous waste)) - notification Alternative names: PROFESSIONAL DESIGN GROUP (PDG)
Housing units lacking complete plumbing facilities: 0.3% Housing units lacking complete kitchen facilities: 1.5%
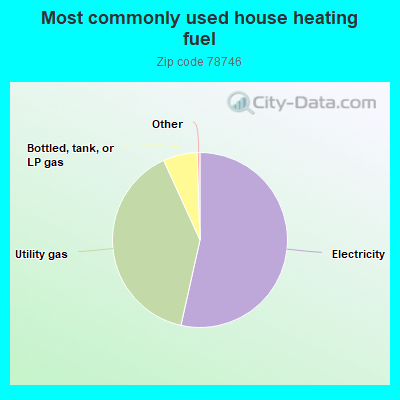
53.5%Electricity
39.7%Utility gas
6.3%Bottled, tank, or LP gas
Population in 1990: 18,855. Population change in the 1990s: +7,168 (+38.0%).
Place of birth for U.S.-born residents:
This state: 13,802
Northeast: 2,537
Midwest: 3,080
South: 2,909
West: 3,245
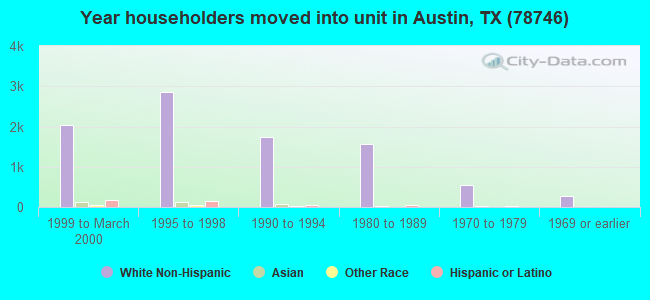
49% of the 78746 zip code residents lived in the same house 5 years ago. Out of people who lived in different houses, 48% lived in this county. Out of people who lived in different counties, 50% lived in Texas.
84% of the 78746 zip code residents lived in the same house 1 year ago. Out of people who lived in different houses, 47% moved from this county. Out of people who lived in different houses, 19% moved from different county within same state. Out of people who lived in different houses, 33% moved from different state. Out of people who lived in different houses, 2% moved from abroad.
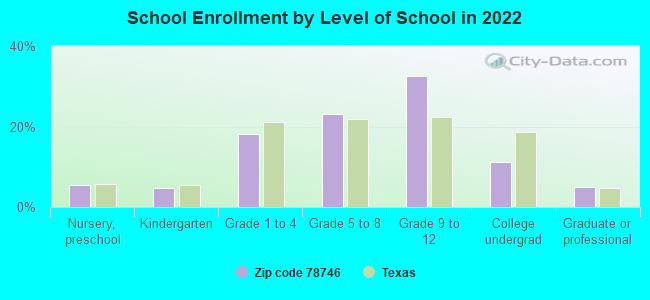
Private vs. public school enrollment:
Students in private schools in grades 1 to 8 (elementary and middle school): 699
Here:
21.2%
Texas:
8.8%
Students in private schools in grades 9 to 12 (high school): 754
Here:
28.9%
Texas:
8.0%
Students in private undergraduate colleges: 166
Here:
18.8%
Texas:
16.2%
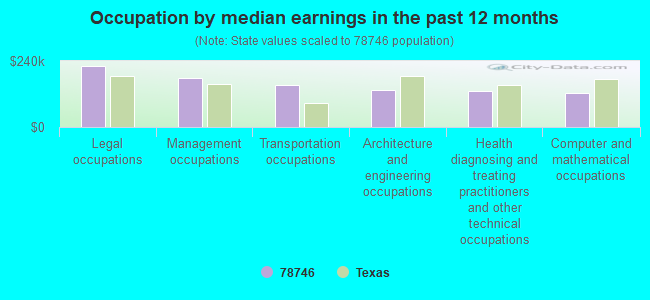
Occupation by median earnings in the past 12 months ($)
220,082Legal occupations
178,516Management occupations
152,251Transportation occupations
134,576Architecture and engineering occupations
130,144Health diagnosing and treating practitioners and other technical occupations
122,198Computer and mathematical occupations
Companies with biggest federal contracts located in this zip code:
AUSTIN INFO SYSTEMS INC (301 CAMP CRAFT RD STE 200 in AUSTIN, TX; small business) : $85,247,927 in 179 contractsfrom 1999 to 2006
Contracts for ADP Systems Development Services, ADP Software, Other Defense -- Advanced Development (R&D), Guns, through 30 mm, and moreby Army, Navy, Federal Technology Service, Food and Drug Administration, and others Signed by year:2000: $6,669,175; 2001: $9,207,683; 2002: $17,882,870; 2003: $21,333,579; 2004: $12,137,207; 2005: $9,815,641; 2006: $6,801,265.
Biggest contracts:
$5,205,255 with Army for ADP Systems Development Services. Signed on 2003-02-12. Completion date: 2004-01-16.
$3,257,715, same as above.Signed on 2002-01-23. Completion date: 2002-12-31.
$3,213,820, same as above.Signed on 2003-03-10. Completion date: 2004-01-23.
$3,104,404, same as above.Signed on 2006-03-21. Completion date: 2006-09-30.
PHIL HOWRY CO (5450 BEE CAVE ROAD - # 1B in AUSTIN, TX; small business) : $29,667,395 in 160 contractsfrom 2000 to 2005
Contracts for Construction of Structures and Facilities -- Office Buildings, Maintenance, Repair or Alteration of Real Property -- Office Buildings, Construction of Structures and Facilities -- Highways, Roads, Streets, Bridges, and Railways (includes resurfacing), Construction of Structures and Facilities -- Penal Facilities, and moreby Army, U.S. Army Corps of Engineers - civil program financing only, Federal Highway Administration, Department of Veterans Affairs, and others Signed by year:2000: $4,412,922; 2001: $7,747,742; 2002: $3,801,354; 2003: $12,742,974; 2004: $769,108; 2005: $193,295; 2006: $0.
Biggest contracts:
$7,484,338 with Army for Construction of Structures and Facilities -- Office Buildings. Signed on 2003-12-16. Completion date: 2005-07-29.
$4,871,189 with U.S. Army Corps of Engineers - civil program financing only for Construction of Structures and Facilities -- Office Buildings. Signed on 2003-04-03. Completion date: 2003-12-26.
$3,608,407 with Army for Maintenance, Repair or Alteration of Real Property -- Office Buildings. Signed on 2002-09-25. Completion date: 2003-12-30.
$3,434,000 with Federal Highway Administration for Construction of Structures and Facilities -- Highways, Roads, Streets, Bridges, and Railways (includes resurfacing). Signed on 2001-09-15. Completion date: 2002-01-15.
COHERENT LOGIX, INCORPORATED (1120 SOUTH CAPITAL OF TEXA in AUSTIN, TX; small business) : $13,488,311 in 30 contractsfrom 2003 to 2006
Contracts for Other Defense -- Basic Research (R&D), Specifications Development Services, Other Defense -- Applied Research and Exploratory Development (R&D), Other Defense -- Management and Support (R&D), and moreby Army, Air Force, Navy Signed by year:2000: $0; 2001: $0; 2002: $0; 2003: $339,633; 2004: $654,333; 2005: $7,806,463; 2006: $4,687,882.
Biggest contracts:
$3,350,000 with Army for Other Defense -- Basic Research (R&D). Signed on 2005-04-08. Completion date: 2006-04-08.
$1,652,800 with Army for Specifications Development Services. Signed on 2006-06-01. Effective on 2006-05-22. Completion date: 2007-07-15.
$1,250,000, same as above.Signed on 2006-06-16. Completion date: 2007-07-15.
$750,000 with Army for Other Defense -- Basic Research (R&D). Signed on 2006-03-09. Completion date: 2006-04-08.
NUSTATS PARTNERS, L.P. (3006 BEE CA in AUSTIN, TX; small business) 55 employees, $11657565 revenue. : $2,885,353 in 37 contractsfrom 2000 to 2006
Contracts for Fisheries Resources Management Services, Land Surveys, Cadastral Services (non-construction), Other Professional Services, Mathematical/Statistical Analyses, and moreby National Oceanic and Atmospheric Administration/Under Secretary for Oceans and Atmosphere, National Institute of Standards and Technology, EPA, Research and Innovative Technology Administration, and others Signed by year:2000: $158,000; 2001: $1,760,000; 2002: $259,000; 2003: $356,506; 2004: $201,570; 2005: $119,213; 2006: $31,064.
Biggest contracts:
$1,395,000 with National Oceanic and Atmospheric Administration/Under Secretary for Oceans and Atmosphere for Fisheries Resources Management Services. Signed on 2001-09-15. Completion date: 2005-03-15.
$345,553 with National Institute of Standards and Technology for Land Surveys, Cadastral Services (non-construction). Signed on 2003-10-14. Completion date: 2004-05-31.
$160,000 with EPA for Other Professional Services. Signed on 2002-08-15. Completion date: 2003-08-15.
$158,000, same as above.Signed on 2000-09-15. Completion date: 2001-08-15.
EUTECUS INC (5802 CANNONADE CT in AUSTIN, TX; small business) : $2,416,910 in 10 contractsfrom 2003 to 2006
Contracts for Defense Missile and Space Systems -- Basic Research (R&D), Other Defense -- Basic Research (R&D), Weapons -- Advanced Development (R&D), Other Defense -- Operational Systems Development (R&D), and moreby Missile Defense Agency, Navy, Department of Defense Signed by year:2000: $0; 2001: $0; 2002: $0; 2003: $69,300; 2004: $1,020,000; 2005: $902,610; 2006: $425,000.
Biggest contracts:
$750,000 with Missile Defense Agency for Defense Missile and Space Systems -- Basic Research (R&D). Signed on 2004-08-26. Completion date: 2006-08-24.
$749,810, same as above.Signed on 2005-10-04. Completion date: 2007-08-30.
$325,000, same as above.Signed on 2006-06-23. Effective on 2006-06-16. Completion date: 2008-05-29.
$150,000 with Navy for Other Defense -- Basic Research (R&D). Signed on 2005-09-29. Completion date: 2006-05-30.
ECOLOGICAL COMMUNICATIONS CORP (3355 BEE CAVES RD in AUSTIN, TX; small business) : $2,015,282 in 47 contractsfrom 2000 to 2006
Contracts for Other Environmental Services, Studies, and Analytical Support, Other Professional Services, Environmental Studies and Assessments, Architect - Engineer Services (including landscaping, interior layout, and designing), and moreby Department of Veterans Affairs, U.S. Army Corps of Engineers - civil program financing only, Army, NASA, and others Signed by year:2000: $333,085; 2001: $136,277; 2002: $400,611; 2003: $508,063; 2004: $155,320; 2005: $464,926; 2006: $17,000.
Biggest contracts:
$118,394 with Department of Veterans Affairs for Other Environmental Services, Studies, and Analytical Support. Taking place in PA. Signed on 2003-11-14. Completion date: 2003-12-30.
$113,792 with U.S. Army Corps of Engineers - civil program financing only for Other Professional Services. Signed on 2002-03-15. Completion date: 2002-09-30.
$95,000 with Army for Environmental Studies and Assessments. Taking place in NM. Signed on 2000-09-25. Completion date: 2001-04-30.
$90,698 with Department of Veterans Affairs for Other Environmental Services, Studies, and Analytical Support. Taking place in PA. Signed on 2005-01-01. Completion date: 2005-09-30.
SIGLAND PROPERTIES II LTD (2602 Dellana Lane in Austin, TX; small business) : $1,318,454 in 42 contractsfrom 1999 to 2006
Contracts for Lease or Rental of Facilities -- Office Buildings by Public Buildings Service Signed by year:2000: $212,000; 2001: $214,000; 2002: $216,128; 2003: $167,674; 2004: $63,578; 2005: $221,626; 2006: $170,448.
Biggest contracts:
$54,128 with Public Buildings Service for Lease or Rental of Facilities -- Office Buildings. Signed on 2002-12-15. Completion date: 2002-12-15.
$54,000, same as above.Signed on 2002-09-15. Completion date: 2002-09-15.
$54,000, same as above.Signed on 2002-06-15. Completion date: 2002-06-15.
$54,000, same as above.Signed on 2002-03-15. Completion date: 2002-03-15.
OEHLER RESEARCH INC (1308 BARCLAY DR in AUSTIN, TX; small business) : $585,346 in 18 contractsfrom 2000 to 2006
Contracts for Electrical and Electronic Properties Measuring and Testing Instruments, Miscellaneous Communication Equipment, Fire Control Transmitting and Receiving Equipment, except Airborne, Physical Properties Testing and Inspection, and moreby Army, Navy, Federal Law Enforcement Training Center Signed by year:2000: $103,200; 2001: $0; 2002: $275,512; 2003: $6,429; 2004: $27,795; 2005: $155,370; 2006: $17,040.
Biggest contracts:
$160,500 with Army for Electrical and Electronic Properties Measuring and Testing Instruments. Signed on 2002-08-19. Completion date: 2003-05-19.
$112,000 with Army for Miscellaneous Communication Equipment. Signed on 2002-04-09. Completion date: 2002-06-10.
$103,200 with Army for Fire Control Transmitting and Receiving Equipment, except Airborne. Signed on 2000-03-29. Completion date: 2000-08-15.
$86,700 with Army for Physical Properties Testing and Inspection. Signed on 2005-05-09. Completion date: 2005-08-15.
IDEAS TO MARKET, L P (4101 PARKSTONE HEIGHTS DRI in AUSTIN, TX; small business) : $449,350 in 6 contractsfrom 1999 to 2006
Contracts for Ammunition, through 30 mm, Ammunition, over 30 mm up to 75 mm, Plastics Fabricated Materials by Army Signed by year:2000: $0; 2001: $99,500; 2002: $0; 2003: $0; 2004: $0; 2005: $65,050; 2006: $19,600.
Biggest contracts:
$265,200 with Army for Ammunition, through 30 mm. Signed on 1999-12-09. Completion date: 2000-06-10.
$99,500, same as above.Signed on 2001-06-08. Completion date: 2001-08-08.
$59,250 with Army for Ammunition, over 30 mm up to 75 mm. Signed on 2005-09-26. Completion date: 2006-04-28.
$19,600 with Army for Plastics Fabricated Materials. Signed on 2006-03-02. Completion date: 2006-03-06.
WESSON INTERNATIONAL, INC. (3001 BEE CAVES RD., STE. 2 in AUSTIN, TX) : $350,000 in 2 contractsin 2000
$295,000 with Army for Miscellaneous Communication Equipment. Signed on 2000-07-21. Completion date: 2000-10-23.
$55,000 with Army for Radar Equipment, Airborne. Taking place in IN. Signed on 2000-09-06. Completion date: 2000-10-30.
Top industries in this zip code by the number of employees in 2005:
2002 - 2018 National Fire Incident Reporting System (NFIRS) incidents
According to the data from the years 2002 - 2018 the average number of fires per year is 81. The highest number of reported fires - 102 took place in 2011, and the least - 54 in 2017. The data has a dropping trend.
When looking into fire subcategories, the most incidents belonged to: Outside Fires (40.5%), and Structure Fires (34.5%).
Fire incident types reported to NFIRS in Zip Code 78746
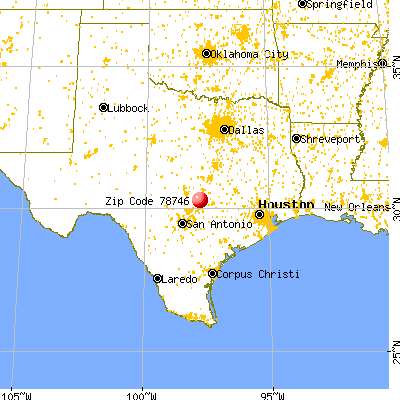


 Nearest zip codes: 78703, 78731, 78735, 78704, 78705, 78701.
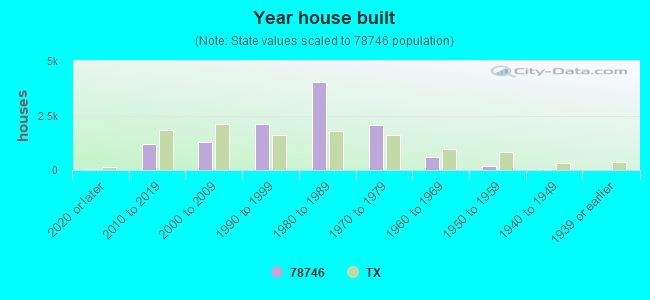


 According to the data from the years 2002 - 2018 the average number of fires per year is 81. The highest number of reported fires - 102 took place in 2011, and the least - 54 in 2017. The data has a dropping trend.
 When looking into fire subcategories, the most incidents belonged to: Outside Fires (40.5%), and Structure Fires (34.5%).