Estimated zip code population in 2022: 51,601 Zip code population in 2010: 42,117 Zip code population in 2000: 43,249
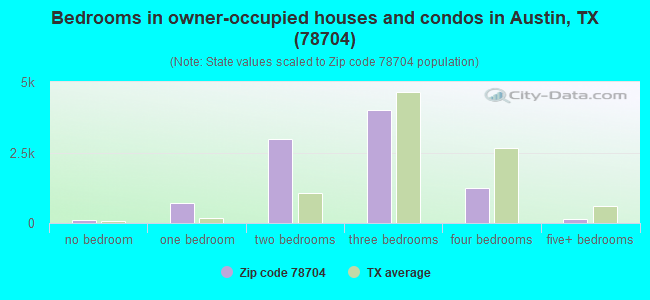
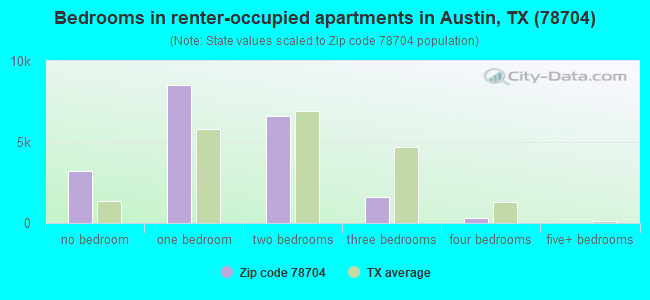
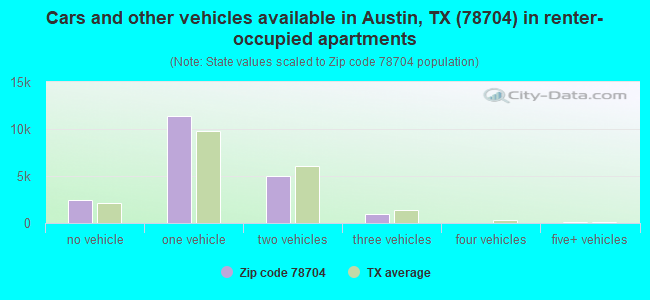
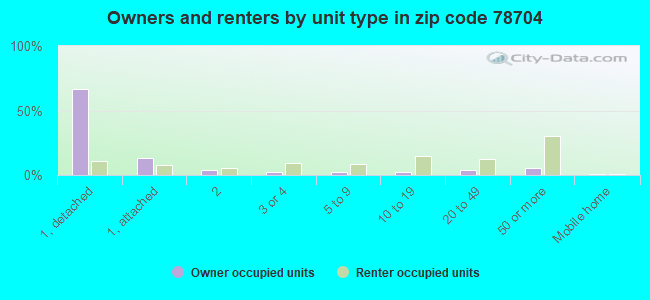
Houses and condos: 30,758 Renter-occupied apartments: 19,762
% of renters here:
68%
State:
38%
March 2022 cost of living index in zip code 78704: 99.2 (near average, U.S. average is 100)
Land area: 8.7 sq. mi. Water area: 0.1 sq. mi.
Population density: 5,938 people per square mile
(average).
OSM Map
General Map
Google Map
MSN Map
OSM Map
General Map
Google Map
MSN Map
OSM Map
General Map
Google Map
MSN Map
OSM Map
General Map
Google Map
MSN Map
Please wait while loading the map...
Real estate property taxes paid for housing units in 2022:
This zip code:
1.3% ($10,460)
Texas:
1.5% ($4,050)
Median real estate property taxes paid for housing units with mortgages in 2022: $10,505 (1.2%) Median real estate property taxes paid for housing units with no mortgage in 2022: $10,700 (1.3%)
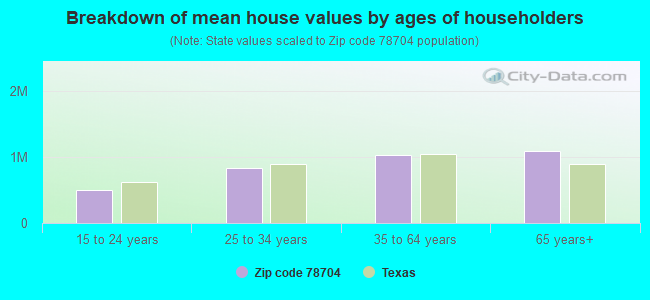
Estimated median house/condo value in 2022: $834,531
78704:
$834,531
Texas:
$275,400
According to our research of Texas and other state lists, there were 41 registered sex offenders living in 78704 zip code as of April 27, 2024. The ratio of all residents to sex offenders in zip code 78704 is 1,150 to 1. The ratio of registered sex offenders to all residents in this zip code is much lower than the state average.
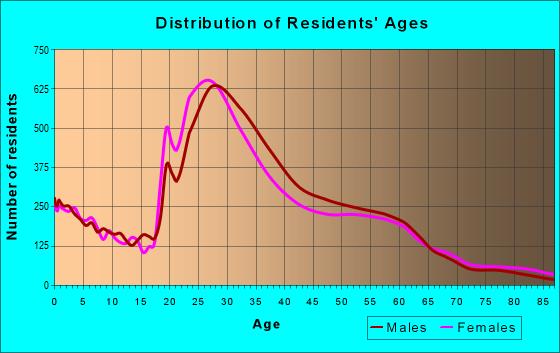
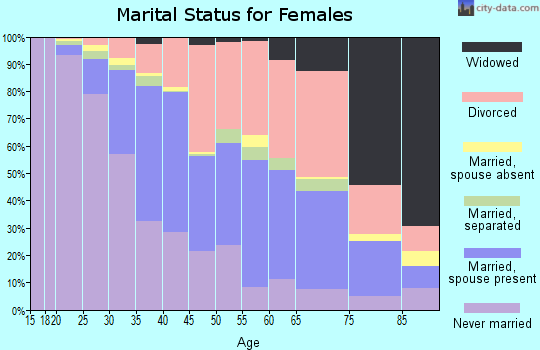
Median resident age:
This zip code:
34.1 years
Texas median age:
35.6 years
Average household size:
This zip code:
1.7 people
Texas:
2.6 people
Averages for the 2020 tax year for zip code 78704, filed in 2021:
Average Adjusted Gross Income (AGI) in 2020: $144,620 (Individual Income Tax Returns)
Here:
$144,620
State:
$77,054
Salary/wage: $103,672 (reported on 84.9% of returns)
Here:
$103,672
State:
$62,766
(% of AGI for various income ranges: 1161.9% for AGIs below $25k, 3855.6% for AGIs $25k-50k, 7116.9% for AGIs $50k-75k, 10986.8% for AGIs $75k-100k, 20971.5% for AGIs $100k-200k, 137750.9% for AGIs over 200k)
Taxable interest for individuals: $3,155 (reported on 35.1% of returns)
This zip code:
$3,155
Texas:
$2,665
(% of AGI for various income ranges: 17.1% for AGIs below $25k, 20.3% for AGIs $25k-50k, 36.6% for AGIs $50k-75k, 71.8% for AGIs $75k-100k, 160.4% for AGIs $100k-200k, 2441.8% for AGIs over 200k)
Ordinary dividends: $10,018 (reported on 33.4% of returns)
Here:
$10,018
State:
$10,044
(% of AGI for various income ranges: 50.3% for AGIs below $25k, 62.9% for AGIs $25k-50k, 113.8% for AGIs $50k-75k, 262.6% for AGIs $75k-100k, 711.6% for AGIs $100k-200k, 6688.2% for AGIs over 200k)
Net capital gain/loss in AGI: +$68,778 (reported on 33.1% of returns)
Here:
+$68,778
State:
+$39,590
(% of AGI for various income ranges: 38.7% for AGIs below $25k, 72.1% for AGIs $25k-50k, 130.3% for AGIs $50k-75k, 323.0% for AGIs $75k-100k, 1108.3% for AGIs $100k-200k, 63188.5% for AGIs over 200k)
Profit/loss from business: +$27,594 (reported on 21.4% of returns)
Here:
+$27,594
State:
+$10,888
(% of AGI for various income ranges: 230.3% for AGIs below $25k, 280.1% for AGIs $25k-50k, 378.8% for AGIs $50k-75k, 540.0% for AGIs $75k-100k, 1146.9% for AGIs $100k-200k, 9843.8% for AGIs over 200k)
Taxable individual retirement arrangement distribution: $24,428 (reported on 5.3% of returns)
78704:
$24,428
Texas:
$24,740
(% of AGI for various income ranges: 23.0% for AGIs below $25k, 47.0% for AGIs $25k-50k, 89.9% for AGIs $50k-75k, 201.3% for AGIs $75k-100k, 490.9% for AGIs $100k-200k, 1554.9% for AGIs over 200k)
Self-employed (Keogh) retirement plans: $28,821 (reported on 1.8% of returns)
78704:
$28,821
Texas:
$29,298
(% of AGI for various income ranges: 5.0% for AGIs $25k-50k, 15.8% for AGIs $50k-75k, 83.2% for AGIs $100k-200k, 1228.7% for AGIs over 200k)
Total itemized deductions: $38,522 (reported on 14.1% of returns)
Here:
$38,522
State:
$40,428
(% of AGI for various income ranges: 64.7% for AGIs below $25k, 100.7% for AGIs $25k-50k, 247.2% for AGIs $50k-75k, 421.9% for AGIs $75k-100k, 1307.6% for AGIs $100k-200k, 10301.6% for AGIs over 200k)
Charity contributions: $13,709 (reported on 10.5% of returns)
Here:
$13,709
State:
$18,201
(% of AGI for various income ranges: 2.8% for AGIs below $25k, 8.6% for AGIs $25k-50k, 19.0% for AGIs $50k-75k, 37.7% for AGIs $75k-100k, 180.0% for AGIs $100k-200k, 3613.9% for AGIs over 200k)
Taxes paid: $8,998 (reported on 14.0% of returns)
78704:
$8,998
State:
$7,821
(% of AGI for various income ranges: 13.0% for AGIs below $25k, 28.5% for AGIs $25k-50k, 65.1% for AGIs $50k-75k, 125.5% for AGIs $75k-100k, 390.5% for AGIs $100k-200k, 2076.7% for AGIs over 200k)
Earned income credit: $1,615 (reported on 8.0% of returns)
Here:
$1,615
State:
$2,584
(% of AGI for various income ranges: 62.4% for AGIs below $25k, 22.2% for AGIs $25k-50k)
Percentage of individuals using paid preparers for their 2020 taxes: 93.2%
Here:
93%
State:
92%
(% for various income ranges: 90.0% for AGIs below $25k, 93.3% for AGIs $25k-50k, 94.1% for AGIs $50k-75k, 94.3% for AGIs $75k-100k, 94.2% for AGIs $100k-200k, 94.8% for AGIs over 200k)
Averages for the 2012 tax year for zip code 78704, filed in 2013:
Average Adjusted Gross Income (AGI) in 2012: $72,272 (Individual Income Tax Returns)
Here:
$72,272
State:
$65,384
Salary/wage: $57,716 (reported on 84.6% of returns)
Here:
$57,716
State:
$52,524
(% of AGI for various income ranges: 78.9% for AGIs below $25k, 85.3% for AGIs $25k-50k, 82.6% for AGIs $50k-75k, 76.2% for AGIs $75k-100k, 76.6% for AGIs $100k-200k, 47.9% for AGIs over 200k)
Taxable interest for individuals: $2,242 (reported on 32.6% of returns)
This zip code:
$2,242
Texas:
$2,372
(% of AGI for various income ranges: 1.8% for AGIs below $25k, 0.5% for AGIs $25k-50k, 0.6% for AGIs $50k-75k, 1.0% for AGIs $75k-100k, 0.8% for AGIs $100k-200k, 1.3% for AGIs over 200k)
Ordinary dividends: $7,914 (reported on 24.0% of returns)
Here:
$7,914
State:
$9,721
(% of AGI for various income ranges: 3.3% for AGIs below $25k, 1.6% for AGIs $25k-50k, 1.9% for AGIs $50k-75k, 2.0% for AGIs $75k-100k, 2.5% for AGIs $100k-200k, 3.3% for AGIs over 200k)
Net capital gain/loss in AGI: +$30,106 (reported on 20.7% of returns)
Here:
+$30,106
State:
+$35,319
(% of AGI for various income ranges: 0.2% for AGIs below $25k, 0.7% for AGIs $25k-50k, 0.8% for AGIs $50k-75k, 2.4% for AGIs $75k-100k, 2.7% for AGIs $100k-200k, 19.8% for AGIs over 200k)
Profit/loss from business: +$20,909 (reported on 21.2% of returns)
Here:
+$20,909
State:
+$13,732
(% of AGI for various income ranges: 11.6% for AGIs below $25k, 5.6% for AGIs $25k-50k, 5.3% for AGIs $50k-75k, 6.2% for AGIs $75k-100k, 6.4% for AGIs $100k-200k, 5.5% for AGIs over 200k)
Taxable individual retirement arrangement distribution: $19,580 (reported on 5.2% of returns)
78704:
$19,580
Texas:
$19,511
(% of AGI for various income ranges: 1.1% for AGIs below $25k, 1.0% for AGIs $25k-50k, 1.2% for AGIs $50k-75k, 1.6% for AGIs $75k-100k, 1.8% for AGIs $100k-200k, 1.4% for AGIs over 200k)
Self-employment retirement plans: $17,556 (reported on 1.4% of returns)
78704:
$17,556
Texas:
$23,938
(% of AGI for various income ranges: 0.1% for AGIs below $25k, 0.2% for AGIs $50k-75k, 0.2% for AGIs $75k-100k, 0.4% for AGIs $100k-200k, 0.5% for AGIs over 200k)
Total itemized deductions: $26,402 (16% of AGI, reported on 26.8% of returns)
Here:
$26,402
State:
$24,724
Here:
15.9% of AGI
State:
15.9% of AGI
(% of AGI for various income ranges: 8.4% for AGIs below $25k, 6.5% for AGIs $25k-50k, 9.6% for AGIs $50k-75k, 12.1% for AGIs $75k-100k, 12.4% for AGIs $100k-200k, 9.3% for AGIs over 200k)
Charity contributions: $4,908 (reported on 19.9% of returns)
Here:
$4,908
State:
$6,808
(% of AGI for various income ranges: 0.4% for AGIs below $25k, 0.5% for AGIs $25k-50k, 0.7% for AGIs $50k-75k, 1.0% for AGIs $75k-100k, 1.3% for AGIs $100k-200k, 2.2% for AGIs over 200k)
Taxes paid: $9,941 (reported on 26.2% of returns)
78704:
$9,941
State:
$6,921
(% of AGI for various income ranges: 1.9% for AGIs below $25k, 2.0% for AGIs $25k-50k, 3.1% for AGIs $50k-75k, 4.1% for AGIs $75k-100k, 4.9% for AGIs $100k-200k, 3.8% for AGIs over 200k)
Earned income credit: $1,593 (reported on 12.3% of returns)
Here:
$1,593
State:
$2,570
(% of AGI for various income ranges: 3.6% for AGIs below $25k, 0.3% for AGIs $25k-50k)
Percentage of individuals using paid preparers for their 2012 taxes: 36.0%
Here:
36%
State:
51%
(% for various income ranges: 31.0% for AGIs below $25k, 28.4% for AGIs $25k-50k, 35.4% for AGIs $50k-75k, 42.2% for AGIs $75k-100k, 50.2% for AGIs $100k-200k, 71.4% for AGIs over 200k)
Averages for the 2004 tax year for zip code 78704, filed in 2005:
Average Adjusted Gross Income (AGI) in 2004: $41,163 (Individual Income Tax Returns)
Here:
$41,163
State:
$47,881
Salary/wage: $35,954 (reported on 86.3% of returns)
Here:
$35,954
State:
$41,947
(% of AGI for various income ranges: 127.5% for AGIs below $10k, 85.1% for AGIs $10k-25k, 87.0% for AGIs $25k-50k, 78.9% for AGIs $50k-75k, 78.1% for AGIs $75k-100k, 59.0% for AGIs over 100k)
Taxable interest for individuals: $1,638 (reported on 35.0% of returns)
This zip code:
$1,638
Texas:
$2,255
(% of AGI for various income ranges: 3.6% for AGIs below $10k, 1.0% for AGIs $10k-25k, 0.9% for AGIs $25k-50k, 1.4% for AGIs $50k-75k, 0.8% for AGIs $75k-100k, 1.9% for AGIs over 100k)
Taxable dividends: $2,936 (reported on 21.0% of returns)
Here:
$2,936
State:
$4,261
(% of AGI for various income ranges: 5.5% for AGIs below $10k, 1.1% for AGIs $10k-25k, 0.9% for AGIs $25k-50k, 1.3% for AGIs $50k-75k, 1.6% for AGIs $75k-100k, 1.9% for AGIs over 100k)
Net capital gain/loss: +$10,759 (reported on 18.7% of returns)
Here:
+$10,759
State:
+$16,110
(% of AGI for various income ranges: -2.7% for AGIs below $10k, 0.3% for AGIs $10k-25k, 0.8% for AGIs $25k-50k, 1.5% for AGIs $50k-75k, 1.7% for AGIs $75k-100k, 12.2% for AGIs over 100k)
Profit/loss from business: +$13,086 (reported on 18.2% of returns)
Here:
+$13,086
State:
+$11,013
(% of AGI for various income ranges: 13.3% for AGIs below $10k, 7.2% for AGIs $10k-25k, 4.2% for AGIs $25k-50k, 6.1% for AGIs $50k-75k, 6.5% for AGIs $75k-100k, 5.7% for AGIs over 100k)
IRA payment deduction: $2,720 (reported on 2.2% of returns)
78704:
$2,720
Texas:
$3,120
(% of AGI for various income ranges: 0.4% for AGIs below $10k, 0.2% for AGIs $10k-25k, 0.2% for AGIs $25k-50k, 0.2% for AGIs $50k-75k, 0.1% for AGIs $75k-100k, 0.1% for AGIs over 100k)
Self-employed pension: $11,520 (reported on 1.4% of returns)
Here:
$11,520
Texas:
$16,401
(% of AGI for various income ranges: 0.1% for AGIs $10k-25k, 0.2% for AGIs $25k-50k, 0.3% for AGIs $50k-75k, 0.4% for AGIs $75k-100k, 0.7% for AGIs over 100k)
Total itemized deductions: $17,594 (20% of AGI, reported on 22.5% of returns)
Here:
$17,594
State:
$19,631
Here:
19.7% of AGI
State:
18.9% of AGI
(% of AGI for various income ranges: 14.7% for AGIs below $10k, 5.1% for AGIs $10k-25k, 7.1% for AGIs $25k-50k, 11.6% for AGIs $50k-75k, 13.9% for AGIs $75k-100k, 10.6% for AGIs over 100k)
Charity contributions deductions: $3,255 (3% of AGI, reported on 18.0% of returns)
Here:
$3,255
State:
$4,753
Here:
3.4% of AGI
State:
4.2% of AGI
(% of AGI for various income ranges: 0.5% for AGIs below $10k, 0.3% for AGIs $10k-25k, 0.6% for AGIs $25k-50k, 1.1% for AGIs $50k-75k, 1.6% for AGIs $75k-100k, 2.5% for AGIs over 100k)
Total tax: $7,151 (reported on 78.5% of returns)
78704:
$7,151
State:
$9,058
(% of AGI for various income ranges: 4.7% for AGIs below $10k, 5.3% for AGIs $10k-25k, 9.4% for AGIs $25k-50k, 12.5% for AGIs $50k-75k, 13.7% for AGIs $75k-100k, 20.4% for AGIs over 100k)
Earned income credit: $1,400 (reported on 15.0% of returns)
Here:
$1,400
State:
$2,024
Percentage of individuals using paid preparers for their 2004 taxes: 39.5%
Here:
40%
State:
57%
(% for various income ranges: 40.8% for AGIs below $10k, 41.4% for AGIs $10k-25k, 32.0% for AGIs $25k-50k, 39.7% for AGIs $50k-75k, 45.1% for AGIs $75k-100k, 54.7% for AGIs over 100k)
Likely homosexual households (counted as self-reported same-sex unmarried-partner households)
Lesbian couples: 0.4% of all households
Gay men: 0.6% of all households
Household received Food Stamps/SNAP in the past 12 months: 1,556 Household did not receive Food Stamps/SNAP in the past 12 months: 27,379
Women who had a birth in the past 12 months: 374 (381 now married, 0 unmarried) Women who did not have a birth in the past 12 months: 16,936 (4,437 now married, 12,594 unmarried)
Housing units in zip code 78704 with a mortgage: 5,854 (460 second mortgage, 17 home equity loan, 325 both second mortgage and home equity loan) Houses without a mortgage: 46
Median monthly owner costs for units with a mortgage: $3,339 Median monthly owner costs for units without a mortgage: $1,421
Residents with income below the poverty level in 2022:
This zip code:
12.1%
Whole state:
14.0%
Residents with income below 50% of the poverty level in 2022:
This zip code:
6.7%
Whole state:
7.4%
Median number of rooms in houses and condos:
Here:
5.3
State:
6.3
Median number of rooms in apartments:
Here:
2.9
State:
4.0
Notable locations in this zip code not listed on our city pages
Notable locations in zip code 78704: Green Pastures House (A), Louis and Mathilde Reuter House (B), Mather-Kirkland House (C), Alumni Gym (D), Andre Hall (E), Austin Fire Department Station 11 (F), Basil Moreau Hall (G), Carriage House (H), Clinger Gymnasium (I), Deaf Smith Ranger Center (J), Doyle Hall (K), Dujarie Hall (L), East Hall (M), Fleck Hall (N), Fondren Hall (O), Holy Cross Hall (P), John Brooks Williams Natural Science Center (Q), Koen Hall (R), Lewis Hall (S), Michael Paggi House (T). Display/hide their locations on the map
Shopping Centers: Lamar Plaza Shopping Center (1), Brodie Oaks Shopping Center (2), Lake Hills Plaza Shopping Center (3). Display/hide their locations on the map
Churches in zip code 78704 include: Goodwill Baptist Church (A), Friendly Will Baptist Church (B), Emanuel Assembly of God Church (C), South Austin Apostolic Church (D), Kinney Avenue Baptist Church (E), Holy Name of Mary Church (F), South First Baptist Church (G), Faith United Methodist Church (H), Saint Ignatius Martyr Church (I). Display/hide their locations on the map
Parks in zip code 78704 include: South Austin Park (1), Disch Field (2), Big Stacy Park (3), Gillis Park (4), Little Stacy Park (5), Butler Park (6), Saint Edwards University Track Field (7), Saint Edwards University Soccer Field (8), Rudolph Gamblin Field (9). Display/hide their locations on the map
Tourist attractions (not listed on the city page) : Blazer Tag Adventure Center (Amusement & Theme Parks; 1701 West Ben White Boulevard Building 1), Alien Scooters (Tours & Charters; 1122 South Lamar Boulevard).
3,633 married couples with children.
1,974 single-parent households (427 men, 1,547 women).
79.1% of residents of 78704 zip code speak English at home.
16.1% of residents speak Spanish at home (79% very well, 13% well, 6% not well, 2% not at all).
2.2% of residents speak other Indo-European language at home (93% very well, 5% well, 2% not well).
1.5% of residents speak Asian or Pacific Island language at home (74% very well, 20% well, 6% not well).
0.8% of residents speak other language at home (56% very well, 28% well, 16% not well).
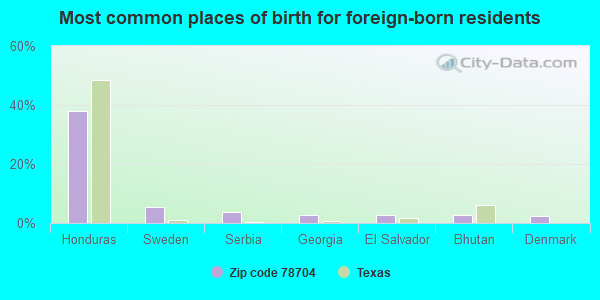
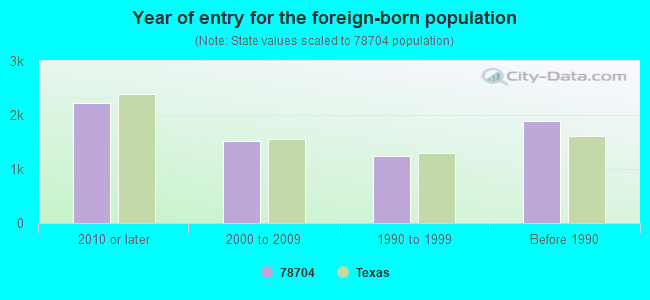
Foreign born population: 5,772 (11.2%) (46.5% of them are naturalized citizens)
Facilities with environmental interests located in this zip code:
AMERICAN CLEANERS (2818 SOUTH LAMAR in AUSTIN, TX)
AIR MINOR (AIRS/AFS) (Resource Conservation and Recovery Act (tracking hazardous waste)) Business SIC classification: DRYCLEANING PLANTS, EXCEPT RUG CLEANING Organizations: UNITED STATES CLEANERS INC (CONTACT/OPERATOR)
Alternative names: UNITED STATES CLNRS DBA AMERICAN CLEANER
BARTON HILLS EL (2108 BARTON HILLS DR in AUSTIN, TX)
(National Center for Education Statistics) - STATE ID-227901103 Organizations: AUSTIN ISD (SCHOOL DISTRICT)
AAMCO TRANSMISSIONS (3411 S LAMAR BLVD in AUSTIN, TX)
(Resource Conservation and Recovery Act (tracking hazardous waste))
AGUIRRE PAINT & BODY INC (3909 PAYLOAD PASS in AUSTIN, TX)
(Resource Conservation and Recovery Act (tracking hazardous waste)) Alternative names: AGUIRRIE PAINT & BODY INC
ALEX BODY & PAINT (3500 S LAMAR in AUSTIN, TX)
(Resource Conservation and Recovery Act (tracking hazardous waste)) Alternative names: ALEX PAINT & BODY
AMERICAN CLEANERS (2929 S LAMAR in AUSTIN, TX)
(Resource Conservation and Recovery Act (tracking hazardous waste))
ARTS BODY & PAINT (1402 HETHER ST in AUSTIN, TX)
(Resource Conservation and Recovery Act (tracking hazardous waste))
AUSTIN ISD (201 E MARY in AUSTIN, TX)
(Resource Conservation and Recovery Act (tracking hazardous waste)) Alternative names: FULMORE JUNIOR HIGH SCHOOL
AUSTIN ISD (2206 PRATHER LN in AUSTIN, TX)
(Resource Conservation and Recovery Act (tracking hazardous waste)) Alternative names: PORTER JUNIOR HIGH SCHOOL
AUSTIN ISD (1315 S 5TH ST in AUSTIN, TX)
(Resource Conservation and Recovery Act (tracking hazardous waste)) Alternative names: AUSTIN ISD CRISWELL
AUSTIN NURSING & CONVALESCENT CENTER INC (110 E LIVE OAK in AUSTIN, TX)
(Resource Conservation and Recovery Act (tracking hazardous waste)) Alternative names: AUSTIN NURSING CONVALSCNT CTR#
AISD (TRAVIS HEIGHTS ELEMENTARY) (2010 ALEMBOA DR in AUSTIN, TX)
COMPLIANCE ACTIVITY (Tracking inspections of insecticide, fungicide, and rodenticide, and toxic substances)
BARTON SPRINGS POOL ( in AUSTIN, TX)
SUPERFUND (Superfund database)
Housing units lacking complete plumbing facilities: 0.3% Housing units lacking complete kitchen facilities: 0.4%
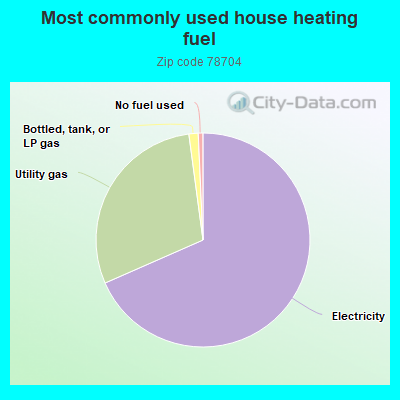
68.0%Electricity
29.3%Utility gas
1.4%Bottled, tank, or LP gas
0.7%No fuel used
Population in 1990: 39,211. Population change in the 1990s: +4,038 (+10.3%).
Place of birth for U.S.-born residents:
This state: 22,254
Northeast: 4,284
Midwest: 6,297
South: 6,334
West: 5,880
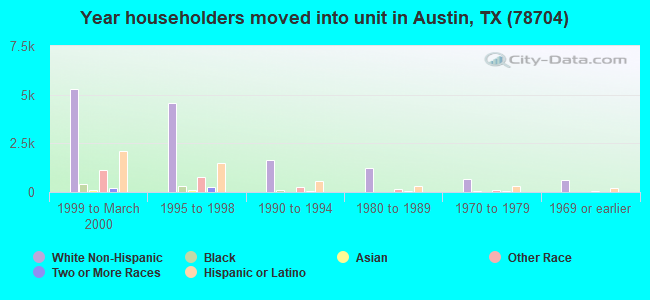
34% of the 78704 zip code residents lived in the same house 5 years ago. Out of people who lived in different houses, 56% lived in this county. Out of people who lived in different counties, 50% lived in Texas.
79% of the 78704 zip code residents lived in the same house 1 year ago. Out of people who lived in different houses, 53% moved from this county. Out of people who lived in different houses, 15% moved from different county within same state. Out of people who lived in different houses, 29% moved from different state. Out of people who lived in different houses, 3% moved from abroad.
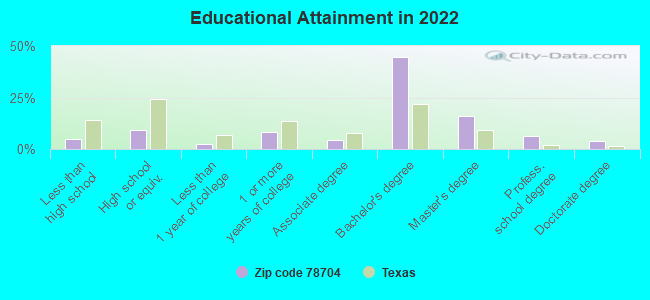
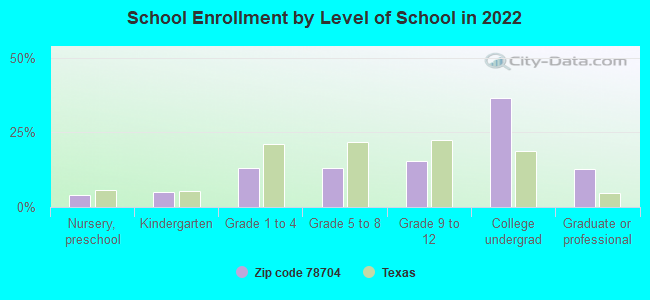
Private vs. public school enrollment:
Students in private schools in grades 1 to 8 (elementary and middle school): 526
Here:
24.2%
Texas:
8.8%
Students in private schools in grades 9 to 12 (high school): 117
Here:
9.3%
Texas:
8.0%
Students in private undergraduate colleges: 906
Here:
30.2%
Texas:
16.2%
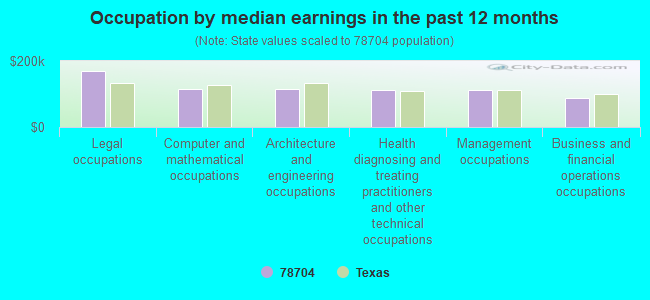
Occupation by median earnings in the past 12 months ($)
169,373Legal occupations
114,773Computer and mathematical occupations
114,204Architecture and engineering occupations
112,945Health diagnosing and treating practitioners and other technical occupations
112,888Management occupations
88,132Business and financial operations occupations
Companies with biggest federal contracts located in this zip code (AUSTIN, TX):
J & J MAINTENANCE, INC (3755 S CAPITAL OF TEXAS H) : $699,760,616 in 7061 contractsfrom 1999 to 2006
Contracts for Operation of Government-Owned Facilities -- Maintenance Buildings, Maintenance, Repair or Alteration of Real Property -- Family Housing Facilities, Engineering and Technical Services, Maintenance, Repair or Alteration of Real Property -- Hospitals and Infirmaries, and moreby Air Force, Army, Navy, Federal Supply Service, and others Signed by year:2000: $54,464,218; 2001: $75,557,217; 2002: $124,883,304; 2003: $135,195,401; 2004: $122,549,453; 2005: $129,919,510; 2006: $42,523,701.
Biggest contracts:
$14,686,523 with Air Force for Operation of Government-Owned Facilities -- Maintenance Buildings. Taking place in CO. Signed on 2005-02-18. Completion date: 2006-02-28.
$14,667,400, same as above.Signed on 2006-02-27. Completion date: 2007-02-28.
$14,437,054, same as above.Signed on 2003-01-30. Completion date: 2003-01-31.
$14,026,358, same as above.Signed on 2004-02-13. Completion date: 2004-09-30.
J & J-BMAR JOINT VENTURE (3755 S CAPITAL OF TEXAS H) : $117,158,253 in 330 contractsfrom 2001 to 2006
Contracts for Maintenance, Repair or Alteration of Real Property -- Miscellaneous Buildings, Facilities Operations Support Services, Maintenance, Repair or Alteration of Real Property -- Family Housing Facilities, Construction of Structures and Facilities -- Other Non-Building Facilities, and moreby Army Signed by year:2000: $0; 2001: $887,151; 2002: $16,370,361; 2003: $18,650,944; 2004: $25,677,885; 2005: $46,956,516; 2006: $8,615,396.
Biggest contracts:
$7,423,284 with Army for Maintenance, Repair or Alteration of Real Property -- Miscellaneous Buildings. Taking place in KY. Signed on 2005-09-27. Completion date: 2006-01-24.
$7,214,902 with Army for Facilities Operations Support Services. Taking place in KY. Signed on 2005-11-14. Completion date: 2006-04-30.
$5,480,834, same as above.Signed on 2005-12-29. Completion date: 2006-04-30.
$4,743,140, same as above.Signed on 2005-06-01. Completion date: 2004-04-30.
TRAVIS ASSN FOR THE BLIND (2831 MANCHACA RD) : $38,532,063 in 153 contractsfrom 1999 to 2006
Contracts for Mailing and Distribution Services, Logistics Support Services, Clothing, Special Purpose, Hosiery, Handwear, and Clothing Accessories, Men's, and moreby Defense Logistics Agency, Air Force Signed by year:2000: $4,313,333; 2001: $7,110,535; 2002: $5,051,716; 2003: $2,074,400; 2004: $7,682,206; 2005: $10,089,224; 2006: $2,306,733.
Biggest contracts:
$5,400,000 with Defense Logistics Agency for Mailing and Distribution Services. Signed on 2005-09-30. Completion date: 2005-12-31.
$4,500,000, same as above.Signed on 2004-09-30. Completion date: 2005-12-31.
$2,346,000, same as above.Signed on 2001-09-30. Completion date: 2001-12-12.
$2,346,000 with Defense Logistics Agency for Logistics Support Services. Signed on 2002-09-30. Completion date: 2005-12-12.
BECHTEL-S CORPORATION (2319 WESTOAK DRIVE; small business) : $22,118,111 in 69 contractsfrom 2001 to 2006
Contracts for Other Environmental Services, Studies, and Analytical Support, Architect - Engineer Services (including landscaping, interior layout, and designing), Other Management Support Services, Other Education and Training Services, and moreby Army, Air Force Signed by year:2000: $0; 2001: $600,913; 2002: $1,134,704; 2003: $1,175,893; 2004: $9,216,064; 2005: $4,689,160; 2006: $5,301,377.
Biggest contracts:
$8,000,000 with Army for Other Environmental Services, Studies, and Analytical Support. Taking place in AL. Signed on 2005-09-01. Completion date: 2005-09-30.
$5,353,071, same as above.Signed on 2004-09-30. Completion date: 2006-12-31.
$2,654,431, same as above.Signed on 2006-04-27. Completion date: 2010-12-31.
$2,099,983 with Army for Architect - Engineer Services (including landscaping, interior layout, and designing). Taking place in DC. Signed on 2006-04-24. Completion date: 2007-04-20.
GLOBAL JOINT VENTURE (3755 CAPITAL OF TEXAS HWY) : $11,934,865 in 65 contractsfrom 1999 to 2003
Contracts for Maintenance, Repair or Alteration of Real Property -- Hospitals and Infirmaries by Army Signed by year:2000: $8,716,908; 2001: $3,368,935; 2002: -$295,730; 2003: -$10,776; 2004: $0; 2005: $0; 2006: $0.
Biggest contracts:
$1,229,976 with Army for Maintenance, Repair or Alteration of Real Property -- Hospitals and Infirmaries. Taking place in LA. Signed on 2000-09-28. Completion date: 2001-09-30.
$989,790 with Army for Maintenance, Repair or Alteration of Real Property -- Hospitals and Infirmaries. Taking place in GA. Signed on 2000-09-29. Completion date: 2001-07-31.
$989,270, same as above.Signed on 2000-02-14. Completion date: 2000-09-30.
$942,063 with Army for Maintenance, Repair or Alteration of Real Property -- Hospitals and Infirmaries. Taking place in AK. Signed on 2000-06-29. Completion date: 2001-06-30.
MICHAEL JAMES WHITE (4004 WOODBURY DR STE G; small business) : $741,978 in 8 contractsfrom 2004 to 2006
Contracts for Food Items For Resale, Non-Food Items For Resale by Defense Commissary Agency Signed by year:2000: $0; 2001: $0; 2002: $0; 2003: $0; 2004: $155,895; 2005: $410,875; 2006: $175,208.
Biggest contracts:
$170,087 with Defense Commissary Agency for Food Items For Resale. Signed on 2005-04-01. Completion date: 2005-08-31.
$155,895, same as above.Signed on 2004-10-01. Completion date: 2005-02-28.
$154,847 with Defense Commissary Agency for Non-Food Items For Resale. Signed on 2006-01-01. Completion date: 2006-03-31.
$109,716 with Defense Commissary Agency for Food Items For Resale. Signed on 2005-10-01. Completion date: 2005-12-31.
ENTERPRISE RENT A CAR CO OF T (701 E BEN WHITE BLVD) : $707,279 in 74 contractsfrom 2001 to 2006
Contracts for Lease or Rental of Equipment -- Ground Effect Vehicles, Motor Vehicles, Trailers, and Cycles, Trucks and Truck Tractors, Wheeled, Passenger Motor Vehicles, Miscellaneous Items, and moreby Army Signed by year:2000: $0; 2001: $41,559; 2002: $63,452; 2003: $182,493; 2004: $62,449; 2005: $311,742; 2006: $45,584.
Biggest contracts:
$79,200 with Army for Lease or Rental of Equipment -- Ground Effect Vehicles, Motor Vehicles, Trailers, and Cycles. Signed on 2005-12-30. Completion date: 2006-04-30.
$63,374 with Army for Trucks and Truck Tractors, Wheeled. Signed on 2005-04-29. Completion date: 2005-07-02.
$53,300 with Army for Lease or Rental of Equipment -- Ground Effect Vehicles, Motor Vehicles, Trailers, and Cycles. Signed on 2003-01-25. Completion date: 2003-02-28.
$49,500 with Army for Passenger Motor Vehicles. Signed on 2005-02-04. Completion date: 2005-05-31.
J & J/H J JOINT VENTURE (3755 S CAPITAL OF TEXAS H) : $165,872 in 9 contractsfrom 2002 to 2003
Contracts for Construction of Structures and Facilities -- Other Non-Building Facilities by Army Signed by year:2000: $0; 2001: $0; 2002: $11,656; 2003: $154,216; 2004: $0; 2005: $0; 2006: $0.
Biggest contracts:
$77,761 with Army for Construction of Structures and Facilities -- Other Non-Building Facilities. Signed on 2003-02-25. Completion date: 2003-04-15.
$31,916, same as above.Signed on 2003-01-30. Completion date: 2003-03-31.
$19,418, same as above.Signed on 2003-01-14. Completion date: 2003-03-24.
$10,803, same as above.Signed on 2002-12-03. Completion date: 2003-02-28.
WILLIAM H ESPEY, JR (3809 SOUTH 2ND STREET; small business)
$87,799 with U.S. Army Corps of Engineers - civil program financing only for Engineering and Technical Services. Signed on 2002-12-17. Completion date: 2003-09-17.
MA GROUP (409B E BEN WHITE BLVD; small business)
$81,641 with Navy for ADP Software. Signed on 2000-09-01. Completion date: 2000-10-15.
Top industries in this zip code by the number of employees in 2005:
Professional, Scientific, and Technical Services: Research and Development in the Physical, Engineering, and Life Sciences (250-499: 1, 100-249: 3, 50-99: 1)
Finance and Insurance: Insurance Agencies and Brokerages (500-999: 1, 10-19: 1, 5-9: 4, 1-4: 20)
Health Care and Social Assistance: General Medical and Surgical Hospitals (500-999: 1)
Accommodation and Food Services: Hotels (except Casino Hotels) and Motels (250-499: 1, 50-99: 1, 20-49: 4, 10-19: 2, 1-4: 1)
People in group quarters in 2010:
971 people in college/university student housing
228 people in nursing facilities/skilled-nursing facilities
123 people in other noninstitutional facilities
63 people in correctional facilities intended for juveniles
52 people in group homes intended for adults
36 people in residential treatment centers for juveniles (non-correctional)
18 people in emergency and transitional shelters (with sleeping facilities) for people experiencing homelessness
4 people in workers' group living quarters and job corps centers
People in group quarters in 2000:
661 people in college dormitories (includes college quarters off campus)
270 people in nursing homes
90 people in short-term care, detention or diagnostic centers for delinquent children
56 people in other group homes
48 people in religious group quarters
41 people in other noninstitutional group quarters
40 people in homes or halfway houses for drug/alcohol abuse
19 people in homes for the physically handicapped
13 people in hospitals/wards and hospices for chronically ill
13 people in hospices or homes for chronically ill
12 people in other nonhousehold living situations
2 people in hospitals or wards for drug/alcohol abuse
Fatal accident statistics in 2014:
Fatal accident count: 5
Vehicles involved in fatal accidents: 9
Fatal accidents caused by drunken drivers: 1
Fatalities: 7
Persons involved in fatal accidents: 14
Pedestrians involved in fatal accidents: 1
Fatal accident statistics in 2013:
Fatal accident count: 2
Vehicles involved in fatal accidents: 6
Fatal accidents caused by drunken drivers: 0
Fatalities: 2
Persons involved in fatal accidents: 11
Pedestrians involved in fatal accidents: 1
Home Mortgage Disclosure Act Aggregated Statistics For Year 2009 (Based on 18 full and 4 partial tracts)
A) FHA, FSA/RHS & VA Home Purchase Loans
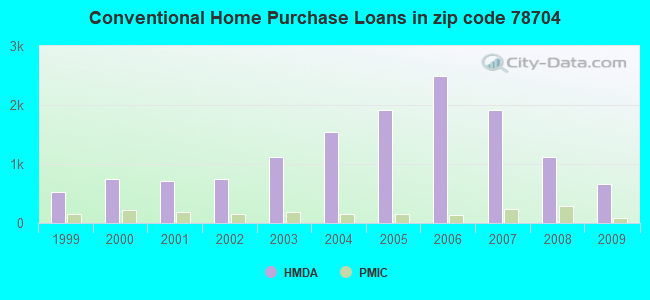
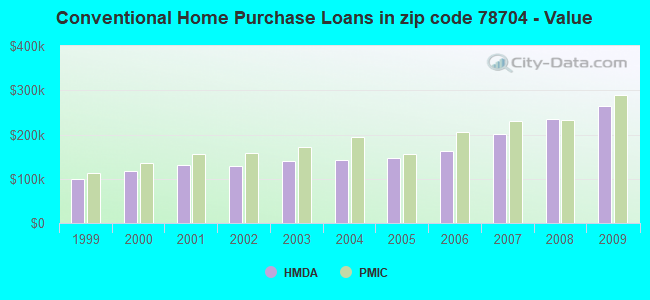
B) Conventional Home Purchase Loans
C) Refinancings
D) Home Improvement Loans
E) Loans on Dwellings For 5+ Families
F) Non-occupant Loans on < 5 Family Dwellings (A B C & D)
G) Loans On Manufactured Home Dwelling (A B C & D)
Number
Average Value
Number
Average Value
Number
Average Value
Number
Average Value
Number
Average Value
Number
Average Value
Number
Average Value
LOANS ORIGINATED
155
$178,390
654
$265,178
1,446
$240,743
79
$109,614
16
$2,307,975
242
$244,640
0
$0
APPLICATIONS APPROVED, NOT ACCEPTED
6
$161,883
66
$196,351
116
$213,418
17
$97,040
0
$0
29
$177,391
0
$0
APPLICATIONS DENIED
36
$158,589
151
$251,496
465
$219,721
57
$91,558
2
$1,808,370
91
$193,178
1
$40,360
APPLICATIONS WITHDRAWN
26
$190,038
80
$241,570
305
$229,208
25
$27,030
2
$161,310
50
$207,910
0
$0
FILES CLOSED FOR INCOMPLETENESS
3
$266,343
10
$232,669
62
$261,186
7
$255,359
0
$0
6
$217,448
0
$0
Aggregated Statistics For Year 2008 (Based on 18 full and 4 partial tracts)
A) FHA, FSA/RHS & VA Home Purchase Loans
B) Conventional Home Purchase Loans
C) Refinancings
D) Home Improvement Loans
E) Loans on Dwellings For 5+ Families
F) Non-occupant Loans on < 5 Family Dwellings (A B C & D)
G) Loans On Manufactured Home Dwelling (A B C & D)
Number
Average Value
Number
Average Value
Number
Average Value
Number
Average Value
Number
Average Value
Number
Average Value
Number
Average Value
LOANS ORIGINATED
43
$178,968
1,120
$235,054
689
$225,987
148
$116,012
15
$10,747,482
378
$227,595
4
$35,910
APPLICATIONS APPROVED, NOT ACCEPTED
14
$121,806
121
$211,438
98
$198,825
25
$72,519
1
$2,535,140
62
$247,036
10
$65,438
APPLICATIONS DENIED
10
$109,504
225
$216,178
260
$221,045
131
$93,386
8
$1,387,770
88
$199,675
22
$56,080
APPLICATIONS WITHDRAWN
14
$127,316
159
$245,297
175
$220,895
43
$59,457
2
$987,400
73
$201,417
0
$0
FILES CLOSED FOR INCOMPLETENESS
8
$149,359
40
$272,951
37
$256,386
14
$128,532
1
$2,250,000
18
$236,297
0
$0
Aggregated Statistics For Year 2007 (Based on 18 full and 4 partial tracts)
A) FHA, FSA/RHS & VA Home Purchase Loans
B) Conventional Home Purchase Loans
C) Refinancings
D) Home Improvement Loans
E) Loans on Dwellings For 5+ Families
F) Non-occupant Loans on < 5 Family Dwellings (A B C & D)
G) Loans On Manufactured Home Dwelling (A B C & D)
Number
Average Value
Number
Average Value
Number
Average Value
Number
Average Value
Number
Average Value
Number
Average Value
Number
Average Value
LOANS ORIGINATED
5
$210,436
1,913
$201,815
543
$220,263
157
$111,247
20
$1,542,060
592
$206,095
6
$44,225
APPLICATIONS APPROVED, NOT ACCEPTED
2
$162,855
255
$182,867
93
$226,082
34
$82,710
4
$538,515
79
$168,410
14
$61,108
APPLICATIONS DENIED
6
$126,330
315
$168,053
305
$206,779
142
$69,656
2
$715,510
148
$203,428
24
$52,877
APPLICATIONS WITHDRAWN
2
$355,080
156
$204,250
195
$173,467
59
$57,493
1
$500,000
67
$185,339
0
$0
FILES CLOSED FOR INCOMPLETENESS
0
$0
99
$195,607
75
$255,626
8
$66,056
1
$1,829,160
41
$151,212
0
$0
Aggregated Statistics For Year 2006 (Based on 18 full and 4 partial tracts)
A) FHA, FSA/RHS & VA Home Purchase Loans
B) Conventional Home Purchase Loans
C) Refinancings
D) Home Improvement Loans
E) Loans on Dwellings For 5+ Families
F) Non-occupant Loans on < 5 Family Dwellings (A B C & D)
G) Loans On Manufactured Home Dwelling (A B C & D)
Number
Average Value
Number
Average Value
Number
Average Value
Number
Average Value
Number
Average Value
Number
Average Value
Number
Average Value
LOANS ORIGINATED
16
$165,261
2,486
$162,479
563
$193,708
157
$74,629
33
$1,718,691
905
$143,750
14
$47,923
APPLICATIONS APPROVED, NOT ACCEPTED
2
$199,660
306
$133,281
109
$171,242
51
$39,279
0
$0
110
$125,945
11
$45,905
APPLICATIONS DENIED
2
$119,360
434
$107,814
280
$165,182
127
$72,562
0
$0
244
$131,908
24
$50,853
APPLICATIONS WITHDRAWN
8
$128,365
313
$132,374
230
$156,391
27
$84,896
0
$0
122
$128,334
0
$0
FILES CLOSED FOR INCOMPLETENESS
0
$0
68
$180,922
63
$154,166
5
$38,196
2
$679,930
32
$160,255
0
$0
Aggregated Statistics For Year 2005 (Based on 18 full and 4 partial tracts)
A) FHA, FSA/RHS & VA Home Purchase Loans
B) Conventional Home Purchase Loans
C) Refinancings
D) Home Improvement Loans
E) Loans on Dwellings For 5+ Families
F) Non-occupant Loans on < 5 Family Dwellings (A B C & D)
G) Loans On Manufactured Home Dwelling (A B C & D)
Number
Average Value
Number
Average Value
Number
Average Value
Number
Average Value
Number
Average Value
Number
Average Value
Number
Average Value
LOANS ORIGINATED
20
$105,110
1,916
$146,731
730
$161,777
170
$66,595
33
$2,312,223
687
$137,519
0
$0
APPLICATIONS APPROVED, NOT ACCEPTED
3
$186,883
227
$126,986
88
$166,369
46
$38,178
0
$0
77
$124,469
11
$43,372
APPLICATIONS DENIED
4
$111,608
334
$145,925
343
$152,744
115
$70,512
3
$5,007,553
165
$124,890
17
$42,024
APPLICATIONS WITHDRAWN
2
$96,530
304
$131,465
302
$152,411
53
$158,335
0
$0
110
$110,171
2
$37,580
FILES CLOSED FOR INCOMPLETENESS
0
$0
54
$143,107
167
$175,937
4
$165,515
0
$0
33
$159,188
0
$0
Aggregated Statistics For Year 2004 (Based on 18 full and 4 partial tracts)
A) FHA, FSA/RHS & VA Home Purchase Loans
B) Conventional Home Purchase Loans
C) Refinancings
D) Home Improvement Loans
E) Loans on Dwellings For 5+ Families
F) Non-occupant Loans on < 5 Family Dwellings (A B C & D)
G) Loans On Manufactured Home Dwelling (A B C & D)
Number
Average Value
Number
Average Value
Number
Average Value
Number
Average Value
Number
Average Value
Number
Average Value
Number
Average Value
LOANS ORIGINATED
45
$140,068
1,538
$141,458
1,106
$145,613
123
$63,877
21
$978,744
454
$139,846
4
$89,415
APPLICATIONS APPROVED, NOT ACCEPTED
0
$0
204
$130,554
163
$135,671
46
$89,891
0
$0
50
$127,245
12
$42,838
APPLICATIONS DENIED
7
$124,916
292
$121,807
539
$124,867
146
$68,318
1
$500,000
158
$127,054
36
$44,160
APPLICATIONS WITHDRAWN
24
$115,558
192
$151,839
356
$143,437
35
$81,881
0
$0
66
$132,422
2
$53,405
FILES CLOSED FOR INCOMPLETENESS
0
$0
68
$117,192
165
$160,922
9
$80,283
0
$0
18
$116,981
0
$0
Aggregated Statistics For Year 2003 (Based on 18 full and 4 partial tracts)
A) FHA, FSA/RHS & VA Home Purchase Loans
B) Conventional Home Purchase Loans
C) Refinancings
D) Home Improvement Loans
E) Loans on Dwellings For 5+ Families
F) Non-occupant Loans on < 5 Family Dwellings (A B C & D)
Number
Average Value
Number
Average Value
Number
Average Value
Number
Average Value
Number
Average Value
Number
Average Value
LOANS ORIGINATED
87
$128,061
1,114
$140,995
2,770
$137,967
174
$57,722
21
$1,474,898
510
$128,380
APPLICATIONS APPROVED, NOT ACCEPTED
2
$136,500
135
$124,621
334
$117,538
44
$75,172
2
$716,780
62
$133,033
APPLICATIONS DENIED
16
$133,439
221
$81,508
805
$127,919
115
$50,183
6
$864,747
171
$126,513
APPLICATIONS WITHDRAWN
16
$102,027
171
$150,240
588
$137,233
23
$50,141
0
$0
88
$121,684
FILES CLOSED FOR INCOMPLETENESS
4
$134,342
24
$167,190
78
$144,816
9
$72,812
0
$0
21
$134,281
Aggregated Statistics For Year 2002 (Based on 12 full tracts)
A) FHA, FSA/RHS & VA Home Purchase Loans
B) Conventional Home Purchase Loans
C) Refinancings
D) Home Improvement Loans
E) Loans on Dwellings For 5+ Families
F) Non-occupant Loans on < 5 Family Dwellings (A B C & D)
Number
Average Value
Number
Average Value
Number
Average Value
Number
Average Value
Number
Average Value
Number
Average Value
LOANS ORIGINATED
73
$119,086
748
$128,929
1,335
$133,409
171
$43,249
16
$5,767,054
301
$117,874
APPLICATIONS APPROVED, NOT ACCEPTED
2
$94,425
97
$91,897
163
$114,905
38
$34,427
0
$0
22
$125,460
APPLICATIONS DENIED
9
$93,933
163
$64,829
219
$113,531
82
$38,423
2
$1,766,990
52
$94,275
APPLICATIONS WITHDRAWN
9
$130,648
69
$145,856
313
$129,822
15
$16,855
3
$1,963,827
42
$132,797
FILES CLOSED FOR INCOMPLETENESS
2
$159,230
26
$116,180
64
$134,799
4
$8,902
2
$989,000
11
$141,777
Aggregated Statistics For Year 2001 (Based on 12 full tracts)
A) FHA, FSA/RHS & VA Home Purchase Loans
B) Conventional Home Purchase Loans
C) Refinancings
D) Home Improvement Loans
E) Loans on Dwellings For 5+ Families
F) Non-occupant Loans on < 5 Family Dwellings (A B C & D)
Number
Average Value
Number
Average Value
Number
Average Value
Number
Average Value
Number
Average Value
Number
Average Value
LOANS ORIGINATED
96
$123,146
709
$130,429
963
$130,555
136
$40,713
16
$3,973,888
302
$120,415
APPLICATIONS APPROVED, NOT ACCEPTED
2
$188,980
96
$85,594
146
$102,304
38
$39,811
0
$0
32
$109,505
APPLICATIONS DENIED
4
$62,672
176
$65,403
226
$107,650
69
$23,390
3
$927,667
42
$106,396
APPLICATIONS WITHDRAWN
9
$112,129
76
$134,372
220
$120,229
24
$31,022
2
$2,002,725
19
$104,841
FILES CLOSED FOR INCOMPLETENESS
2
$121,795
24
$107,955
66
$133,762
2
$105,245
2
$888,660
14
$132,473
Aggregated Statistics For Year 2000 (Based on 12 full tracts)
A) FHA, FSA/RHS & VA Home Purchase Loans
B) Conventional Home Purchase Loans
C) Refinancings
D) Home Improvement Loans
E) Loans on Dwellings For 5+ Families
F) Non-occupant Loans on < 5 Family Dwellings (A B C & D)
Number
Average Value
Number
Average Value
Number
Average Value
Number
Average Value
Number
Average Value
Number
Average Value
LOANS ORIGINATED
76
$103,657
741
$117,151
242
$100,922
138
$38,869
11
$765,335
160
$105,663
APPLICATIONS APPROVED, NOT ACCEPTED
13
$32,298
104
$80,771
60
$73,135
42
$38,915
0
$0
6
$59,662
APPLICATIONS DENIED
20
$71,334
276
$65,489
100
$72,396
39
$28,519
2
$938,030
26
$77,600
APPLICATIONS WITHDRAWN
7
$92,391
100
$124,568
100
$97,735
11
$34,124
2
$1,780,965
15
$101,027
FILES CLOSED FOR INCOMPLETENESS
7
$89,189
17
$137,404
42
$111,103
3
$12,567
0
$0
6
$94,692
Aggregated Statistics For Year 1999 (Based on 8 full and 1 partial tracts)
A) FHA, FSA/RHS & VA Home Purchase Loans
B) Conventional Home Purchase Loans
C) Refinancings
D) Home Improvement Loans
E) Loans on Dwellings For 5+ Families
F) Non-occupant Loans on < 5 Family Dwellings (A B C & D)
2002 - 2018 National Fire Incident Reporting System (NFIRS) incidents
According to the data from the years 2002 - 2018 the average number of fire incidents per year is 134. The highest number of fires - 184 took place in 2007, and the least - 21 in 2017. The data has a growing trend.
When looking into fire subcategories, the most reports belonged to: Outside Fires (53.5%), and Structure Fires (26.3%).
Fire incident types reported to NFIRS in Zip Code 78704


 Nearest zip codes: 78701, 78745, 78703, 78712, 78741, 78702.


 According to the data from the years 2002 - 2018 the average number of fire incidents per year is 134. The highest number of fires - 184 took place in 2007, and the least - 21 in 2017. The data has a growing trend.
 When looking into fire subcategories, the most reports belonged to: Outside Fires (53.5%), and Structure Fires (26.3%).