Estimated zip code population in 2022: 26,414 Zip code population in 2010: 21,334 Zip code population in 2000: 22,534
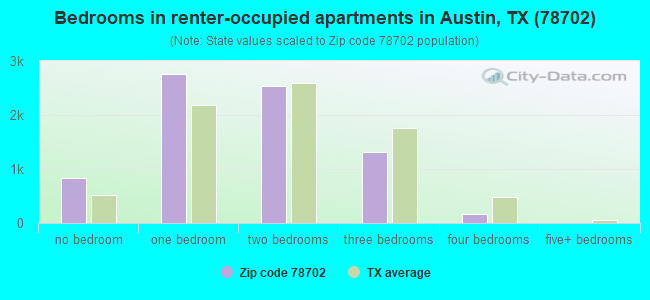
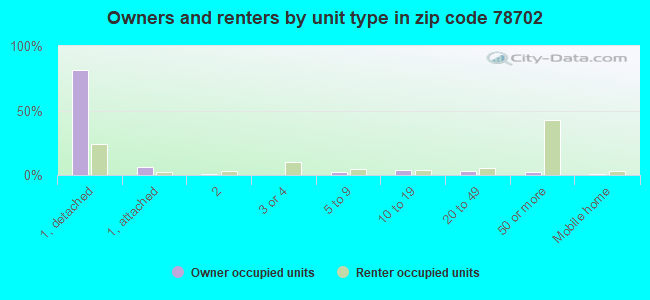
Houses and condos: 13,978 Renter-occupied apartments: 7,540
% of renters here:
58%
State:
38%
March 2022 cost of living index in zip code 78702: 97.6 (near average, U.S. average is 100)
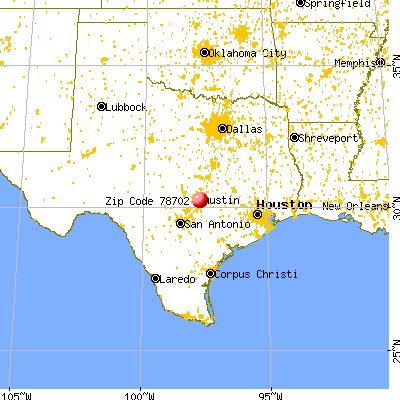
Land area: 5.0 sq. mi. Water area: 0.2 sq. mi.
Population density: 5,285 people per square mile
(average).
OSM Map
General Map
Google Map
MSN Map
OSM Map
General Map
Google Map
MSN Map
OSM Map
General Map
Google Map
MSN Map
OSM Map
General Map
Google Map
MSN Map
Please wait while loading the map...
Real estate property taxes paid for housing units in 2022:
This zip code:
1.3% ($8,680)
Texas:
1.5% ($4,050)
Median real estate property taxes paid for housing units with mortgages in 2022: $9,242 (1.4%) Median real estate property taxes paid for housing units with no mortgage in 2022: $7,548 (1.2%)
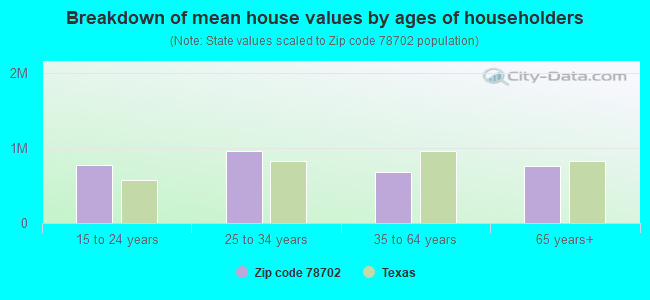
Estimated median house/condo value in 2022: $659,224
78702:
$659,224
Texas:
$275,400
According to our research of Texas and other state lists, there were 59 registered sex offenders living in 78702 zip code as of April 27, 2024. The ratio of all residents to sex offenders in zip code 78702 is 389 to 1. The ratio of registered sex offenders to all residents in this zip code is near the state average.
Median resident age:
This zip code:
34.9 years
Texas median age:
35.6 years
Average household size:
This zip code:
2.0 people
Texas:
2.6 people
Averages for the 2020 tax year for zip code 78702, filed in 2021:
Average Adjusted Gross Income (AGI) in 2020: $93,850 (Individual Income Tax Returns)
Here:
$93,850
State:
$77,054
Salary/wage: $81,066 (reported on 88.5% of returns)
Here:
$81,066
State:
$62,766
(% of AGI for various income ranges: 1115.7% for AGIs below $25k, 3787.4% for AGIs $25k-50k, 6955.5% for AGIs $50k-75k, 10879.6% for AGIs $75k-100k, 21195.3% for AGIs $100k-200k, 101419.4% for AGIs over 200k)
Taxable interest for individuals: $1,153 (reported on 26.6% of returns)
This zip code:
$1,153
Texas:
$2,665
(% of AGI for various income ranges: 5.8% for AGIs below $25k, 6.2% for AGIs $25k-50k, 13.2% for AGIs $50k-75k, 24.1% for AGIs $75k-100k, 60.7% for AGIs $100k-200k, 771.1% for AGIs over 200k)
Ordinary dividends: $4,899 (reported on 25.6% of returns)
Here:
$4,899
State:
$10,044
(% of AGI for various income ranges: 14.3% for AGIs below $25k, 18.8% for AGIs $25k-50k, 45.1% for AGIs $50k-75k, 106.3% for AGIs $75k-100k, 224.4% for AGIs $100k-200k, 3399.2% for AGIs over 200k)
Net capital gain/loss in AGI: +$25,617 (reported on 25.5% of returns)
Here:
+$25,617
State:
+$39,590
(% of AGI for various income ranges: 12.1% for AGIs below $25k, 35.6% for AGIs $25k-50k, 123.7% for AGIs $50k-75k, 168.5% for AGIs $75k-100k, 722.7% for AGIs $100k-200k, 22216.1% for AGIs over 200k)
Profit/loss from business: +$18,763 (reported on 19.7% of returns)
Here:
+$18,763
State:
+$10,888
(% of AGI for various income ranges: 229.7% for AGIs below $25k, 230.6% for AGIs $25k-50k, 319.3% for AGIs $50k-75k, 378.9% for AGIs $75k-100k, 837.7% for AGIs $100k-200k, 5465.8% for AGIs over 200k)
Taxable individual retirement arrangement distribution: $18,925 (reported on 3.0% of returns)
78702:
$18,925
Texas:
$24,740
(% of AGI for various income ranges: 11.9% for AGIs below $25k, 25.7% for AGIs $25k-50k, 45.3% for AGIs $50k-75k, 49.3% for AGIs $75k-100k, 167.4% for AGIs $100k-200k, 979.7% for AGIs over 200k)
Self-employed (Keogh) retirement plans: $21,108 (reported on 0.9% of returns)
78702:
$21,108
Texas:
$29,298
(% of AGI for various income ranges: 7.8% for AGIs $25k-50k, 39.9% for AGIs $100k-200k, 544.2% for AGIs over 200k)
Total itemized deductions: $26,976 (reported on 10.9% of returns)
Here:
$26,976
State:
$40,428
(% of AGI for various income ranges: 32.3% for AGIs below $25k, 80.9% for AGIs $25k-50k, 176.5% for AGIs $50k-75k, 335.1% for AGIs $75k-100k, 892.3% for AGIs $100k-200k, 5639.4% for AGIs over 200k)
Charity contributions: $6,961 (reported on 7.4% of returns)
Here:
$6,961
State:
$18,201
(% of AGI for various income ranges: 2.5% for AGIs below $25k, 10.4% for AGIs $25k-50k, 15.8% for AGIs $50k-75k, 32.1% for AGIs $75k-100k, 79.5% for AGIs $100k-200k, 1494.7% for AGIs over 200k)
Taxes paid: $8,614 (reported on 10.9% of returns)
78702:
$8,614
State:
$7,821
(% of AGI for various income ranges: 9.1% for AGIs below $25k, 24.4% for AGIs $25k-50k, 61.6% for AGIs $50k-75k, 128.8% for AGIs $75k-100k, 332.7% for AGIs $100k-200k, 1510.8% for AGIs over 200k)
Earned income credit: $2,127 (reported on 13.6% of returns)
Here:
$2,127
State:
$2,584
(% of AGI for various income ranges: 109.9% for AGIs below $25k, 46.4% for AGIs $25k-50k)
Percentage of individuals using paid preparers for their 2020 taxes: 94.5%
Here:
94%
State:
92%
(% for various income ranges: 92.4% for AGIs below $25k, 94.1% for AGIs $25k-50k, 95.3% for AGIs $50k-75k, 95.5% for AGIs $75k-100k, 95.6% for AGIs $100k-200k, 96.1% for AGIs over 200k)
Averages for the 2012 tax year for zip code 78702, filed in 2013:
Average Adjusted Gross Income (AGI) in 2012: $38,505 (Individual Income Tax Returns)
Here:
$38,505
State:
$65,384
Salary/wage: $35,326 (reported on 87.7% of returns)
Here:
$35,326
State:
$52,524
(% of AGI for various income ranges: 79.9% for AGIs below $25k, 88.2% for AGIs $25k-50k, 85.5% for AGIs $50k-75k, 82.8% for AGIs $75k-100k, 80.9% for AGIs $100k-200k, 55.8% for AGIs over 200k)
Taxable interest for individuals: $480 (reported on 16.1% of returns)
This zip code:
$480
Texas:
$2,372
(% of AGI for various income ranges: 0.2% for AGIs below $25k, 0.2% for AGIs $25k-50k, 0.1% for AGIs $50k-75k, 0.2% for AGIs $75k-100k, 0.2% for AGIs $100k-200k, 0.4% for AGIs over 200k)
Ordinary dividends: $3,450 (reported on 10.0% of returns)
Here:
$3,450
State:
$9,721
(% of AGI for various income ranges: 0.8% for AGIs below $25k, 0.6% for AGIs $25k-50k, 0.8% for AGIs $50k-75k, 1.5% for AGIs $75k-100k, 0.7% for AGIs $100k-200k, 1.6% for AGIs over 200k)
Net capital gain/loss in AGI: +$19,898 (reported on 8.2% of returns)
Here:
+$19,898
State:
+$35,319
(% of AGI for various income ranges: 0.3% for AGIs $25k-50k, 0.8% for AGIs $50k-75k, 1.3% for AGIs $75k-100k, 2.3% for AGIs $100k-200k, 27.6% for AGIs over 200k)
Profit/loss from business: +$12,837 (reported on 19.8% of returns)
Here:
+$12,837
State:
+$13,732
(% of AGI for various income ranges: 13.5% for AGIs below $25k, 4.5% for AGIs $25k-50k, 6.2% for AGIs $50k-75k, 5.7% for AGIs $75k-100k, 5.8% for AGIs $100k-200k, 4.1% for AGIs over 200k)
Taxable individual retirement arrangement distribution: $11,590 (reported on 2.7% of returns)
78702:
$11,590
Texas:
$19,511
(% of AGI for various income ranges: 0.4% for AGIs below $25k, 0.5% for AGIs $25k-50k, 1.1% for AGIs $50k-75k, 1.0% for AGIs $75k-100k, 1.9% for AGIs $100k-200k)
Self-employment retirement plans: $13,900 (reported on 0.3% of returns)
78702:
$13,900
Texas:
$23,938
Total itemized deductions: $17,111 (19% of AGI, reported on 15.9% of returns)
Here:
$17,111
State:
$24,724
Here:
18.8% of AGI
State:
15.9% of AGI
(% of AGI for various income ranges: 3.3% for AGIs below $25k, 5.8% for AGIs $25k-50k, 8.5% for AGIs $50k-75k, 10.6% for AGIs $75k-100k, 9.8% for AGIs $100k-200k, 6.3% for AGIs over 200k)
Charity contributions: $2,564 (reported on 10.1% of returns)
Here:
$2,564
State:
$6,808
(% of AGI for various income ranges: 0.2% for AGIs below $25k, 0.4% for AGIs $25k-50k, 0.7% for AGIs $50k-75k, 0.9% for AGIs $75k-100k, 1.0% for AGIs $100k-200k, 1.3% for AGIs over 200k)
Taxes paid: $5,872 (reported on 15.6% of returns)
78702:
$5,872
State:
$6,921
(% of AGI for various income ranges: 1.2% for AGIs below $25k, 1.6% for AGIs $25k-50k, 2.8% for AGIs $50k-75k, 3.4% for AGIs $75k-100k, 3.4% for AGIs $100k-200k, 2.8% for AGIs over 200k)
Earned income credit: $2,184 (reported on 28.0% of returns)
Here:
$2,184
State:
$2,570
(% of AGI for various income ranges: 7.7% for AGIs below $25k, 1.1% for AGIs $25k-50k)
Percentage of individuals using paid preparers for their 2012 taxes: 33.8%
Here:
34%
State:
51%
(% for various income ranges: 33.9% for AGIs below $25k, 29.8% for AGIs $25k-50k, 33.0% for AGIs $50k-75k, 38.5% for AGIs $75k-100k, 44.2% for AGIs $100k-200k, 75.0% for AGIs over 200k)
Averages for the 2004 tax year for zip code 78702, filed in 2005:
Average Adjusted Gross Income (AGI) in 2004: $23,552 (Individual Income Tax Returns)
Here:
$23,552
State:
$47,881
Salary/wage: $22,287 (reported on 89.1% of returns)
Here:
$22,287
State:
$41,947
(% of AGI for various income ranges: 107.3% for AGIs below $10k, 87.3% for AGIs $10k-25k, 89.6% for AGIs $25k-50k, 83.9% for AGIs $50k-75k, 72.8% for AGIs $75k-100k, 42.1% for AGIs over 100k)
Taxable interest for individuals: $482 (reported on 15.6% of returns)
This zip code:
$482
Texas:
$2,255
(% of AGI for various income ranges: 1.2% for AGIs below $10k, 0.2% for AGIs $10k-25k, 0.3% for AGIs $25k-50k, 0.4% for AGIs $50k-75k, 0.2% for AGIs $75k-100k, 0.4% for AGIs over 100k)
Taxable dividends: $1,003 (reported on 4.9% of returns)
Here:
$1,003
State:
$4,261
(% of AGI for various income ranges: 0.4% for AGIs below $10k, 0.2% for AGIs $10k-25k, 0.1% for AGIs $25k-50k, 0.2% for AGIs $50k-75k, 0.1% for AGIs $75k-100k, 0.9% for AGIs over 100k)
Net capital gain/loss: +$6,914 (reported on 4.4% of returns)
Here:
+$6,914
State:
+$16,110
(% of AGI for various income ranges: 0.1% for AGIs below $10k, 0.2% for AGIs $10k-25k, 0.1% for AGIs $25k-50k, 1.5% for AGIs $50k-75k, 0.4% for AGIs $75k-100k, 12.3% for AGIs over 100k)
Profit/loss from business: +$8,306 (reported on 13.3% of returns)
Here:
+$8,306
State:
+$11,013
(% of AGI for various income ranges: 1.2% for AGIs below $10k, 5.8% for AGIs $10k-25k, 2.9% for AGIs $25k-50k, 4.4% for AGIs $50k-75k, 10.9% for AGIs $75k-100k, 8.0% for AGIs over 100k)
IRA payment deduction: $1,750 (reported on 0.7% of returns)
78702:
$1,750
Texas:
$3,120
Total itemized deductions: $12,814 (23% of AGI, reported on 9.0% of returns)
Here:
$12,814
State:
$19,631
Here:
23.0% of AGI
State:
18.9% of AGI
(% of AGI for various income ranges: 4.4% for AGIs below $10k, 2.2% for AGIs $10k-25k, 4.7% for AGIs $25k-50k, 7.6% for AGIs $50k-75k, 8.0% for AGIs $75k-100k, 9.2% for AGIs over 100k)
Charity contributions deductions: $2,138 (4% of AGI, reported on 6.4% of returns)
Here:
$2,138
State:
$4,753
Here:
3.8% of AGI
State:
4.2% of AGI
(% of AGI for various income ranges: 0.2% for AGIs below $10k, 0.3% for AGIs $10k-25k, 0.5% for AGIs $25k-50k, 1.2% for AGIs $50k-75k, 1.3% for AGIs $75k-100k, 0.9% for AGIs over 100k)
Total tax: $3,039 (reported on 58.3% of returns)
78702:
$3,039
State:
$9,058
(% of AGI for various income ranges: 2.9% for AGIs below $10k, 3.5% for AGIs $10k-25k, 6.5% for AGIs $25k-50k, 10.0% for AGIs $50k-75k, 14.5% for AGIs $75k-100k, 21.0% for AGIs over 100k)
Earned income credit: $1,933 (reported on 36.7% of returns)
Here:
$1,933
State:
$2,024
Percentage of individuals using paid preparers for their 2004 taxes: 57.5%
Here:
57%
State:
57%
(% for various income ranges: 57.3% for AGIs below $10k, 62.0% for AGIs $10k-25k, 53.0% for AGIs $25k-50k, 51.4% for AGIs $50k-75k, 41.4% for AGIs $75k-100k, 63.2% for AGIs over 100k)
Likely homosexual households (counted as self-reported same-sex unmarried-partner households)
Lesbian couples: 0.2% of all households
Gay men: 0.3% of all households
Household received Food Stamps/SNAP in the past 12 months: 1,994 Household did not receive Food Stamps/SNAP in the past 12 months: 11,077
Women who had a birth in the past 12 months: 201 (120 now married, 80 unmarried) Women who did not have a birth in the past 12 months: 7,970 (2,241 now married, 5,768 unmarried)
Housing units in zip code 78702 with a mortgage: 3,621 (371 second mortgage, 266 both second mortgage and home equity loan) Houses without a mortgage: 63
Median monthly owner costs for units with a mortgage: $2,711 Median monthly owner costs for units without a mortgage: $984
Residents with income below the poverty level in 2022:
This zip code:
20.9%
Whole state:
14.0%
Residents with income below 50% of the poverty level in 2022:
This zip code:
9.6%
Whole state:
7.4%
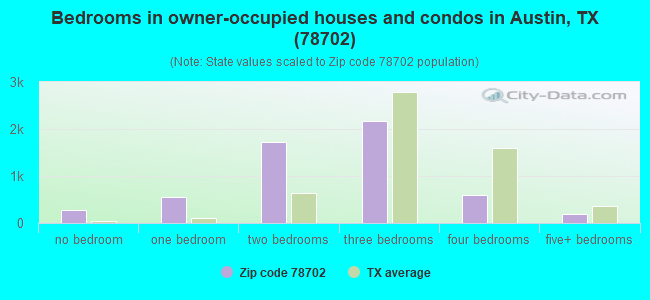
Median number of rooms in houses and condos:
Here:
5.0
State:
6.3
Median number of rooms in apartments:
Here:
3.3
State:
4.0
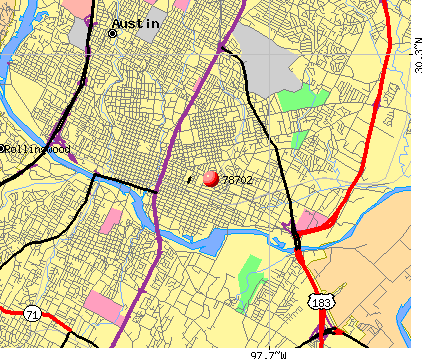
Notable locations in this zip code not listed on our city pages
Notable locations in zip code 78702: Willow-Spence Streets Historic District (A), Swedish Hill Historic District (B), City of Austin Electric Utility (C), Holly Street Power Plant (D), East Austin Community Center (E), Evans Industrial Building (F), Floyd McGown House (G), George A Peterson House (H), Genaro P and Carolina Briones House (I), French Legation (J), Haynes-DeLashwah House (K), Haehnel Building (L), Guerrero Produce Company (M), Huston Tillotson College Administration Building (N), John Henry and Minnie Tate Brewer House (O), John W Maddox House (P), Joseph O Polhemus House (Q), Lindeman House (R), Agard Lovinggood Administration Building (S), Allen Frazier Residence Hall (T). Display/hide their locations on the map
Churches in zip code 78702 include: Wesley United Methodist Church (A), First Mexican Baptist Church (B), Ebenezer Baptist Church (C), Betania Baptist Church (D), Austin Baptist Chapel Church (E), Adam and Eve Garden Baptist Church (F), Greater Mount Zion Baptist Church Fellowship Hall (G), Holy Cross Catholic Church (H), Christo Rey Catholic Church (I). Display/hide their locations on the map
Parks in zip code 78702 include: Zargosa Park (1), Kealing Park (2), Lott Park (3), Rosewood Park (4), Fiesta Gardens (5), Pan American Playground (6), Metz Park (7), Festival Beach (8), Downs Park (9). Display/hide their locations on the map
Tourist attraction (not listed on the city page) : Avila Tours (Tours & Charters; 2009 East 7th Street).
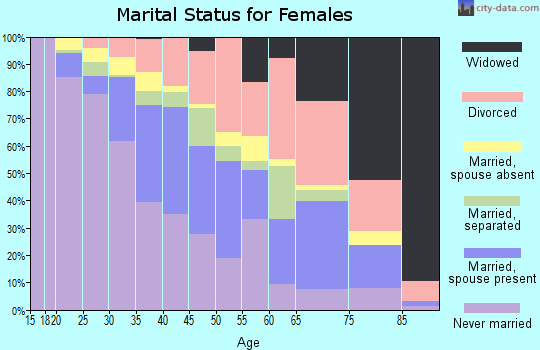
1,469 married couples with children.
1,846 single-parent households (441 men, 1,405 women).
76.9% of residents of 78702 zip code speak English at home.
17.9% of residents speak Spanish at home (81% very well, 11% well, 7% not well, 2% not at all).
2.3% of residents speak other Indo-European language at home (97% very well, 2% well, 1% not well).
1.3% of residents speak Asian or Pacific Island language at home (97% very well, 3% not well).
1.6% of residents speak other language at home (71% very well, 12% well, 16% not well).
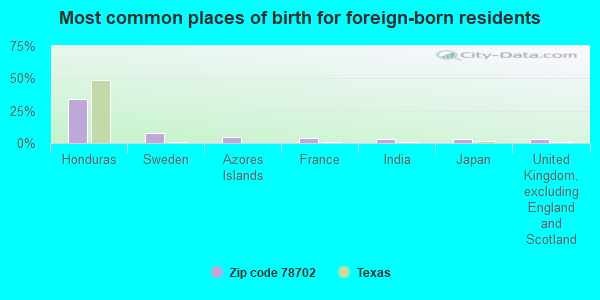
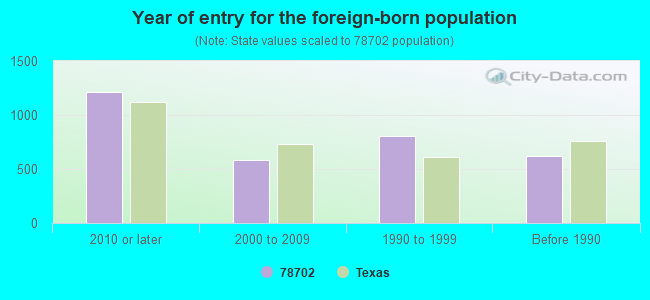
Foreign born population: 2,696 (10.2%) (41.9% of them are naturalized citizens)
Major facilities with environmental interests located in this zip code:
AUSTIN ISD (1607 PENNSYLVANIA AVE in AUSTIN, TX)
(National Center for Education Statistics) - STATE ID-227901044 (Resource Conservation and Recovery Act (tracking hazardous waste)) Alternative names: KEALING JR HIGH SCH, KEALING JUNIOR HIGH
AUSTIN ISD (1601 HASKELL ST in AUSTIN, TX)
(National Center for Education Statistics) - STATE ID-227901051 (Resource Conservation and Recovery Act (tracking hazardous waste)) Alternative names: MARTIN JUNIOR HIGH SCHOOL, MARTIN JUNIOR JUNIOR HIGH SCHOOL
AUSTIN ISD (BROOKE ELEM) (3100 E 4TH STREET in AUSTIN, TX)
COMPLIANCE ACTIVITY (Tracking inspections of insecticide, fungicide, and rodenticide, and toxic substances) (National Center for Education Statistics) - STATE ID-227901108
ACCO WASTE PAPER (4712 BOLM RD in AUSTIN, TX)
(Resource Conservation and Recovery Act (tracking hazardous waste))
AMERICAN TELEPOHNE AND TELEGRAPH CORPORA (10TH & LYNN STREET in AUSTIN, TX)
(Resource Conservation and Recovery Act (tracking hazardous waste)) Alternative names: AMERICAN TEL & TEL CO LONG LINES
ATLAS CLEANERS (1107 E 6TH in AUSTIN, TX)
(Resource Conservation and Recovery Act (tracking hazardous waste)) Alternative names: ATLAS CLNRS
AUSTIN AIR AND HYD (2001 E MARTIN LUTHER KING JR BLVD in AUSTIN, TX)
(Resource Conservation and Recovery Act (tracking hazardous waste))
AUSTIN ARCHITECTURAL GRAPHICS (516 NAVASOTA ST in AUSTIN, TX)
(Resource Conservation and Recovery Act (tracking hazardous waste)) Business NAICS classification: OTHER BUSINESS SERVICE CENTERS (INCLUDING COPY SHOPS).
AUSTIN BODY WORKS INC (1310 E 6TH ST in AUSTIN, TX)
(Resource Conservation and Recovery Act (tracking hazardous waste))
AUSTIN CITY SC4 (2600 WEBBERVILLE ROAD in AUSTIN, TX)
(Resource Conservation and Recovery Act (tracking hazardous waste)) Organizations: CITY OF AUSTIN (CONTACT/OPERATOR)
AUSTIN COMMUNITY COLLEGE (900 THOMPSON ST in AUSTIN, TX)
(Resource Conservation and Recovery Act (tracking hazardous waste)) Alternative names: AUSTIN COMMUNITY COLLEGE-RIDGEVIEW
AUSTIN DRIVE TRAIN INC (764 AIRPORT BLVD in AUSTIN, TX)
(Resource Conservation and Recovery Act (tracking hazardous waste))
AUSTIN ISD (2406 ROSEWOOD AVE in AUSTIN, TX)
(Resource Conservation and Recovery Act (tracking hazardous waste)) Alternative names: F R RICE SCHOOL
Housing units lacking complete plumbing facilities: 0.2% Housing units lacking complete kitchen facilities: 0.4%
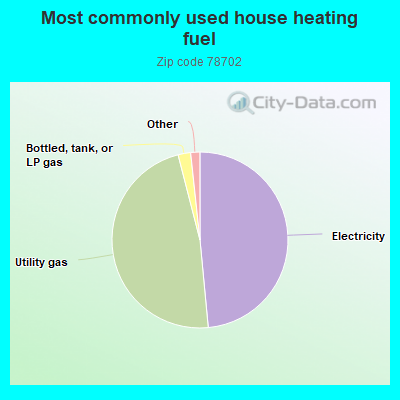
48.5%Electricity
47.5%Utility gas
2.3%Bottled, tank, or LP gas
0.6%Fuel oil, kerosene, etc.
0.6%Other fuel
Population in 1990: 21,432. Population change in the 1990s: +1,102 (+5.1%).
Place of birth for U.S.-born residents:
This state: 13,885
Northeast: 2,139
Midwest: 1,993
South: 2,600
West: 2,695
63% of the 78702 zip code residents lived in the same house 5 years ago. Out of people who lived in different houses, 75% lived in this county. Out of people who lived in different counties, 50% lived in Texas.
75% of the 78702 zip code residents lived in the same house 1 year ago. Out of people who lived in different houses, 54% moved from this county. Out of people who lived in different houses, 11% moved from different county within same state. Out of people who lived in different houses, 29% moved from different state. Out of people who lived in different houses, 5% moved from abroad.
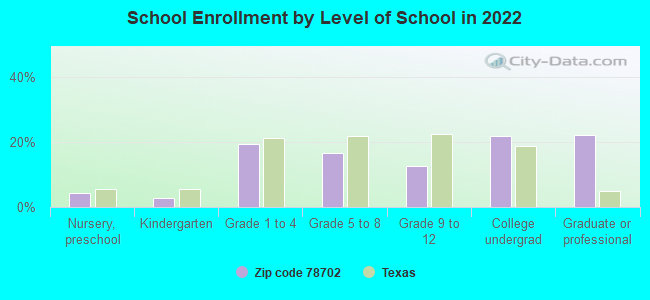
Private vs. public school enrollment:
Students in private schools in grades 1 to 8 (elementary and middle school): 253
Here:
13.8%
Texas:
8.8%
Students in private schools in grades 9 to 12 (high school): 216
Here:
33.0%
Texas:
8.0%
Students in private undergraduate colleges: 272
Here:
24.1%
Texas:
16.2%
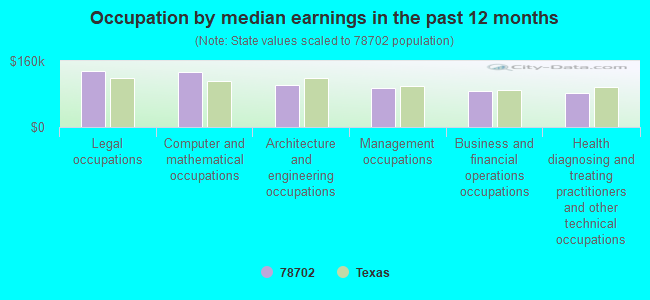
Occupation by median earnings in the past 12 months ($)
136,889Legal occupations
132,414Computer and mathematical occupations
100,722Architecture and engineering occupations
94,926Management occupations
87,985Business and financial operations occupations
82,759Health diagnosing and treating practitioners and other technical occupations
Companies with federal contracts located in this zip code (AUSTIN, TX):
ALLIANT FOODSERVICE, INC (979 SPRINGDALE RD) : $4,620,971 in 29 contractsfrom 2000 to 2006
Contracts for Food Items For Resale, Fruits and Vegetables, Food Cooking, Baking, and Serving Equipment, Condiments and Related Products, and moreby Army, Air Force Signed by year:2000: $30,883; 2001: $0; 2002: $1,495,000; 2003: $2,444,840; 2004: $503,452; 2005: $76,256; 2006: $70,540.
Biggest contracts:
$1,945,000 with Army for Food Items For Resale. Signed on 2003-10-27. Completion date: 2004-09-30.
$1,495,000, same as above.Signed on 2002-10-21. Completion date: 2003-09-30.
$476,000, same as above.Signed on 2003-06-11. Completion date: 2003-09-30.
$373,000 with Army for Fruits and Vegetables. Signed on 2004-04-02. Completion date: 2004-09-30.
CAPITAL METROPOLITAN TRANSPORT (2910 E 5TH ST) : $185,553 in 5 contractsfrom 2001 to 2005
Contracts for Traffic and Transit Signal Systems, Miscellaneous Items, Transport Vessels-Passenger And Troop, Passenger Motor Vehicles by Immediate Office of the Secretary of Transportation, Army Signed by year:2000: $0; 2001: $95,000; 2002: $0; 2003: $40,000; 2004: $45,600; 2005: $4,953; 2006: $0.
Biggest contracts:
$95,000 with Immediate Office of the Secretary of Transportation for Traffic and Transit Signal Systems. Taking place in DC. Signed on 2001-10-15. Completion date: 2002-09-15.
$40,000 with Immediate Office of the Secretary of Transportation for Miscellaneous Items. Taking place in DC. Signed on 2004-12-06. Completion date: 2005-09-30.
$40,000 with Immediate Office of the Secretary of Transportation for Transport Vessels-Passenger And Troop. Taking place in DC. Signed on 2003-10-31. Completion date: 2004-09-30.
$5,600 with Army for Passenger Motor Vehicles. Signed on 2004-07-16. Completion date: 2004-07-18.
AUSTIN HABITAT FOR HUMANITY IN (310 COMAL)
$67,614 with Army for Demolition of Buildings. Signed on 2004-07-02. Completion date: 2004-11-01.
501 GROUP (4822 E CESAR CHAVEZ; small business)
$30,578 with Army for Lease or Rental of Equipment -- Electrical and Electronic Equipment Components. Signed on 2005-04-08. Completion date: 2005-04-14.
INDUSTRIAL OVERHEAD DOOR, INC (5215 E CESAR CHAVEZ; small business)
$5,301 with Army for Maintenance, Repair and Rebuilding of Equipment -- Miscellaneous. Signed on 2004-04-21. Completion date: 2004-05-14.
LONGHORN INTERNATIONAL EQUIPME (4711 E 7TH ST; small business) : -$3,000 in 2 contractsin 2001
$0 with Army for Lease or Rental of Equipment -- Ground Effect Vehicles, Motor Vehicles, Trailers, and Cycles. Signed on 2001-12-18. Completion date: 2001-03-02.
-$3,000, same as above.Signed on 2001-12-18. Completion date: 2001-03-02.
Top industries in this zip code by the number of employees in 2005:
Administrative and Support and Waste Management and Remediation Services: Temporary Help Services (500-999 employees: 1 establishment, 50-99 employees: 1 establishment)
Health Care and Social Assistance: Services for the Elderly and Persons with Disabilities (250-499: 2, 20-49: 1)
2002 - 2018 National Fire Incident Reporting System (NFIRS) incidents
According to the data from the years 2002 - 2018 the average number of fire incidents per year is 112. The highest number of fires - 168 took place in 2008, and the least - 14 in 2017. The data has a dropping trend.
When looking into fire subcategories, the most reports belonged to: Outside Fires (57.5%), and Structure Fires (22.9%).
Fire incident types reported to NFIRS in Zip Code 78702


 Nearest zip codes: 78712, 78722, 78701, 78721, 78741, 78705.


 According to the data from the years 2002 - 2018 the average number of fire incidents per year is 112. The highest number of fires - 168 took place in 2008, and the least - 14 in 2017. The data has a dropping trend.
 When looking into fire subcategories, the most reports belonged to: Outside Fires (57.5%), and Structure Fires (22.9%).