Estimated zip code population in 2022: 23,278 Zip code population in 2010: 19,690 Zip code population in 2000: 19,585
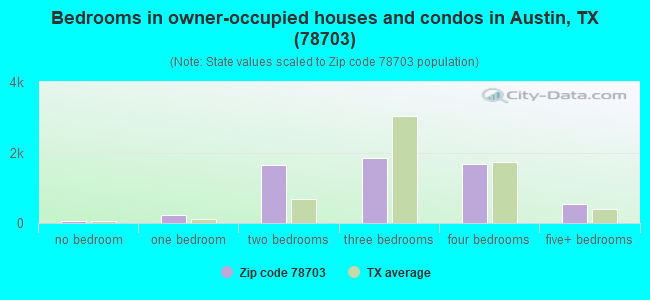
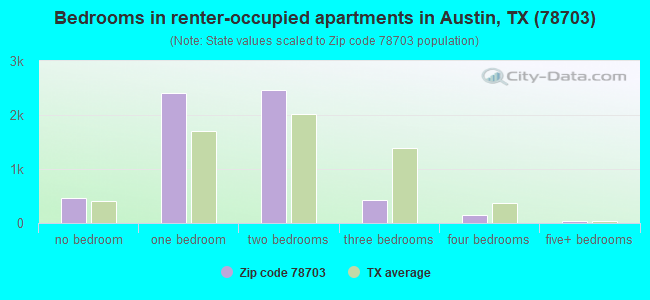
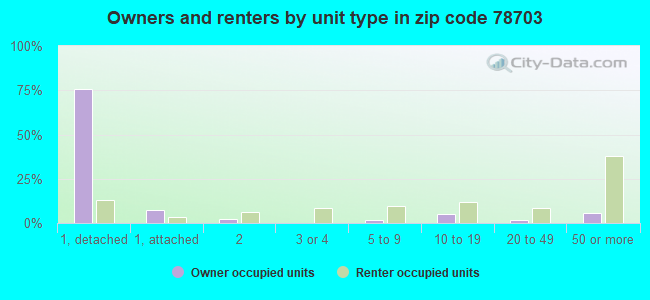
Houses and condos: 12,844 Renter-occupied apartments: 5,929
% of renters here:
50%
State:
38%
March 2022 cost of living index in zip code 78703: 101.2 (near average, U.S. average is 100)
Land area: 5.6 sq. mi. Water area: 0.3 sq. mi.
Population density: 4,170 people per square mile
(average).
OSM Map
General Map
Google Map
MSN Map
OSM Map
General Map
Google Map
MSN Map
OSM Map
General Map
Google Map
MSN Map
OSM Map
General Map
Google Map
MSN Map
Please wait while loading the map...
Real estate property taxes paid for housing units in 2022:
This zip code:
0.8% ($10,460)
Texas:
1.5% ($4,050)
Median real estate property taxes paid for housing units with mortgages in 2022: $10,505 (0.7%) Median real estate property taxes paid for housing units with no mortgage in 2022: $10,700 (0.9%)
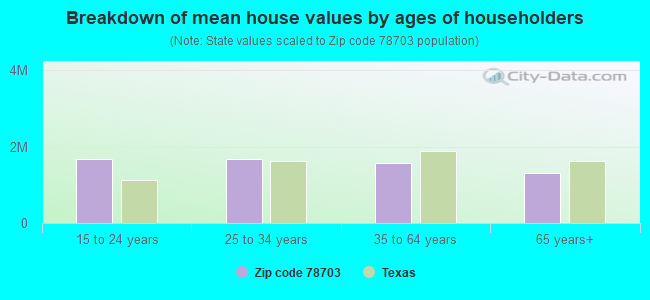
Estimated median house/condo value in 2022: $1,381,860
78703:
$1,381,860
Texas:
$275,400
According to our research of Texas and other state lists, there was 1 registered sex offender living in 78703 zip code as of April 27, 2024. The ratio of all residents to sex offenders in zip code 78703 is 21,113 to 1. The ratio of registered sex offenders to all residents in this zip code is much lower than the state average.
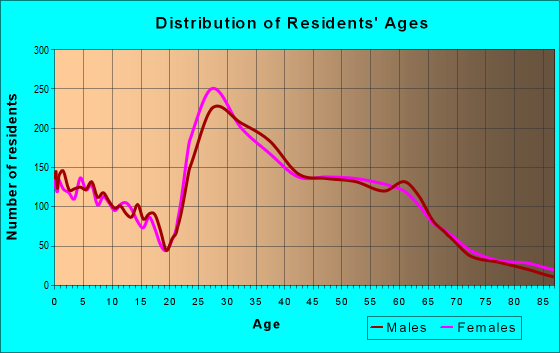
Median resident age:
This zip code:
40.3 years
Texas median age:
35.6 years
Average household size:
This zip code:
1.9 people
Texas:
2.6 people
Averages for the 2020 tax year for zip code 78703, filed in 2021:
Average Adjusted Gross Income (AGI) in 2020: $628,556 (Individual Income Tax Returns)
Here:
$628,556
State:
$77,054
Salary/wage: $190,441 (reported on 77.2% of returns)
Here:
$190,441
State:
$62,766
(% of AGI for various income ranges: 1447.4% for AGIs below $25k, 3957.9% for AGIs $25k-50k, 6977.0% for AGIs $50k-75k, 11048.0% for AGIs $75k-100k, 20292.9% for AGIs $100k-200k, 186487.0% for AGIs over 200k)
Taxable interest for individuals: $12,411 (reported on 55.0% of returns)
This zip code:
$12,411
Texas:
$2,665
(% of AGI for various income ranges: 50.0% for AGIs below $25k, 66.4% for AGIs $25k-50k, 100.0% for AGIs $50k-75k, 180.5% for AGIs $75k-100k, 402.5% for AGIs $100k-200k, 10243.0% for AGIs over 200k)
Ordinary dividends: $28,095 (reported on 54.3% of returns)
Here:
$28,095
State:
$10,044
(% of AGI for various income ranges: 184.9% for AGIs below $25k, 264.8% for AGIs $25k-50k, 367.1% for AGIs $50k-75k, 557.0% for AGIs $75k-100k, 1554.0% for AGIs $100k-200k, 21307.0% for AGIs over 200k)
Net capital gain/loss in AGI: +$316,798 (reported on 52.0% of returns)
Here:
+$316,798
State:
+$39,590
(% of AGI for various income ranges: 96.4% for AGIs below $25k, 278.4% for AGIs $25k-50k, 330.2% for AGIs $50k-75k, 632.5% for AGIs $75k-100k, 1811.0% for AGIs $100k-200k, 268413.2% for AGIs over 200k)
Profit/loss from business: +$51,608 (reported on 25.5% of returns)
Here:
+$51,608
State:
+$10,888
(% of AGI for various income ranges: 294.5% for AGIs below $25k, 398.0% for AGIs $25k-50k, 537.5% for AGIs $50k-75k, 737.0% for AGIs $75k-100k, 1570.5% for AGIs $100k-200k, 17110.0% for AGIs over 200k)
Taxable individual retirement arrangement distribution: $40,393 (reported on 9.6% of returns)
78703:
$40,393
Texas:
$24,740
(% of AGI for various income ranges: 58.1% for AGIs below $25k, 122.6% for AGIs $25k-50k, 187.2% for AGIs $50k-75k, 377.8% for AGIs $75k-100k, 826.6% for AGIs $100k-200k, 4354.5% for AGIs over 200k)
Self-employed (Keogh) retirement plans: $34,571 (reported on 4.8% of returns)
78703:
$34,571
Texas:
$29,298
(% of AGI for various income ranges: 86.0% for AGIs $75k-100k, 157.8% for AGIs $100k-200k, 2413.6% for AGIs over 200k)
Total itemized deductions: $152,441 (reported on 27.1% of returns)
Here:
$152,441
State:
$40,428
(% of AGI for various income ranges: 211.6% for AGIs below $25k, 229.6% for AGIs $25k-50k, 466.6% for AGIs $50k-75k, 801.8% for AGIs $75k-100k, 1816.4% for AGIs $100k-200k, 63705.3% for AGIs over 200k)
Charity contributions: $131,692 (reported on 23.4% of returns)
Here:
$131,692
State:
$18,201
(% of AGI for various income ranges: 14.8% for AGIs below $25k, 28.9% for AGIs $25k-50k, 72.4% for AGIs $50k-75k, 108.2% for AGIs $75k-100k, 429.7% for AGIs $100k-200k, 50190.8% for AGIs over 200k)
Taxes paid: $9,342 (reported on 27.0% of returns)
78703:
$9,342
State:
$7,821
(% of AGI for various income ranges: 51.7% for AGIs below $25k, 57.3% for AGIs $25k-50k, 120.9% for AGIs $50k-75k, 247.7% for AGIs $75k-100k, 498.5% for AGIs $100k-200k, 2898.3% for AGIs over 200k)
Earned income credit: $1,026 (reported on 3.5% of returns)
Here:
$1,026
State:
$2,584
(% of AGI for various income ranges: 27.6% for AGIs below $25k, 12.8% for AGIs $25k-50k)
Percentage of individuals using paid preparers for their 2020 taxes: 92.4%
Here:
92%
State:
92%
(% for various income ranges: 89.0% for AGIs below $25k, 91.9% for AGIs $25k-50k, 93.2% for AGIs $50k-75k, 92.4% for AGIs $75k-100k, 92.7% for AGIs $100k-200k, 94.0% for AGIs over 200k)
Averages for the 2012 tax year for zip code 78703, filed in 2013:
Average Adjusted Gross Income (AGI) in 2012: $242,979 (Individual Income Tax Returns)
Here:
$242,979
State:
$65,384
Salary/wage: $128,553 (reported on 77.7% of returns)
Here:
$128,553
State:
$52,524
(% of AGI for various income ranges: 71.1% for AGIs below $25k, 79.4% for AGIs $25k-50k, 71.2% for AGIs $50k-75k, 70.0% for AGIs $75k-100k, 65.5% for AGIs $100k-200k, 34.1% for AGIs over 200k)
Taxable interest for individuals: $6,732 (reported on 53.7% of returns)
This zip code:
$6,732
Texas:
$2,372
(% of AGI for various income ranges: 2.4% for AGIs below $25k, 0.8% for AGIs $25k-50k, 1.3% for AGIs $50k-75k, 1.3% for AGIs $75k-100k, 1.3% for AGIs $100k-200k, 1.5% for AGIs over 200k)
Ordinary dividends: $20,288 (reported on 46.5% of returns)
Here:
$20,288
State:
$9,721
(% of AGI for various income ranges: 10.0% for AGIs below $25k, 3.0% for AGIs $25k-50k, 3.6% for AGIs $50k-75k, 3.5% for AGIs $75k-100k, 4.0% for AGIs $100k-200k, 3.8% for AGIs over 200k)
Net capital gain/loss in AGI: +$131,784 (reported on 43.6% of returns)
Here:
+$131,784
State:
+$35,319
(% of AGI for various income ranges: 2.2% for AGIs below $25k, 1.9% for AGIs $25k-50k, 2.0% for AGIs $50k-75k, 1.9% for AGIs $75k-100k, 4.6% for AGIs $100k-200k, 28.7% for AGIs over 200k)
Profit/loss from business: +$45,032 (reported on 26.8% of returns)
Here:
+$45,032
State:
+$13,732
(% of AGI for various income ranges: 12.7% for AGIs below $25k, 7.0% for AGIs $25k-50k, 8.2% for AGIs $50k-75k, 7.9% for AGIs $75k-100k, 9.3% for AGIs $100k-200k, 4.0% for AGIs over 200k)
Taxable individual retirement arrangement distribution: $39,004 (reported on 10.6% of returns)
78703:
$39,004
Texas:
$19,511
(% of AGI for various income ranges: 2.1% for AGIs below $25k, 1.9% for AGIs $25k-50k, 2.5% for AGIs $50k-75k, 2.9% for AGIs $75k-100k, 3.2% for AGIs $100k-200k, 1.4% for AGIs over 200k)
Self-employment retirement plans: $29,886 (reported on 4.5% of returns)
78703:
$29,886
Texas:
$23,938
(% of AGI for various income ranges: 0.6% for AGIs below $25k, 0.7% for AGIs $50k-75k, 0.8% for AGIs $100k-200k, 0.6% for AGIs over 200k)
Total itemized deductions: $46,423 (10% of AGI, reported on 46.6% of returns)
Here:
$46,423
State:
$24,724
Here:
10.2% of AGI
State:
15.9% of AGI
(% of AGI for various income ranges: 18.7% for AGIs below $25k, 8.7% for AGIs $25k-50k, 12.5% for AGIs $50k-75k, 13.8% for AGIs $75k-100k, 16.3% for AGIs $100k-200k, 7.6% for AGIs over 200k)
Charity contributions: $12,727 (reported on 39.8% of returns)
Here:
$12,727
State:
$6,808
(% of AGI for various income ranges: 1.1% for AGIs below $25k, 0.8% for AGIs $25k-50k, 1.2% for AGIs $50k-75k, 1.6% for AGIs $75k-100k, 2.3% for AGIs $100k-200k, 2.2% for AGIs over 200k)
Taxes paid: $17,521 (reported on 45.8% of returns)
78703:
$17,521
State:
$6,921
(% of AGI for various income ranges: 5.9% for AGIs below $25k, 3.1% for AGIs $25k-50k, 4.7% for AGIs $50k-75k, 5.2% for AGIs $75k-100k, 6.7% for AGIs $100k-200k, 2.7% for AGIs over 200k)
Earned income credit: $1,030 (reported on 4.9% of returns)
Here:
$1,030
State:
$2,570
(% of AGI for various income ranges: 1.5% for AGIs below $25k, 0.1% for AGIs $25k-50k)
Percentage of individuals using paid preparers for their 2012 taxes: 52.1%
Here:
52%
State:
51%
(% for various income ranges: 40.7% for AGIs below $25k, 33.3% for AGIs $25k-50k, 43.5% for AGIs $50k-75k, 47.2% for AGIs $75k-100k, 60.5% for AGIs $100k-200k, 81.1% for AGIs over 200k)
Averages for the 2004 tax year for zip code 78703, filed in 2005:
Average Adjusted Gross Income (AGI) in 2004: $127,741 (Individual Income Tax Returns)
Here:
$127,741
State:
$47,881
Salary/wage: $81,115 (reported on 76.4% of returns)
Here:
$81,115
State:
$41,947
(% of AGI for various income ranges: 77.4% for AGIs $10k-25k, 80.2% for AGIs $25k-50k, 67.4% for AGIs $50k-75k, 65.2% for AGIs $75k-100k, 42.4% for AGIs over 100k)
Taxable interest for individuals: $5,504 (reported on 59.0% of returns)
This zip code:
$5,504
Texas:
$2,255
(% of AGI for various income ranges: 2.8% for AGIs $10k-25k, 2.1% for AGIs $25k-50k, 2.7% for AGIs $50k-75k, 2.4% for AGIs $75k-100k, 2.4% for AGIs over 100k)
Taxable dividends: $12,496 (reported on 46.6% of returns)
Here:
$12,496
State:
$4,261
(% of AGI for various income ranges: 4.0% for AGIs $10k-25k, 2.6% for AGIs $25k-50k, 3.7% for AGIs $50k-75k, 3.8% for AGIs $75k-100k, 4.6% for AGIs over 100k)
Net capital gain/loss: +$60,912 (reported on 43.8% of returns)
Here:
+$60,912
State:
+$16,110
(% of AGI for various income ranges: 2.1% for AGIs $10k-25k, 2.4% for AGIs $25k-50k, 3.0% for AGIs $50k-75k, 3.0% for AGIs $75k-100k, 24.5% for AGIs over 100k)
Profit/loss from business: +$36,276 (reported on 24.6% of returns)
Here:
+$36,276
State:
+$11,013
(% of AGI for various income ranges: 8.7% for AGIs $10k-25k, 7.1% for AGIs $25k-50k, 9.0% for AGIs $50k-75k, 9.2% for AGIs $75k-100k, 6.5% for AGIs over 100k)
IRA payment deduction: $3,596 (reported on 3.1% of returns)
78703:
$3,596
Texas:
$3,120
(% of AGI for various income ranges: 0.2% for AGIs $10k-25k, 0.2% for AGIs $25k-50k, 0.2% for AGIs $50k-75k, 0.2% for AGIs $75k-100k, 0.1% for AGIs over 100k)
Self-employed pension: $22,418 (reported on 5.1% of returns)
Here:
$22,418
Texas:
$16,401
(% of AGI for various income ranges: 0.3% for AGIs $25k-50k, 0.6% for AGIs $50k-75k, 0.9% for AGIs $75k-100k, 1.0% for AGIs over 100k)
Total itemized deductions: $40,816 (17% of AGI, reported on 44.1% of returns)
Here:
$40,816
State:
$19,631
Here:
16.8% of AGI
State:
18.9% of AGI
(% of AGI for various income ranges: 14.5% for AGIs $10k-25k, 12.2% for AGIs $25k-50k, 17.6% for AGIs $50k-75k, 18.7% for AGIs $75k-100k, 13.4% for AGIs over 100k)
Charity contributions deductions: $10,304 (4% of AGI, reported on 38.2% of returns)
Here:
$10,304
State:
$4,753
Here:
4.2% of AGI
State:
4.2% of AGI
(% of AGI for various income ranges: 1.1% for AGIs $10k-25k, 1.4% for AGIs $25k-50k, 1.8% for AGIs $50k-75k, 2.4% for AGIs $75k-100k, 3.3% for AGIs over 100k)
Total tax: $29,950 (reported on 84.5% of returns)
78703:
$29,950
State:
$9,058
(% of AGI for various income ranges: 6.3% for AGIs $10k-25k, 9.8% for AGIs $25k-50k, 12.5% for AGIs $50k-75k, 13.5% for AGIs $75k-100k, 21.5% for AGIs over 100k)
Earned income credit: $956 (reported on 5.1% of returns)
Here:
$956
State:
$2,024
Percentage of individuals using paid preparers for their 2004 taxes: 50.0%
Here:
50%
State:
57%
(% for various income ranges: 46.4% for AGIs below $10k, 33.0% for AGIs $10k-25k, 35.3% for AGIs $25k-50k, 49.3% for AGIs $50k-75k, 55.5% for AGIs $75k-100k, 72.4% for AGIs over 100k)
Likely homosexual households (counted as self-reported same-sex unmarried-partner households)
Lesbian couples: 0.0% of all households
Gay men: 0.1% of all households
Household received Food Stamps/SNAP in the past 12 months: 52 Household did not receive Food Stamps/SNAP in the past 12 months: 11,794
Women who had a birth in the past 12 months: 128 (130 now married, 0 unmarried) Women who did not have a birth in the past 12 months: 6,046 (2,710 now married, 3,334 unmarried)
Housing units in zip code 78703 with a mortgage: 3,754 (388 second mortgage, 396 both second mortgage and home equity loan) Houses without a mortgage: 72
Median monthly owner costs for units with a mortgage: $3,982 Median monthly owner costs for units without a mortgage: $1,537
Residents with income below the poverty level in 2022:
This zip code:
5.6%
Whole state:
14.0%
Residents with income below 50% of the poverty level in 2022:
This zip code:
2.6%
Whole state:
7.4%
Median number of rooms in houses and condos:
Here:
6.7
State:
6.3
Median number of rooms in apartments:
Here:
3.2
State:
4.0
Notable locations in this zip code not listed on our city pages
Notable locations in zip code 78703: Clarksville Historic District (A), Camp Mabry Historic District (B), Goldie Horton-Porter House (C), Herbert and Alice Bohn House (D), Keith House (E), Judge Robert Lynn Batts House (F), Austin Fire Department Station 10 (G), Austin Fire Department Station 4 (H), Howson Branch Austin City Library (I), Texas Military Forces Museum (J), Laguna Gloria Art Museum (K), Austin Childrens Museum (L), Austin / Travis County Emergency Medical Service - Rescue 17 (M), Texas Confederate Home (N), Chester and Lorine Nagel House (O), A J Jernigan House (P), Richmond Kelley Smoot House (Q), Pease Mansion (R), Ziller House (S), Wroe-Bustin House (T). Display/hide their locations on the map
Churches in zip code 78703 include: Sweethome Missionary Baptist Church (A), Saint Francis Episcopal Church (B), Good Shepherd Episcopal Church (C), Westminster Presbyterian Church (D), Mesa Community Church (E), Saint Luke United Methodist Church (F), Tarrytown Baptist Church (G). Display/hide their locations on the map
Parks in zip code 78703 include: Lamar Beach (1), Westenfield Park (2), West Austin Park (3), Red Bud Isle Park (4), Mayfield Park (5), Deep Eddy Park (6), Reed Park (7). Display/hide their locations on the map
2,832 married couples with children.
528 single-parent households (83 men, 445 women).
87.6% of residents of 78703 zip code speak English at home.
5.4% of residents speak Spanish at home (88% very well, 9% well, 3% not well).
3.5% of residents speak other Indo-European language at home (94% very well, 5% well, 1% not well).
3.4% of residents speak Asian or Pacific Island language at home (60% very well, 35% well, 6% not well).
0.2% of residents speak other language at home (100% very well).
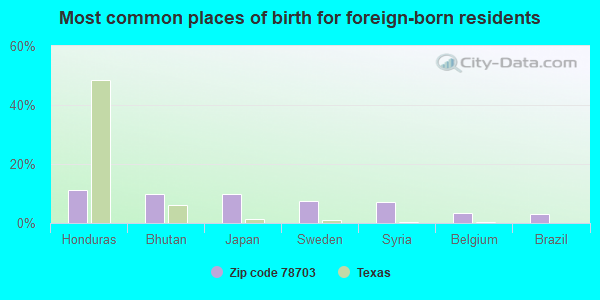
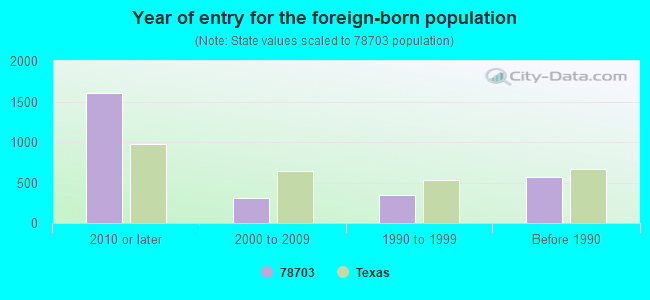
Foreign born population: 2,211 (9.5%) (35.2% of them are naturalized citizens)
Facilities with environmental interests located in this zip code:
ANNUNCIATION MATERNITY HOME (3001 LAKE AUSTIN BLVD in AUSTIN, TX)
(National Center for Education Statistics) - STATE ID-227806017 Organizations: UNIVERSITY CHARTER S (SCHOOL DISTRICT)
AUSTIN H S (1715 W CESAR CHAVEZ in AUSTIN, TX)
(National Center for Education Statistics) - STATE ID-227901002 Organizations: AUSTIN ISD (SCHOOL DISTRICT)
AUSTIN ST HOSPITAL (1111 W 6TH ST in AUSTIN, TX)
(National Center for Education Statistics) - STATE ID-227901250 Organizations: AUSTIN ISD (SCHOOL DISTRICT)
ALBERT R DAVIS WATER TREATMENT PLANT (3500 WEST 35TH STREET in AUSTIN, TX)
ENFORCEMENT/COMPLIANCE ACTIVITY (Integrated Compliance Information System) (Resource Conservation and Recovery Act (tracking hazardous waste)) Organizations: CITY OF AUSTIN (CONTACT/OPERATOR)
Alternative names: DAVIS WATER TRTMT PLT
AUSTIN ISD (1715 W LOT ST in AUSTIN, TX)
(Resource Conservation and Recovery Act (tracking hazardous waste)) Alternative names: AUSTIN ISD HIGH SCH
AUSTIN ISD (2610 W 10TH ST in AUSTIN, TX)
(Resource Conservation and Recovery Act (tracking hazardous waste)) Alternative names: O HENRY JUNIOR HIGH SCHOOL
AUSTIN TOYOTA (1127 W 6TH STREET in AUSTIN, TX)
(Resource Conservation and Recovery Act (tracking hazardous waste))
973 WWTF (2500FT E FM 973 AND NEW SWEDEN in AUSTIN, TX)
National Pollutant Discharge Elimination System NON-MAJOR (Tracking pollutant discharge elimination systems) - permit Business SIC classification: SEWERAGE SYSTEMS Organizations: 973 WASTEWATER COMPANY (CONTACT/OWNER)
Alternative names: 973 WASTEWATER COMPANY
ANTHONY'S DRY CLEANING & LAUNDRY (1113 WEST LYNN in AUSTIN, TX)
AIR MINOR (AIRS/AFS) Business SIC classification: DRYCLEANING PLANTS, EXCEPT RUG CLEANING
AUSTIN STATE SCHOOL (2203 W 35TH ST in AUSTIN, TX)
COMPLIANCE ACTIVITY (Tracking inspections of insecticide, fungicide, and rodenticide, and toxic substances)
Housing units lacking complete plumbing facilities: 1.1% Housing units lacking complete kitchen facilities: 1.7%
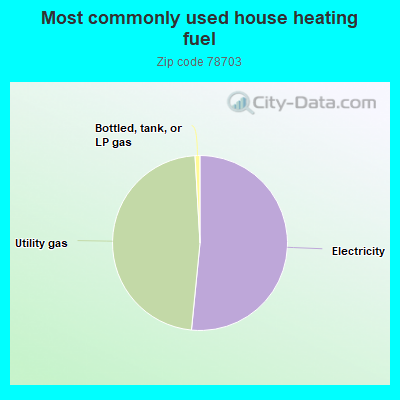
51.3%Electricity
47.3%Utility gas
0.9%Bottled, tank, or LP gas
Population in 1990: 18,253. Population change in the 1990s: +1,332 (+7.3%).
Place of birth for U.S.-born residents:
This state: 10,874
Northeast: 2,355
Midwest: 2,239
South: 2,703
West: 2,568
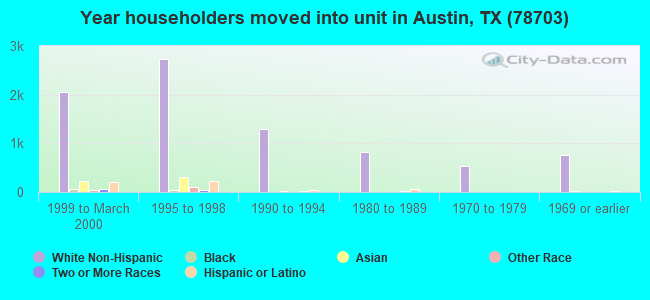
47% of the 78703 zip code residents lived in the same house 5 years ago. Out of people who lived in different houses, 53% lived in this county. Out of people who lived in different counties, 50% lived in Texas.
80% of the 78703 zip code residents lived in the same house 1 year ago. Out of people who lived in different houses, 52% moved from this county. Out of people who lived in different houses, 10% moved from different county within same state. Out of people who lived in different houses, 36% moved from different state. Out of people who lived in different houses, 2% moved from abroad.
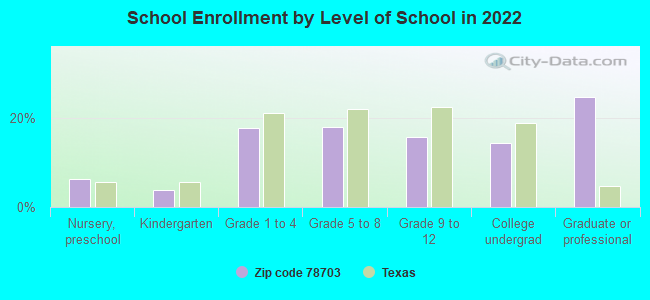
Private vs. public school enrollment:
Students in private schools in grades 1 to 8 (elementary and middle school): 660
Here:
39.4%
Texas:
8.8%
Students in private schools in grades 9 to 12 (high school): 216
Here:
29.5%
Texas:
8.0%
Students in private undergraduate colleges: 70
Here:
10.8%
Texas:
16.2%
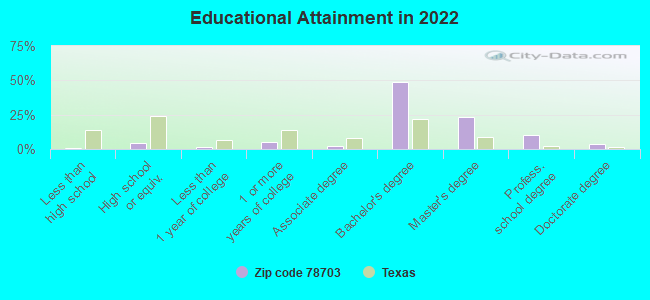
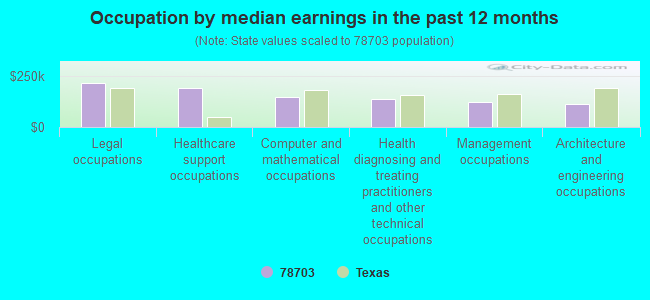
Occupation by median earnings in the past 12 months ($)
216,705Legal occupations
189,681Healthcare support occupations
149,058Computer and mathematical occupations
139,923Health diagnosing and treating practitioners and other technical occupations
121,561Management occupations
112,852Architecture and engineering occupations
Companies with federal contracts located in this zip code (AUSTIN, TX):
G & S ASSOCIATES, INC (828 W 6TH ST) : $362,094,238 in 232 contractsfrom 2000 to 2006
Contracts for Advertising Services, Signs, Advertising Displays, and Identification Plates by Air Force Signed by year:2000: $81,446; 2001: $65,482,855; 2002: $92,830,893; 2003: $66,252,596; 2004: $68,772,362; 2005: $35,936,169; 2006: $32,737,917.
Biggest contracts:
$29,500,000 with Air Force for Advertising Services. Signed on 2001-02-22. Completion date: 2001-09-30.
$23,999,835, same as above.Signed on 2004-01-29. Completion date: 2004-12-31.
$23,883,625, same as above.Signed on 2002-04-09. Completion date: 2002-09-30.
$22,622,442, same as above.Signed on 2003-01-29. Completion date: 2002-09-30.
ACE MAINTENANCE & SERVICE, INC (506 WALSH; small business) : $59,968,177 in 71 contractsfrom 1999 to 2006
Contracts for Custodial Janitorial Services, Other Housekeeping Services by Army Signed by year:2000: $7,806,821; 2001: $1,475,168; 2002: $15,403,386; 2003: $8,438,687; 2004: $9,097,387; 2005: $6,243,660; 2006: $4,250,041.
Biggest contracts:
$7,761,176 with Army for Custodial Janitorial Services. Taking place in GA. Signed on 2000-10-25. Completion date: 2001-09-30.
$7,092,509 with Army for Custodial Janitorial Services. Signed on 1999-11-16. Completion date: 2000-09-30.
$4,331,540 with Army for Custodial Janitorial Services. Taking place in GA. Signed on 2002-05-03. Completion date: 2002-09-30.
$3,386,470 with Army for Other Housekeeping Services. Taking place in GA. Signed on 2004-11-19. Completion date: 2005-10-31.
HARDY-HECK-MOORE, INC. (1414 W. 6TH STREET; small business) : $8,560,037 in 66 contractsfrom 1999 to 2005
Contracts for Architect - Engineer Services (including landscaping, interior layout, and designing), Other Architect and Engineering Services, Historical Studies by Navy, Forest Service Signed by year:2000: $387,603; 2001: $1,793,899; 2002: $590,700; 2003: $3,495,372; 2004: $122,804; 2005: $2,045,392; 2006: $0.
Biggest contracts:
$2,403,211 with Navy for Architect - Engineer Services (including landscaping, interior layout, and designing). Taking place in FL. Signed on 2003-09-25. Completion date: 2004-03-26.
$1,299,957 with Navy for Other Architect and Engineering Services. Taking place in SC. Signed on 2001-09-28. Completion date: 2001-03-18.
$756,867 with Navy for Architect - Engineer Services (including landscaping, interior layout, and designing). Taking place in FL. Signed on 2005-09-15. Completion date: 2005-08-30.
$536,648 with Navy for Architect - Engineer Services (including landscaping, interior layout, and designing). Taking place in LA. Signed on 2003-04-21. Completion date: 2004-07-21.
ADJUTANT GENERAL'S DEPARTMENT (2200 W 35TH ST BLDG 10) : $70,108 in 8 contractsfrom 2003 to 2006
Contracts for Maintenance, Repair or Alteration of Real Property -- Troop Housing Facilities, Lodging - Hotel/Motel, Housing -- Basic Research (R&D), Rigid Wall Shelters by Army Signed by year:2000: $0; 2001: $0; 2002: $0; 2003: $3,280; 2004: $30,000; 2005: $37,363; 2006: -$535.
Biggest contracts:
$30,000 with Army for Maintenance, Repair or Alteration of Real Property -- Troop Housing Facilities. Signed on 2004-02-19. Completion date: 2004-09-30.
$20,000 with Army for Lodging - Hotel/Motel. Signed on 2005-10-26. Completion date: 2006-09-30.
$9,933 with Army for Housing -- Basic Research (R&D). Signed on 2005-07-05. Completion date: 2005-04-30.
$4,230 with Army for Rigid Wall Shelters. Signed on 2005-09-28. Completion date: 2005-09-29.
JONATHAN G PABALAN (1644 W 6TH STREET APT B; small business)
$27,369 with Army for Other Professional Services. Signed on 1999-10-17. Completion date: 2000-09-30.
MARLENE'S KITCHEN (2210 W 35TH ST BLD 8; small business) : $18,050 in 3 contractsin 2005
$9,600 with Army for Food Services. Signed on 2005-09-26. Completion date: 2005-09-30.
$7,750 with Army for Condiments and Related Products. Signed on 2005-10-06. Completion date: 2005-10-07.
$700 with Army for Food Services. Signed on 2005-09-29. Completion date: 2005-09-30.
AFFORDABLE VIDEO SERVICE INC (1615 W 6TH ST STE A; small business)
$7,518 with Army for Reproduction Services. Signed on 2003-09-26. Completion date: 2003-09-29.
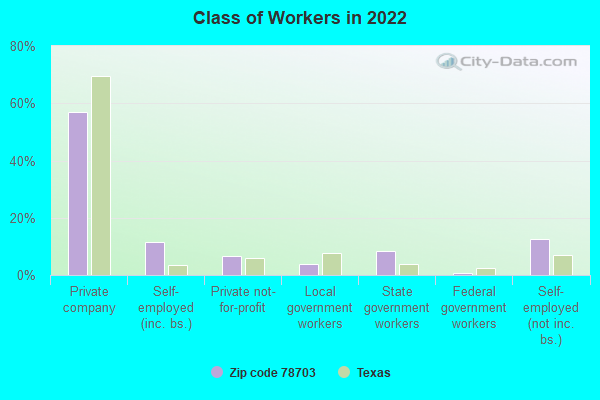
Top industries in this zip code by the number of employees in 2005:
Administrative and Support and Waste Management and Remediation Services: Temporary Help Services (250-499: 1, 100-249: 1, 50-99: 1, 20-49: 1, 10-19: 1, 1-4: 1)
Management of Companies and Enterprises: Corporate, Subsidiary, and Regional Managing Offices (250-499: 1, 50-99: 2, 20-49: 1, 5-9: 2, 1-4: 3)
Other Services (except Public Administration): Other Similar Organizations (except Business, Professional, Labor, and Political Organizations) (100-249: 1, 20-49: 1, 5-9: 1, 1-4: 1)
2002 - 2018 National Fire Incident Reporting System (NFIRS) incidents
According to the data from the years 2002 - 2018 the average number of fire incidents per year is 45. The highest number of fires - 71 took place in 2006, and the least - 11 in 2017. The data has a dropping trend.
When looking into fire subcategories, the most reports belonged to: Outside Fires (50.1%), and Structure Fires (29.8%).
Fire incident types reported to NFIRS in Zip Code 78703
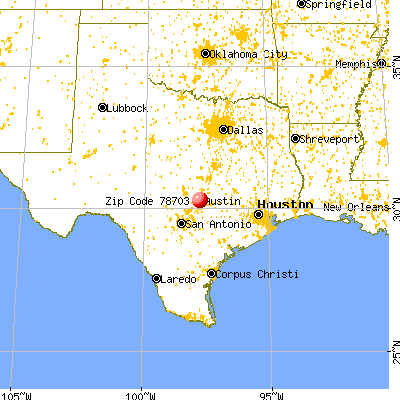


 Nearest zip codes: 78705, 78701, 78712, 78756, 78746, 78751.


 According to the data from the years 2002 - 2018 the average number of fire incidents per year is 45. The highest number of fires - 71 took place in 2006, and the least - 11 in 2017. The data has a dropping trend.
 When looking into fire subcategories, the most reports belonged to: Outside Fires (50.1%), and Structure Fires (29.8%).