Estimated zip code population in 2022: 10,079 Zip code population in 2010: 7,194 Zip code population in 2000: 7,128
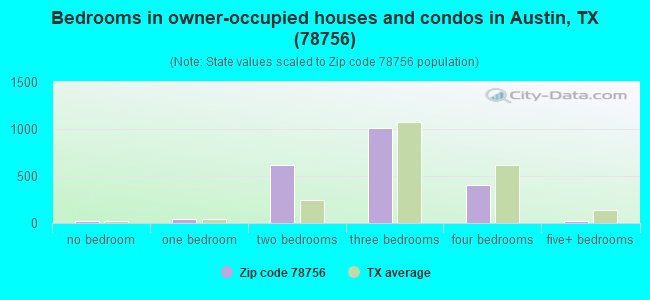
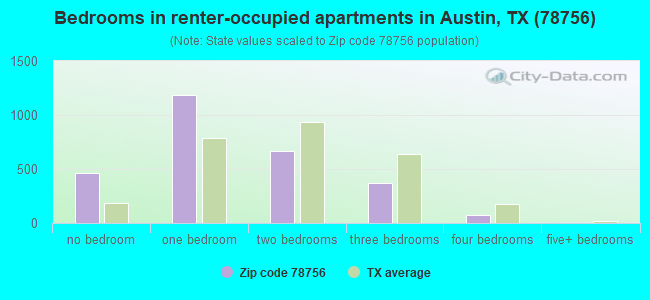
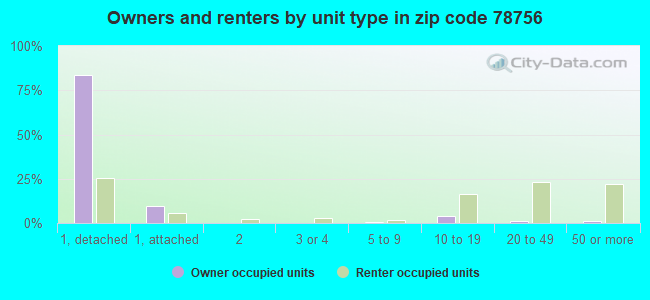
Houses and condos: 4,992 Renter-occupied apartments: 2,681
% of renters here:
56%
State:
38%
March 2022 cost of living index in zip code 78756: 97.3 (near average, U.S. average is 100)
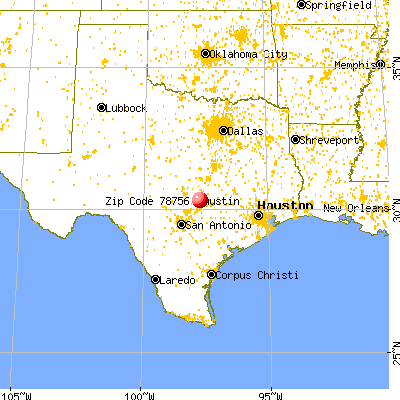
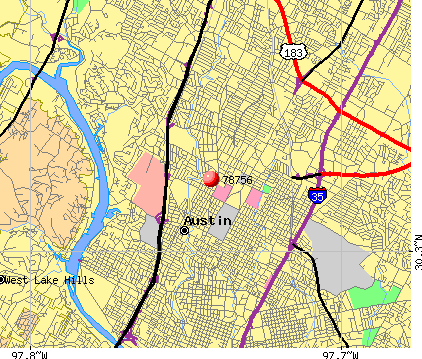
Land area: 1.7 sq. mi. Water area: 0.0 sq. mi.
Population density: 6,029 people per square mile
(high).
OSM Map
General Map
Google Map
MSN Map
OSM Map
General Map
Google Map
MSN Map
OSM Map
General Map
Google Map
MSN Map
OSM Map
General Map
Google Map
MSN Map
Please wait while loading the map...
Real estate property taxes paid for housing units in 2022:
This zip code:
1.3% ($10,460)
Texas:
1.5% ($4,050)
Median real estate property taxes paid for housing units with mortgages in 2022: $10,505 (1.2%) Median real estate property taxes paid for housing units with no mortgage in 2022: $10,700 (1.4%)
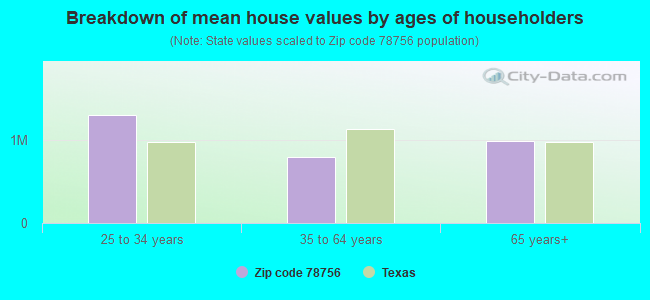
Estimated median house/condo value in 2022: $833,259
78756:
$833,259
Texas:
$275,400
According to our research of Texas and other state lists, there were 3 registered sex offenders living in 78756 zip code as of April 27, 2024. The ratio of all residents to sex offenders in zip code 78756 is 2,975 to 1. The ratio of registered sex offenders to all residents in this zip code is much lower than the state average.
Median resident age:
This zip code:
35.9 years
Texas median age:
35.6 years
Average household size:
This zip code:
1.9 people
Texas:
2.6 people
Averages for the 2020 tax year for zip code 78756, filed in 2021:
Average Adjusted Gross Income (AGI) in 2020: $148,384 (Individual Income Tax Returns)
Here:
$148,384
State:
$77,054
Salary/wage: $102,710 (reported on 85.2% of returns)
Here:
$102,710
State:
$62,766
(% of AGI for various income ranges: 1175.2% for AGIs below $25k, 3920.7% for AGIs $25k-50k, 7013.8% for AGIs $50k-75k, 10200.0% for AGIs $75k-100k, 20674.1% for AGIs $100k-200k, 114886.8% for AGIs over 200k)
Taxable interest for individuals: $2,595 (reported on 43.4% of returns)
This zip code:
$2,595
Texas:
$2,665
(% of AGI for various income ranges: 20.8% for AGIs below $25k, 20.7% for AGIs $25k-50k, 38.3% for AGIs $50k-75k, 136.4% for AGIs $75k-100k, 234.6% for AGIs $100k-200k, 1779.5% for AGIs over 200k)
Ordinary dividends: $11,232 (reported on 37.9% of returns)
Here:
$11,232
State:
$10,044
(% of AGI for various income ranges: 55.2% for AGIs below $25k, 77.6% for AGIs $25k-50k, 123.8% for AGIs $50k-75k, 351.2% for AGIs $75k-100k, 715.4% for AGIs $100k-200k, 7457.9% for AGIs over 200k)
Net capital gain/loss in AGI: +$65,673 (reported on 36.2% of returns)
Here:
+$65,673
State:
+$39,590
(% of AGI for various income ranges: 20.2% for AGIs below $25k, 42.4% for AGIs $25k-50k, 141.5% for AGIs $50k-75k, 600.4% for AGIs $75k-100k, 1050.2% for AGIs $100k-200k, 53701.6% for AGIs over 200k)
Profit/loss from business: +$24,341 (reported on 21.6% of returns)
Here:
+$24,341
State:
+$10,888
(% of AGI for various income ranges: 242.6% for AGIs below $25k, 259.5% for AGIs $25k-50k, 423.8% for AGIs $50k-75k, 690.8% for AGIs $75k-100k, 1177.3% for AGIs $100k-200k, 6270.5% for AGIs over 200k)
Taxable individual retirement arrangement distribution: $23,597 (reported on 7.6% of returns)
78756:
$23,597
Texas:
$24,740
(% of AGI for various income ranges: 35.2% for AGIs below $25k, 62.9% for AGIs $25k-50k, 121.5% for AGIs $50k-75k, 306.8% for AGIs $75k-100k, 770.2% for AGIs $100k-200k, 1586.8% for AGIs over 200k)
Self-employed (Keogh) retirement plans: $30,912 (reported on 1.7% of returns)
78756:
$30,912
Texas:
$29,298
(% of AGI for various income ranges: 99.3% for AGIs $100k-200k, 1087.4% for AGIs over 200k)
Total itemized deductions: $42,130 (reported on 15.9% of returns)
Here:
$42,130
State:
$40,428
(% of AGI for various income ranges: 120.5% for AGIs $25k-50k, 287.5% for AGIs $50k-75k, 560.4% for AGIs $75k-100k, 1277.8% for AGIs $100k-200k, 11429.5% for AGIs over 200k)
Charity contributions: $17,507 (reported on 13.1% of returns)
Here:
$17,507
State:
$18,201
(% of AGI for various income ranges: 9.5% for AGIs below $25k, 18.7% for AGIs $50k-75k, 79.2% for AGIs $75k-100k, 202.9% for AGIs $100k-200k, 4904.7% for AGIs over 200k)
Taxes paid: $9,078 (reported on 15.9% of returns)
78756:
$9,078
State:
$7,821
(% of AGI for various income ranges: 35.6% for AGIs $25k-50k, 91.5% for AGIs $50k-75k, 214.8% for AGIs $75k-100k, 408.5% for AGIs $100k-200k, 1932.6% for AGIs over 200k)
Earned income credit: $956 (reported on 5.9% of returns)
Here:
$956
State:
$2,584
(% of AGI for various income ranges: 30.2% for AGIs below $25k, 9.9% for AGIs $25k-50k)
Percentage of individuals using paid preparers for their 2020 taxes: 92.8%
Here:
93%
State:
92%
(% for various income ranges: 89.9% for AGIs below $25k, 92.0% for AGIs $25k-50k, 94.6% for AGIs $50k-75k, 95.0% for AGIs $75k-100k, 91.1% for AGIs $100k-200k, 96.1% for AGIs over 200k)
Averages for the 2012 tax year for zip code 78756, filed in 2013:
Average Adjusted Gross Income (AGI) in 2012: $86,150 (Individual Income Tax Returns)
Here:
$86,150
State:
$65,384
Salary/wage: $69,682 (reported on 85.4% of returns)
Here:
$69,682
State:
$52,524
(% of AGI for various income ranges: 76.1% for AGIs below $25k, 81.6% for AGIs $25k-50k, 77.7% for AGIs $50k-75k, 77.1% for AGIs $75k-100k, 78.6% for AGIs $100k-200k, 56.4% for AGIs over 200k)
Taxable interest for individuals: $1,860 (reported on 41.9% of returns)
This zip code:
$1,860
Texas:
$2,372
(% of AGI for various income ranges: 1.4% for AGIs below $25k, 0.7% for AGIs $25k-50k, 0.5% for AGIs $50k-75k, 1.3% for AGIs $75k-100k, 1.2% for AGIs $100k-200k, 0.8% for AGIs over 200k)
Ordinary dividends: $7,096 (reported on 31.1% of returns)
Here:
$7,096
State:
$9,721
(% of AGI for various income ranges: 4.4% for AGIs below $25k, 1.5% for AGIs $25k-50k, 2.2% for AGIs $50k-75k, 2.4% for AGIs $75k-100k, 1.8% for AGIs $100k-200k, 3.2% for AGIs over 200k)
Net capital gain/loss in AGI: +$17,217 (reported on 25.6% of returns)
Here:
+$17,217
State:
+$35,319
(% of AGI for various income ranges: 0.7% for AGIs below $25k, 0.5% for AGIs $25k-50k, 0.7% for AGIs $50k-75k, 1.3% for AGIs $75k-100k, 2.1% for AGIs $100k-200k, 10.1% for AGIs over 200k)
Profit/loss from business: +$22,997 (reported on 23.3% of returns)
Here:
+$22,997
State:
+$13,732
(% of AGI for various income ranges: 10.7% for AGIs below $25k, 7.5% for AGIs $25k-50k, 8.1% for AGIs $50k-75k, 7.2% for AGIs $75k-100k, 6.1% for AGIs $100k-200k, 4.9% for AGIs over 200k)
Taxable individual retirement arrangement distribution: $13,626 (reported on 7.8% of returns)
78756:
$13,626
Texas:
$19,511
(% of AGI for various income ranges: 2.0% for AGIs below $25k, 1.5% for AGIs $25k-50k, 1.6% for AGIs $50k-75k, 1.4% for AGIs $75k-100k, 1.3% for AGIs $100k-200k, 0.9% for AGIs over 200k)
Self-employment retirement plans: $16,680 (reported on 2.3% of returns)
78756:
$16,680
Texas:
$23,938
Total itemized deductions: $23,641 (14% of AGI, reported on 33.6% of returns)
Here:
$23,641
State:
$24,724
Here:
13.7% of AGI
State:
15.9% of AGI
(% of AGI for various income ranges: 6.6% for AGIs below $25k, 7.4% for AGIs $25k-50k, 10.3% for AGIs $50k-75k, 11.6% for AGIs $75k-100k, 12.6% for AGIs $100k-200k, 7.5% for AGIs over 200k)
Charity contributions: $3,969 (reported on 27.0% of returns)
Here:
$3,969
State:
$6,808
(% of AGI for various income ranges: 0.4% for AGIs below $25k, 0.5% for AGIs $25k-50k, 1.0% for AGIs $50k-75k, 1.1% for AGIs $75k-100k, 1.4% for AGIs $100k-200k, 1.6% for AGIs over 200k)
Taxes paid: $9,434 (reported on 33.4% of returns)
78756:
$9,434
State:
$6,921
(% of AGI for various income ranges: 2.5% for AGIs below $25k, 2.6% for AGIs $25k-50k, 4.0% for AGIs $50k-75k, 4.6% for AGIs $75k-100k, 5.2% for AGIs $100k-200k, 3.0% for AGIs over 200k)
Earned income credit: $932 (reported on 8.5% of returns)
Here:
$932
State:
$2,570
(% of AGI for various income ranges: 1.7% for AGIs below $25k, 0.2% for AGIs $25k-50k)
Percentage of individuals using paid preparers for their 2012 taxes: 33.6%
Here:
34%
State:
51%
(% for various income ranges: 24.6% for AGIs below $25k, 24.0% for AGIs $25k-50k, 36.2% for AGIs $50k-75k, 37.1% for AGIs $75k-100k, 44.4% for AGIs $100k-200k, 68.4% for AGIs over 200k)
Averages for the 2004 tax year for zip code 78756, filed in 2005:
Average Adjusted Gross Income (AGI) in 2004: $51,127 (Individual Income Tax Returns)
Here:
$51,127
State:
$47,881
Salary/wage: $46,900 (reported on 83.4% of returns)
Here:
$46,900
State:
$41,947
(% of AGI for various income ranges: 165.0% for AGIs below $10k, 77.3% for AGIs $10k-25k, 81.7% for AGIs $25k-50k, 84.0% for AGIs $50k-75k, 79.0% for AGIs $75k-100k, 69.6% for AGIs over 100k)
Taxable interest for individuals: $1,712 (reported on 48.7% of returns)
This zip code:
$1,712
Texas:
$2,255
(% of AGI for various income ranges: 14.6% for AGIs below $10k, 2.0% for AGIs $10k-25k, 1.5% for AGIs $25k-50k, 1.0% for AGIs $50k-75k, 1.6% for AGIs $75k-100k, 1.6% for AGIs over 100k)
Taxable dividends: $3,134 (reported on 30.2% of returns)
Here:
$3,134
State:
$4,261
(% of AGI for various income ranges: 14.2% for AGIs below $10k, 1.6% for AGIs $10k-25k, 1.5% for AGIs $25k-50k, 1.2% for AGIs $50k-75k, 1.3% for AGIs $75k-100k, 2.2% for AGIs over 100k)
Net capital gain/loss: +$5,370 (reported on 26.5% of returns)
Here:
+$5,370
State:
+$16,110
(% of AGI for various income ranges: -6.2% for AGIs below $10k, -0.0% for AGIs $10k-25k, 0.7% for AGIs $25k-50k, 1.3% for AGIs $50k-75k, 1.3% for AGIs $75k-100k, 5.2% for AGIs over 100k)
Profit/loss from business: +$18,143 (reported on 19.7% of returns)
Here:
+$18,143
State:
+$11,013
(% of AGI for various income ranges: 6.7% for AGIs below $10k, 8.0% for AGIs $10k-25k, 6.5% for AGIs $25k-50k, 3.9% for AGIs $50k-75k, 8.4% for AGIs $75k-100k, 7.6% for AGIs over 100k)
IRA payment deduction: $3,000 (reported on 3.2% of returns)
78756:
$3,000
Texas:
$3,120
(% of AGI for various income ranges: 0.3% for AGIs $10k-25k, 0.3% for AGIs $25k-50k, 0.2% for AGIs $50k-75k, 0.2% for AGIs $75k-100k, 0.1% for AGIs over 100k)
Self-employed pension: $11,582 (reported on 2.2% of returns)
Here:
$11,582
Texas:
$16,401
Total itemized deductions: $18,886 (20% of AGI, reported on 33.3% of returns)
Here:
$18,886
State:
$19,631
Here:
20.2% of AGI
State:
18.9% of AGI
(% of AGI for various income ranges: 38.8% for AGIs below $10k, 9.6% for AGIs $10k-25k, 10.9% for AGIs $25k-50k, 12.9% for AGIs $50k-75k, 16.0% for AGIs $75k-100k, 11.6% for AGIs over 100k)
Charity contributions deductions: $2,746 (3% of AGI, reported on 27.2% of returns)
Here:
$2,746
State:
$4,753
Here:
2.7% of AGI
State:
4.2% of AGI
(% of AGI for various income ranges: 1.6% for AGIs below $10k, 0.6% for AGIs $10k-25k, 0.8% for AGIs $25k-50k, 1.2% for AGIs $50k-75k, 1.7% for AGIs $75k-100k, 1.9% for AGIs over 100k)
Total tax: $9,001 (reported on 83.8% of returns)
78756:
$9,001
State:
$9,058
(% of AGI for various income ranges: 7.6% for AGIs below $10k, 5.8% for AGIs $10k-25k, 9.6% for AGIs $25k-50k, 12.1% for AGIs $50k-75k, 13.4% for AGIs $75k-100k, 19.8% for AGIs over 100k)
Earned income credit: $951 (reported on 8.7% of returns)
Here:
$951
State:
$2,024
Percentage of individuals using paid preparers for their 2004 taxes: 37.8%
Here:
38%
State:
57%
(% for various income ranges: 37.3% for AGIs below $10k, 37.1% for AGIs $10k-25k, 31.9% for AGIs $25k-50k, 35.9% for AGIs $50k-75k, 40.7% for AGIs $75k-100k, 51.9% for AGIs over 100k)
Likely homosexual households (counted as self-reported same-sex unmarried-partner households)
Lesbian couples: 0.1% of all households
Gay men: 0.4% of all households
Household received Food Stamps/SNAP in the past 12 months: 309 Household did not receive Food Stamps/SNAP in the past 12 months: 4,495
Women who had a birth in the past 12 months: 105 (41 now married, 62 unmarried) Women who did not have a birth in the past 12 months: 2,755 (1,112 now married, 1,646 unmarried)
Housing units in zip code 78756 with a mortgage: 1,384 (71 second mortgage, 12 home equity loan, 23 both second mortgage and home equity loan) Median monthly owner costs for units with a mortgage: $3,396 Median monthly owner costs for units without a mortgage: $1,477
Residents with income below the poverty level in 2022:
This zip code:
12.8%
Whole state:
14.0%
Residents with income below 50% of the poverty level in 2022:
This zip code:
6.9%
Whole state:
7.4%
Median number of rooms in houses and condos:
Here:
6.0
State:
6.3
Median number of rooms in apartments:
Here:
3.2
State:
4.0
Notable locations in this zip code not listed on our city pages
Notable locations in zip code 78756: Moore-Hancock Farmstead (A), Grace Garden Child Development Center (B), Yarborough Branch Austin City Library (C), Austin Fire Department Station 12 (D). Display/hide their locations on the map
Churches in zip code 78756 include: Assembly of God Church of Glad Tidings (A), Saint Olives Missionary Baptist Church (B), North Loop Church of Christ (C), I Am Sanctuary and Reading Room (D), Saint John's United Methodist Church (E), Trinity Baptist Church (F), Cameron Grove Baptist Church (G), Church of Glad Tidings (H), Congregation Kol Halev (I). Display/hide their locations on the map
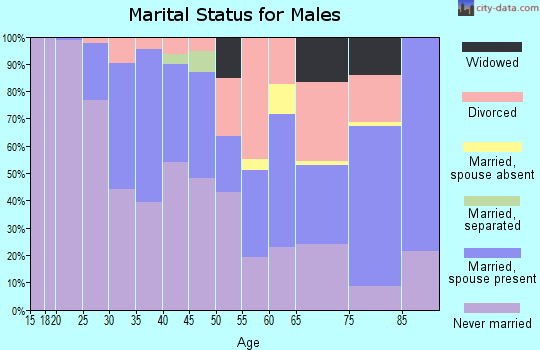
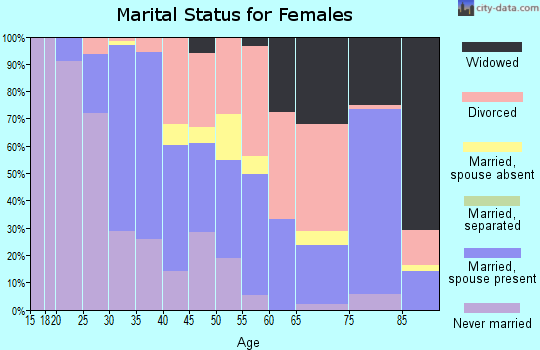
953 married couples with children.
197 single-parent households (31 men, 166 women).
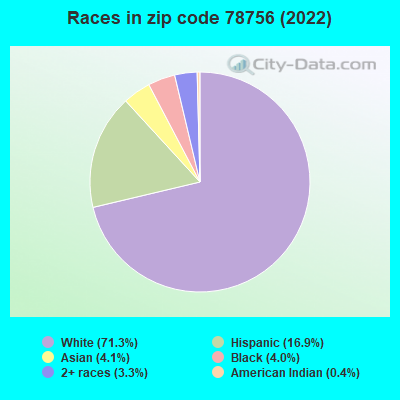
84.8% of residents of 78756 zip code speak English at home.
7.9% of residents speak Spanish at home (78% very well, 19% well, 1% not well, 2% not at all).
2.0% of residents speak other Indo-European language at home (100% very well).
2.4% of residents speak Asian or Pacific Island language at home (96% very well, 4% well).
2.9% of residents speak other language at home (100% very well).
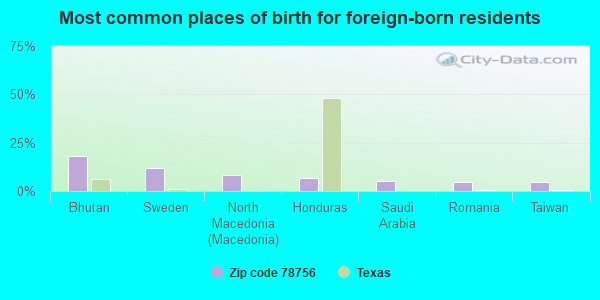
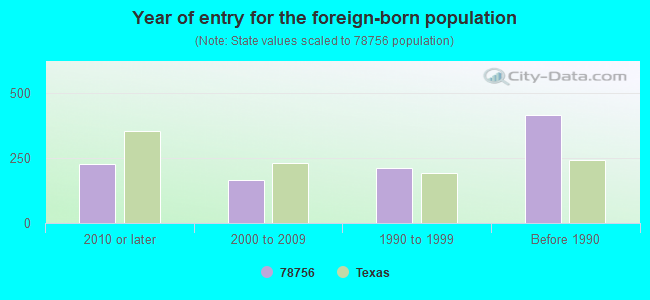
Foreign born population: 806 (8.0%) (62.4% of them are naturalized citizens)
Facilities with environmental interests located in this zip code:
AUSTIN ISD (5600 SUNSHINE DR in AUSTIN, TX)
(National Center for Education Statistics) - STATE ID-227901005 (Resource Conservation and Recovery Act (tracking hazardous waste)) Alternative names: MC CALLUM HIGH SCHOOL, MCCALLUM HIGH SCHOOL
A-TEX AUSTIN INC (4106 N LAMAR in AUSTIN, TX)
(Resource Conservation and Recovery Act (tracking hazardous waste))
AUSTIN SCREEN PRINTING (4204 MEDICAL PKWY in AUSTIN, TX)
(Resource Conservation and Recovery Act (tracking hazardous waste)) Alternative names: AUSTIN SCREEN PRNTG
Housing units lacking complete plumbing facilities: 0.7% Housing units lacking complete kitchen facilities: 1.8%
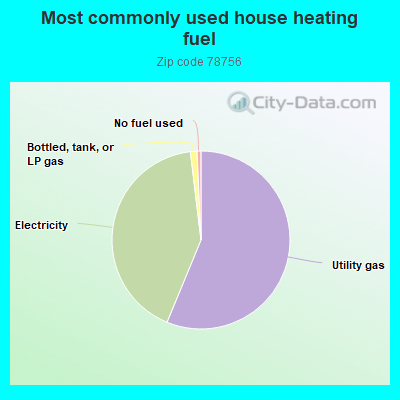
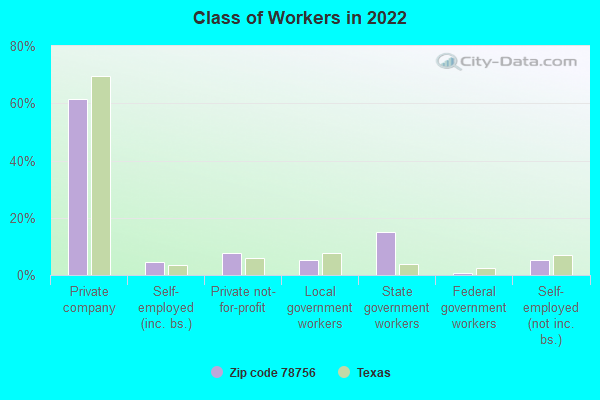
62.3%Utility gas
35.6%Electricity
1.4%Bottled, tank, or LP gas
0.8%No fuel used
Population in 1990: 7,525.
Place of birth for U.S.-born residents:
This state: 4,897
Northeast: 844
Midwest: 1,386
South: 996
West: 940
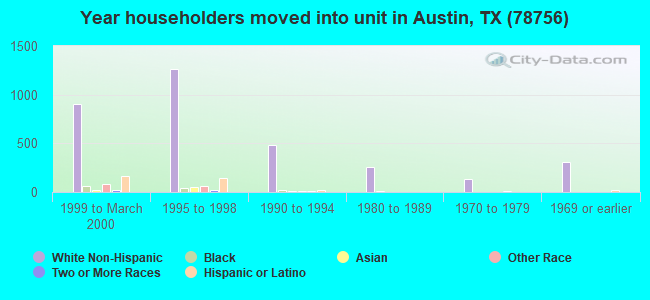
39% of the 78756 zip code residents lived in the same house 5 years ago. Out of people who lived in different houses, 56% lived in this county. Out of people who lived in different counties, 50% lived in Texas.
77% of the 78756 zip code residents lived in the same house 1 year ago. Out of people who lived in different houses, 68% moved from this county. Out of people who lived in different houses, 15% moved from different county within same state. Out of people who lived in different houses, 12% moved from different state. Out of people who lived in different houses, 2% moved from abroad.
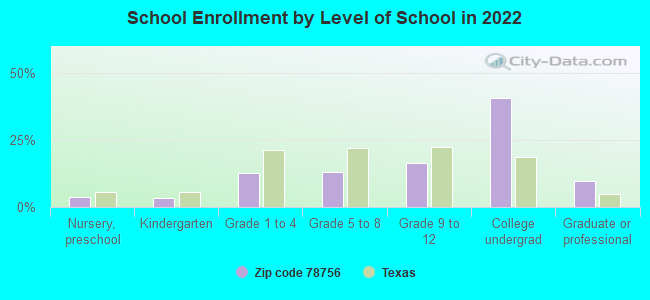
Private vs. public school enrollment:
Students in private schools in grades 1 to 8 (elementary and middle school): 281
Here:
45.2%
Texas:
8.8%
Students in private schools in grades 9 to 12 (high school): 14
Here:
3.7%
Texas:
8.0%
Students in private undergraduate colleges: 346
Here:
36.9%
Texas:
16.2%
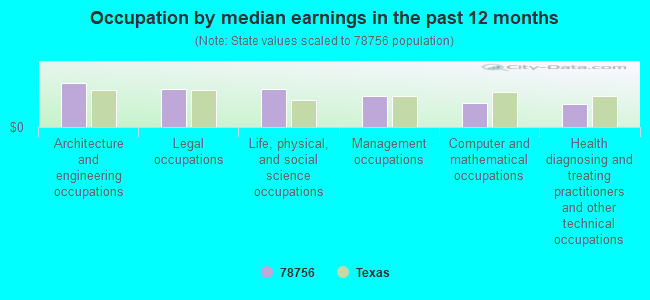
Occupation by median earnings in the past 12 months ($)
162,031Architecture and engineering occupations
140,320Legal occupations
138,629Life, physical, and social science occupations
114,767Management occupations
89,349Computer and mathematical occupations
85,511Health diagnosing and treating practitioners and other technical occupations
Companies with biggest federal contracts located in this zip code (AUSTIN, TX):
THE COMMISSION FOR BLIND TEXAS (4800 N LAMAR BLVD STE 100; small business) : $172,156,459 in 295 contractsfrom 1999 to 2006
Contracts for Food Services by Air Force, Army Signed by year:2000: $9,753,611; 2001: $16,815,578; 2002: $29,051,485; 2003: $16,939,311; 2004: $42,120,007; 2005: $34,878,842; 2006: $9,136,501.
Biggest contracts:
$13,541,463 with Air Force for Food Services. Signed on 2005-12-28. Completion date: 2006-09-30.
$13,203,500, same as above.Signed on 1999-10-01. Completion date: 2000-09-30.
$13,067,410, same as above.Signed on 2002-01-01. Completion date: 2002-12-31.
$12,950,055, same as above.Signed on 2002-12-31. Completion date: 2007-12-31.
TEXAS DEPARTMENT OF HEALTH (84 7TH WALL ST) : $5,612,469 in 41 contractsfrom 1999 to 2006
Contracts for Information Retrieval, Data Collection Services, ADP Supplies, Other Quality Control, Testing and Inspection Services -- Miscellaneous, and moreby SOCIAL SECURITY ADMINISTRATION, Centers for Disease Control and Prevention, Food and Drug Administration Signed by year:2000: $612,000; 2001: $884,000; 2002: $973,250; 2003: $849,716; 2004: $1,538,360; 2005: $139,143; 2006: $0.
Biggest contracts:
$775,200 with SOCIAL SECURITY ADMINISTRATION for Information Retrieval. Signed on 2004-12-22. Completion date: 2007-12-31.
$737,200, same as above.Signed on 2002-12-15. Completion date: 2003-12-15.
$714,000 with SOCIAL SECURITY ADMINISTRATION for Data Collection Services. Signed on 2001-11-15. Completion date: 2001-12-15.
$693,209 with SOCIAL SECURITY ADMINISTRATION for Information Retrieval. Signed on 2004-01-30. Completion date: 2007-12-31.
COX COMMERCIAL LP (1908 W KOENIG LANE) : $2,521,230 in 5 contractsfrom 2004 to 2005
Contracts for Construction of Structures and Facilities -- Other Administrative Facilities and Service Buildings, Maintenance, Repair or Alteration of Real Property -- Miscellaneous Buildings by Army, U.S. Army Corps of Engineers - civil program financing only Signed by year:2000: $0; 2001: $0; 2002: $0; 2003: $0; 2004: $24,992; 2005: $2,496,238; 2006: $0.
Biggest contracts:
$2,374,000 with Army for Construction of Structures and Facilities -- Other Administrative Facilities and Service Buildings. Taking place in KS. Signed on 2005-03-28. Completion date: 2004-11-17.
$40,746, same as above.Signed on 2005-08-08. Completion date: 2004-11-17.
$40,746, same as above.Signed on 2005-08-22. Completion date: 2004-11-17.
$40,746 with U.S. Army Corps of Engineers - civil program financing only for Construction of Structures and Facilities -- Other Administrative Facilities and Service Buildings. Taking place in KS. Signed on 2005-08-22. Completion date: 2004-11-17.
DEPARTMENT OF ASSISTIVE AND RE (4800 N LAMAR BLVD ST) : $1,584,241 in 6 contractsfrom 2004 to 2006
Contracts for Food Services by Air Force Signed by year:2000: $0; 2001: $0; 2002: $0; 2003: $0; 2004: $783,060; 2005: $783,970; 2006: $17,211.
Biggest contracts:
$783,060 with Air Force for Food Services. Signed on 2005-10-01. Completion date: 2006-09-30.
$783,060, same as above.Signed on 2004-10-01. Completion date: 2005-09-30.
$15,811, same as above.Signed on 2006-01-10. Completion date: 2006-09-30.
$2,000, same as above.Signed on 2005-05-25. Completion date: 2005-09-30.
FRIEDHOLM DEANN (4314 SINCLAIR AVENUE; small business) : $587,943 in 9 contractsfrom 2003 to 2006
Contracts for Personal Services Contracts by Departmental Offices Signed by year:2000: $0; 2001: $0; 2002: $0; 2003: $150,182; 2004: $166,957; 2005: $178,616; 2006: $92,188.
Biggest contracts:
$178,616 with Departmental Offices for Personal Services Contracts. Taking place in DC. Signed on 2005-03-25. Effective on 2005-03-28. Completion date: 2006-03-27.
$155,519, same as above.Signed on 2004-03-24. Completion date: 2005-03-27.
$150,182, same as above.Signed on 2003-03-15. Completion date: 2004-03-15.
$56,449, same as above.Signed on 2006-08-16. Completion date: 2008-03-27.
CENTRAL TEXAS REGIONAL BLOOD A (4300 N LAMAR BLVD) : $220,866 in 5 contractsfrom 2003 to 2006
Contracts for Blood Derivatives, Blood by Army Signed by year:2000: $0; 2001: $0; 2002: $0; 2003: $24,600; 2004: $76,266; 2005: $80,000; 2006: $40,000.
Biggest contracts:
$80,000 with Army for Blood Derivatives. Signed on 2005-01-13. Completion date: 2005-12-31.
$73,000, same as above.Signed on 2004-09-02. Completion date: 2004-12-31.
$40,000 with Army for Blood. Signed on 2006-02-09. Completion date: 2006-09-30.
$24,600 with Army for Blood Derivatives. Signed on 2003-12-18. Completion date: 2004-12-31.
DEPT OF HEALTH TEXAS (1100 W 49TH ST) : $131,120 in 6 contractsfrom 2003 to 2006
Contracts for Other Quality Control, Testing and Inspection Services -- Miscellaneous by Food and Drug Administration Signed by year:2000: $0; 2001: $0; 2002: $0; 2003: $131,120; 2004: $0; 2005: $0; 2006: $0.
Biggest contracts:
$131,120 with Food and Drug Administration for Other Quality Control, Testing and Inspection Services -- Miscellaneous. Signed on 2003-09-15. Completion date: 2005-09-15.
$0, same as above.Signed on 2006-03-22. Completion date: 2006-09-29.
$0, same as above.Signed on 2006-09-11. Completion date: 2007-09-29.
$0, same as above.Signed on 2005-09-08. Completion date: 2006-09-29.
DATA JUNCTION CORPORATION (2201 NORTHLAND DR; small business) : $107,249 in 4 contractsfrom 1999 to 2003
$69,000 with Internal Revenue Service for ADP Software. Signed on 1999-12-15. Completion date: 1999-12-15.
$32,617 with Defense Logistics Agency for ADP Software. Signed on 2001-07-17. Completion date: 2001-07-19.
$3,532 with Department of Defense for ADP Support Equipment. Signed on 2003-05-29. Completion date: 2004-05-31.
$2,100 with Department of Defense for ADP Software. Signed on 2002-02-05. Completion date: 2003-02-05.
PRECISION CAMERA INC (3810 N LAMAR BLVD; small business) : $54,500 in 6 contractsfrom 2000 to 2005
Contracts for Cameras, Still Picture, Photographic Projection Equipment by Army Signed by year:2000: $28,027; 2001: $0; 2002: $6,123; 2003: $16,040; 2004: -$440; 2005: $4,750; 2006: $0.
Biggest contracts:
$28,027 with Army for Cameras, Still Picture. Signed on 2000-07-19. Completion date: 2000-10-30.
$16,139, same as above.Signed on 2003-07-30. Completion date: 2003-07-31.
$6,123, same as above.Signed on 2002-03-12. Completion date: 2002-04-12.
$4,750 with Army for Photographic Projection Equipment. Signed on 2005-09-29. Completion date: 2005-10-28.
MOUNTAIN ASSOCIATES (3810A TONKAWA TRL; small business) : $23,400 in 2 contractsfrom 2005 to 2006
$12,000 with Navy for Miscellaneous Communication Equipment. Signed on 2006-05-16. Completion date: 2006-07-05.
$11,400 with Navy for Electrical and Electronic assemblies, Boards, Cards, and Associated Hardware. Signed on 2005-05-11. Completion date: 2005-06-30.
Top industries in this zip code by the number of employees in 2005:
Health Care and Social Assistance: Offices of Physicians (except Mental Health Specialists) (100-249 employees: 1 establishment, 50-99 employees: 1 establishment, 20-49 employees: 2 establishments, 10-19 employees: 3 establishments, 5-9 employees: 9 establishments, 1-4 employees: 17 establishments)
Administrative and Support and Waste Management and Remediation Services: Office Administrative Services (250-499: 1, 1-4: 3)
Health Care and Social Assistance: General Medical and Surgical Hospitals (250-499: 1)
2002 - 2018 National Fire Incident Reporting System (NFIRS) incidents
According to the data from the years 2002 - 2018 the average number of fires per year is 25. The highest number of fire incidents - 48 took place in 2011, and the least - 1 in 2017. The data has an increasing trend.
When looking into fire subcategories, the most incidents belonged to: Outside Fires (45.1%), and Structure Fires (35.3%).
Fire incident types reported to NFIRS in Zip Code 78756


 Nearest zip codes: 78751, 78705, 78757, 78752, 78731, 78703.


 According to the data from the years 2002 - 2018 the average number of fires per year is 25. The highest number of fire incidents - 48 took place in 2011, and the least - 1 in 2017. The data has an increasing trend.
 When looking into fire subcategories, the most incidents belonged to: Outside Fires (45.1%), and Structure Fires (35.3%).