Estimated zip code population in 2022: 27,021 Zip code population in 2010: 24,614 Zip code population in 2000: 24,059
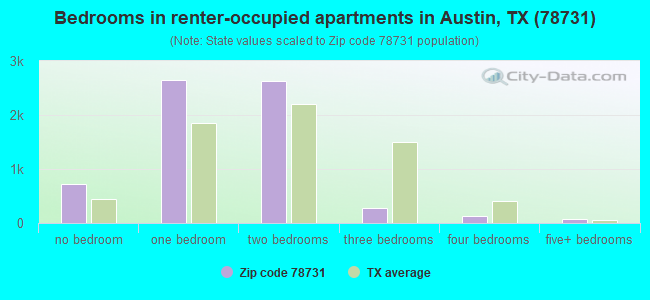
Houses and condos: 15,036 Renter-occupied apartments: 6,401
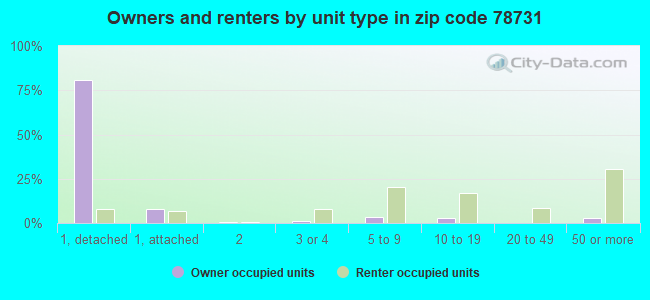
% of renters here:
45%
State:
38%
March 2022 cost of living index in zip code 78731: 98.3 (near average, U.S. average is 100)
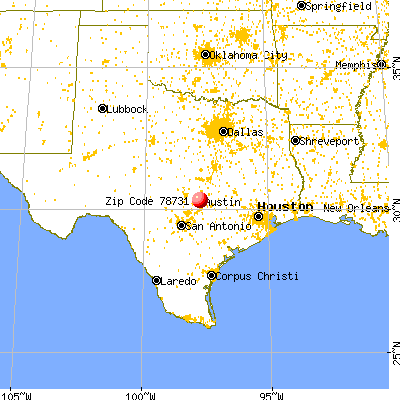
Land area: 8.6 sq. mi. Water area: 0.2 sq. mi.
Population density: 3,145 people per square mile
(average).
OSM Map
General Map
Google Map
MSN Map
OSM Map
General Map
Google Map
MSN Map
OSM Map
General Map
Google Map
MSN Map
OSM Map
General Map
Google Map
MSN Map
Please wait while loading the map...
Real estate property taxes paid for housing units in 2022:
This zip code:
1.2% ($10,460)
Texas:
1.5% ($4,050)
Median real estate property taxes paid for housing units with mortgages in 2022: $10,505 (1.1%) Median real estate property taxes paid for housing units with no mortgage in 2022: $10,700 (1.3%)
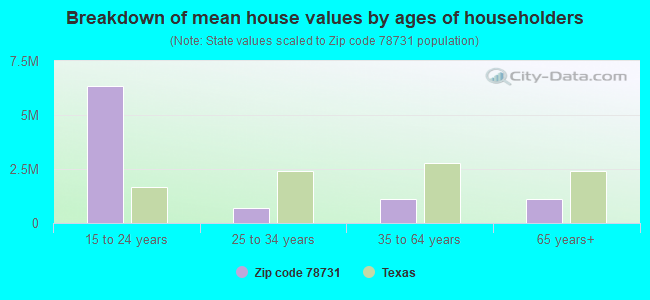
Estimated median house/condo value in 2022: $900,257
78731:
$900,257
Texas:
$275,400
According to our research of Texas and other state lists, there were 4 registered sex offenders living in 78731 zip code as of April 27, 2024. The ratio of all residents to sex offenders in zip code 78731 is 6,949 to 1. The ratio of registered sex offenders to all residents in this zip code is much lower than the state average.
Median resident age:
This zip code:
40.9 years
Texas median age:
35.6 years
Average household size:
This zip code:
1.9 people
Texas:
2.6 people
Averages for the 2020 tax year for zip code 78731, filed in 2021:
Average Adjusted Gross Income (AGI) in 2020: $262,800 (Individual Income Tax Returns)
Here:
$262,800
State:
$77,054
Salary/wage: $157,514 (reported on 75.8% of returns)
Here:
$157,514
State:
$62,766
(% of AGI for various income ranges: 1268.1% for AGIs below $25k, 3885.0% for AGIs $25k-50k, 6404.0% for AGIs $50k-75k, 9929.2% for AGIs $75k-100k, 18090.4% for AGIs $100k-200k, 129758.5% for AGIs over 200k)
Taxable interest for individuals: $6,268 (reported on 53.6% of returns)
This zip code:
$6,268
Texas:
$2,665
(% of AGI for various income ranges: 37.0% for AGIs below $25k, 44.9% for AGIs $25k-50k, 118.2% for AGIs $50k-75k, 240.2% for AGIs $75k-100k, 407.7% for AGIs $100k-200k, 3978.3% for AGIs over 200k)
Ordinary dividends: $22,113 (reported on 50.6% of returns)
Here:
$22,113
State:
$10,044
(% of AGI for various income ranges: 110.7% for AGIs below $25k, 133.9% for AGIs $25k-50k, 352.6% for AGIs $50k-75k, 751.8% for AGIs $75k-100k, 1916.9% for AGIs $100k-200k, 12724.4% for AGIs over 200k)
Net capital gain/loss in AGI: +$124,567 (reported on 48.2% of returns)
Here:
+$124,567
State:
+$39,590
(% of AGI for various income ranges: 68.8% for AGIs below $25k, 113.2% for AGIs $25k-50k, 231.9% for AGIs $50k-75k, 614.3% for AGIs $75k-100k, 2070.8% for AGIs $100k-200k, 83836.0% for AGIs over 200k)
Profit/loss from business: +$44,676 (reported on 23.9% of returns)
Here:
+$44,676
State:
+$10,888
(% of AGI for various income ranges: 157.8% for AGIs below $25k, 197.0% for AGIs $25k-50k, 323.7% for AGIs $50k-75k, 615.2% for AGIs $75k-100k, 1568.3% for AGIs $100k-200k, 12312.5% for AGIs over 200k)
Taxable individual retirement arrangement distribution: $40,041 (reported on 12.4% of returns)
78731:
$40,041
Texas:
$24,740
(% of AGI for various income ranges: 48.7% for AGIs below $25k, 118.5% for AGIs $25k-50k, 265.3% for AGIs $50k-75k, 660.8% for AGIs $75k-100k, 1791.7% for AGIs $100k-200k, 4134.4% for AGIs over 200k)
Self-employed (Keogh) retirement plans: $32,938 (reported on 3.8% of returns)
78731:
$32,938
Texas:
$29,298
(% of AGI for various income ranges: 16.1% for AGIs $25k-50k, 44.2% for AGIs $75k-100k, 122.8% for AGIs $100k-200k, 1620.1% for AGIs over 200k)
Total itemized deductions: $71,249 (reported on 25.6% of returns)
Here:
$71,249
State:
$40,428
(% of AGI for various income ranges: 180.3% for AGIs below $25k, 282.0% for AGIs $25k-50k, 535.5% for AGIs $50k-75k, 1075.0% for AGIs $75k-100k, 2408.5% for AGIs $100k-200k, 21546.5% for AGIs over 200k)
Charity contributions: $25,493 (reported on 22.3% of returns)
Here:
$25,493
State:
$18,201
(% of AGI for various income ranges: 14.5% for AGIs below $25k, 27.3% for AGIs $25k-50k, 69.6% for AGIs $50k-75k, 170.8% for AGIs $75k-100k, 525.7% for AGIs $100k-200k, 7391.2% for AGIs over 200k)
Taxes paid: $8,916 (reported on 25.4% of returns)
78731:
$8,916
State:
$7,821
(% of AGI for various income ranges: 35.3% for AGIs below $25k, 55.8% for AGIs $25k-50k, 124.9% for AGIs $50k-75k, 244.0% for AGIs $75k-100k, 591.6% for AGIs $100k-200k, 2149.5% for AGIs over 200k)
Earned income credit: $1,310 (reported on 4.8% of returns)
Here:
$1,310
State:
$2,584
(% of AGI for various income ranges: 36.9% for AGIs below $25k, 16.6% for AGIs $25k-50k)
Percentage of individuals using paid preparers for their 2020 taxes: 91.2%
Here:
91%
State:
92%
(% for various income ranges: 88.3% for AGIs below $25k, 91.5% for AGIs $25k-50k, 92.6% for AGIs $50k-75k, 89.0% for AGIs $75k-100k, 91.2% for AGIs $100k-200k, 93.3% for AGIs over 200k)
Averages for the 2012 tax year for zip code 78731, filed in 2013:
Average Adjusted Gross Income (AGI) in 2012: $209,621 (Individual Income Tax Returns)
Here:
$209,621
State:
$65,384
Salary/wage: $104,809 (reported on 76.2% of returns)
Here:
$104,809
State:
$52,524
(% of AGI for various income ranges: 73.8% for AGIs below $25k, 76.0% for AGIs $25k-50k, 65.1% for AGIs $50k-75k, 57.9% for AGIs $75k-100k, 60.9% for AGIs $100k-200k, 29.6% for AGIs over 200k)
Taxable interest for individuals: $3,973 (reported on 55.9% of returns)
This zip code:
$3,973
Texas:
$2,372
(% of AGI for various income ranges: 2.5% for AGIs below $25k, 1.2% for AGIs $25k-50k, 1.6% for AGIs $50k-75k, 1.8% for AGIs $75k-100k, 1.6% for AGIs $100k-200k, 0.9% for AGIs over 200k)
Ordinary dividends: $21,634 (reported on 46.9% of returns)
Here:
$21,634
State:
$9,721
(% of AGI for various income ranges: 5.9% for AGIs below $25k, 3.6% for AGIs $25k-50k, 4.4% for AGIs $50k-75k, 4.7% for AGIs $75k-100k, 4.7% for AGIs $100k-200k, 4.9% for AGIs over 200k)
Net capital gain/loss in AGI: +$90,685 (reported on 43.4% of returns)
Here:
+$90,685
State:
+$35,319
(% of AGI for various income ranges: 1.1% for AGIs below $25k, 1.1% for AGIs $25k-50k, 1.5% for AGIs $50k-75k, 2.2% for AGIs $75k-100k, 2.9% for AGIs $100k-200k, 24.3% for AGIs over 200k)
Profit/loss from business: +$40,155 (reported on 24.3% of returns)
Here:
+$40,155
State:
+$13,732
(% of AGI for various income ranges: 8.9% for AGIs below $25k, 4.7% for AGIs $25k-50k, 5.9% for AGIs $50k-75k, 6.6% for AGIs $75k-100k, 6.8% for AGIs $100k-200k, 4.0% for AGIs over 200k)
Taxable individual retirement arrangement distribution: $34,959 (reported on 14.8% of returns)
78731:
$34,959
Texas:
$19,511
(% of AGI for various income ranges: 3.2% for AGIs below $25k, 2.4% for AGIs $25k-50k, 3.8% for AGIs $50k-75k, 5.5% for AGIs $75k-100k, 4.7% for AGIs $100k-200k, 1.9% for AGIs over 200k)
Self-employment retirement plans: $24,432 (reported on 3.9% of returns)
78731:
$24,432
Texas:
$23,938
(% of AGI for various income ranges: 0.5% for AGIs $25k-50k, 0.4% for AGIs $75k-100k, 0.5% for AGIs $100k-200k, 0.5% for AGIs over 200k)
Total itemized deductions: $38,067 (10% of AGI, reported on 49.4% of returns)
Here:
$38,067
State:
$24,724
Here:
10.2% of AGI
State:
15.9% of AGI
(% of AGI for various income ranges: 18.3% for AGIs below $25k, 12.4% for AGIs $25k-50k, 15.1% for AGIs $50k-75k, 16.5% for AGIs $75k-100k, 16.3% for AGIs $100k-200k, 6.7% for AGIs over 200k)
Charity contributions: $10,782 (reported on 42.8% of returns)
Here:
$10,782
State:
$6,808
(% of AGI for various income ranges: 1.1% for AGIs below $25k, 1.0% for AGIs $25k-50k, 1.7% for AGIs $50k-75k, 2.3% for AGIs $75k-100k, 2.7% for AGIs $100k-200k, 2.2% for AGIs over 200k)
Taxes paid: $12,658 (reported on 48.8% of returns)
78731:
$12,658
State:
$6,921
(% of AGI for various income ranges: 4.6% for AGIs below $25k, 3.8% for AGIs $25k-50k, 5.0% for AGIs $50k-75k, 6.1% for AGIs $75k-100k, 6.3% for AGIs $100k-200k, 2.0% for AGIs over 200k)
Earned income credit: $1,179 (reported on 5.7% of returns)
Here:
$1,179
State:
$2,570
(% of AGI for various income ranges: 1.8% for AGIs below $25k, 0.2% for AGIs $25k-50k)
Percentage of individuals using paid preparers for their 2012 taxes: 47.9%
Here:
48%
State:
51%
(% for various income ranges: 34.9% for AGIs below $25k, 33.5% for AGIs $25k-50k, 41.9% for AGIs $50k-75k, 51.7% for AGIs $75k-100k, 55.5% for AGIs $100k-200k, 73.9% for AGIs over 200k)
Averages for the 2004 tax year for zip code 78731, filed in 2005:
Average Adjusted Gross Income (AGI) in 2004: $104,495 (Individual Income Tax Returns)
Here:
$104,495
State:
$47,881
Salary/wage: $76,642 (reported on 73.6% of returns)
Here:
$76,642
State:
$41,947
(% of AGI for various income ranges: 74.5% for AGIs $10k-25k, 68.9% for AGIs $25k-50k, 60.4% for AGIs $50k-75k, 58.0% for AGIs $75k-100k, 50.0% for AGIs over 100k)
Taxable interest for individuals: $3,912 (reported on 65.0% of returns)
This zip code:
$3,912
Texas:
$2,255
(% of AGI for various income ranges: 3.8% for AGIs $10k-25k, 3.4% for AGIs $25k-50k, 3.4% for AGIs $50k-75k, 2.8% for AGIs $75k-100k, 2.1% for AGIs over 100k)
Taxable dividends: $8,441 (reported on 51.9% of returns)
Here:
$8,441
State:
$4,261
(% of AGI for various income ranges: 4.8% for AGIs $10k-25k, 3.4% for AGIs $25k-50k, 3.9% for AGIs $50k-75k, 3.6% for AGIs $75k-100k, 4.2% for AGIs over 100k)
Net capital gain/loss: +$33,247 (reported on 48.0% of returns)
Here:
+$33,247
State:
+$16,110
(% of AGI for various income ranges: 2.3% for AGIs $10k-25k, 1.5% for AGIs $25k-50k, 2.0% for AGIs $50k-75k, 2.5% for AGIs $75k-100k, 19.2% for AGIs over 100k)
Profit/loss from business: +$31,193 (reported on 22.8% of returns)
Here:
+$31,193
State:
+$11,013
(% of AGI for various income ranges: 6.6% for AGIs $10k-25k, 6.2% for AGIs $25k-50k, 6.0% for AGIs $50k-75k, 7.6% for AGIs $75k-100k, 6.8% for AGIs over 100k)
IRA payment deduction: $3,452 (reported on 3.1% of returns)
78731:
$3,452
Texas:
$3,120
(% of AGI for various income ranges: 0.3% for AGIs $10k-25k, 0.2% for AGIs $25k-50k, 0.2% for AGIs $50k-75k, 0.2% for AGIs $75k-100k, 0.1% for AGIs over 100k)
Self-employed pension: $18,000 (reported on 4.7% of returns)
Here:
$18,000
Texas:
$16,401
(% of AGI for various income ranges: 0.4% for AGIs $25k-50k, 0.5% for AGIs $50k-75k, 0.5% for AGIs $75k-100k, 0.9% for AGIs over 100k)
Total itemized deductions: $26,510 (16% of AGI, reported on 49.4% of returns)
Here:
$26,510
State:
$19,631
Here:
16.5% of AGI
State:
18.9% of AGI
(% of AGI for various income ranges: 18.1% for AGIs $10k-25k, 16.3% for AGIs $25k-50k, 17.9% for AGIs $50k-75k, 18.3% for AGIs $75k-100k, 10.7% for AGIs over 100k)
Charity contributions deductions: $6,853 (4% of AGI, reported on 43.9% of returns)
Here:
$6,853
State:
$4,753
Here:
4.0% of AGI
State:
4.2% of AGI
(% of AGI for various income ranges: 1.5% for AGIs $10k-25k, 1.8% for AGIs $25k-50k, 2.2% for AGIs $50k-75k, 2.7% for AGIs $75k-100k, 3.1% for AGIs over 100k)
Total tax: $23,032 (reported on 84.9% of returns)
78731:
$23,032
State:
$9,058
(% of AGI for various income ranges: 5.7% for AGIs $10k-25k, 9.2% for AGIs $25k-50k, 11.8% for AGIs $50k-75k, 12.8% for AGIs $75k-100k, 21.0% for AGIs over 100k)
Earned income credit: $982 (reported on 3.6% of returns)
Here:
$982
State:
$2,024
Percentage of individuals using paid preparers for their 2004 taxes: 48.2%
Here:
48%
State:
57%
(% for various income ranges: 39.8% for AGIs below $10k, 35.6% for AGIs $10k-25k, 40.0% for AGIs $25k-50k, 51.0% for AGIs $50k-75k, 52.7% for AGIs $75k-100k, 62.4% for AGIs over 100k)
Likely homosexual households (counted as self-reported same-sex unmarried-partner households)
Lesbian couples: 0.0% of all households
Gay men: 0.6% of all households
Household received Food Stamps/SNAP in the past 12 months: 107 Household did not receive Food Stamps/SNAP in the past 12 months: 14,012
Women who had a birth in the past 12 months: 181 (165 now married, 18 unmarried) Women who did not have a birth in the past 12 months: 6,204 (2,923 now married, 3,275 unmarried)
Housing units in zip code 78731 with a mortgage: 4,145 (405 second mortgage, 7 home equity loan, 306 both second mortgage and home equity loan) Houses without a mortgage: 82
Median monthly owner costs for units with a mortgage: $3,857 Median monthly owner costs for units without a mortgage: $1,313
Residents with income below the poverty level in 2022:
This zip code:
8.0%
Whole state:
14.0%
Residents with income below 50% of the poverty level in 2022:
This zip code:
2.3%
Whole state:
7.4%
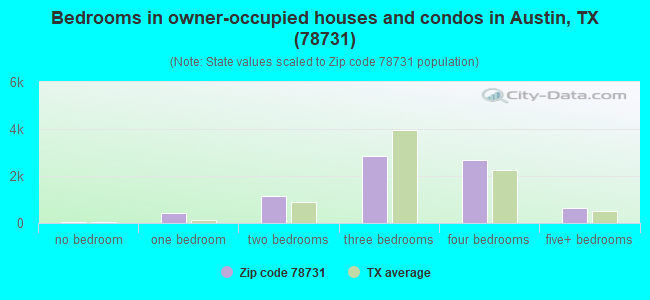
Median number of rooms in houses and condos:
Here:
7.4
State:
6.3
Median number of rooms in apartments:
Here:
3.2
State:
4.0
Notable locations in this zip code not listed on our city pages
Notable locations in zip code 78731: Camp Tom Wooten (A), Austin Fire Department Station 19 (B), Old Quarry Branch Austin City Library (C), Austin Fire Department Station 31 (D), Austin / Travis County Emergency Medical Service - Medic 08 (E). Display/hide their locations on the map
Churches in zip code 78731 include: Asbury United Methodist Church (A), Mims Chapel Church of God in Christ (B), Saint Theresa Catholic Church (C), First Presbyterian Church (D), Highland Park Baptist Church (E), Inner Light Ministries (F), International Buddhist Progress Society (G), Ascension Lutheran Church (H), Church of Christ of Highland Village (I). Display/hide their locations on the map
Parks in zip code 78731 include: Northwest Recreation Center (1), Mount Bonnell Park (2), Covert Park (3), Perry Park (4), Bull Creek Park (5), Bright Leaf State Natural Area (6), Allen Memorial County Park (7). Display/hide their locations on the map
Tourist attractions (not listed on the city page) : Above and Beyond Travel Inc (Tours & Charters; 3720 Far West Boulevard Suite 109), Around Austin Inc (Tours & Charters; 6836 Austin Center Boulevard Suite 250).
3,748 married couples with children.
663 single-parent households (75 men, 588 women).
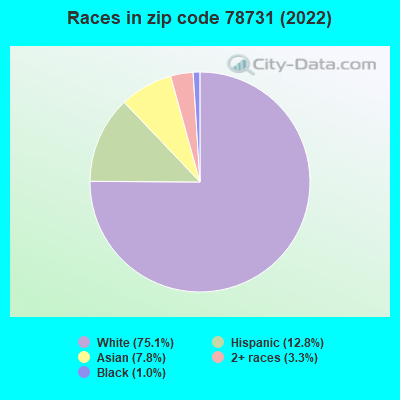
84.3% of residents of 78731 zip code speak English at home.
6.8% of residents speak Spanish at home (89% very well, 8% well, 2% not well, 1% not at all).
3.7% of residents speak other Indo-European language at home (92% very well, 8% well).
4.8% of residents speak Asian or Pacific Island language at home (59% very well, 34% well, 7% not well).
0.8% of residents speak other language at home (88% very well, 12% well).
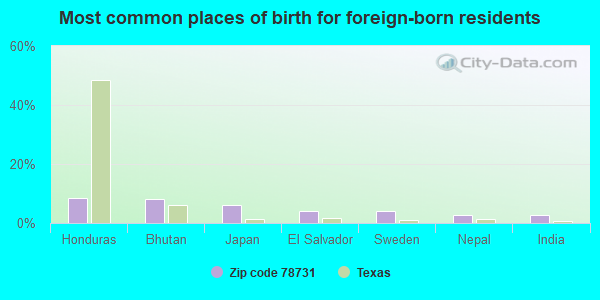
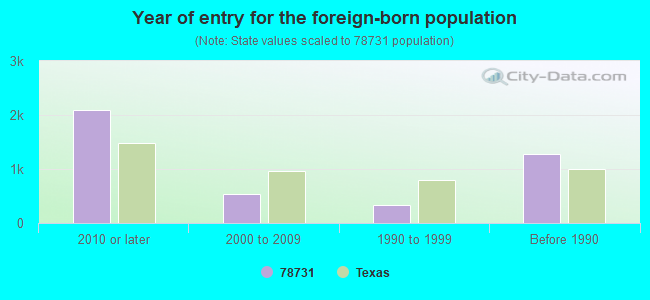
Foreign born population: 3,354 (12.4%) (45.9% of them are naturalized citizens)
Facilities with environmental interests located in this zip code:
AUSTIN ISD (3700 N HILLS DR in AUSTIN, TX)
(Resource Conservation and Recovery Act (tracking hazardous waste)) Alternative names: MURCHISON JUNIOR HIGH SCHOOL
AUSTIN STATE SCHOOL (4303 BULL CREEK RD in AUSTIN, TX)
COMPLIANCE ACTIVITY (Tracking inspections of insecticide, fungicide, and rodenticide, and toxic substances) Business SIC classification: RESIDENTIAL CARE Alternative names: AUSTIN STATE SCHOOL (VOC REHAB CENTER)
Housing units lacking complete plumbing facilities: 0.3% Housing units lacking complete kitchen facilities: 0.6%
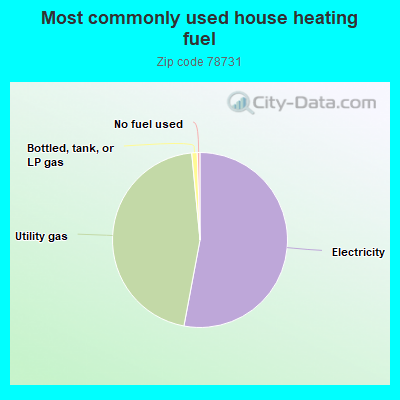
52.9%Electricity
45.5%Utility gas
1.0%Bottled, tank, or LP gas
0.5%No fuel used
Population in 1990: 23,276. Population change in the 1990s: +783 (+3.4%).
Place of birth for U.S.-born residents:
This state: 12,480
Northeast: 2,363
Midwest: 2,947
South: 3,041
West: 2,194
46% of the 78731 zip code residents lived in the same house 5 years ago. Out of people who lived in different houses, 52% lived in this county. Out of people who lived in different counties, 50% lived in Texas.
86% of the 78731 zip code residents lived in the same house 1 year ago. Out of people who lived in different houses, 54% moved from this county. Out of people who lived in different houses, 19% moved from different county within same state. Out of people who lived in different houses, 19% moved from different state. Out of people who lived in different houses, 8% moved from abroad.
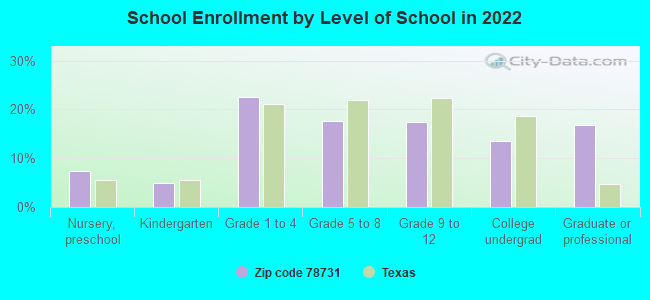
Private vs. public school enrollment:
Students in private schools in grades 1 to 8 (elementary and middle school): 824
Here:
34.4%
Texas:
8.8%
Students in private schools in grades 9 to 12 (high school): 199
Here:
19.7%
Texas:
8.0%
Students in private undergraduate colleges: 87
Here:
11.2%
Texas:
16.2%
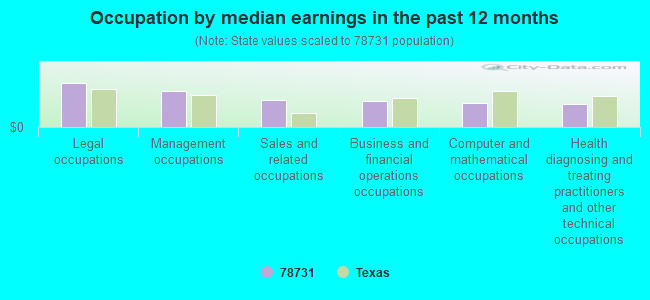
Occupation by median earnings in the past 12 months ($)
165,405Legal occupations
133,949Management occupations
100,692Sales and related occupations
99,281Business and financial operations occupations
92,026Computer and mathematical occupations
88,279Health diagnosing and treating practitioners and other technical occupations
Companies with biggest federal contracts located in this zip code (AUSTIN, TX):
TECOM, INCORPORATED (5608 PARKCREST DR STE 200) : $260,795,329 in 783 contractsfrom 1999 to 2006
Contracts for Other Professional Services, Other Administrative Support Services, Maintenance, Repair and Rebuilding of Equipment -- Miscellaneous, Maintenance, Repair or Alteration of Real Property -- Family Housing Facilities, and moreby Public Buildings Service, Air Force, Army, Internal Revenue Service, and others Signed by year:2000: $46,422,223; 2001: $27,159,593; 2002: $19,145,469; 2003: $79,181,209; 2004: $32,706,038; 2005: $36,548,412; 2006: $10,274,107.
Biggest contracts:
$53,496,618 with Public Buildings Service for Other Professional Services. Taking place in DC. Signed on 2003-02-15. Completion date: 2002-06-15.
$6,873,987 with Air Force for Other Administrative Support Services. Taking place in CO. Signed on 2000-10-01. Completion date: 2001-09-30.
$6,398,656, same as above.Signed on 2000-06-21. Completion date: 2000-09-30.
$5,947,099 with Air Force for Maintenance, Repair and Rebuilding of Equipment -- Miscellaneous. Taking place in GA. Signed on 1999-11-02. Completion date: 2000-09-30.
CYCORP INC (3721 EXECUTIVE CENTER DRIV; small business) : $27,641,358 in 68 contractsfrom 1999 to 2006
Contracts for Other Defense -- Applied Research and Exploratory Development (R&D), Other Defense -- Advanced Development (R&D), Other Defense -- Basic Research (R&D), Other Defense -- Operational Systems Development (R&D), and moreby Air Force, Defense Advanced Research Projects Agency, Department of Defense, Navy, and others Signed by year:2000: $7,312,345; 2001: $2,346,095; 2002: $4,868,629; 2003: $4,412,668; 2004: $2,812,737; 2005: $3,904,875; 2006: $1,609,009.
Biggest contracts:
$2,745,000 with Air Force for Other Defense -- Applied Research and Exploratory Development (R&D). Signed on 2000-12-05. Completion date: 2003-11-06.
$2,606,943, same as above.Signed on 2002-02-22. Completion date: 2003-11-06.
$1,878,043, same as above.Signed on 2000-06-14. Completion date: 2003-08-31.
$1,315,200 with Air Force for Other Defense -- Advanced Development (R&D). Signed on 2003-01-10. Completion date: 2007-11-18.
ATOMIC GAMES, INC (3301 NORTHLAND DR STE 501; small business) : $1,584,437 in 5 contractsfrom 2001 to 2004
Contracts for R&D-OTHER R & D-COMERCLIZ, ADP Software, Services -- Advanced Development (R&D) by Navy Signed by year:2000: $0; 2001: $322,183; 2002: $199,904; 2003: $259,226; 2004: $803,124; 2005: $0; 2006: $0.
Biggest contracts:
$803,124 with Navy for R&D-OTHER R & D-COMERCLIZ. Signed on 2004-07-07. Completion date: 2006-07-15.
$275,183 with Navy for ADP Software. Signed on 2001-01-24. Completion date: 2001-07-24.
$259,226 with Navy for Services -- Advanced Development (R&D). Signed on 2003-06-26. Completion date: 2003-10-24.
$199,904 with Navy for ADP Software. Signed on 2002-04-30. Completion date: 2003-09-03.
CLOCKWORK SOLUTIONS INC (8310 N CAPITAL OF TEXAS H; small business) : $1,418,376 in 3 contractsfrom 2000 to 2006
$998,647 with Army for Other ADP and Telecommunications Services (includes data storage on tapes, compact disks, etc.). Signed on 2000-09-12. Completion date: 2001-06-30.
$250,000 with Army for ADP Software. Signed on 2005-07-20. Completion date: 2005-10-31.
$169,729, same as above.Signed on 2006-02-24. Completion date: 2005-10-31.
BERNARD BLACK (3400 MOUNT BONNELL ROAD) : $645,000 in 9 contractsfrom 2000 to 2005
Contracts for Legal Services by Offices, Boards and Divisions (includes Attorney General, Deputy Attorney General, etc.) Signed by year:2000: $135,000; 2001: $80,000; 2002: $50,000; 2003: $160,000; 2004: $120,000; 2005: $100,000; 2006: $0.
Biggest contracts:
$160,000 with Offices, Boards and Divisions (includes Attorney General, Deputy Attorney General, etc.) for Legal Services. Taking place in DC. Signed on 2003-08-15. Completion date: 2004-08-15.
$100,000 with Offices, Boards and Divisions (includes Attorney General, Deputy Attorney General, etc.) for Legal Services. Signed on 2005-02-02. Completion date: 2006-02-01.
$90,000 with Offices, Boards and Divisions (includes Attorney General, Deputy Attorney General, etc.) for Legal Services. Taking place in DC. Signed on 2000-01-15. Completion date: 2000-09-15.
$80,000, same as above.Signed on 2001-05-15. Completion date: 2001-09-15.
INTERLEX INC (4606 HORSESHOE BND; small business) : $262,200 in 11 contractsfrom 2003 to 2006
Contracts for Live Animals, Not Raised for Food by Army Signed by year:2000: $0; 2001: $0; 2002: $0; 2003: $112,100; 2004: $114,000; 2005: $76,000; 2006: -$39,900.
Biggest contracts:
$76,000 with Army for Live Animals, Not Raised for Food. Taking place in MD. Signed on 2005-04-20. Completion date: 2005-09-06.
$76,000, same as above.Signed on 2004-08-03. Completion date: 2004-12-02.
$38,000, same as above.Signed on 2004-09-14. Completion date: 2005-01-13.
$38,000, same as above.Signed on 2003-08-27. Completion date: 2003-11-26.
CENTRAL TEXAS ORTHO PARTNERS L (7501C N CAPITAL OF TEXAS H; small business) : $120,000 in 12 contractsfrom 2003 to 2005
Contracts for Orthopedic Services, Medical and Surgical Instruments, Equipment, and Supplies, Lease or Rental of Equipment -- Medical, Dental, and Veterinary Equipment and Supplies, Ophthalmic Instruments, Equipment, and Supplies by Army Signed by year:2000: $0; 2001: $0; 2002: $0; 2003: $9,000; 2004: $102,000; 2005: $9,000; 2006: $0.
Biggest contracts:
$19,500 with Army for Orthopedic Services. Signed on 2004-07-16. Completion date: 2004-07-29.
$13,500 with Army for Medical and Surgical Instruments, Equipment, and Supplies. Signed on 2004-06-28. Completion date: 2004-06-17.
$12,000, same as above.Signed on 2004-03-02. Completion date: 2004-02-11.
$12,000, same as above.Signed on 2004-05-05. Completion date: 2004-04-30.
INNOVALIGHT, INC (6801 N 360 HWY BLDG 2, S; small business)
$99,958 with Air Force for Physical Sciences -- Management and Support (R&D). Signed on 2002-08-20. Completion date: 2003-08-14.
STEPHEN G WRIGHT, P E (3406 SHINOAK DRIVE; small business) : $72,800 in 3 contractsfrom 2000 to 2006
$27,400 with U.S. Army Corps of Engineers - civil program financing only for Engineering and Technical Services. Signed on 2000-04-04. Completion date: 2001-02-28.
$25,000 with Army for Other Research and Development -- Applied Research and Exploratory Development (R&D). Signed on 2006-03-02. Completion date: 2007-02-02.
$20,400, same as above.Signed on 2006-05-25. Completion date: 2007-02-02.
ENVIRONMENTAL SURVEY INC (4602 PLACID PL; small business) : $58,541 in 2 contractsfrom 2004 to 2005
$52,955 with Army for Land Treatment Practices Services (plowing/clearing, etc.). Signed on 2004-09-28. Completion date: 2005-04-26.
$5,586, same as above.Signed on 2005-04-27. Completion date: 2005-04-26.
Top industries in this zip code by the number of employees in 2005:
Health Care and Social Assistance: Home Health Care Services (over 1000 employees: 1 establishment, 500-999 employees: 1 establishment, 250-499 employees: 1 establishment, 100-249 employees: 3 establishments, 50-99 employees: 1 establishment, 20-49 employees: 1 establishment, 1-4 employees: 1 establishment)
Administrative and Support and Waste Management and Remediation Services: Temporary Help Services (100-249: 4, 50-99: 4, 20-49: 5, 10-19: 1, 5-9: 1, 1-4: 2)
Health Care and Social Assistance: Offices of Physicians (except Mental Health Specialists) (100-249: 1, 50-99: 1, 20-49: 6, 10-19: 9, 5-9: 13, 1-4: 32)
2002 - 2018 National Fire Incident Reporting System (NFIRS) incidents
Based on the data from the years 2002 - 2018 the average number of fire incidents per year is 41. The highest number of fires - 68 took place in 2011, and the least - 10 in 2017. The data has a growing trend.
When looking into fire subcategories, the most incidents belonged to: Outside Fires (43.1%), and Structure Fires (31.6%).
Fire incident types reported to NFIRS in Zip Code 78731


 Nearest zip codes: 78757, 78756, 78759, 78703, 78751, 78705.
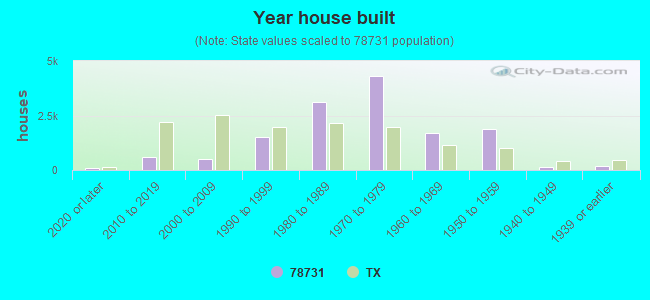


 Based on the data from the years 2002 - 2018 the average number of fire incidents per year is 41. The highest number of fires - 68 took place in 2011, and the least - 10 in 2017. The data has a growing trend.
 When looking into fire subcategories, the most incidents belonged to: Outside Fires (43.1%), and Structure Fires (31.6%).