Estimated zip code population in 2022: 25,860 Zip code population in 2010: 21,310 Zip code population in 2000: 21,415
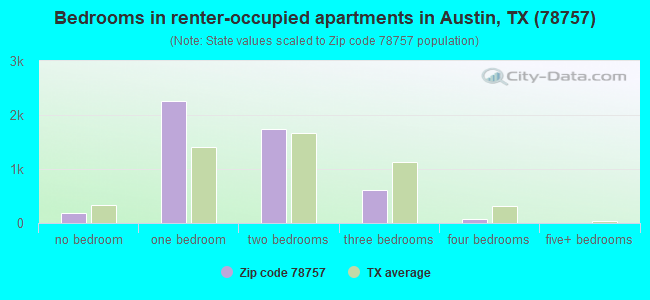
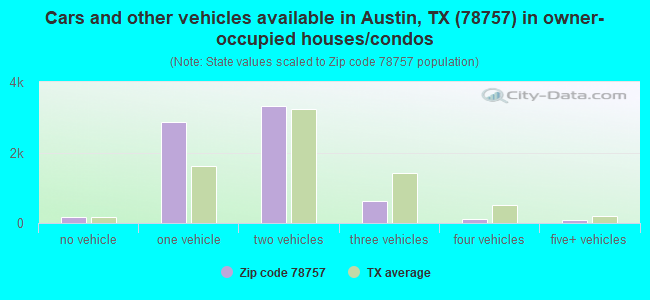
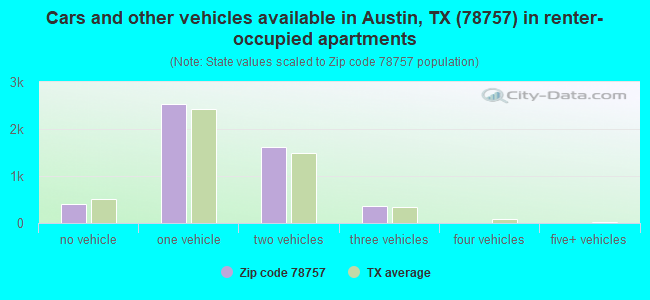
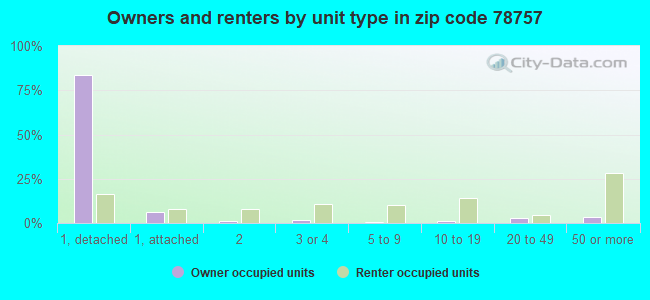
Houses and condos: 12,308 Renter-occupied apartments: 4,912
% of renters here:
41%
State:
38%
March 2022 cost of living index in zip code 78757: 96.3 (near average, U.S. average is 100)
Land area: 4.9 sq. mi. Water area: 0.0 sq. mi.
Population density: 5,261 people per square mile
(average).
OSM Map
General Map
Google Map
MSN Map
OSM Map
General Map
Google Map
MSN Map
OSM Map
General Map
Google Map
MSN Map
OSM Map
General Map
Google Map
MSN Map
Please wait while loading the map...
Real estate property taxes paid for housing units in 2022:
This zip code:
1.4% ($9,585)
Texas:
1.5% ($4,050)
Median real estate property taxes paid for housing units with mortgages in 2022: $10,478 (1.4%) Median real estate property taxes paid for housing units with no mortgage in 2022: $8,123 (1.3%)
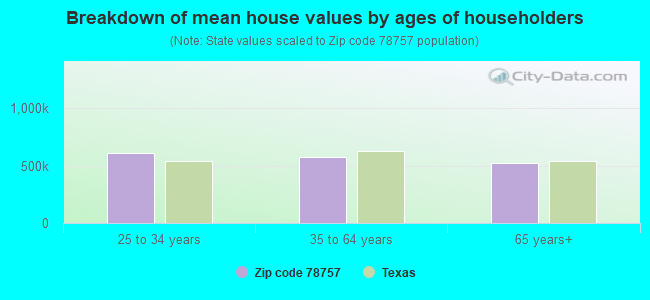
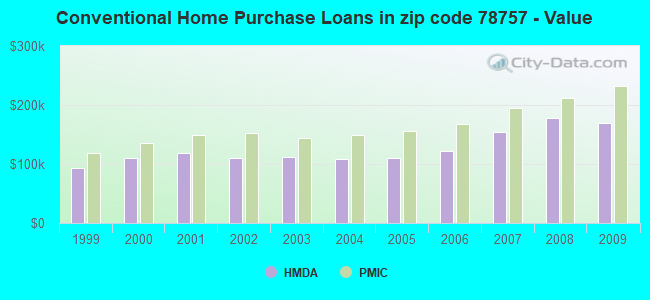
Estimated median house/condo value in 2022: $693,013
78757:
$693,013
Texas:
$275,400
According to our research of Texas and other state lists, there were 26 registered sex offenders living in 78757 zip code as of April 27, 2024. The ratio of all residents to sex offenders in zip code 78757 is 921 to 1. The ratio of registered sex offenders to all residents in this zip code is lower than the state average.
Median resident age:
This zip code:
38.5 years
Texas median age:
35.6 years
Average household size:
This zip code:
2.1 people
Texas:
2.6 people
Averages for the 2020 tax year for zip code 78757, filed in 2021:
Average Adjusted Gross Income (AGI) in 2020: $122,701 (Individual Income Tax Returns)
Here:
$122,701
State:
$77,054
Salary/wage: $100,210 (reported on 83.8% of returns)
Here:
$100,210
State:
$62,766
(% of AGI for various income ranges: 1226.4% for AGIs below $25k, 3886.1% for AGIs $25k-50k, 6910.5% for AGIs $50k-75k, 10080.4% for AGIs $75k-100k, 21089.2% for AGIs $100k-200k, 85727.2% for AGIs over 200k)
Taxable interest for individuals: $1,841 (reported on 42.6% of returns)
This zip code:
$1,841
Texas:
$2,665
(% of AGI for various income ranges: 20.0% for AGIs below $25k, 25.1% for AGIs $25k-50k, 55.4% for AGIs $50k-75k, 106.4% for AGIs $75k-100k, 130.8% for AGIs $100k-200k, 967.0% for AGIs over 200k)
Ordinary dividends: $6,825 (reported on 35.8% of returns)
Here:
$6,825
State:
$10,044
(% of AGI for various income ranges: 54.1% for AGIs below $25k, 62.1% for AGIs $25k-50k, 141.9% for AGIs $50k-75k, 304.3% for AGIs $75k-100k, 519.8% for AGIs $100k-200k, 2938.6% for AGIs over 200k)
Net capital gain/loss in AGI: +$37,027 (reported on 33.3% of returns)
Here:
+$37,027
State:
+$39,590
(% of AGI for various income ranges: 27.7% for AGIs below $25k, 56.4% for AGIs $25k-50k, 137.2% for AGIs $50k-75k, 376.4% for AGIs $75k-100k, 728.8% for AGIs $100k-200k, 23515.6% for AGIs over 200k)
Profit/loss from business: +$22,561 (reported on 21.3% of returns)
Here:
+$22,561
State:
+$10,888
(% of AGI for various income ranges: 214.0% for AGIs below $25k, 260.1% for AGIs $25k-50k, 395.7% for AGIs $50k-75k, 627.8% for AGIs $75k-100k, 1244.7% for AGIs $100k-200k, 4215.3% for AGIs over 200k)
Taxable individual retirement arrangement distribution: $21,722 (reported on 7.4% of returns)
78757:
$21,722
Texas:
$24,740
(% of AGI for various income ranges: 49.1% for AGIs below $25k, 68.3% for AGIs $25k-50k, 117.7% for AGIs $50k-75k, 230.8% for AGIs $75k-100k, 489.5% for AGIs $100k-200k, 1384.9% for AGIs over 200k)
Self-employed (Keogh) retirement plans: $20,275 (reported on 1.7% of returns)
78757:
$20,275
Texas:
$29,298
(% of AGI for various income ranges: 30.8% for AGIs $50k-75k, 68.9% for AGIs $100k-200k, 484.6% for AGIs over 200k)
Total itemized deductions: $30,103 (reported on 16.4% of returns)
Here:
$30,103
State:
$40,428
(% of AGI for various income ranges: 90.7% for AGIs below $25k, 135.2% for AGIs $25k-50k, 296.5% for AGIs $50k-75k, 590.1% for AGIs $75k-100k, 1266.8% for AGIs $100k-200k, 5480.7% for AGIs over 200k)
Charity contributions: $8,799 (reported on 12.5% of returns)
Here:
$8,799
State:
$18,201
(% of AGI for various income ranges: 4.6% for AGIs below $25k, 14.1% for AGIs $25k-50k, 46.7% for AGIs $50k-75k, 68.1% for AGIs $75k-100k, 184.5% for AGIs $100k-200k, 1671.6% for AGIs over 200k)
Taxes paid: $8,912 (reported on 16.2% of returns)
78757:
$8,912
State:
$7,821
(% of AGI for various income ranges: 26.0% for AGIs below $25k, 45.6% for AGIs $25k-50k, 98.5% for AGIs $50k-75k, 197.6% for AGIs $75k-100k, 422.2% for AGIs $100k-200k, 1398.1% for AGIs over 200k)
Earned income credit: $1,513 (reported on 6.8% of returns)
Here:
$1,513
State:
$2,584
(% of AGI for various income ranges: 54.0% for AGIs below $25k, 20.3% for AGIs $25k-50k)
Percentage of individuals using paid preparers for their 2020 taxes: 91.7%
Here:
92%
State:
92%
(% for various income ranges: 88.5% for AGIs below $25k, 91.4% for AGIs $25k-50k, 91.3% for AGIs $50k-75k, 91.4% for AGIs $75k-100k, 92.4% for AGIs $100k-200k, 95.6% for AGIs over 200k)
Averages for the 2012 tax year for zip code 78757, filed in 2013:
Average Adjusted Gross Income (AGI) in 2012: $66,610 (Individual Income Tax Returns)
Here:
$66,610
State:
$65,384
Salary/wage: $58,634 (reported on 83.0% of returns)
Here:
$58,634
State:
$52,524
(% of AGI for various income ranges: 74.3% for AGIs below $25k, 79.4% for AGIs $25k-50k, 76.1% for AGIs $50k-75k, 77.2% for AGIs $75k-100k, 80.0% for AGIs $100k-200k, 54.1% for AGIs over 200k)
Taxable interest for individuals: $1,250 (reported on 40.5% of returns)
This zip code:
$1,250
Texas:
$2,372
(% of AGI for various income ranges: 0.9% for AGIs below $25k, 0.6% for AGIs $25k-50k, 0.7% for AGIs $50k-75k, 0.6% for AGIs $75k-100k, 0.4% for AGIs $100k-200k, 1.4% for AGIs over 200k)
Ordinary dividends: $4,100 (reported on 27.1% of returns)
Here:
$4,100
State:
$9,721
(% of AGI for various income ranges: 2.7% for AGIs below $25k, 1.4% for AGIs $25k-50k, 1.4% for AGIs $50k-75k, 1.5% for AGIs $75k-100k, 1.5% for AGIs $100k-200k, 2.1% for AGIs over 200k)
Net capital gain/loss in AGI: +$15,540 (reported on 21.8% of returns)
Here:
+$15,540
State:
+$35,319
(% of AGI for various income ranges: 0.4% for AGIs below $25k, 0.5% for AGIs $25k-50k, 0.8% for AGIs $50k-75k, 1.0% for AGIs $75k-100k, 1.8% for AGIs $100k-200k, 19.2% for AGIs over 200k)
Profit/loss from business: +$17,496 (reported on 20.4% of returns)
Here:
+$17,496
State:
+$13,732
(% of AGI for various income ranges: 10.9% for AGIs below $25k, 5.8% for AGIs $25k-50k, 4.6% for AGIs $50k-75k, 4.1% for AGIs $75k-100k, 6.0% for AGIs $100k-200k, 4.0% for AGIs over 200k)
Taxable individual retirement arrangement distribution: $11,666 (reported on 8.9% of returns)
78757:
$11,666
Texas:
$19,511
(% of AGI for various income ranges: 2.7% for AGIs below $25k, 1.5% for AGIs $25k-50k, 1.8% for AGIs $50k-75k, 1.9% for AGIs $75k-100k, 1.4% for AGIs $100k-200k, 1.1% for AGIs over 200k)
Self-employment retirement plans: $13,638 (reported on 1.4% of returns)
78757:
$13,638
Texas:
$23,938
(% of AGI for various income ranges: 0.2% for AGIs $25k-50k, 0.2% for AGIs $75k-100k, 0.3% for AGIs $100k-200k, 0.6% for AGIs over 200k)
Total itemized deductions: $18,661 (17% of AGI, reported on 34.4% of returns)
Here:
$18,661
State:
$24,724
Here:
16.7% of AGI
State:
15.9% of AGI
(% of AGI for various income ranges: 10.0% for AGIs below $25k, 7.2% for AGIs $25k-50k, 10.8% for AGIs $50k-75k, 12.2% for AGIs $75k-100k, 11.3% for AGIs $100k-200k, 6.6% for AGIs over 200k)
Charity contributions: $2,945 (reported on 26.4% of returns)
Here:
$2,945
State:
$6,808
(% of AGI for various income ranges: 0.6% for AGIs below $25k, 0.7% for AGIs $25k-50k, 1.2% for AGIs $50k-75k, 1.2% for AGIs $75k-100k, 1.4% for AGIs $100k-200k, 1.3% for AGIs over 200k)
Taxes paid: $7,015 (reported on 33.9% of returns)
78757:
$7,015
State:
$6,921
(% of AGI for various income ranges: 2.9% for AGIs below $25k, 2.6% for AGIs $25k-50k, 4.0% for AGIs $50k-75k, 4.5% for AGIs $75k-100k, 4.3% for AGIs $100k-200k, 2.4% for AGIs over 200k)
Earned income credit: $1,563 (reported on 10.1% of returns)
Here:
$1,563
State:
$2,570
(% of AGI for various income ranges: 3.2% for AGIs below $25k, 0.3% for AGIs $25k-50k)
Percentage of individuals using paid preparers for their 2012 taxes: 35.0%
Here:
35%
State:
51%
(% for various income ranges: 32.9% for AGIs below $25k, 29.0% for AGIs $25k-50k, 32.6% for AGIs $50k-75k, 36.8% for AGIs $75k-100k, 42.8% for AGIs $100k-200k, 66.7% for AGIs over 200k)
Averages for the 2004 tax year for zip code 78757, filed in 2005:
Average Adjusted Gross Income (AGI) in 2004: $45,578 (Individual Income Tax Returns)
Here:
$45,578
State:
$47,881
Salary/wage: $41,193 (reported on 81.0% of returns)
Here:
$41,193
State:
$41,947
(% of AGI for various income ranges: 109.6% for AGIs below $10k, 76.0% for AGIs $10k-25k, 81.0% for AGIs $25k-50k, 73.3% for AGIs $50k-75k, 75.4% for AGIs $75k-100k, 64.0% for AGIs over 100k)
Taxable interest for individuals: $1,472 (reported on 48.6% of returns)
This zip code:
$1,472
Texas:
$2,255
(% of AGI for various income ranges: 6.6% for AGIs below $10k, 1.8% for AGIs $10k-25k, 1.1% for AGIs $25k-50k, 1.6% for AGIs $50k-75k, 1.4% for AGIs $75k-100k, 1.7% for AGIs over 100k)
Taxable dividends: $2,229 (reported on 26.9% of returns)
Here:
$2,229
State:
$4,261
(% of AGI for various income ranges: 4.0% for AGIs below $10k, 1.4% for AGIs $10k-25k, 0.9% for AGIs $25k-50k, 1.3% for AGIs $50k-75k, 1.2% for AGIs $75k-100k, 1.6% for AGIs over 100k)
Net capital gain/loss: +$7,597 (reported on 23.2% of returns)
Here:
+$7,597
State:
+$16,110
(% of AGI for various income ranges: -1.4% for AGIs below $10k, -0.4% for AGIs $10k-25k, 0.4% for AGIs $25k-50k, 1.0% for AGIs $50k-75k, 1.7% for AGIs $75k-100k, 11.2% for AGIs over 100k)
Profit/loss from business: +$14,880 (reported on 18.5% of returns)
Here:
+$14,880
State:
+$11,013
(% of AGI for various income ranges: 12.3% for AGIs below $10k, 6.8% for AGIs $10k-25k, 4.0% for AGIs $25k-50k, 4.6% for AGIs $50k-75k, 6.4% for AGIs $75k-100k, 7.8% for AGIs over 100k)
IRA payment deduction: $2,629 (reported on 3.0% of returns)
78757:
$2,629
Texas:
$3,120
(% of AGI for various income ranges: 0.2% for AGIs $10k-25k, 0.2% for AGIs $25k-50k, 0.2% for AGIs $50k-75k, 0.1% for AGIs $75k-100k, 0.1% for AGIs over 100k)
Self-employed pension: $10,233 (reported on 1.2% of returns)
Here:
$10,233
Texas:
$16,401
(% of AGI for various income ranges: 0.1% for AGIs $10k-25k, 0.1% for AGIs $25k-50k, 0.2% for AGIs $50k-75k, 0.3% for AGIs $75k-100k, 0.5% for AGIs over 100k)
Total itemized deductions: $15,618 (22% of AGI, reported on 33.5% of returns)
Here:
$15,618
State:
$19,631
Here:
21.5% of AGI
State:
18.9% of AGI
(% of AGI for various income ranges: 15.2% for AGIs below $10k, 9.3% for AGIs $10k-25k, 10.8% for AGIs $25k-50k, 13.2% for AGIs $50k-75k, 13.3% for AGIs $75k-100k, 10.4% for AGIs over 100k)
Charity contributions deductions: $2,676 (3% of AGI, reported on 27.1% of returns)
Here:
$2,676
State:
$4,753
Here:
3.5% of AGI
State:
4.2% of AGI
(% of AGI for various income ranges: 0.8% for AGIs below $10k, 0.8% for AGIs $10k-25k, 1.0% for AGIs $25k-50k, 1.6% for AGIs $50k-75k, 1.9% for AGIs $75k-100k, 2.1% for AGIs over 100k)
Total tax: $6,875 (reported on 82.7% of returns)
78757:
$6,875
State:
$9,058
(% of AGI for various income ranges: 4.3% for AGIs below $10k, 5.1% for AGIs $10k-25k, 8.8% for AGIs $25k-50k, 11.4% for AGIs $50k-75k, 12.9% for AGIs $75k-100k, 18.4% for AGIs over 100k)
Earned income credit: $1,362 (reported on 9.8% of returns)
Here:
$1,362
State:
$2,024
Percentage of individuals using paid preparers for their 2004 taxes: 39.6%
Here:
40%
State:
57%
(% for various income ranges: 39.6% for AGIs below $10k, 41.7% for AGIs $10k-25k, 34.7% for AGIs $25k-50k, 39.3% for AGIs $50k-75k, 40.8% for AGIs $75k-100k, 49.9% for AGIs over 100k)
Likely homosexual households (counted as self-reported same-sex unmarried-partner households)
Lesbian couples: 0.5% of all households
Gay men: 0.2% of all households
Household received Food Stamps/SNAP in the past 12 months: 400 Household did not receive Food Stamps/SNAP in the past 12 months: 11,558
Women who had a birth in the past 12 months: 223 (171 now married, 52 unmarried) Women who did not have a birth in the past 12 months: 6,942 (3,115 now married, 3,825 unmarried)
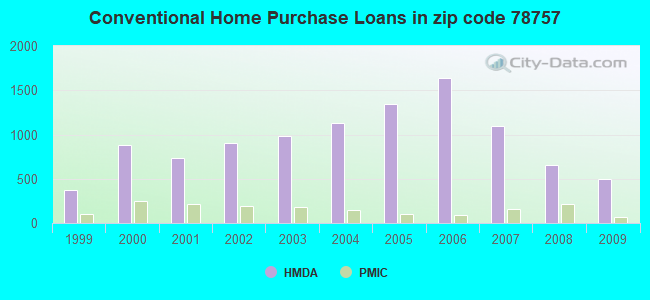
Housing units in zip code 78757 with a mortgage: 4,602 (437 second mortgage, 39 home equity loan, 266 both second mortgage and home equity loan) Houses without a mortgage: 70
Median monthly owner costs for units with a mortgage: $2,901 Median monthly owner costs for units without a mortgage: $1,017
Residents with income below the poverty level in 2022:
This zip code:
8.8%
Whole state:
14.0%
Residents with income below 50% of the poverty level in 2022:
This zip code:
6.0%
Whole state:
7.4%
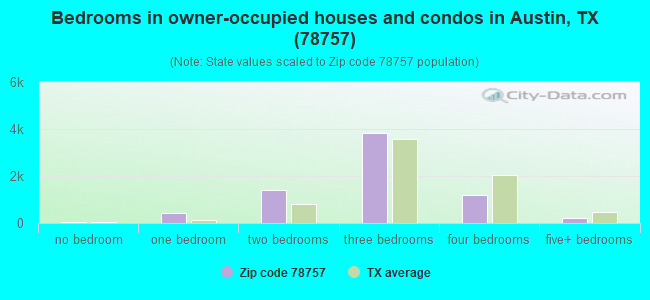
Median number of rooms in houses and condos:
Here:
5.6
State:
6.3
Median number of rooms in apartments:
Here:
3.6
State:
4.0
Notable locations in this zip code not listed on our city pages
Notable locations in zip code 78757: Austin Fire Department Station 16 (A), Austin Independent School District Library Media Center (B), North Village Branch Austin City Library (C), Northwest Baptist Child Development Center (D). Display/hide their locations on the map
Shopping Centers: Northcross Shopping Center (1), North Village Shopping Center (2), Crossroads Shopping Center (3), La Frontera Shopping Center (4), West Anderson Plaza Shopping Center (5). Display/hide their locations on the map
Churches in zip code 78757 include: Grace Church of the Nazarene (A), Saint Louis Catholic Church (B), First Cumberland Presbyterian Church (C), Grace of the Good Shepherd Church (D), Gracia de El Buen Pastor (E), Hope Chapel (F), Koenig Lane Christian Church (G), Lord's Church of Austin (H), Maranatha Christian Church (I). Display/hide their locations on the map
In group quarters: 197 (-1 institutionalized population)
Size of family households: 2,727 2-persons, 1,646 3-persons, 1,083 4-persons, 363 5-persons, 298 6-persons, 71 7-or-more-persons
Size of nonfamily households: 4,168 1-person, 1,751 2-persons, 30 3-persons
3,883 married couples with children.
1,045 single-parent households (382 men, 663 women).
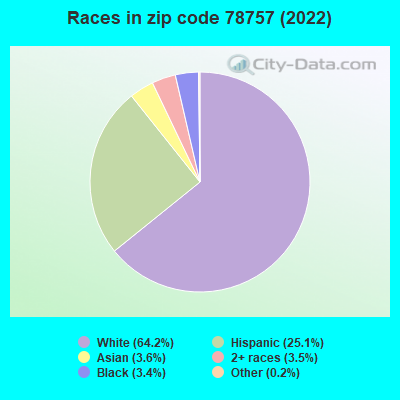
77.1% of residents of 78757 zip code speak English at home.
17.5% of residents speak Spanish at home (67% very well, 15% well, 17% not well, 1% not at all).
2.4% of residents speak other Indo-European language at home (93% very well, 7% well).
1.9% of residents speak Asian or Pacific Island language at home (90% very well, 10% well).
0.8% of residents speak other language at home (64% very well, 36% well).
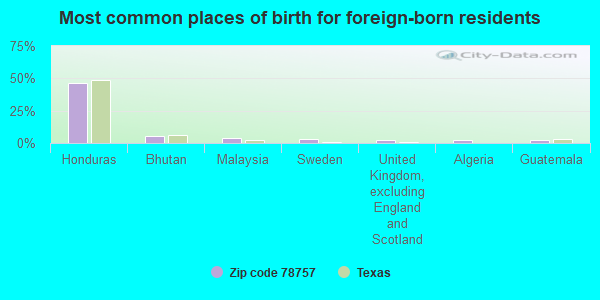
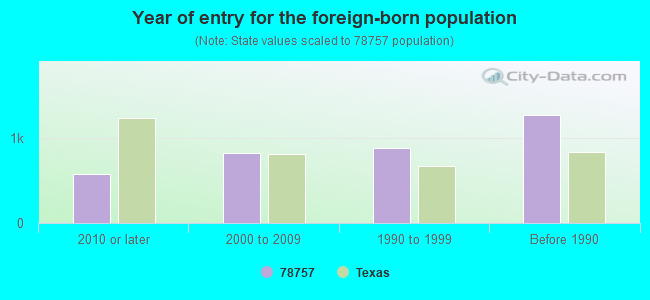
Foreign born population: 3,321 (12.8%) (60.5% of them are naturalized citizens)
Facilities with environmental interests located in this zip code:
ANDERSON LANE BODY SHOP (1115 W ANDERSON LN in AUSTIN, TX)
(Resource Conservation and Recovery Act (tracking hazardous waste))
AUSTIN COMPLETE AUTO REFINISH (821 BRENTWOOD in AUSTIN, TX)
(Resource Conservation and Recovery Act (tracking hazardous waste)) Alternative names: AUSTIN COMPLETE AUTO REFINISHING
AUSTIN ISD (6201 WAYNONA in AUSTIN, TX)
(Resource Conservation and Recovery Act (tracking hazardous waste)) Alternative names: LAMAR JUNIOR HIGH SCHOOL
AUSTIN REPAIR SHOP (8710 BURNET RD in AUSTIN, TX)
Conditionally Exempt Small Quantity Generators, less than 100 kg/month of hazardous waste (Resource Conservation and Recovery Act (tracking hazardous waste)) TRANSPORTER (Resource Conservation and Recovery Act (tracking hazardous waste))
AUSTIN BRIDGE & ROAD (7800 SHOAL CREEK BLVD STE 142 S in AUSTIN, TX)
COMPLIANCE ACTIVITY (Tracking inspections of insecticide, fungicide, and rodenticide, and toxic substances) Business SIC classification: HIGHWAY AND STREET CONSTRUCTION, EXCEPT ELEVATED HIGHWAYS
Housing units lacking complete plumbing facilities: 0.4% Housing units lacking complete kitchen facilities: 0.5%
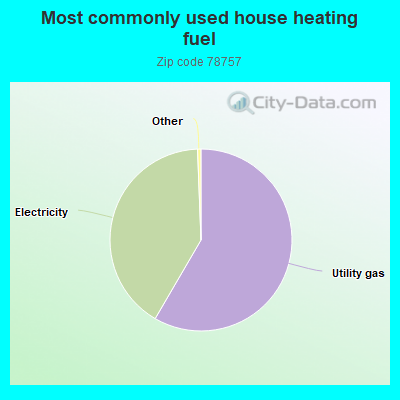
58.4%Utility gas
41.0%Electricity
Population in 1990: 11,723. Population change in the 1990s: +9,692 (+82.7%).
Place of birth for U.S.-born residents:
This state: 13,256
Northeast: 2,188
Midwest: 2,006
South: 2,978
West: 1,755
47% of the 78757 zip code residents lived in the same house 5 years ago. Out of people who lived in different houses, 63% lived in this county. Out of people who lived in different counties, 50% lived in Texas.
85% of the 78757 zip code residents lived in the same house 1 year ago. Out of people who lived in different houses, 59% moved from this county. Out of people who lived in different houses, 21% moved from different county within same state. Out of people who lived in different houses, 14% moved from different state. Out of people who lived in different houses, 5% moved from abroad.
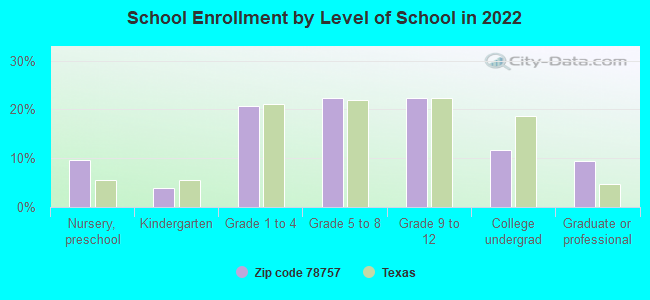
Private vs. public school enrollment:
Students in private schools in grades 1 to 8 (elementary and middle school): 401
Here:
16.0%
Texas:
8.8%
Students in private schools in grades 9 to 12 (high school): 139
Here:
10.7%
Texas:
8.0%
Students in private undergraduate colleges: 119
Here:
17.6%
Texas:
16.2%
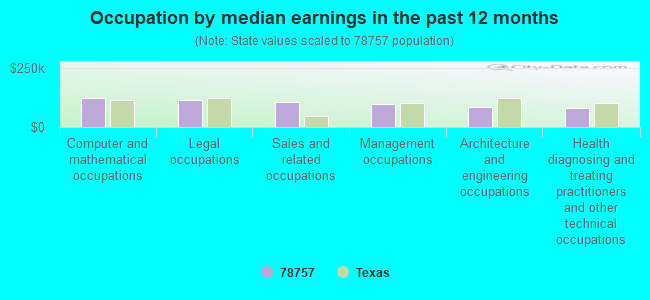
Occupation by median earnings in the past 12 months ($)
123,627Computer and mathematical occupations
115,469Legal occupations
103,691Sales and related occupations
96,639Management occupations
83,212Architecture and engineering occupations
80,496Health diagnosing and treating practitioners and other technical occupations
Companies with federal contracts located in this zip code (AUSTIN, TX):
ONLINE ALCHEMY INC (8000 ANDERSON SQUARE LANE; small business) : $1,299,000 in 4 contractsfrom 2004 to 2006
$450,000 with Army for Other Defense -- Applied Research and Exploratory Development (R&D). Signed on 2005-03-01. Completion date: 2005-10-31.
$375,000, same as above.Signed on 2006-07-07. Completion date: 2007-03-30.
$375,000, same as above.Signed on 2005-09-21. Completion date: 2006-03-19.
$99,000 with Army for Physical Sciences -- Applied Research and Exploratory Development (R&D). Signed on 2004-06-21. Completion date: 2005-01-06.
INGRID SVIHLA (6204 CARY DR; small business)
$47,250 with Army for Pharmacology Services. Taking place in HI. Signed on 2004-09-02. Completion date: 2005-09-30.
PRO-ED INC (8700 SHOAL CREEK BLVD; small business) : $21,363 in 45 contractsfrom 2004 to 2006
Contracts for Books and Pamphlets, Other Education and Training Services, Medical and Surgical Instruments, Equipment, and Supplies, Miscellaneous Items, and moreby Navy, Indian Affairs (Assistant Secretary), Department of Defense Education Activity, Department of Veterans Affairs, and others Signed by year:2000: $0; 2001: $0; 2002: $0; 2003: $0; 2004: $7,317; 2005: $7,302; 2006: $6,744.
Biggest contracts:
$4,681 with Navy for Books and Pamphlets. Signed on 2004-12-17. Completion date: 2005-01-14.
$3,787, same as above.Signed on 2005-09-02. Completion date: 2005-09-30.
$3,167 with Indian Affairs (Assistant Secretary) for Books and Pamphlets. Taking place in AZ. Signed on 2005-02-01. Completion date: 2005-04-30.
$2,636 with Indian Affairs (Assistant Secretary) for Other Education and Training Services. Signed on 2004-05-17. Effective on 2004-05-19. Completion date: 2004-06-30.
BRUCE VICTOR MARSHALL (7506 ST CECELIA STREET; small business) : $18,736 in 4 contractsfrom 2005 to 2006
$6,256 with Army for Other Housekeeping Services. Signed on 2006-01-31. Completion date: 2006-09-30.
$6,240, same as above.Signed on 2005-03-04. Completion date: 2005-09-30.
$6,240 with U.S. Army Corps of Engineers - civil program financing only for Other Housekeeping Services. Signed on 2005-03-04. Completion date: 2005-09-30.
$0 with Army for Services -- Basic Research (R&D). Signed on 2005-09-01. Effective on 2005-08-04. Completion date: 2007-03-31.
LOUIS SHANKS OF TEXAS, INC (2930 WEST ANDERSON LANE; small business) : $17,108 in 2 contractsin 2004
$11,158 with Army for Household Furnishings. Signed on 2004-04-12. Completion date: 2004-05-07.
$5,950 with Army for Medical and Surgical Instruments, Equipment, and Supplies. Signed on 2004-08-24. Completion date: 2004-09-10.
SUNGATE MEDICAL LLC (8711 BURNET RD STE D43; small business) : $13,255 in 2 contractsfrom 2005 to 2006
$6,910 with Army for Medical and Surgical Instruments, Equipment, and Supplies. Signed on 2005-09-24. Completion date: 2005-10-15.
$6,345, same as above.Signed on 2006-04-20. Completion date: 2006-05-31.
COOK ADVERTISING SPEC , INC (5908 AURORA DR; small business)
$5,996 with Army for Signs, Advertising Displays, and Identification Plates. Signed on 2002-09-30. Completion date: 2002-10-31.
R W GONZALEZ OFFICE PRODUCTS, (8711 BURNET RD STE D-42; small business)
$3,492 with Army for Photographic Projection Equipment. Signed on 2006-01-10. Completion date: 2006-01-13.
DRUEPPLE, NORA D (1212 RUTH AVE; small business)
$2,500 with Army for Other Management Support Services. Signed on 2005-12-22. Completion date: 2005-12-22.
Top industries in this zip code by the number of employees in 2005:
Administrative and Support and Waste Management and Remediation Services: Temporary Help Services (250-499 employees: 4 establishments, 100-249 employees: 2 establishments, 20-49 employees: 3 establishments, 10-19 employees: 2 establishments, 1-4 employees: 1 establishment)
2002 - 2018 National Fire Incident Reporting System (NFIRS) incidents
According to the data from the years 2002 - 2018 the average number of fires per year is 45. The highest number of fire incidents - 71 took place in 2006, and the least - 5 in 2017. The data has a constant trend.
When looking into fire subcategories, the most incidents belonged to: Outside Fires (48.6%), and Structure Fires (33.6%).
Fire incident types reported to NFIRS in Zip Code 78757

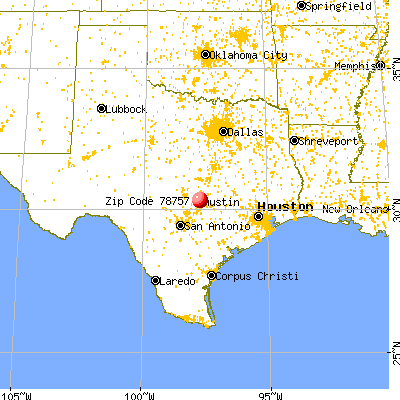


 Nearest zip codes: 78756, 78752, 78731, 78751, 78758, 78705.
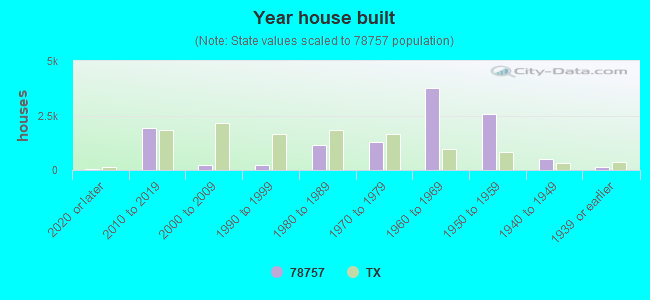


 According to the data from the years 2002 - 2018 the average number of fires per year is 45. The highest number of fire incidents - 71 took place in 2006, and the least - 5 in 2017. The data has a constant trend.
 When looking into fire subcategories, the most incidents belonged to: Outside Fires (48.6%), and Structure Fires (33.6%).