Estimated zip code population in 2022: 16,764 Zip code population in 2010: 14,385 Zip code population in 2000: 14,005
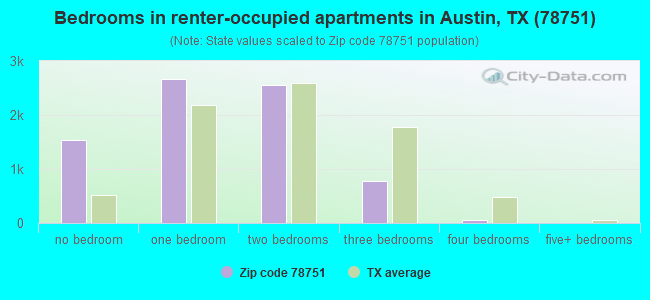
Houses and condos: 10,155 Renter-occupied apartments: 7,389
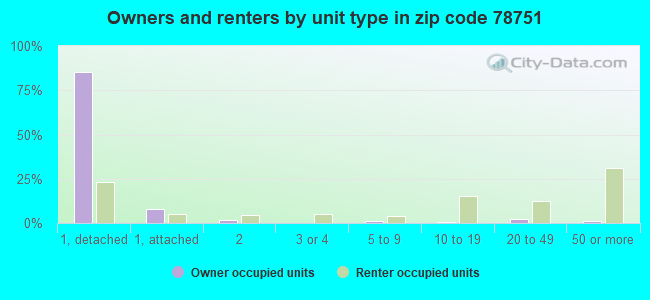
% of renters here:
78%
State:
38%
March 2022 cost of living index in zip code 78751: 99.1 (near average, U.S. average is 100)
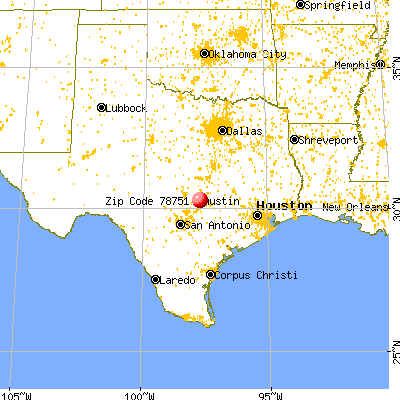
Land area: 2.4 sq. mi. Water area: 0.0 sq. mi.
Population density: 6,995 people per square mile
(high).
OSM Map
General Map
Google Map
MSN Map
OSM Map
General Map
Google Map
MSN Map
OSM Map
General Map
Google Map
MSN Map
OSM Map
General Map
Google Map
MSN Map
Please wait while loading the map...
Real estate property taxes paid for housing units in 2022:
This zip code:
1.4% ($10,460)
Texas:
1.5% ($4,050)
Median real estate property taxes paid for housing units with mortgages in 2022: $10,505 (1.4%) Median real estate property taxes paid for housing units with no mortgage in 2022: $9,431 (1.4%)
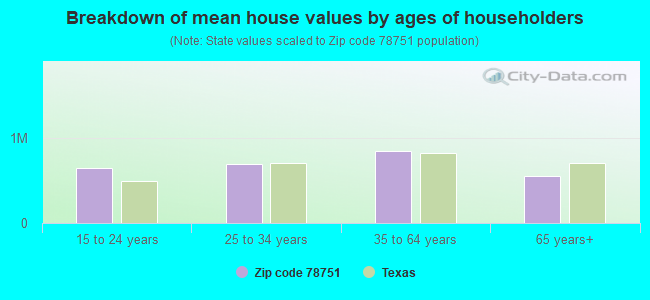
Estimated median house/condo value in 2022: $725,066
78751:
$725,066
Texas:
$275,400
According to our research of Texas and other state lists, there were 28 registered sex offenders living in 78751 zip code as of April 27, 2024. The ratio of all residents to sex offenders in zip code 78751 is 531 to 1. The ratio of registered sex offenders to all residents in this zip code is near the state average.
Median resident age:
This zip code:
30.5 years
Texas median age:
35.6 years
Average household size:
This zip code:
1.8 people
Texas:
2.6 people
Averages for the 2020 tax year for zip code 78751, filed in 2021:
Average Adjusted Gross Income (AGI) in 2020: $86,805 (Individual Income Tax Returns)
Here:
$86,805
State:
$77,054
Salary/wage: $71,513 (reported on 88.1% of returns)
Here:
$71,513
State:
$62,766
(% of AGI for various income ranges: 1293.9% for AGIs below $25k, 4017.6% for AGIs $25k-50k, 6999.5% for AGIs $50k-75k, 11018.8% for AGIs $75k-100k, 20350.8% for AGIs $100k-200k, 81189.6% for AGIs over 200k)
Taxable interest for individuals: $1,467 (reported on 31.4% of returns)
This zip code:
$1,467
Texas:
$2,665
(% of AGI for various income ranges: 9.3% for AGIs below $25k, 11.5% for AGIs $25k-50k, 29.2% for AGIs $50k-75k, 95.0% for AGIs $75k-100k, 148.3% for AGIs $100k-200k, 792.0% for AGIs over 200k)
Ordinary dividends: $7,506 (reported on 28.4% of returns)
Here:
$7,506
State:
$10,044
(% of AGI for various income ranges: 34.7% for AGIs below $25k, 35.0% for AGIs $25k-50k, 134.9% for AGIs $50k-75k, 196.0% for AGIs $75k-100k, 519.8% for AGIs $100k-200k, 4762.4% for AGIs over 200k)
Net capital gain/loss in AGI: +$20,899 (reported on 27.3% of returns)
Here:
+$20,899
State:
+$39,590
(% of AGI for various income ranges: 18.2% for AGIs below $25k, 51.2% for AGIs $25k-50k, 124.8% for AGIs $50k-75k, 284.4% for AGIs $75k-100k, 892.1% for AGIs $100k-200k, 16243.6% for AGIs over 200k)
Profit/loss from business: +$17,660 (reported on 19.5% of returns)
Here:
+$17,660
State:
+$10,888
(% of AGI for various income ranges: 158.0% for AGIs below $25k, 192.9% for AGIs $25k-50k, 281.1% for AGIs $50k-75k, 416.7% for AGIs $75k-100k, 1423.3% for AGIs $100k-200k, 4066.8% for AGIs over 200k)
Taxable individual retirement arrangement distribution: $20,750 (reported on 4.8% of returns)
78751:
$20,750
Texas:
$24,740
(% of AGI for various income ranges: 15.4% for AGIs below $25k, 31.8% for AGIs $25k-50k, 77.4% for AGIs $50k-75k, 154.2% for AGIs $75k-100k, 438.6% for AGIs $100k-200k, 1420.0% for AGIs over 200k)
Self-employed (Keogh) retirement plans: $25,500 (reported on 1.1% of returns)
78751:
$25,500
Texas:
$29,298
(% of AGI for various income ranges: 115.7% for AGIs $100k-200k, 728.4% for AGIs over 200k)
Total itemized deductions: $33,969 (reported on 9.9% of returns)
Here:
$33,969
State:
$40,428
(% of AGI for various income ranges: 38.7% for AGIs below $25k, 66.6% for AGIs $25k-50k, 223.6% for AGIs $50k-75k, 430.6% for AGIs $75k-100k, 1129.7% for AGIs $100k-200k, 6458.0% for AGIs over 200k)
Charity contributions: $11,628 (reported on 7.6% of returns)
Here:
$11,628
State:
$18,201
(% of AGI for various income ranges: 7.2% for AGIs $25k-50k, 26.5% for AGIs $50k-75k, 88.3% for AGIs $75k-100k, 170.8% for AGIs $100k-200k, 2352.8% for AGIs over 200k)
Taxes paid: $8,779 (reported on 9.9% of returns)
78751:
$8,779
State:
$7,821
(% of AGI for various income ranges: 8.7% for AGIs below $25k, 16.0% for AGIs $25k-50k, 61.8% for AGIs $50k-75k, 141.5% for AGIs $75k-100k, 379.8% for AGIs $100k-200k, 1391.6% for AGIs over 200k)
Earned income credit: $859 (reported on 6.6% of returns)
Here:
$859
State:
$2,584
(% of AGI for various income ranges: 20.2% for AGIs below $25k, 8.1% for AGIs $25k-50k)
Percentage of individuals using paid preparers for their 2020 taxes: 93.1%
Here:
93%
State:
92%
(% for various income ranges: 91.6% for AGIs below $25k, 93.9% for AGIs $25k-50k, 94.2% for AGIs $50k-75k, 91.9% for AGIs $75k-100k, 93.4% for AGIs $100k-200k, 93.4% for AGIs over 200k)
Averages for the 2012 tax year for zip code 78751, filed in 2013:
Average Adjusted Gross Income (AGI) in 2012: $58,395 (Individual Income Tax Returns)
Here:
$58,395
State:
$65,384
Salary/wage: $47,718 (reported on 89.2% of returns)
Here:
$47,718
State:
$52,524
(% of AGI for various income ranges: 86.4% for AGIs below $25k, 89.5% for AGIs $25k-50k, 83.8% for AGIs $50k-75k, 82.2% for AGIs $75k-100k, 79.7% for AGIs $100k-200k, 47.4% for AGIs over 200k)
Taxable interest for individuals: $883 (reported on 30.5% of returns)
This zip code:
$883
Texas:
$2,372
(% of AGI for various income ranges: 0.4% for AGIs below $25k, 0.3% for AGIs $25k-50k, 0.4% for AGIs $50k-75k, 0.6% for AGIs $75k-100k, 0.4% for AGIs $100k-200k, 0.6% for AGIs over 200k)
Ordinary dividends: $5,615 (reported on 22.2% of returns)
Here:
$5,615
State:
$9,721
(% of AGI for various income ranges: 2.9% for AGIs below $25k, 1.1% for AGIs $25k-50k, 1.4% for AGIs $50k-75k, 2.0% for AGIs $75k-100k, 1.8% for AGIs $100k-200k, 3.1% for AGIs over 200k)
Net capital gain/loss in AGI: +$25,969 (reported on 17.8% of returns)
Here:
+$25,969
State:
+$35,319
(% of AGI for various income ranges: 0.2% for AGIs below $25k, 0.3% for AGIs $25k-50k, 0.8% for AGIs $50k-75k, 1.1% for AGIs $75k-100k, 2.4% for AGIs $100k-200k, 23.3% for AGIs over 200k)
Profit/loss from business: +$18,339 (reported on 18.3% of returns)
Here:
+$18,339
State:
+$13,732
(% of AGI for various income ranges: 7.8% for AGIs below $25k, 4.6% for AGIs $25k-50k, 5.9% for AGIs $50k-75k, 4.8% for AGIs $75k-100k, 7.7% for AGIs $100k-200k, 4.6% for AGIs over 200k)
Taxable individual retirement arrangement distribution: $17,750 (reported on 4.2% of returns)
78751:
$17,750
Texas:
$19,511
(% of AGI for various income ranges: 1.0% for AGIs below $25k, 0.9% for AGIs $25k-50k, 1.2% for AGIs $50k-75k, 1.9% for AGIs $75k-100k, 1.5% for AGIs $100k-200k, 1.3% for AGIs over 200k)
Self-employment retirement plans: $18,229 (reported on 1.0% of returns)
78751:
$18,229
Texas:
$23,938
(% of AGI for various income ranges: 0.3% for AGIs $25k-50k, 0.5% for AGIs $100k-200k, 0.5% for AGIs over 200k)
Total itemized deductions: $23,182 (16% of AGI, reported on 21.4% of returns)
Here:
$23,182
State:
$24,724
Here:
15.7% of AGI
State:
15.9% of AGI
(% of AGI for various income ranges: 5.0% for AGIs below $25k, 4.5% for AGIs $25k-50k, 9.1% for AGIs $50k-75k, 10.7% for AGIs $75k-100k, 11.4% for AGIs $100k-200k, 8.8% for AGIs over 200k)
Charity contributions: $3,595 (reported on 16.0% of returns)
Here:
$3,595
State:
$6,808
(% of AGI for various income ranges: 0.3% for AGIs below $25k, 0.3% for AGIs $25k-50k, 0.8% for AGIs $50k-75k, 1.0% for AGIs $75k-100k, 1.3% for AGIs $100k-200k, 1.4% for AGIs over 200k)
Taxes paid: $8,470 (reported on 20.9% of returns)
78751:
$8,470
State:
$6,921
(% of AGI for various income ranges: 1.7% for AGIs below $25k, 1.5% for AGIs $25k-50k, 3.1% for AGIs $50k-75k, 4.0% for AGIs $75k-100k, 4.6% for AGIs $100k-200k, 2.9% for AGIs over 200k)
Earned income credit: $888 (reported on 10.5% of returns)
Here:
$888
State:
$2,570
(% of AGI for various income ranges: 1.5% for AGIs below $25k, 0.1% for AGIs $25k-50k)
Percentage of individuals using paid preparers for their 2012 taxes: 27.0%
Here:
27%
State:
51%
(% for various income ranges: 22.0% for AGIs below $25k, 20.4% for AGIs $25k-50k, 30.4% for AGIs $50k-75k, 37.8% for AGIs $75k-100k, 41.2% for AGIs $100k-200k, 67.9% for AGIs over 200k)
Averages for the 2004 tax year for zip code 78751, filed in 2005:
Average Adjusted Gross Income (AGI) in 2004: $39,074 (Individual Income Tax Returns)
Here:
$39,074
State:
$47,881
Salary/wage: $34,200 (reported on 88.8% of returns)
Here:
$34,200
State:
$41,947
(% of AGI for various income ranges: 115.1% for AGIs below $10k, 88.5% for AGIs $10k-25k, 89.8% for AGIs $25k-50k, 82.0% for AGIs $50k-75k, 84.1% for AGIs $75k-100k, 59.1% for AGIs over 100k)
Taxable interest for individuals: $1,363 (reported on 37.3% of returns)
This zip code:
$1,363
Texas:
$2,255
(% of AGI for various income ranges: 2.1% for AGIs below $10k, 1.0% for AGIs $10k-25k, 0.7% for AGIs $25k-50k, 1.1% for AGIs $50k-75k, 1.1% for AGIs $75k-100k, 1.9% for AGIs over 100k)
Taxable dividends: $2,707 (reported on 21.2% of returns)
Here:
$2,707
State:
$4,261
(% of AGI for various income ranges: 2.6% for AGIs below $10k, 0.8% for AGIs $10k-25k, 1.0% for AGIs $25k-50k, 1.4% for AGIs $50k-75k, 0.6% for AGIs $75k-100k, 2.3% for AGIs over 100k)
Net capital gain/loss: +$10,669 (reported on 18.6% of returns)
Here:
+$10,669
State:
+$16,110
(% of AGI for various income ranges: -0.5% for AGIs below $10k, 0.4% for AGIs $10k-25k, 0.8% for AGIs $25k-50k, 1.3% for AGIs $50k-75k, 1.6% for AGIs $75k-100k, 12.8% for AGIs over 100k)
Profit/loss from business: +$12,913 (reported on 15.9% of returns)
Here:
+$12,913
State:
+$11,013
(% of AGI for various income ranges: 4.9% for AGIs below $10k, 5.5% for AGIs $10k-25k, 3.6% for AGIs $25k-50k, 4.2% for AGIs $50k-75k, 5.9% for AGIs $75k-100k, 6.5% for AGIs over 100k)
IRA payment deduction: $2,613 (reported on 2.4% of returns)
78751:
$2,613
Texas:
$3,120
(% of AGI for various income ranges: 0.2% for AGIs $10k-25k, 0.2% for AGIs $25k-50k, 0.2% for AGIs $50k-75k, 0.1% for AGIs $75k-100k, 0.1% for AGIs over 100k)
Self-employed pension: $14,190 (reported on 1.1% of returns)
Here:
$14,190
Texas:
$16,401
Total itemized deductions: $17,230 (20% of AGI, reported on 23.0% of returns)
Here:
$17,230
State:
$19,631
Here:
20.4% of AGI
State:
18.9% of AGI
(% of AGI for various income ranges: 9.2% for AGIs below $10k, 4.4% for AGIs $10k-25k, 7.7% for AGIs $25k-50k, 12.5% for AGIs $50k-75k, 13.0% for AGIs $75k-100k, 12.2% for AGIs over 100k)
Charity contributions deductions: $2,439 (3% of AGI, reported on 16.7% of returns)
Here:
$2,439
State:
$4,753
Here:
2.7% of AGI
State:
4.2% of AGI
(% of AGI for various income ranges: 0.3% for AGIs below $10k, 0.3% for AGIs $10k-25k, 0.6% for AGIs $25k-50k, 1.1% for AGIs $50k-75k, 1.2% for AGIs $75k-100k, 1.6% for AGIs over 100k)
Total tax: $6,211 (reported on 79.4% of returns)
78751:
$6,211
State:
$9,058
(% of AGI for various income ranges: 3.1% for AGIs below $10k, 5.7% for AGIs $10k-25k, 9.2% for AGIs $25k-50k, 11.8% for AGIs $50k-75k, 13.6% for AGIs $75k-100k, 18.3% for AGIs over 100k)
Earned income credit: $990 (reported on 10.4% of returns)
Here:
$990
State:
$2,024
Percentage of individuals using paid preparers for their 2004 taxes: 30.0%
Here:
30%
State:
57%
(% for various income ranges: 27.3% for AGIs below $10k, 27.9% for AGIs $10k-25k, 25.9% for AGIs $25k-50k, 35.5% for AGIs $50k-75k, 39.2% for AGIs $75k-100k, 49.1% for AGIs over 100k)
Likely homosexual households (counted as self-reported same-sex unmarried-partner households)
Lesbian couples: 0.3% of all households
Gay men: 0.5% of all households
Household received Food Stamps/SNAP in the past 12 months: 380 Household did not receive Food Stamps/SNAP in the past 12 months: 9,076
Women who had a birth in the past 12 months: 164 (167 now married, 0 unmarried) Women who did not have a birth in the past 12 months: 6,414 (1,274 now married, 5,188 unmarried)
Housing units in zip code 78751 with a mortgage: 1,369 (135 second mortgage, 59 both second mortgage and home equity loan) Houses without a mortgage: 25
Median monthly owner costs for units with a mortgage: $3,307 Median monthly owner costs for units without a mortgage: $1,236
Residents with income below the poverty level in 2022:
This zip code:
14.3%
Whole state:
14.0%
Residents with income below 50% of the poverty level in 2022:
This zip code:
6.9%
Whole state:
7.4%
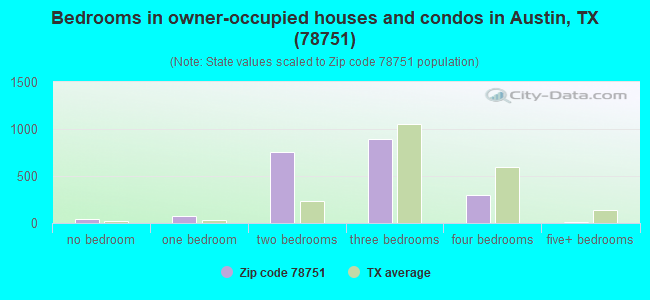
Median number of rooms in houses and condos:
Here:
5.6
State:
6.3
Median number of rooms in apartments:
Here:
3.0
State:
4.0
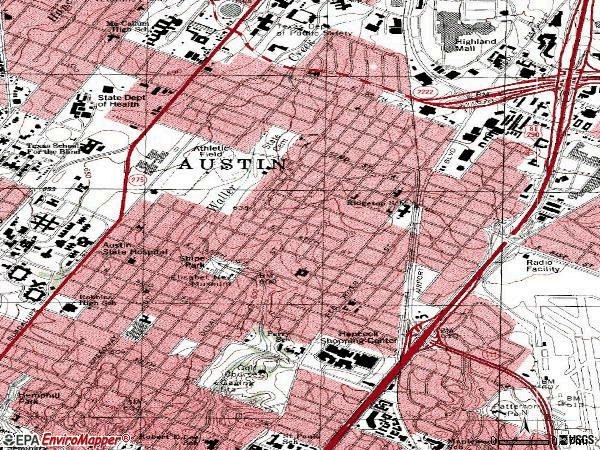
Notable locations in this zip code not listed on our city pages
Notable locations in zip code 78751: Shadow Lawn Historic District (A), Hyde Park Historic District (B), F T and Belle Ramsey House (C), Frank M and Annie G Covert House (D), Hildreth-Flanagan-Heierman House (E), James F and Susie R Parker House (F), Austin Fire Department Station 9 (G), Missouri Kansas and Texas Land Company House (H), Travis County Fire Marshall (I), Elisabet Ney Museum (J), Texas Department of Human Services First Response (K), Colonel Monroe M Shipe House (L), Charles P Ledbetter House (M), Alice H Robbins House (N), Rev Henry M and Jennie Sears House (O), Robert H and Edith Ethel McCauley House (P), Peter and Clotilde Shipe Mansbendel House (Q), Page-Gilbert House (R), Oliphant-Walker House (S), Elisabet Ney Museum (T). Display/hide their locations on the map
Churches in zip code 78751 include: Hyde Park Presbyterian Church (A), Hyde Park Baptist Church (B), Hillside Baptist Church (C), Our Lady Catholic Church (D), Primitive Baptist Church (E), Community Church of God (F), Trinity United Methodist Church (G), Hyde Park United Methodist Church (H), Trinity Chapel Church (I). Display/hide their locations on the map
654 married couples with children.
337 single-parent households (179 men, 158 women).
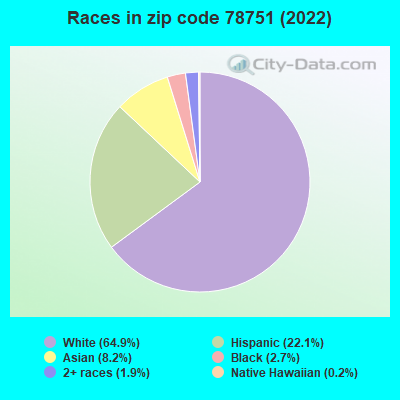
79.7% of residents of 78751 zip code speak English at home.
9.5% of residents speak Spanish at home (73% very well, 20% well, 4% not well, 3% not at all).
5.4% of residents speak other Indo-European language at home (88% very well, 12% well).
4.6% of residents speak Asian or Pacific Island language at home (59% very well, 37% well, 4% not well).
0.7% of residents speak other language at home (83% very well, 17% well).
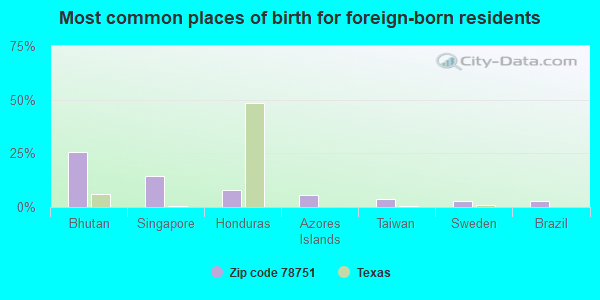
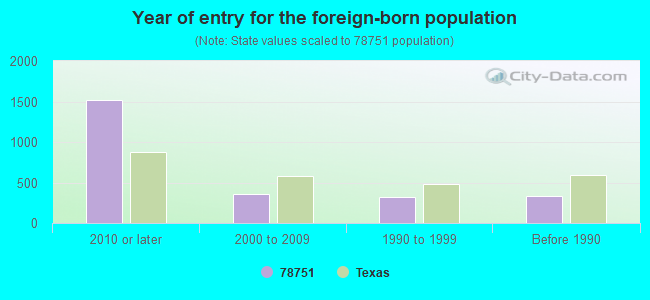
Foreign born population: 2,048 (12.2%) (28.3% of them are naturalized citizens)
Facilities with environmental interests located in this zip code:
AD IMAGE (1027 E 45TH ST in AUSTIN, TX)
(Resource Conservation and Recovery Act (tracking hazardous waste)) Alternative names: GREEN EDWARD H
AUSTIN ISD (3908 AVENUE B in AUSTIN, TX)
(Resource Conservation and Recovery Act (tracking hazardous waste)) Alternative names: W R ROBBINS SECONDART SCHOOL
AUSTIN STATE HOSPITAL (4110 GUADALUPE ST in AUSTIN, TX)
(Resource Conservation and Recovery Act (tracking hazardous waste))
Housing units lacking complete plumbing facilities: 0.9% Housing units lacking complete kitchen facilities: 1.2%
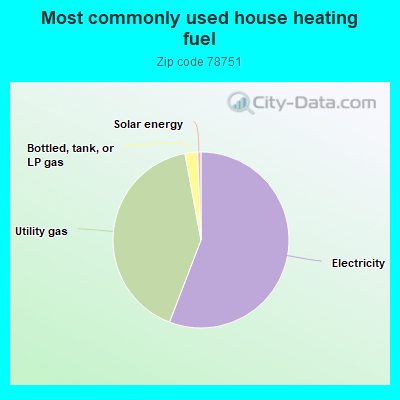
55.6%Electricity
41.1%Utility gas
2.3%Bottled, tank, or LP gas
0.6%Solar energy
Population in 1990: 12,715. Population change in the 1990s: +1,290 (+10.1%).
Place of birth for U.S.-born residents:
This state: 7,359
Northeast: 1,295
Midwest: 1,449
South: 1,972
West: 2,461
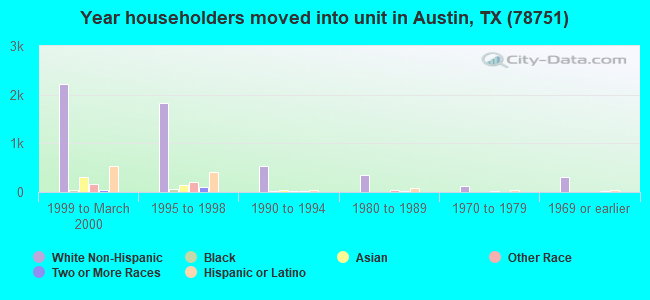
28% of the 78751 zip code residents lived in the same house 5 years ago. Out of people who lived in different houses, 45% lived in this county. Out of people who lived in different counties, 50% lived in Texas.
69% of the 78751 zip code residents lived in the same house 1 year ago. Out of people who lived in different houses, 49% moved from this county. Out of people who lived in different houses, 27% moved from different county within same state. Out of people who lived in different houses, 19% moved from different state. Out of people who lived in different houses, 3% moved from abroad.
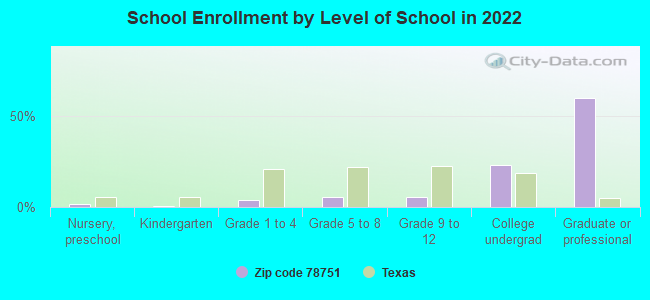
Private vs. public school enrollment:
Students in private schools in grades 1 to 8 (elementary and middle school): 91
Here:
21.4%
Texas:
8.8%
Students in private schools in grades 9 to 12 (high school): 53
Here:
20.8%
Texas:
8.0%
Students in private undergraduate colleges: 97
Here:
9.6%
Texas:
16.2%
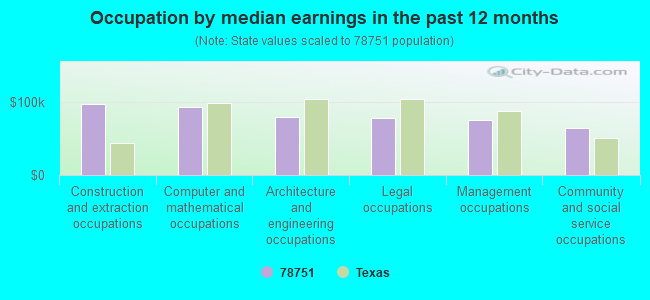
Occupation by median earnings in the past 12 months ($)
97,294Construction and extraction occupations
92,312Computer and mathematical occupations
78,687Architecture and engineering occupations
77,923Legal occupations
74,805Management occupations
64,563Community and social service occupations
Companies with federal contracts located in this zip code (AUSTIN, TX):
LONE STAR AWARDS, INC (5201 N LAMAR BLVD; small business) : $91,606 in 7 contractsfrom 2004 to 2006
Contracts for Signs, Advertising Displays, and Identification Plates, Agriculture Marketing -- Management and Support (R&D), Outerwear, Men's by Army Signed by year:2000: $0; 2001: $0; 2002: $0; 2003: $0; 2004: $25,000; 2005: $54,606; 2006: $12,000.
Biggest contracts:
$15,000 with Army for Signs, Advertising Displays, and Identification Plates. Signed on 2004-11-10. Completion date: 2005-09-30.
$15,000, same as above.Signed on 2005-02-24. Completion date: 2005-03-31.
$15,000, same as above.Signed on 2005-09-14. Completion date: 2005-09-30.
$15,000 with Army for Agriculture Marketing -- Management and Support (R&D). Signed on 2005-07-29. Completion date: 2005-09-30.
ROSS BALDICK ED & CONSULATING (4211 AVENUE A; small business) : $30,000 in 3 contractsfrom 2003 to 2004
$15,000 with Navy for Other Professional Services. Signed on 2003-02-03. Completion date: 2003-03-31.
$10,000, same as above.Signed on 2003-10-17. Completion date: 2003-12-30.
$5,000 with Navy for Education Services. Signed on 2004-05-27. Completion date: 2004-08-31.
SOUND RECORDERS, INC (4031 GUADALUPE ST; small business)
$25,217 with Army for Reproduction Services. Signed on 2000-09-29. Completion date: 2000-10-31.
LONGHORN CARTRUCK RENTAL INC (4812 N I H 35; small business) : $20,100 in 5 contractsfrom 2005 to 2006
Contracts for Lease or Rental of Equipment -- Ground Effect Vehicles, Motor Vehicles, Trailers, and Cycles by Air Force, Army Signed by year:2000: $0; 2001: $0; 2002: $0; 2003: $0; 2004: $0; 2005: $27,450; 2006: -$7,350.
Biggest contracts:
$14,328 with Air Force for Lease or Rental of Equipment -- Ground Effect Vehicles, Motor Vehicles, Trailers, and Cycles. Signed on 2005-12-27. Completion date: 2006-04-14.
$12,354, same as above.Signed on 2005-03-04. Completion date: 2005-06-27.
$768, same as above.Signed on 2005-06-17. Completion date: 2005-06-27.
$0 with Army for Lease or Rental of Equipment -- Ground Effect Vehicles, Motor Vehicles, Trailers, and Cycles. Signed on 2006-06-09. Completion date: 2006-08-03.
ORTHOPAEDIC SALES & SERVICES L (5300 N LAMAR BLVD STE 107; small business)
$11,808 with Army for Medical and Surgical Instruments, Equipment, and Supplies. Signed on 2002-11-25. Completion date: 2002-11-27.
DRURY INNS INC (919 E KOENIG) : $10,198 in 2 contractsin 2004
$10,558 with Army for Lodging - Hotel/Motel. Signed on 2004-09-22. Completion date: 2004-10-04.
-$360, same as above.Signed on 2004-12-02. Completion date: 2004-10-04.
Top industries in this zip code by the number of employees in 2005:
Health Care and Social Assistance: Psychiatric and Substance Abuse Hospitals (500-999 employees: 1 establishment)
2002 - 2018 National Fire Incident Reporting System (NFIRS) incidents
According to the data from the years 2002 - 2018 the average number of fires per year is 43. The highest number of fire incidents - 69 took place in 2008, and the least - 6 in 2017. The data has a decreasing trend.
When looking into fire subcategories, the most incidents belonged to: Outside Fires (47.6%), and Structure Fires (27.3%).
Fire incident types reported to NFIRS in Zip Code 78751


 Nearest zip codes: 78756, 78722, 78705, 78752, 78712, 78723.
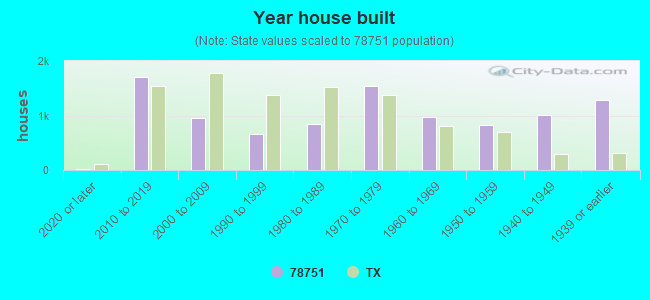


 According to the data from the years 2002 - 2018 the average number of fires per year is 43. The highest number of fire incidents - 69 took place in 2008, and the least - 6 in 2017. The data has a decreasing trend.
 When looking into fire subcategories, the most incidents belonged to: Outside Fires (47.6%), and Structure Fires (27.3%).