Estimated zip code population in 2022: 37,994
Zip code population in 2010: 28,330
Zip code population in 2000: 30,110
Houses and condos: 17,087
Renter-occupied apartments: 8,354
% of renters here:
51%State:
38%
March 2022 cost of living index in zip code 78723: 95.4
(near average, U.S. average is 100)
Land area: 6.9
sq. mi.
Water area: 0.0
sq. mi.
Population density: 5,473 people per square mile (average).
OSM Map
General Map
Google Map
MSN Map
OSM Map
General Map
Google Map
MSN Map
OSM Map
General Map
Google Map
MSN Map
OSM Map
General Map
Google Map
MSN Map
Please wait while loading the map...
Real estate property taxes paid for housing units in 2022:
This zip code:
1.4% ($7,260)Texas:
1.5% ($4,050)
Median real estate property taxes paid for housing units with mortgages in 2022: $7,551 (1.3%)
Median real estate property taxes paid for housing units with no mortgage in 2022: $6,590 (1.4%)
Profiles of local businesses
Business Search - 14 Million verified businesses
Males: 19,388 Females: 18,606
For population 25 years and over in 78723:
High school or higher: 90.0%Bachelor's degree or higher: 53.5%Graduate or professional degree: 22.0%Unemployed: 3.5%Mean travel time to work (commute): 27.0 minutes
For population 15 years and over in 78723:
Never married: 42.1%Now married: 41.8%Separated: 1.3%Widowed: 3.8%Divorced: 11.1%
Zip code 78723 compared to state average:
Median house value above state average. Length of stay since moving in significantly above state average. Percentage of population with a bachelor's degree or higher above state average. 15,876 41.8% White 13,750 36.2% Hispanic or Latino 5,132 13.5% Black 1,758 4.6% Asian 1,376 3.6% Two or more races 96 0.3% Some other race 5 0.01% American Indian
Data:
Median household income ($)
Median household income (% change since 2000)
Household income diversity
Ratio of average income to average house value (%)
Ratio of average income to average rent
Median household income ($) - White
Median household income ($) - Black or African American
Median household income ($) - Asian
Median household income ($) - Hispanic or Latino
Median household income ($) - American Indian and Alaska Native
Median household income ($) - Multirace
Median household income ($) - Other Race
Median household income for houses/condos with a mortgage ($)
Median household income for apartments without a mortgage ($)
Races - White alone (%)
Races - White alone (% change since 2000)
Races - Black alone (%)
Races - Black alone (% change since 2000)
Races - American Indian alone (%)
Races - American Indian alone (% change since 2000)
Races - Asian alone (%)
Races - Asian alone (% change since 2000)
Races - Hispanic (%)
Races - Hispanic (% change since 2000)
Races - Native Hawaiian and Other Pacific Islander alone (%)
Races - Native Hawaiian and Other Pacific Islander alone (% change since 2000)
Races - Two or more races (%)
Races - Two or more races (% change since 2000)
Races - Other race alone (%)
Races - Other race alone (% change since 2000)
Racial diversity
Unemployment (%)
Unemployment (% change since 2000)
Unemployment (%) - White
Unemployment (%) - Black or African American
Unemployment (%) - Asian
Unemployment (%) - Hispanic or Latino
Unemployment (%) - American Indian and Alaska Native
Unemployment (%) - Multirace
Unemployment (%) - Other Race
Population density (people per square mile)
Population - Males (%)
Population - Females (%)
Population - Males (%) - White
Population - Males (%) - Black or African American
Population - Males (%) - Asian
Population - Males (%) - Hispanic or Latino
Population - Males (%) - American Indian and Alaska Native
Population - Males (%) - Multirace
Population - Males (%) - Other Race
Population - Females (%) - White
Population - Females (%) - Black or African American
Population - Females (%) - Asian
Population - Females (%) - Hispanic or Latino
Population - Females (%) - American Indian and Alaska Native
Population - Females (%) - Multirace
Population - Females (%) - Other Race
Coronavirus confirmed cases (Apr 27, 2024)
Deaths caused by coronavirus (Apr 27, 2024)
Coronavirus confirmed cases (per 100k population) (Apr 27, 2024)
Deaths caused by coronavirus (per 100k population) (Apr 27, 2024)
Daily increase in number of cases (Apr 27, 2024)
Weekly increase in number of cases (Apr 27, 2024)
Cases doubled (in days) (Apr 27, 2024)
Hospitalized patients (Apr 18, 2022)
Negative test results (Apr 18, 2022)
Total test results (Apr 18, 2022)
COVID Vaccine doses distributed (per 100k population) (Sep 19, 2023)
COVID Vaccine doses administered (per 100k population) (Sep 19, 2023)
COVID Vaccine doses distributed (Sep 19, 2023)
COVID Vaccine doses administered (Sep 19, 2023)
Likely homosexual households (%)
Likely homosexual households (% change since 2000)
Likely homosexual households - Lesbian couples (%)
Likely homosexual households - Lesbian couples (% change since 2000)
Likely homosexual households - Gay men (%)
Likely homosexual households - Gay men (% change since 2000)
Cost of living index
Median gross rent ($)
Median contract rent ($)
Median monthly housing costs ($)
Median house or condo value ($)
Median house or condo value ($ change since 2000)
Mean house or condo value by units in structure - 1, detached ($)
Mean house or condo value by units in structure - 1, attached ($)
Mean house or condo value by units in structure - 2 ($)
Mean house or condo value by units in structure by units in structure - 3 or 4 ($)
Mean house or condo value by units in structure - 5 or more ($)
Mean house or condo value by units in structure - Boat, RV, van, etc. ($)
Mean house or condo value by units in structure - Mobile home ($)
Median house or condo value ($) - White
Median house or condo value ($) - Black or African American
Median house or condo value ($) - Asian
Median house or condo value ($) - Hispanic or Latino
Median house or condo value ($) - American Indian and Alaska Native
Median house or condo value ($) - Multirace
Median house or condo value ($) - Other Race
Median resident age
Resident age diversity
Median resident age - Males
Median resident age - Females
Median resident age - White
Median resident age - Black or African American
Median resident age - Asian
Median resident age - Hispanic or Latino
Median resident age - American Indian and Alaska Native
Median resident age - Multirace
Median resident age - Other Race
Median resident age - Males - White
Median resident age - Males - Black or African American
Median resident age - Males - Asian
Median resident age - Males - Hispanic or Latino
Median resident age - Males - American Indian and Alaska Native
Median resident age - Males - Multirace
Median resident age - Males - Other Race
Median resident age - Females - White
Median resident age - Females - Black or African American
Median resident age - Females - Asian
Median resident age - Females - Hispanic or Latino
Median resident age - Females - American Indian and Alaska Native
Median resident age - Females - Multirace
Median resident age - Females - Other Race
Commute - mean travel time to work (minutes)
Travel time to work - Less than 5 minutes (%)
Travel time to work - Less than 5 minutes (% change since 2000)
Travel time to work - 5 to 9 minutes (%)
Travel time to work - 5 to 9 minutes (% change since 2000)
Travel time to work - 10 to 19 minutes (%)
Travel time to work - 10 to 19 minutes (% change since 2000)
Travel time to work - 20 to 29 minutes (%)
Travel time to work - 20 to 29 minutes (% change since 2000)
Travel time to work - 30 to 39 minutes (%)
Travel time to work - 30 to 39 minutes (% change since 2000)
Travel time to work - 40 to 59 minutes (%)
Travel time to work - 40 to 59 minutes (% change since 2000)
Travel time to work - 60 to 89 minutes (%)
Travel time to work - 60 to 89 minutes (% change since 2000)
Travel time to work - 90 or more minutes (%)
Travel time to work - 90 or more minutes (% change since 2000)
Marital status - Never married (%)
Marital status - Now married (%)
Marital status - Separated (%)
Marital status - Widowed (%)
Marital status - Divorced (%)
Median family income ($)
Median family income (% change since 2000)
Median non-family income ($)
Median non-family income (% change since 2000)
Median per capita income ($)
Median per capita income (% change since 2000)
Median family income ($) - White
Median family income ($) - Black or African American
Median family income ($) - Asian
Median family income ($) - Hispanic or Latino
Median family income ($) - American Indian and Alaska Native
Median family income ($) - Multirace
Median family income ($) - Other Race
Median year house/condo built
Median year apartment built
Year house built - Built 2005 or later (%)
Year house built - Built 2000 to 2004 (%)
Year house built - Built 1990 to 1999 (%)
Year house built - Built 1980 to 1989 (%)
Year house built - Built 1970 to 1979 (%)
Year house built - Built 1960 to 1969 (%)
Year house built - Built 1950 to 1959 (%)
Year house built - Built 1940 to 1949 (%)
Year house built - Built 1939 or earlier (%)
Average household size
Household density (households per square mile)
Average household size - White
Average household size - Black or African American
Average household size - Asian
Average household size - Hispanic or Latino
Average household size - American Indian and Alaska Native
Average household size - Multirace
Average household size - Other Race
Occupied housing units (%)
Vacant housing units (%)
Owner occupied housing units (%)
Renter occupied housing units (%)
Vacancy status - For rent (%)
Vacancy status - For sale only (%)
Vacancy status - Rented or sold, not occupied (%)
Vacancy status - For seasonal, recreational, or occasional use (%)
Vacancy status - For migrant workers (%)
Vacancy status - Other vacant (%)
Residents with income below the poverty level (%)
Residents with income below 50% of the poverty level (%)
Children below poverty level (%)
Poor families by family type - Married-couple family (%)
Poor families by family type - Male, no wife present (%)
Poor families by family type - Female, no husband present (%)
Poverty status for native-born residents (%)
Poverty status for foreign-born residents (%)
Poverty among high school graduates not in families (%)
Poverty among people who did not graduate high school not in families (%)
Residents with income below the poverty level (%) - White
Residents with income below the poverty level (%) - Black or African American
Residents with income below the poverty level (%) - Asian
Residents with income below the poverty level (%) - Hispanic or Latino
Residents with income below the poverty level (%) - American Indian and Alaska Native
Residents with income below the poverty level (%) - Multirace
Residents with income below the poverty level (%) - Other Race
Air pollution - Air Quality Index (AQI)
Air pollution - CO
Air pollution - NO2
Air pollution - SO2
Air pollution - Ozone
Air pollution - PM10
Air pollution - PM25
Air pollution - Pb
Crime - Murders per 100,000 population
Crime - Rapes per 100,000 population
Crime - Robberies per 100,000 population
Crime - Assaults per 100,000 population
Crime - Burglaries per 100,000 population
Crime - Thefts per 100,000 population
Crime - Auto thefts per 100,000 population
Crime - Arson per 100,000 population
Crime - City-data.com crime index
Crime - Violent crime index
Crime - Property crime index
Crime - Murders per 100,000 population (5 year average)
Crime - Rapes per 100,000 population (5 year average)
Crime - Robberies per 100,000 population (5 year average)
Crime - Assaults per 100,000 population (5 year average)
Crime - Burglaries per 100,000 population (5 year average)
Crime - Thefts per 100,000 population (5 year average)
Crime - Auto thefts per 100,000 population (5 year average)
Crime - Arson per 100,000 population (5 year average)
Crime - City-data.com crime index (5 year average)
Crime - Violent crime index (5 year average)
Crime - Property crime index (5 year average)
1996 Presidential Elections Results (%) - Democratic Party (Clinton)
1996 Presidential Elections Results (%) - Republican Party (Dole)
1996 Presidential Elections Results (%) - Other
2000 Presidential Elections Results (%) - Democratic Party (Gore)
2000 Presidential Elections Results (%) - Republican Party (Bush)
2000 Presidential Elections Results (%) - Other
2004 Presidential Elections Results (%) - Democratic Party (Kerry)
2004 Presidential Elections Results (%) - Republican Party (Bush)
2004 Presidential Elections Results (%) - Other
2008 Presidential Elections Results (%) - Democratic Party (Obama)
2008 Presidential Elections Results (%) - Republican Party (McCain)
2008 Presidential Elections Results (%) - Other
2012 Presidential Elections Results (%) - Democratic Party (Obama)
2012 Presidential Elections Results (%) - Republican Party (Romney)
2012 Presidential Elections Results (%) - Other
2016 Presidential Elections Results (%) - Democratic Party (Clinton)
2016 Presidential Elections Results (%) - Republican Party (Trump)
2016 Presidential Elections Results (%) - Other
2020 Presidential Elections Results (%) - Democratic Party (Biden)
2020 Presidential Elections Results (%) - Republican Party (Trump)
2020 Presidential Elections Results (%) - Other
Ancestries Reported - Arab (%)
Ancestries Reported - Czech (%)
Ancestries Reported - Danish (%)
Ancestries Reported - Dutch (%)
Ancestries Reported - English (%)
Ancestries Reported - French (%)
Ancestries Reported - French Canadian (%)
Ancestries Reported - German (%)
Ancestries Reported - Greek (%)
Ancestries Reported - Hungarian (%)
Ancestries Reported - Irish (%)
Ancestries Reported - Italian (%)
Ancestries Reported - Lithuanian (%)
Ancestries Reported - Norwegian (%)
Ancestries Reported - Polish (%)
Ancestries Reported - Portuguese (%)
Ancestries Reported - Russian (%)
Ancestries Reported - Scotch-Irish (%)
Ancestries Reported - Scottish (%)
Ancestries Reported - Slovak (%)
Ancestries Reported - Subsaharan African (%)
Ancestries Reported - Swedish (%)
Ancestries Reported - Swiss (%)
Ancestries Reported - Ukrainian (%)
Ancestries Reported - United States (%)
Ancestries Reported - Welsh (%)
Ancestries Reported - West Indian (%)
Ancestries Reported - Other (%)
Educational Attainment - No schooling completed (%)
Educational Attainment - Less than high school (%)
Educational Attainment - High school or equivalent (%)
Educational Attainment - Less than 1 year of college (%)
Educational Attainment - 1 or more years of college (%)
Educational Attainment - Associate degree (%)
Educational Attainment - Bachelor's degree (%)
Educational Attainment - Master's degree (%)
Educational Attainment - Professional school degree (%)
Educational Attainment - Doctorate degree (%)
School Enrollment - Nursery, preschool (%)
School Enrollment - Kindergarten (%)
School Enrollment - Grade 1 to 4 (%)
School Enrollment - Grade 5 to 8 (%)
School Enrollment - Grade 9 to 12 (%)
School Enrollment - College undergrad (%)
School Enrollment - Graduate or professional (%)
School Enrollment - Not enrolled in school (%)
School enrollment - Public schools (%)
School enrollment - Private schools (%)
School enrollment - Not enrolled (%)
Median number of rooms in houses and condos
Median number of rooms in apartments
Housing units lacking complete plumbing facilities (%)
Housing units lacking complete kitchen facilities (%)
Density of houses
Urban houses (%)
Rural houses (%)
Households with people 60 years and over (%)
Households with people 65 years and over (%)
Households with people 75 years and over (%)
Households with one or more nonrelatives (%)
Households with no nonrelatives (%)
Population in households (%)
Family households (%)
Nonfamily households (%)
Population in families (%)
Family households with own children (%)
Median number of bedrooms in owner occupied houses
Mean number of bedrooms in owner occupied houses
Median number of bedrooms in renter occupied houses
Mean number of bedrooms in renter occupied houses
Median number of vehichles in owner occupied houses
Mean number of vehichles in owner occupied houses
Median number of vehichles in renter occupied houses
Mean number of vehichles in renter occupied houses
Mortgage status - with mortgage (%)
Mortgage status - with second mortgage (%)
Mortgage status - with home equity loan (%)
Mortgage status - with both second mortgage and home equity loan (%)
Mortgage status - without a mortgage (%)
Average family size
Average family size - White
Average family size - Black or African American
Average family size - Asian
Average family size - Hispanic or Latino
Average family size - American Indian and Alaska Native
Average family size - Multirace
Average family size - Other Race
Geographical mobility - Same house 1 year ago (%)
Geographical mobility - Moved within same county (%)
Geographical mobility - Moved from different county within same state (%)
Geographical mobility - Moved from different state (%)
Geographical mobility - Moved from abroad (%)
Place of birth - Born in state of residence (%)
Place of birth - Born in other state (%)
Place of birth - Native, outside of US (%)
Place of birth - Foreign born (%)
Housing units in structures - 1, detached (%)
Housing units in structures - 1, attached (%)
Housing units in structures - 2 (%)
Housing units in structures - 3 or 4 (%)
Housing units in structures - 5 to 9 (%)
Housing units in structures - 10 to 19 (%)
Housing units in structures - 20 to 49 (%)
Housing units in structures - 50 or more (%)
Housing units in structures - Mobile home (%)
Housing units in structures - Boat, RV, van, etc. (%)
House/condo owner moved in on average (years ago)
Renter moved in on average (years ago)
Year householder moved into unit - Moved in 1999 to March 2000 (%)
Year householder moved into unit - Moved in 1995 to 1998 (%)
Year householder moved into unit - Moved in 1990 to 1994 (%)
Year householder moved into unit - Moved in 1980 to 1989 (%)
Year householder moved into unit - Moved in 1970 to 1979 (%)
Year householder moved into unit - Moved in 1969 or earlier (%)
Means of transportation to work - Drove car alone (%)
Means of transportation to work - Carpooled (%)
Means of transportation to work - Public transportation (%)
Means of transportation to work - Bus or trolley bus (%)
Means of transportation to work - Streetcar or trolley car (%)
Means of transportation to work - Subway or elevated (%)
Means of transportation to work - Railroad (%)
Means of transportation to work - Ferryboat (%)
Means of transportation to work - Taxicab (%)
Means of transportation to work - Motorcycle (%)
Means of transportation to work - Bicycle (%)
Means of transportation to work - Walked (%)
Means of transportation to work - Other means (%)
Working at home (%)
Industry diversity
Most Common Industries - Agriculture, forestry, fishing and hunting, and mining (%)
Most Common Industries - Agriculture, forestry, fishing and hunting (%)
Most Common Industries - Mining, quarrying, and oil and gas extraction (%)
Most Common Industries - Construction (%)
Most Common Industries - Manufacturing (%)
Most Common Industries - Wholesale trade (%)
Most Common Industries - Retail trade (%)
Most Common Industries - Transportation and warehousing, and utilities (%)
Most Common Industries - Transportation and warehousing (%)
Most Common Industries - Utilities (%)
Most Common Industries - Information (%)
Most Common Industries - Finance and insurance, and real estate and rental and leasing (%)
Most Common Industries - Finance and insurance (%)
Most Common Industries - Real estate and rental and leasing (%)
Most Common Industries - Professional, scientific, and management, and administrative and waste management services (%)
Most Common Industries - Professional, scientific, and technical services (%)
Most Common Industries - Management of companies and enterprises (%)
Most Common Industries - Administrative and support and waste management services (%)
Most Common Industries - Educational services, and health care and social assistance (%)
Most Common Industries - Educational services (%)
Most Common Industries - Health care and social assistance (%)
Most Common Industries - Arts, entertainment, and recreation, and accommodation and food services (%)
Most Common Industries - Arts, entertainment, and recreation (%)
Most Common Industries - Accommodation and food services (%)
Most Common Industries - Other services, except public administration (%)
Most Common Industries - Public administration (%)
Occupation diversity
Most Common Occupations - Management, business, science, and arts occupations (%)
Most Common Occupations - Management, business, and financial occupations (%)
Most Common Occupations - Management occupations (%)
Most Common Occupations - Business and financial operations occupations (%)
Most Common Occupations - Computer, engineering, and science occupations (%)
Most Common Occupations - Computer and mathematical occupations (%)
Most Common Occupations - Architecture and engineering occupations (%)
Most Common Occupations - Life, physical, and social science occupations (%)
Most Common Occupations - Education, legal, community service, arts, and media occupations (%)
Most Common Occupations - Community and social service occupations (%)
Most Common Occupations - Legal occupations (%)
Most Common Occupations - Education, training, and library occupations (%)
Most Common Occupations - Arts, design, entertainment, sports, and media occupations (%)
Most Common Occupations - Healthcare practitioners and technical occupations (%)
Most Common Occupations - Health diagnosing and treating practitioners and other technical occupations (%)
Most Common Occupations - Health technologists and technicians (%)
Most Common Occupations - Service occupations (%)
Most Common Occupations - Healthcare support occupations (%)
Most Common Occupations - Protective service occupations (%)
Most Common Occupations - Fire fighting and prevention, and other protective service workers including supervisors (%)
Most Common Occupations - Law enforcement workers including supervisors (%)
Most Common Occupations - Food preparation and serving related occupations (%)
Most Common Occupations - Building and grounds cleaning and maintenance occupations (%)
Most Common Occupations - Personal care and service occupations (%)
Most Common Occupations - Sales and office occupations (%)
Most Common Occupations - Sales and related occupations (%)
Most Common Occupations - Office and administrative support occupations (%)
Most Common Occupations - Natural resources, construction, and maintenance occupations (%)
Most Common Occupations - Farming, fishing, and forestry occupations (%)
Most Common Occupations - Construction and extraction occupations (%)
Most Common Occupations - Installation, maintenance, and repair occupations (%)
Most Common Occupations - Production, transportation, and material moving occupations (%)
Most Common Occupations - Production occupations (%)
Most Common Occupations - Transportation occupations (%)
Most Common Occupations - Material moving occupations (%)
People in Group quarters - Institutionalized population (%)
People in Group quarters - Correctional institutions (%)
People in Group quarters - Federal prisons and detention centers (%)
People in Group quarters - Halfway houses (%)
People in Group quarters - Local jails and other confinement facilities (including police lockups) (%)
People in Group quarters - Military disciplinary barracks (%)
People in Group quarters - State prisons (%)
People in Group quarters - Other types of correctional institutions (%)
People in Group quarters - Nursing homes (%)
People in Group quarters - Hospitals/wards, hospices, and schools for the handicapped (%)
People in Group quarters - Hospitals/wards and hospices for chronically ill (%)
People in Group quarters - Hospices or homes for chronically ill (%)
People in Group quarters - Military hospitals or wards for chronically ill (%)
People in Group quarters - Other hospitals or wards for chronically ill (%)
People in Group quarters - Hospitals or wards for drug/alcohol abuse (%)
People in Group quarters - Mental (Psychiatric) hospitals or wards (%)
People in Group quarters - Schools, hospitals, or wards for the mentally retarded (%)
People in Group quarters - Schools, hospitals, or wards for the physically handicapped (%)
People in Group quarters - Institutions for the deaf (%)
People in Group quarters - Institutions for the blind (%)
People in Group quarters - Orthopedic wards and institutions for the physically handicapped (%)
People in Group quarters - Wards in general hospitals for patients who have no usual home elsewhere (%)
People in Group quarters - Wards in military hospitals for patients who have no usual home elsewhere (%)
People in Group quarters - Juvenile institutions (%)
People in Group quarters - Long-term care (%)
People in Group quarters - Homes for abused, dependent, and neglected children (%)
People in Group quarters - Residential treatment centers for emotionally disturbed children (%)
People in Group quarters - Training schools for juvenile delinquents (%)
People in Group quarters - Short-term care, detention or diagnostic centers for delinquent children (%)
People in Group quarters - Type of juvenile institution unknown (%)
People in Group quarters - Noninstitutionalized population (%)
People in Group quarters - College dormitories (includes college quarters off campus) (%)
People in Group quarters - Military quarters (%)
People in Group quarters - On base (%)
People in Group quarters - Barracks, unaccompanied personnel housing (UPH), (Enlisted/Officer), ;and similar group living quarters for military personnel (%)
People in Group quarters - Transient quarters for temporary residents (%)
People in Group quarters - Military ships (%)
People in Group quarters - Group homes (%)
People in Group quarters - Homes or halfway houses for drug/alcohol abuse (%)
People in Group quarters - Homes for the mentally ill (%)
People in Group quarters - Homes for the mentally retarded (%)
People in Group quarters - Homes for the physically handicapped (%)
People in Group quarters - Other group homes (%)
People in Group quarters - Religious group quarters (%)
People in Group quarters - Dormitories (%)
People in Group quarters - Agriculture workers' dormitories on farms (%)
People in Group quarters - Job Corps and vocational training facilities (%)
People in Group quarters - Other workers' dormitories (%)
People in Group quarters - Crews of maritime vessels (%)
People in Group quarters - Other nonhousehold living situations (%)
People in Group quarters - Other noninstitutional group quarters (%)
Residents speaking English at home (%)
Residents speaking English at home - Born in the United States (%)
Residents speaking English at home - Native, born elsewhere (%)
Residents speaking English at home - Foreign born (%)
Residents speaking Spanish at home (%)
Residents speaking Spanish at home - Born in the United States (%)
Residents speaking Spanish at home - Native, born elsewhere (%)
Residents speaking Spanish at home - Foreign born (%)
Residents speaking other language at home (%)
Residents speaking other language at home - Born in the United States (%)
Residents speaking other language at home - Native, born elsewhere (%)
Residents speaking other language at home - Foreign born (%)
Class of Workers - Employee of private company (%)
Class of Workers - Self-employed in own incorporated business (%)
Class of Workers - Private not-for-profit wage and salary workers (%)
Class of Workers - Local government workers (%)
Class of Workers - State government workers (%)
Class of Workers - Federal government workers (%)
Class of Workers - Self-employed workers in own not incorporated business and Unpaid family workers (%)
House heating fuel used in houses and condos - Utility gas (%)
House heating fuel used in houses and condos - Bottled, tank, or LP gas (%)
House heating fuel used in houses and condos - Electricity (%)
House heating fuel used in houses and condos - Fuel oil, kerosene, etc. (%)
House heating fuel used in houses and condos - Coal or coke (%)
House heating fuel used in houses and condos - Wood (%)
House heating fuel used in houses and condos - Solar energy (%)
House heating fuel used in houses and condos - Other fuel (%)
House heating fuel used in houses and condos - No fuel used (%)
House heating fuel used in apartments - Utility gas (%)
House heating fuel used in apartments - Bottled, tank, or LP gas (%)
House heating fuel used in apartments - Electricity (%)
House heating fuel used in apartments - Fuel oil, kerosene, etc. (%)
House heating fuel used in apartments - Coal or coke (%)
House heating fuel used in apartments - Wood (%)
House heating fuel used in apartments - Solar energy (%)
House heating fuel used in apartments - Other fuel (%)
House heating fuel used in apartments - No fuel used (%)
Armed forces status - In Armed Forces (%)
Armed forces status - Civilian (%)
Armed forces status - Civilian - Veteran (%)
Armed forces status - Civilian - Nonveteran (%)
Fatal accidents locations in years 2005-2021
Fatal accidents locations in 2005
Fatal accidents locations in 2006
Fatal accidents locations in 2007
Fatal accidents locations in 2008
Fatal accidents locations in 2009
Fatal accidents locations in 2010
Fatal accidents locations in 2011
Fatal accidents locations in 2012
Fatal accidents locations in 2013
Fatal accidents locations in 2014
Fatal accidents locations in 2015
Fatal accidents locations in 2016
Fatal accidents locations in 2017
Fatal accidents locations in 2018
Fatal accidents locations in 2019
Fatal accidents locations in 2020
Fatal accidents locations in 2021
Alcohol use - People drinking some alcohol every month (%)
Alcohol use - People not drinking at all (%)
Alcohol use - Average days/month drinking alcohol
Alcohol use - Average drinks/week
Alcohol use - Average days/year people drink much
Audiometry - Average condition of hearing (%)
Audiometry - People that can hear a whisper from across a quiet room (%)
Audiometry - People that can hear normal voice from across a quiet room (%)
Audiometry - Ears ringing, roaring, buzzing (%)
Audiometry - Had a job exposure to loud noise (%)
Audiometry - Had off-work exposure to loud noise (%)
Blood Pressure & Cholesterol - Has high blood pressure (%)
Blood Pressure & Cholesterol - Checking blood pressure at home (%)
Blood Pressure & Cholesterol - Frequently checking blood cholesterol (%)
Blood Pressure & Cholesterol - Has high cholesterol level (%)
Consumer Behavior - Money monthly spent on food at supermarket/grocery store
Consumer Behavior - Money monthly spent on food at other stores
Consumer Behavior - Money monthly spent on eating out
Consumer Behavior - Money monthly spent on carryout/delivered foods
Consumer Behavior - Income spent on food at supermarket/grocery store (%)
Consumer Behavior - Income spent on food at other stores (%)
Consumer Behavior - Income spent on eating out (%)
Consumer Behavior - Income spent on carryout/delivered foods (%)
Current Health Status - General health condition (%)
Current Health Status - Blood donors (%)
Current Health Status - Has blood ever tested for HIV virus (%)
Current Health Status - Left-handed people (%)
Dermatology - People using sunscreen (%)
Diabetes - Diabetics (%)
Diabetes - Had a blood test for high blood sugar (%)
Diabetes - People taking insulin (%)
Diet Behavior & Nutrition - Diet health (%)
Diet Behavior & Nutrition - Milk product consumption (# of products/month)
Diet Behavior & Nutrition - Meals not home prepared (#/week)
Diet Behavior & Nutrition - Meals from fast food or pizza place (#/week)
Diet Behavior & Nutrition - Ready-to-eat foods (#/month)
Diet Behavior & Nutrition - Frozen meals/pizza (#/month)
Drug Use - People that ever used marijuana or hashish (%)
Drug Use - Ever used hard drugs (%)
Drug Use - Ever used any form of cocaine (%)
Drug Use - Ever used heroin (%)
Drug Use - Ever used methamphetamine (%)
Health Insurance - People covered by health insurance (%)
Kidney Conditions-Urology - Avg. # of times urinating at night
Medical Conditions - People with asthma (%)
Medical Conditions - People with anemia (%)
Medical Conditions - People with psoriasis (%)
Medical Conditions - People with overweight (%)
Medical Conditions - Elderly people having difficulties in thinking or remembering (%)
Medical Conditions - People who ever received blood transfusion (%)
Medical Conditions - People having trouble seeing even with glass/contacts (%)
Medical Conditions - People with arthritis (%)
Medical Conditions - People with gout (%)
Medical Conditions - People with congestive heart failure (%)
Medical Conditions - People with coronary heart disease (%)
Medical Conditions - People with angina pectoris (%)
Medical Conditions - People who ever had heart attack (%)
Medical Conditions - People who ever had stroke (%)
Medical Conditions - People with emphysema (%)
Medical Conditions - People with thyroid problem (%)
Medical Conditions - People with chronic bronchitis (%)
Medical Conditions - People with any liver condition (%)
Medical Conditions - People who ever had cancer or malignancy (%)
Mental Health - People who have little interest in doing things (%)
Mental Health - People feeling down, depressed, or hopeless (%)
Mental Health - People who have trouble sleeping or sleeping too much (%)
Mental Health - People feeling tired or having little energy (%)
Mental Health - People with poor appetite or overeating (%)
Mental Health - People feeling bad about themself (%)
Mental Health - People who have trouble concentrating on things (%)
Mental Health - People moving or speaking slowly or too fast (%)
Mental Health - People having thoughts they would be better off dead (%)
Oral Health - Average years since last visit a dentist
Oral Health - People embarrassed because of mouth (%)
Oral Health - People with gum disease (%)
Oral Health - General health of teeth and gums (%)
Oral Health - Average days a week using dental floss/device
Oral Health - Average days a week using mouthwash for dental problem
Oral Health - Average number of teeth
Pesticide Use - Households using pesticides to control insects (%)
Pesticide Use - Households using pesticides to kill weeds (%)
Physical Activity - People doing vigorous-intensity work activities (%)
Physical Activity - People doing moderate-intensity work activities (%)
Physical Activity - People walking or bicycling (%)
Physical Activity - People doing vigorous-intensity recreational activities (%)
Physical Activity - People doing moderate-intensity recreational activities (%)
Physical Activity - Average hours a day doing sedentary activities
Physical Activity - Average hours a day watching TV or videos
Physical Activity - Average hours a day using computer
Physical Functioning - People having limitations keeping them from working (%)
Physical Functioning - People limited in amount of work they can do (%)
Physical Functioning - People that need special equipment to walk (%)
Physical Functioning - People experiencing confusion/memory problems (%)
Physical Functioning - People requiring special healthcare equipment (%)
Prescription Medications - Average number of prescription medicines taking
Preventive Aspirin Use - Adults 40+ taking low-dose aspirin (%)
Reproductive Health - Vaginal deliveries (%)
Reproductive Health - Cesarean deliveries (%)
Reproductive Health - Deliveries resulted in a live birth (%)
Reproductive Health - Pregnancies resulted in a delivery (%)
Reproductive Health - Women breastfeeding newborns (%)
Reproductive Health - Women that had a hysterectomy (%)
Reproductive Health - Women that had both ovaries removed (%)
Reproductive Health - Women that have ever taken birth control pills (%)
Reproductive Health - Women taking birth control pills (%)
Reproductive Health - Women that have ever used Depo-Provera or injectables (%)
Reproductive Health - Women that have ever used female hormones (%)
Sexual Behavior - People 18+ that ever had sex (vaginal, anal, or oral) (%)
Sexual Behavior - Males 18+ that ever had vaginal sex with a woman (%)
Sexual Behavior - Males 18+ that ever performed oral sex on a woman (%)
Sexual Behavior - Males 18+ that ever had anal sex with a woman (%)
Sexual Behavior - Males 18+ that ever had any sex with a man (%)
Sexual Behavior - Females 18+ that ever had vaginal sex with a man (%)
Sexual Behavior - Females 18+ that ever performed oral sex on a man (%)
Sexual Behavior - Females 18+ that ever had anal sex with a man (%)
Sexual Behavior - Females 18+ that ever had any kind of sex with a woman (%)
Sexual Behavior - Average age people first had sex
Sexual Behavior - Average number of female sex partners in lifetime (males 18+)
Sexual Behavior - Average number of female vaginal sex partners in lifetime (males 18+)
Sexual Behavior - Average age people first performed oral sex on a woman (18+)
Sexual Behavior - Average number of woman performed oral sex on in lifetime (18+)
Sexual Behavior - Average number of male sex partners in lifetime (males 18+)
Sexual Behavior - Average number of male anal sex partners in lifetime (males 18+)
Sexual Behavior - Average age people first performed oral sex on a man (18+)
Sexual Behavior - Average number of male oral sex partners in lifetime (18+)
Sexual Behavior - People using protection when performing oral sex (%)
Sexual Behavior - Average number of times people have vaginal or anal sex a year
Sexual Behavior - People having sex without condom (%)
Sexual Behavior - Average number of male sex partners in lifetime (females 18+)
Sexual Behavior - Average number of male vaginal sex partners in lifetime (females 18+)
Sexual Behavior - Average number of female sex partners in lifetime (females 18+)
Sexual Behavior - Circumcised males 18+ (%)
Sleep Disorders - Average hours sleeping at night
Sleep Disorders - People that has trouble sleeping (%)
Smoking-Cigarette Use - People smoking cigarettes (%)
Taste & Smell - People 40+ having problems with smell (%)
Taste & Smell - People 40+ having problems with taste (%)
Taste & Smell - People 40+ that ever had wisdom teeth removed (%)
Taste & Smell - People 40+ that ever had tonsils teeth removed (%)
Taste & Smell - People 40+ that ever had a loss of consciousness because of a head injury (%)
Taste & Smell - People 40+ that ever had a broken nose or other serious injury to face or skull (%)
Taste & Smell - People 40+ that ever had two or more sinus infections (%)
Weight - Average height (inches)
Weight - Average weight (pounds)
Weight - Average BMI
Weight - People that are obese (%)
Weight - People that ever were obese (%)
Weight - People trying to lose weight (%)
100%
urban population.
Estimated median house/condo value in 2022: $527,773
78723:
$527,773Texas:
$275,400
According to our research of Texas and other state lists, there were 79 registered sex offenders living in 78723 zip code as of April 27, 2024 . The ratio of all residents to sex offenders in zip code 78723 is 417 to 1.The ratio of registered sex offenders to all residents in this zip code is near the state average.
Median resident age: This zip code:
35.7 yearsTexas median age:
35.6 years
Average household size: This zip code:
2.3 peopleTexas:
2.6 people
Averages for the 2020 tax year for zip code 78723, filed in 2021:
Average Adjusted Gross Income (AGI) in 2020: $82,628 (Individual Income Tax Returns) Here:
$82,628State:
$77,054
Salary/wage: $74,199 (reported on 84.9% of returns )Here:
$74,199State:
$62,766
(% of AGI for various income ranges: 1115.8% for AGIs below $25k , 3784.5% for AGIs $25k-50k , 6873.7% for AGIs $50k-75k , 10561.0% for AGIs $75k-100k , 19830.7% for AGIs $100k-200k , 83809.1% for AGIs over 200k ) Taxable interest for individuals: $1,201 (reported on 29.2% of returns )This zip code:
$1,201Texas:
$2,665
(% of AGI for various income ranges: 7.3% for AGIs below $25k , 13.5% for AGIs $25k-50k , 32.0% for AGIs $50k-75k , 78.5% for AGIs $75k-100k , 87.8% for AGIs $100k-200k , 573.3% for AGIs over 200k ) Ordinary dividends: $4,372 (reported on 23.2% of returns )(% of AGI for various income ranges: 17.7% for AGIs below $25k , 29.0% for AGIs $25k-50k , 64.4% for AGIs $50k-75k , 127.1% for AGIs $75k-100k , 347.5% for AGIs $100k-200k , 1773.0% for AGIs over 200k ) Net capital gain/loss in AGI: +$19,670 (reported on 22.1% of returns )Here:
+$19,670State:
+$39,590
(% of AGI for various income ranges: 11.8% for AGIs below $25k , 25.6% for AGIs $25k-50k , 78.0% for AGIs $50k-75k , 128.8% for AGIs $75k-100k , 596.8% for AGIs $100k-200k , 13500.7% for AGIs over 200k ) Profit/loss from business: +$16,710 (reported on 20.3% of returns )Here:
+$16,710State:
+$10,888
(% of AGI for various income ranges: 210.9% for AGIs below $25k , 194.5% for AGIs $25k-50k , 315.7% for AGIs $50k-75k , 460.1% for AGIs $75k-100k , 969.0% for AGIs $100k-200k , 4185.1% for AGIs over 200k ) Taxable individual retirement arrangement distribution: $23,035 (reported on 5.1% of returns )78723:
$23,035Texas:
$24,740
(% of AGI for various income ranges: 24.8% for AGIs below $25k , 33.6% for AGIs $25k-50k , 104.0% for AGIs $50k-75k , 224.9% for AGIs $75k-100k , 480.3% for AGIs $100k-200k , 1497.0% for AGIs over 200k ) Self-employed (Keogh) retirement plans: $23,314 (reported on 0.9% of returns )78723:
$23,314Texas:
$29,298
(% of AGI for various income ranges: 7.5% for AGIs $25k-50k , 50.5% for AGIs $100k-200k , 533.0% for AGIs over 200k ) Total itemized deductions: $28,753 (reported on 11.1% of returns )Here:
$28,753State:
$40,428
(% of AGI for various income ranges: 29.9% for AGIs below $25k , 115.9% for AGIs $25k-50k , 257.3% for AGIs $50k-75k , 598.1% for AGIs $75k-100k , 1083.6% for AGIs $100k-200k , 4945.8% for AGIs over 200k ) Charity contributions: $8,986 (reported on 8.2% of returns )(% of AGI for various income ranges: 1.9% for AGIs below $25k , 13.4% for AGIs $25k-50k , 34.2% for AGIs $50k-75k , 77.2% for AGIs $75k-100k , 193.7% for AGIs $100k-200k , 1714.9% for AGIs over 200k ) Taxes paid: $8,182 (reported on 11.0% of returns )(% of AGI for various income ranges: 9.4% for AGIs below $25k , 33.0% for AGIs $25k-50k , 81.8% for AGIs $50k-75k , 196.3% for AGIs $75k-100k , 342.2% for AGIs $100k-200k , 1177.9% for AGIs over 200k ) Earned income credit: $2,198 (reported on 14.2% of returns )(% of AGI for various income ranges: 104.6% for AGIs below $25k , 46.2% for AGIs $25k-50k ) Percentage of individuals using paid preparers for their 2020 taxes: 92.1%(% for various income ranges: 90.3% for AGIs below $25k , 92.2% for AGIs $25k-50k , 91.5% for AGIs $50k-75k , 91.9% for AGIs $75k-100k , 93.8% for AGIs $100k-200k , 95.6% for AGIs over 200k )
Averages for the 2012 tax year for zip code 78723, filed in 2013:
Average Adjusted Gross Income (AGI) in 2012: $42,802 (Individual Income Tax Returns) Here:
$42,802State:
$65,384
Salary/wage: $38,062 (reported on 87.2% of returns )Here:
$38,062State:
$52,524
(% of AGI for various income ranges: 82.1% for AGIs below $25k , 85.3% for AGIs $25k-50k , 79.7% for AGIs $50k-75k , 77.3% for AGIs $75k-100k , 76.9% for AGIs $100k-200k , 56.6% for AGIs over 200k ) Taxable interest for individuals: $850 (reported on 22.1% of returns )This zip code:
$850Texas:
$2,372
(% of AGI for various income ranges: 0.3% for AGIs below $25k , 0.4% for AGIs $25k-50k , 0.6% for AGIs $50k-75k , 0.4% for AGIs $75k-100k , 0.5% for AGIs $100k-200k , 0.4% for AGIs over 200k ) Ordinary dividends: $3,473 (reported on 12.5% of returns )(% of AGI for various income ranges: 1.2% for AGIs below $25k , 0.6% for AGIs $25k-50k , 0.7% for AGIs $50k-75k , 0.8% for AGIs $75k-100k , 1.4% for AGIs $100k-200k , 1.5% for AGIs over 200k ) Net capital gain/loss in AGI: +$12,008 (reported on 9.3% of returns )Here:
+$12,008State:
+$35,319
(% of AGI for various income ranges: 0.2% for AGIs below $25k , 0.3% for AGIs $25k-50k , 0.3% for AGIs $50k-75k , 1.0% for AGIs $75k-100k , 2.2% for AGIs $100k-200k , 14.6% for AGIs over 200k ) Profit/loss from business: +$12,440 (reported on 17.4% of returns )Here:
+$12,440State:
+$13,732
(% of AGI for various income ranges: 9.8% for AGIs below $25k , 3.8% for AGIs $25k-50k , 4.0% for AGIs $50k-75k , 3.8% for AGIs $75k-100k , 4.4% for AGIs $100k-200k , 5.4% for AGIs over 200k ) Taxable individual retirement arrangement distribution: $11,622 (reported on 4.8% of returns )78723:
$11,622Texas:
$19,511
(% of AGI for various income ranges: 0.8% for AGIs below $25k , 0.9% for AGIs $25k-50k , 1.2% for AGIs $50k-75k , 2.1% for AGIs $75k-100k , 1.8% for AGIs $100k-200k , 1.3% for AGIs over 200k ) Self-employment retirement plans: $14,300 (reported on 0.4% of returns )78723:
$14,300Texas:
$23,938
Total itemized deductions: $16,981 (19% of AGI, reported on 21.2% of returns )Here:
$16,981State:
$24,724
Here:
18.7% of AGIState:
15.9% of AGI
(% of AGI for various income ranges: 4.2% for AGIs below $25k , 6.4% for AGIs $25k-50k , 10.7% for AGIs $50k-75k , 10.8% for AGIs $75k-100k , 11.1% for AGIs $100k-200k , 7.2% for AGIs over 200k ) Charity contributions: $3,259 (reported on 15.8% of returns )(% of AGI for various income ranges: 0.3% for AGIs below $25k , 0.8% for AGIs $25k-50k , 1.5% for AGIs $50k-75k , 1.6% for AGIs $75k-100k , 1.7% for AGIs $100k-200k , 1.4% for AGIs over 200k ) Taxes paid: $5,805 (reported on 20.9% of returns )(% of AGI for various income ranges: 1.3% for AGIs below $25k , 2.0% for AGIs $25k-50k , 3.5% for AGIs $50k-75k , 3.5% for AGIs $75k-100k , 4.0% for AGIs $100k-200k , 2.7% for AGIs over 200k ) Earned income credit: $2,279 (reported on 24.1% of returns )(% of AGI for various income ranges: 7.4% for AGIs below $25k , 0.9% for AGIs $25k-50k ) Percentage of individuals using paid preparers for their 2012 taxes: 37.1%(% for various income ranges: 38.1% for AGIs below $25k , 34.7% for AGIs $25k-50k , 34.2% for AGIs $50k-75k , 37.0% for AGIs $75k-100k , 41.0% for AGIs $100k-200k , 57.1% for AGIs over 200k )
Averages for the 2004 tax year for zip code 78723, filed in 2005:
Average Adjusted Gross Income (AGI) in 2004: $30,282 (Individual Income Tax Returns) Here:
$30,282State:
$47,881
Salary/wage: $27,091 (reported on 86.1% of returns )Here:
$27,091State:
$41,947
(% of AGI for various income ranges: 99.0% for AGIs below $10k , 84.3% for AGIs $10k-25k , 84.9% for AGIs $25k-50k , 73.3% for AGIs $50k-75k , 72.0% for AGIs $75k-100k , 52.2% for AGIs over 100k ) Taxable interest for individuals: $1,157 (reported on 26.3% of returns )This zip code:
$1,157Texas:
$2,255
(% of AGI for various income ranges: 1.6% for AGIs below $10k , 0.6% for AGIs $10k-25k , 0.6% for AGIs $25k-50k , 1.1% for AGIs $50k-75k , 1.8% for AGIs $75k-100k , 1.6% for AGIs over 100k ) Taxable dividends: $1,932 (reported on 11.1% of returns )(% of AGI for various income ranges: 0.7% for AGIs below $10k , 0.5% for AGIs $10k-25k , 0.3% for AGIs $25k-50k , 0.6% for AGIs $50k-75k , 0.8% for AGIs $75k-100k , 2.1% for AGIs over 100k ) Net capital gain/loss: +$5,779 (reported on 9.2% of returns )Here:
+$5,779State:
+$16,110
(% of AGI for various income ranges: -0.3% for AGIs below $10k , 0.1% for AGIs $10k-25k , 0.2% for AGIs $25k-50k , 0.8% for AGIs $50k-75k , 1.7% for AGIs $75k-100k , 10.0% for AGIs over 100k ) Profit/loss from business: +$7,491 (reported on 13.5% of returns )Here:
+$7,491State:
+$11,013
(% of AGI for various income ranges: 6.0% for AGIs below $10k , 4.9% for AGIs $10k-25k , 2.6% for AGIs $25k-50k , 3.0% for AGIs $50k-75k , 2.7% for AGIs $75k-100k , 3.2% for AGIs over 100k ) IRA payment deduction: $2,451 (reported on 1.6% of returns )(% of AGI for various income ranges: 0.1% for AGIs $10k-25k , 0.1% for AGIs $25k-50k , 0.2% for AGIs $50k-75k , 0.3% for AGIs $75k-100k ) Self-employed pension: $6,222 (reported on 0.2% of returns )Total itemized deductions: $13,499 (25% of AGI, reported on 20.3% of returns )Here:
$13,499State:
$19,631
Here:
25.0% of AGIState:
18.9% of AGI
(% of AGI for various income ranges: 7.8% for AGIs below $10k , 5.8% for AGIs $10k-25k , 9.1% for AGIs $25k-50k , 11.9% for AGIs $50k-75k , 11.0% for AGIs $75k-100k , 8.2% for AGIs over 100k ) Charity contributions deductions: $2,974 (5% of AGI, reported on 15.6% of returns )Here:
5.2% of AGIState:
4.2% of AGI
(% of AGI for various income ranges: 0.5% for AGIs below $10k , 0.6% for AGIs $10k-25k , 1.2% for AGIs $25k-50k , 2.0% for AGIs $50k-75k , 2.3% for AGIs $75k-100k , 2.4% for AGIs over 100k ) Total tax: $4,226 (reported on 65.1% of returns )(% of AGI for various income ranges: 3.0% for AGIs below $10k , 3.5% for AGIs $10k-25k , 7.0% for AGIs $25k-50k , 10.4% for AGIs $50k-75k , 12.1% for AGIs $75k-100k , 19.3% for AGIs over 100k ) Earned income credit: $1,874 (reported on 26.4% of returns )Percentage of individuals using paid preparers for their 2004 taxes: 52.3%(% for various income ranges: 50.5% for AGIs below $10k , 60.6% for AGIs $10k-25k , 47.5% for AGIs $25k-50k , 45.4% for AGIs $50k-75k , 42.9% for AGIs $75k-100k , 50.6% for AGIs over 100k )
Estimated median household income in 2022: This zip code:
$81,143Texas:
$72,284
Nearest zip codes: 78722 ,
78752 ,
78721 ,
78751 ,
78702 ,
78712 .
Austin Zip Code Map
Percentage of family households: This zip code:
40.4%Texas:
50.5%
Percentage of households with unmarried partners: This zip code:
6.5%Texas:
48.7%
Likely homosexual households (counted as self-reported same-sex unmarried-partner households)
Lesbian couples: 0.0% of all households Gay men: 0.5% of all households
Household received Food Stamps/SNAP in the past 12 months: 1,919Household did not receive Food Stamps/SNAP in the past 12 months: 14,376
Women who had a birth in the past 12 months: 534 (388 now married , 146 unmarried) Women who did not have a birth in the past 12 months: 9,632 (3,789 now married , 5,857 unmarried)
Housing units in zip code 78723 with a mortgage: 5,572 (492
second mortgage , 19
home equity loan , 261
both second mortgage and home equity loan )
Houses without a mortgage: 18
Median monthly owner costs for units with a mortgage: $2,444
Median monthly owner costs for units without a mortgage: $909
Residents with income below the poverty level in 2022:
This zip code:
14.4%Whole state:
14.0%
Residents with income below 50% of the poverty level in 2022:
This zip code:
9.0%Whole state:
7.4%
Median number of rooms in houses and condos: Median number of rooms in apartments: Notable locations in this zip code not listed on our city pages
Click to draw/clear zip code borders Notable locations in zip code 78723: (A) , Abundant Life Learning Center (B) , Austin Fire Department Station 14 (C) , Austin Fire Department Station 18 (D) , Faith Christian Center (E) , Mount Sinai Baptist Church Family Life Center (F) , University Hills Branch Austin City Library (G) , Winsor Park Branch Austin City Library (H) . Display/hide their locations on the map
Shopping Centers: (1) , Springdale Shopping Center (2) . Display/hide their locations on the map
Churches in zip code 78723 include: (A) , Christ Apostolic Church (B) , Greater Love Baptist Church (C) , Greater Calvary Missionary Baptist Church (D) , Our Ladys Maronite Church (E) , Saint Stephens Baptist Church (F) , New Bethal Missionary Baptist Church (G) , Messiah Lutheran Church (H) , Saint James Episcopal Church (I) . Display/hide their locations on the map
Parks in zip code 78723 include: (1) , Seabrook Park (2) , Pecan Springs Park (3) , Bartholomew Park (4) . Display/hide their locations on the map
Year house built (houses)
96 2020 or later4,547 2010 to 20191,954 2000 to 2009495 1990 to 19991,594 1980 to 19892,088 1970 to 19793,867 1960 to 19691,901 1950 to 1959232 1940 to 194998 1939 or earlier
Zip code 78723 household income distribution in 2022 969 Less than $10,000806 $10,000 to $14,999486 $15,000 to $19,999564 $20,000 to $24,999572 $25,000 to $29,999395 $30,000 to $34,999731 $35,000 to $39,999351 $40,000 to $44,999564 $45,000 to $49,9991,032 $50,000 to $59,9991,184 $60,000 to $74,9992,009 $75,000 to $99,9991,234 $100,000 to $124,9991,298 $125,000 to $149,9991,681 $150,000 to $199,9992,373 $200,000 or moreEstimate of home value of owner-occupied houses/condos in 2022 in zip code 78723 12 Less than $10,00031 $35,000 to $39,99917 $40,000 to $49,99919 $70,000 to $79,99923 $80,000 to $89,99910 $90,000 to $99,99952 $100,000 to $124,99912 $125,000 to $149,999150 $150,000 to $174,99936 $175,000 to $199,999458 $200,000 to $249,999356 $250,000 to $299,9991,854 $300,000 to $399,9992,157 $400,000 to $499,9993,291 $500,000 to $749,999678 $750,000 to $999,999212 $1,000,000 to $1,499,99938 $1,500,000 to $1,999,99935 $2,000,000 or moreRent paid by renters in 2022 in zip code 78723 31 Less than $10062 $100 to $149117 $150 to $199113 $200 to $24990 $250 to $299163 $400 to $44912 $450 to $49917 $500 to $54989 $600 to $64994 $650 to $69915 $700 to $74941 $750 to $799539 $800 to $899572 $900 to $9992,194 $1,000 to $1,2491,051 $1,250 to $1,4991,638 $1,500 to $1,999959 $2,000 to $2,499329 $2,500 to $2,999103 $3,000 to $3,499250 $3,500 or more152 No cash rent
Median gross rent in 2022: $1,432.
Median price asked for vacant for-sale houses and condos in 2022: $5,834,963.
Estimated median house (or condo) value in 2022 for: White Non-Hispanic householders: $537,064Black or African American householders: $522,817American Indian or Alaska Native householders: $483,172Asian householders: $675,821Some other race householders: $494,941Two or more races householders: $588,479Hispanic or Latino householders: $507,330Estimated median house or condo value in 2022: $527,773
78723:
$527,773Texas:
$275,400
Lower value quartile - upper value quartile: $401,803 - $702,449
Mean price in 2022: Detached houses: $737,673Here:
$737,673State:
$369,058
Townhouses or other attached units: $533,017Here:
$533,017State:
$327,631
In 2-unit structures: $1,093,219Here:
$1,093,219State:
$374,947
In 3-to-4-unit structures: $301,152Here:
$301,152State:
$209,652
In 5-or-more-unit structures: $800,345Here:
$800,345State:
$413,944
Mobile homes: $105,214Here:
$105,214State:
$124,413
Housing units in structures:
One, detached: 8,170One, attached: 1,434Two: 6333 or 4: 4375 to 9: 72310 to 19: 76220 to 49: 1,55850 or more: 3,717Mobile homes: 6Unemployment : 3.5%
Means of transportation to work in zip code 78723 60.3% 12,909 Drove a car alone7.4% 1,592 Carpooled2.6% 553 Bus or trolley bus0.0% 7 Subway or elevated0.1% 32 Taxi0.1% 18 Motorcycle0.9% 182 Bicycle1.8% 380 Walked1.7% 361 Other means28.6% 6,117 Worked at homeTravel time to work (commute) in zip code 78723 428 Less than 5 minutes1,077 5 to 9 minutes1,684 10 to 14 minutes3,173 15 to 19 minutes3,097 20 to 24 minutes1,133 25 to 29 minutes2,772 30 to 34 minutes265 35 to 39 minutes286 40 to 44 minutes689 45 to 59 minutes939 60 to 89 minutes545 90 or more minutes
Neighborhoods in zip code 78723: Percentage of zip code residents living and working in this county: 94.0%
Household type by relationship:
Households: 37,994
Male householders: 7,854 (2,483 living alone ), Female householders: 8,449 (3,103 living alone )5,958 spouses (5,761 opposite-sex spouses ), 1,726 unmarried partners , (1,575 opposite-sex unmarried partners ), 9,097 children (8,627 natural , 145 adopted , 324 stepchildren ), 1,087 grandchildren , 606 brothers or sisters , 391 parents , 9 foster children , 503 other relatives , 2,068 non-relatives In group quarters: 325 (-1 institutionalized population )
Size of family households: 3,527 2-persons , 1,802 3-persons , 1,629 4-persons , 783 5-persons , 517 6-persons , 184 7-or-more-persons
Size of nonfamily households: 5,585 1-person , 1,947 2-persons , 290 3-persons , 126 4-persons , 28 6-persons
4,459 married couples with children. single-parent households (297 men , 2,085 women ).
69.2% of residents of 78723 zip code speak English at home. of residents speak Spanish at home (55% very well, 20% well, 14% not well, 11% not at all ).of residents speak other Indo-European language at home (72% very well, 14% well, 5% not well, 9% not at all ).of residents speak Asian or Pacific Island language at home (51% very well, 36% well, 2% not well, 11% not at all ).of residents speak other language at home (89% very well, 11% not well ).
Foreign born population: 6,301 (16.6%)
(29.3%
of them are naturalized citizens )
This zip code:
16.6%Whole state:
17.2%
46% Honduras 12% Guatemala 6% Costa Rica 3% Japan 2% Barbados 2% Malaysia 2% Liberia 5% Irish 4% English 3% German 3% American 2% Afghan 1% Scottish 1% European
Year of entry for the foreign-born population
3,279 2010 or later 1,429 2000 to 2009 1,277 1990 to 1999 1,090 Before 1990
There are
111 Pediatrics 237 Other Medical Specialists in Zip Code 78723.
Facilities with environmental interests located in this zip code:
AUSTIN ARMY AVIATION SPT FAC (2001 EAST 51ST BLDG #4428 in AUSTIN, TX)
(Integrated Compliance Information System) - ICIS-06-1997-0379, FORMAL ENFORCEMENT ACTION (Resource Conservation and Recovery Act (tracking hazardous waste)) Business SIC classification: NATIONAL SECURITYOrganizations: TEXAS NATIONAL GUARD (CONTACT/OPERATOR)
ANDREWS EL (6801 NE DR in AUSTIN, TX)
(National Center for Education Statistics) - STATE ID-227901102 Organizations: AUSTIN ISD (SCHOOL DISTRICT)
AUSTIN ISD (6401 N HAMPTON in AUSTIN, TX)
(Resource Conservation and Recovery Act (tracking hazardous waste)) Alternative names: PEARCE JUNIOR HIGH SCHOOL
AUSTIN ISD (5101 E 51ST ST in AUSTIN, TX)
(Resource Conservation and Recovery Act (tracking hazardous waste)) Alternative names: AUSTIN ISD SERVICE CENTER
AUSTIN MUNICIPAL AIRPORT (3600 MANOR RD in AUSTIN, TX)
COMPLIANCE ACTIVITY (Tracking inspections of insecticide, fungicide, and rodenticide, and toxic substances) Business SIC classification: COMBINATION UTILITIES
Housing units lacking complete plumbing facilities: 0.3%
Housing units lacking complete kitchen facilities: 0.4%
49.3% Utility gas 48.6% Electricity 1.4% Bottled, tank, or LP gas 0.6% No fuel used
Population in 1990: 22,972. Population change in the 1990s: +7,138 (+31.1%).
Place of birth for U.S.-born residents:
This state: 19,661Northeast: 2,071Midwest: 3,162South: 3,366West: 2,968
47% of the 78723 zip code residents lived in the same house 5 years ago.
Out of people who lived in different houses, 66% lived in this county.
Out of people who lived in different counties, 50% lived in Texas.
81% of the 78723 zip code residents lived in the same house 1 year ago.
Out of people who lived in different houses, 60% moved from this county.
Out of people who lived in different houses, 14% moved from different county within same state.
Out of people who lived in different houses, 20% moved from different state.
Out of people who lived in different houses, 3% moved from abroad.
Private vs. public school enrollment:
Students in private schools in grades 1 to 8 (elementary and middle school): 338
Students in private schools in grades 9 to 12 (high school): 179
Students in private undergraduate colleges: 108
Occupation by median earnings in the past 12 months ($)
109,822 Health diagnosing and treating practitioners and other technical occupations 103,560 Computer and mathematical occupations 93,012 Legal occupations 84,877 Architecture and engineering occupations 84,017 Management occupations 76,134 Business and financial operations occupations
Companies with federal contracts located in this zip code (AUSTIN, TX):
RELIEF ENTERPRISE, INC (6448 HIGHWAY 290 EAST) in 158 contracts from 2001 to 2006
Contracts for Other Housekeeping Services, Custodial Janitorial Services, Maintenance, Repair or Alteration of Real Property -- Miscellaneous Buildings by Navy, Army, Air ForceSigned by year: 2000: $0; 2001: $704,254; 2002: $4,197,736; 2003: $4,646,933; 2004: $4,443,224; 2005: $4,750,050; 2006: $1,355,400.
Biggest contracts: with Navy for Other Housekeeping Services. Taking place in IL. Signed on 2002-01-29. Completion date: 2003-01-31.
, same as above. Signed on 2005-01-31. Completion date: 2006-01-31.
, same as above. Signed on 2004-09-28. Completion date: 2004-01-31.
, same as above. Signed on 2003-01-31. Completion date: 2003-01-31.
UNITED CONTRACTOR SERVICES (6448 EAST HIGHWAY 290 SUIT; small business) in 19 contracts from 2000 to 2006
Contracts for Landscaping/Groundskeeping Services, Tree Thinning Services, Land Treatment Practices Services (plowing/clearing, etc.), Other Range/Forest Improvements Services (non-construction) by Air Force, Army, U.S. Fish and Wildlife ServiceSigned by year: 2000: $133,773; 2001: $292,018; 2002: $72,750; 2003: $405,596; 2004: $330,592; 2005: $418,803; 2006: $66,672.
Biggest contracts: with Air Force for Landscaping/Groundskeeping Services. Taking place in NM. Signed on 2001-01-10. Completion date: 2001-09-30.
with Air Force for Landscaping/Groundskeeping Services. Taking place in CA. Signed on 2004-10-01. Completion date: 2005-09-30.
, same as above. Signed on 2003-10-01. Completion date: 2004-09-30.
, same as above. Signed on 2005-10-01. Completion date: 2006-09-30.
LYNX SYSTEMS INC (6448 E HIGHWAY 290 E107; small business)
$33,888 with Air Force for Dentistry Services. Taking place in CA. Signed on 2006-03-21. Completion date: 2007-03-31.
CBD ENTERPRISES INC (6448 E HIGHWAY 290 A100; small business)
$8,000 with Army for Condiments and Related Products. Signed on 2006-06-22. Completion date: 2006-06-29.
Top industries in this zip code by the number of employees in 2005:
Administrative and Support and Waste Management and Remediation Services: Temporary Help Services (250-499 employees: 1 establishment, 100-249 employees: 2 establishments, 20-49 employees: 1 establishment, 1-4 employees: 2 establishments)Accommodation and Food Services: Limited-Service Restaurants (20-49: 10, 10-19: 4, 5-9: 3, 1-4: 3)Professional, Scientific, and Technical Services: Payroll Services (250-499: 1, 20-49: 1)Administrative and Support and Waste Management and Remediation Services: Janitorial Services (100-249: 2, 20-49: 1, 5-9: 2, 1-4: 3)Finance and Insurance: Direct Property and Casualty Insurance Carriers (250-499: 1)Accommodation and Food Services: Full-Service Restaurants (50-99: 1, 20-49: 5, 10-19: 1, 5-9: 1, 1-4: 1)Finance and Insurance: Credit Unions (100-249: 1, 50-99: 1, 10-19: 1, 1-4: 1)Health Care and Social Assistance: Residential Mental Retardation Facilities (100-249: 1, 20-49: 1, 5-9: 1)
People in group quarters in 2010:
95 people in nursing facilities/skilled-nursing facilities
39 people in correctional residential facilities
37 people in group homes intended for adults
21 people in group homes for juveniles (non-correctional)
10 people in residential treatment centers for juveniles (non-correctional)
8 people in other noninstitutional facilities
4 people in residential treatment centers for adults
3 people in workers' group living quarters and job corps centers
People in group quarters in 2000:
111 people in nursing homes
35 people in homes for the physically handicapped
25 people in homes for the mentally retarded
16 people in homes or halfway houses for drug/alcohol abuse
12 people in other nonhousehold living situations
7 people in homes for the mentally ill
3 people in religious group quarters
Fatal accident statistics in 2014:
Fatal accident count: 4Vehicles involved in fatal accidents: 5Fatal accidents caused by drunken drivers: 1Fatalities: 4Persons involved in fatal accidents: 6Pedestrians involved in fatal accidents: 1
Fatal accident statistics in 2013:
Fatal accident count: 5Vehicles involved in fatal accidents: 6Fatal accidents caused by drunken drivers: 1Fatalities: 5Persons involved in fatal accidents: 10Pedestrians involved in fatal accidents: 2
Home Mortgage Disclosure Act Aggregated Statistics For Year 2009(Based on 9 full and 8 partial tracts) A) FHA, FSA/RHS & VA B) Conventional C) Refinancings D) Home Improvement Loans E) Loans on Dwellings For 5+ Families F) Non-occupant Loans on G) Loans On Manufactured Number Average Value Number Average Value Number Average Value Number Average Value Number Average Value Number Average Value Number Average Value
LOANS ORIGINATED 176 $175,523 253 $153,713 532 $141,350 77 $45,430 0 $0 80 $127,689 0 $0 APPLICATIONS APPROVED, NOT ACCEPTED 4 $136,075 13 $131,448 76 $127,782 13 $41,138 6 $642,018 7 $144,823 0 $0 APPLICATIONS DENIED 11 $146,189 36 $137,713 195 $123,776 114 $37,068 0 $0 39 $126,572 2 $22,420 APPLICATIONS WITHDRAWN 18 $174,787 28 $240,002 165 $141,629 40 $54,273 0 $0 25 $156,320 0 $0 FILES CLOSED FOR INCOMPLETENESS 1 $235,510 5 $144,790 42 $116,540 17 $45,852 0 $0 5 $105,346 2 $19,845
Aggregated Statistics For Year 2008(Based on 9 full and 8 partial tracts) A) FHA, FSA/RHS & VA B) Conventional C) Refinancings D) Home Improvement Loans F) Non-occupant Loans on G) Loans On Manufactured Number Average Value Number Average Value Number Average Value Number Average Value Number Average Value Number Average Value
LOANS ORIGINATED 80 $184,493 435 $172,500 397 $125,900 96 $54,420 139 $131,246 1 $63,570 APPLICATIONS APPROVED, NOT ACCEPTED 10 $133,053 50 $168,109 51 $118,482 23 $119,763 13 $190,814 4 $71,632 APPLICATIONS DENIED 14 $145,820 93 $131,954 350 $119,418 162 $56,390 72 $135,717 20 $53,295 APPLICATIONS WITHDRAWN 11 $192,400 77 $181,925 121 $123,598 29 $62,959 27 $120,616 0 $0 FILES CLOSED FOR INCOMPLETENESS 2 $106,345 9 $164,679 45 $127,912 3 $136,177 5 $175,976 0 $0
Aggregated Statistics For Year 2007(Based on 9 full and 8 partial tracts) A) FHA, FSA/RHS & VA B) Conventional C) Refinancings D) Home Improvement Loans E) Loans on Dwellings For 5+ Families F) Non-occupant Loans on G) Loans On Manufactured Number Average Value Number Average Value Number Average Value Number Average Value Number Average Value Number Average Value Number Average Value
LOANS ORIGINATED 58 $145,390 866 $123,512 410 $116,157 122 $52,105 11 $1,197,628 297 $109,958 2 $39,375 APPLICATIONS APPROVED, NOT ACCEPTED 26 $129,781 107 $117,268 61 $107,709 19 $32,699 0 $0 28 $128,970 6 $46,683 APPLICATIONS DENIED 16 $138,288 127 $91,871 492 $120,973 168 $35,119 0 $0 92 $112,024 17 $51,753 APPLICATIONS WITHDRAWN 36 $133,920 113 $117,931 274 $113,528 41 $70,302 5 $713,408 26 $119,706 0 $0 FILES CLOSED FOR INCOMPLETENESS 18 $133,298 34 $117,499 79 $131,551 13 $45,196 0 $0 14 $129,460 0 $0
Aggregated Statistics For Year 2006(Based on 9 full and 8 partial tracts) A) FHA, FSA/RHS & VA B) Conventional C) Refinancings D) Home Improvement Loans E) Loans on Dwellings For 5+ Families F) Non-occupant Loans on G) Loans On Manufactured Number Average Value Number Average Value Number Average Value Number Average Value Number Average Value Number Average Value Number Average Value
LOANS ORIGINATED 36 $133,725 924 $90,734 516 $106,116 110 $37,998 10 $1,198,942 523 $92,818 9 $60,674 APPLICATIONS APPROVED, NOT ACCEPTED 2 $74,850 143 $84,015 87 $93,453 46 $37,165 0 $0 76 $85,949 11 $71,951 APPLICATIONS DENIED 4 $121,542 158 $88,237 528 $107,092 178 $33,891 2 $878,240 113 $89,106 21 $45,611 APPLICATIONS WITHDRAWN 0 $0 111 $98,254 441 $111,050 24 $58,315 0 $0 74 $104,614 2 $101,215 FILES CLOSED FOR INCOMPLETENESS 0 $0 26 $89,427 77 $116,359 5 $157,736 0 $0 15 $92,177 0 $0
Aggregated Statistics For Year 2005(Based on 9 full and 8 partial tracts) A) FHA, FSA/RHS & VA B) Conventional C) Refinancings D) Home Improvement Loans E) Loans on Dwellings For 5+ Families F) Non-occupant Loans on G) Loans On Manufactured Number Average Value Number Average Value Number Average Value Number Average Value Number Average Value Number Average Value Number Average Value
LOANS ORIGINATED 64 $127,811 933 $86,162 588 $96,786 149 $60,202 4 $1,007,132 519 $86,507 8 $116,244 APPLICATIONS APPROVED, NOT ACCEPTED 12 $113,026 114 $74,413 122 $97,127 49 $25,379 0 $0 50 $85,907 7 $32,966 APPLICATIONS DENIED 13 $103,112 265 $76,224 800 $99,440 204 $36,222 0 $0 167 $90,296 30 $59,972 APPLICATIONS WITHDRAWN 14 $96,274 145 $90,517 461 $110,789 94 $149,405 0 $0 82 $90,272 4 $10,488 FILES CLOSED FOR INCOMPLETENESS 0 $0 30 $84,276 173 $103,708 2 $990 2 $1,253,490 11 $83,579 0 $0
Aggregated Statistics For Year 2004(Based on 9 full and 8 partial tracts) A) FHA, FSA/RHS & VA B) Conventional C) Refinancings D) Home Improvement Loans E) Loans on Dwellings For 5+ Families F) Non-occupant Loans on G) Loans On Manufactured Number Average Value Number Average Value Number Average Value Number Average Value Number Average Value Number Average Value Number Average Value
LOANS ORIGINATED 104 $120,447 568 $82,333 1,051 $90,060 90 $33,537 6 $2,227,430 396 $89,232 4 $100,518 APPLICATIONS APPROVED, NOT ACCEPTED 9 $123,726 81 $73,860 169 $87,677 24 $49,581 0 $0 48 $84,837 13 $52,212 APPLICATIONS DENIED 19 $142,028 128 $76,540 923 $93,441 142 $40,075 0 $0 114 $86,339 29 $57,142 APPLICATIONS WITHDRAWN 16 $123,564 80 $84,732 635 $94,317 28 $56,630 0 $0 89 $88,287 1 $55,660 FILES CLOSED FOR INCOMPLETENESS 3 $73,840 10 $106,631 136 $107,462 6 $118,675 0 $0 19 $123,012 0 $0
Aggregated Statistics For Year 2003(Based on 9 full and 8 partial tracts) A) FHA, FSA/RHS & VA B) Conventional C) Refinancings D) Home Improvement Loans E) Loans on Dwellings For 5+ Families F) Non-occupant Loans on Number Average Value Number Average Value Number Average Value Number Average Value Number Average Value Number Average Value
LOANS ORIGINATED 153 $116,635 446 $92,134 1,399 $90,963 59 $32,662 14 $1,326,855 322 $94,271 APPLICATIONS APPROVED, NOT ACCEPTED 2 $109,780 50 $104,008 183 $107,527 31 $45,844 0 $0 56 $96,370 APPLICATIONS DENIED 11 $113,201 182 $73,732 777 $82,440 111 $29,427 4 $2,069,133 119 $72,358 APPLICATIONS WITHDRAWN 14 $109,228 82 $93,384 721 $90,470 14 $34,587 0 $0 78 $85,223 FILES CLOSED FOR INCOMPLETENESS 0 $0 16 $101,684 60 $78,514 7 $48,496 0 $0 14 $68,667
Aggregated Statistics For Year 2002(Based on 9 full and 8 partial tracts) A) FHA, FSA/RHS & VA B) Conventional C) Refinancings D) Home Improvement Loans E) Loans on Dwellings For 5+ Families F) Non-occupant Loans on Number Average Value Number Average Value Number Average Value Number Average Value Number Average Value Number Average Value
LOANS ORIGINATED 134 $112,998 392 $87,648 970 $86,052 109 $29,341 0 $0 229 $85,358 APPLICATIONS APPROVED, NOT ACCEPTED 6 $79,313 64 $59,972 136 $75,953 22 $33,645 0 $0 38 $108,101 APPLICATIONS DENIED 7 $105,887 213 $64,705 415 $84,880 130 $14,472 6 $701,645 95 $105,895 APPLICATIONS WITHDRAWN 14 $108,103 63 $94,580 517 $87,714 20 $26,052 0 $0 36 $92,450 FILES CLOSED FOR INCOMPLETENESS 4 $99,682 34 $81,935 61 $83,022 10 $22,945 0 $0 5 $97,284
Aggregated Statistics For Year 2001(Based on 9 full and 8 partial tracts) A) FHA, FSA/RHS & VA B) Conventional C) Refinancings D) Home Improvement Loans E) Loans on Dwellings For 5+ Families F) Non-occupant Loans on Number Average Value Number Average Value Number Average Value Number Average Value Number Average Value Number Average Value
LOANS ORIGINATED 200 $102,503 404 $88,196 750 $85,254 108 $22,980 9 $1,191,202 213 $92,577 APPLICATIONS APPROVED, NOT ACCEPTED 1 $47,870 67 $58,977 130 $69,703 51 $23,959 0 $0 20 $73,498 APPLICATIONS DENIED 19 $94,989 204 $63,531 301 $71,881 145 $17,122 2 $553,890 40 $63,641 APPLICATIONS WITHDRAWN 17 $89,262 71 $84,856 338 $78,896 45 $9,826 0 $0 32 $78,818 FILES CLOSED FOR INCOMPLETENESS 3 $117,067 7 $54,614 97 $87,645 0 $0 0 $0 12 $78,942
Aggregated Statistics For Year 2000(Based on 9 full and 8 partial tracts) A) FHA, FSA/RHS & VA B) Conventional C) Refinancings D) Home Improvement Loans E) Loans on Dwellings For 5+ Families F) Non-occupant Loans on Number Average Value Number Average Value Number Average Value Number Average Value Number Average Value Number Average Value
LOANS ORIGINATED 200 $96,512 491 $77,901 249 $68,840 73 $22,022 1 $542,100 168 $74,646 APPLICATIONS APPROVED, NOT ACCEPTED 33 $56,165 96 $60,110 84 $65,116 24 $28,408 1 $668,360 34 $75,634 APPLICATIONS DENIED 48 $71,953 339 $48,952 210 $61,063 110 $20,908 2 $573,850 59 $58,601 APPLICATIONS WITHDRAWN 24 $98,078 70 $73,775 96 $65,872 14 $44,151 0 $0 28 $82,581 FILES CLOSED FOR INCOMPLETENESS 6 $91,777 24 $66,293 65 $78,978 0 $0 2 $4,303,375 2 $70,025
Aggregated Statistics For Year 1999(Based on 5 full and 4 partial tracts) A) FHA, FSA/RHS & VA B) Conventional C) Refinancings D) Home Improvement Loans E) Loans on Dwellings For 5+ Families F) Non-occupant Loans on Number Average Value Number Average Value Number Average Value Number Average Value Number Average Value Number Average Value
LOANS ORIGINATED 134 $82,266 182 $72,262 212 $60,122 57 $14,631 6 $1,578,148 76 $58,308 APPLICATIONS APPROVED, NOT ACCEPTED 6 $82,825 40 $54,139 39 $51,543 23 $13,989 0 $0 8 $54,211 APPLICATIONS DENIED 14 $82,846 172 $51,747 128 $52,887 81 $12,486 0 $0 27 $49,130 APPLICATIONS WITHDRAWN 15 $81,179 30 $71,845 66 $58,476 4 $11,570 0 $0 5 $53,968 FILES CLOSED FOR INCOMPLETENESS 1 $79,000 13 $83,222 46 $55,977 2 $80,310 0 $0 2 $88,520
Private Mortgage Insurance Companies Aggregated Statistics For Year 2009(Based on 9 full and 8 partial tracts) A) Conventional B) Refinancings C) Non-occupant Loans on Number Average Value Number Average Value Number Average Value
LOANS ORIGINATED 60 $215,323 15 $173,427 0 $0 APPLICATIONS APPROVED, NOT ACCEPTED 23 $214,914 5 $174,472 6 $151,552 APPLICATIONS DENIED 14 $208,793 1 $190,000 2 $166,705 APPLICATIONS WITHDRAWN 2 $215,500 3 $195,660 0 $0 FILES CLOSED FOR INCOMPLETENESS 0 $0 0 $0 0 $0
Aggregated Statistics For Year 2008(Based on 9 full and 8 partial tracts) A) Conventional B) Refinancings C) Non-occupant Loans on Number Average Value Number Average Value Number Average Value
LOANS ORIGINATED 121 $185,438 7 $109,606 34 $146,077 APPLICATIONS APPROVED, NOT ACCEPTED 42 $170,525 0 $0 2 $88,585 APPLICATIONS DENIED 7 $192,250 0 $0 2 $138,865 APPLICATIONS WITHDRAWN 7 $195,704 2 $154,615 2 $189,320 FILES CLOSED FOR INCOMPLETENESS 0 $0 2 $59,605 2 $59,605
Aggregated Statistics For Year 2007(Based on 9 full and 8 partial tracts) A) Conventional B) Refinancings C) Non-occupant Loans on Number Average Value Number Average Value Number Average Value
LOANS ORIGINATED 241 $149,711 1 $219,000 38 $152,779 APPLICATIONS APPROVED, NOT ACCEPTED 21 $138,707 8 $144,509 7 $134,344 APPLICATIONS DENIED 1 $190,180 2 $104,790 2 $104,790 APPLICATIONS WITHDRAWN 14 $167,916 2 $482,175 6 $171,058 FILES CLOSED FOR INCOMPLETENESS 0 $0 0 $0 0 $0
Aggregated Statistics For Year 2006(Based on 9 full and 8 partial tracts) A) Conventional B) Refinancings C) Non-occupant Loans on Number Average Value Number Average Value Number Average Value
LOANS ORIGINATED 100 $125,491 6 $122,132 39 $106,087 APPLICATIONS APPROVED, NOT ACCEPTED 4 $156,300 0 $0 2 $164,175 APPLICATIONS DENIED 5 $154,808 0 $0 3 $128,000 APPLICATIONS WITHDRAWN 0 $0 0 $0 0 $0 FILES CLOSED FOR INCOMPLETENESS 0 $0 0 $0 0 $0
Aggregated Statistics For Year 2005(Based on 9 full and 8 partial tracts) A) Conventional B) Refinancings C) Non-occupant Loans on Number Average Value Number Average Value Number Average Value
LOANS ORIGINATED 125 $115,926 16 $142,774 47 $108,017 APPLICATIONS APPROVED, NOT ACCEPTED 13 $135,566 14 $110,376 14 $113,244 APPLICATIONS DENIED 0 $0 0 $0 0 $0 APPLICATIONS WITHDRAWN 4 $150,960 0 $0 0 $0 FILES CLOSED FOR INCOMPLETENESS 0 $0 0 $0 0 $0
Aggregated Statistics For Year 2004(Based on 9 full and 8 partial tracts) A) Conventional B) Refinancings C) Non-occupant Loans on D) Loans On Manufactured Number Average Value Number Average Value Number Average Value Number Average Value
LOANS ORIGINATED 105 $111,101 31 $131,491 35 $107,843 2 $127,015 APPLICATIONS APPROVED, NOT ACCEPTED 22 $119,979 8 $117,552 13 $117,509 2 $126,020 APPLICATIONS DENIED 0 $0 0 $0 0 $0 0 $0 APPLICATIONS WITHDRAWN 4 $102,995 2 $89,065 6 $92,525 0 $0 FILES CLOSED FOR INCOMPLETENESS 0 $0 0 $0 0 $0 0 $0
Aggregated Statistics For Year 2003(Based on 9 full and 8 partial tracts) A) Conventional B) Refinancings C) Non-occupant Loans on Number Average Value Number Average Value Number Average Value
LOANS ORIGINATED 114 $118,209 83 $126,943 55 $115,685 APPLICATIONS APPROVED, NOT ACCEPTED 18 $144,474 12 $100,217 11 $137,111 APPLICATIONS DENIED 1 $108,000 2 $116,765 3 $113,843 APPLICATIONS WITHDRAWN 10 $108,449 4 $128,005 2 $73,730 FILES CLOSED FOR INCOMPLETENESS 0 $0 0 $0 0 $0
Aggregated Statistics For Year 2002(Based on 9 full and 8 partial tracts) A) Conventional B) Refinancings C) Non-occupant Loans on Number Average Value Number Average Value Number Average Value
LOANS ORIGINATED 131 $117,928 35 $130,879 41 $95,117 APPLICATIONS APPROVED, NOT ACCEPTED 22 $104,166 17 $106,060 15 $105,659 APPLICATIONS DENIED 3 $87,833 2 $215,570 3 $181,223 APPLICATIONS WITHDRAWN 14 $103,307 2 $67,925 6 $94,317 FILES CLOSED FOR INCOMPLETENESS 0 $0 2 $129,990 2 $129,990
Aggregated Statistics For Year 2001(Based on 9 full and 8 partial tracts) A) Conventional B) Refinancings C) Non-occupant Loans on Number Average Value Number Average Value Number Average Value
LOANS ORIGINATED 157 $110,946 28 $112,321 52 $107,566 APPLICATIONS APPROVED, NOT ACCEPTED 20 $99,112 3 $96,693 6 $61,520 APPLICATIONS DENIED 2 $122,385 2 $112,130 0 $0 APPLICATIONS WITHDRAWN 6 $91,217 2 $100,640 2 $53,890 FILES CLOSED FOR INCOMPLETENESS 7 $85,360 0 $0 2 $63,505
Aggregated Statistics For Year 2000(Based on 9 full and 8 partial tracts) A) Conventional B) Refinancings C) Non-occupant Loans on Number Average Value Number Average Value Number Average Value
LOANS ORIGINATED 188 $93,375 20 $80,222 66 $79,509 APPLICATIONS APPROVED, NOT ACCEPTED 17 $89,980 2 $58,705 0 $0 APPLICATIONS DENIED 11 $79,885 2 $106,175 4 $81,530 APPLICATIONS WITHDRAWN 7 $98,061 0 $0 2 $135,100 FILES CLOSED FOR INCOMPLETENESS 2 $65,925 0 $0 0 $0
Aggregated Statistics For Year 1999(Based on 5 full and 4 partial tracts) A) Conventional B) Refinancings C) Non-occupant Loans on Number Average Value Number Average Value Number Average Value
LOANS ORIGINATED 60 $82,896 8 $69,884 15 $76,533 APPLICATIONS APPROVED, NOT ACCEPTED 4 $63,675 2 $167,115 2 $43,800 APPLICATIONS DENIED 6 $80,282 0 $0 5 $76,784 APPLICATIONS WITHDRAWN 0 $0 4 $59,845 1 $37,000 FILES CLOSED FOR INCOMPLETENESS 1 $64,000 0 $0 1 $64,000
2002 - 2018 National Fire Incident Reporting System (NFIRS) incidents See full 2006 National Fire Incident Reporting System statistics for zip code 78723, Texas
Most common first names in zip code 78723 among deceased individuals Name Count Lived (average)
Mary 91 77.7 years John 76 71.8 years James 70 69.6 years William 69 67.7 years Robert 68 66.8 years Charles 60 67.3 years Willie 55 74.8 years George 40 73.1 years Ruth 34 79.3 years Dorothy 30 76.4 years
Most common last names in zip code 78723 among deceased individuals Last name Count Lived (average)
Williams 56 67.1 years Johnson 49 71.4 years Smith 44 75.2 years Jones 44 71.8 years Jackson 35 72.5 years Brown 34 73.3 years Anderson 33 72.6 years Wilson 30 72.1 years Taylor 26 76.4 years Davis 24 73.7 years
Businesses in zip code 78723
Name Count Name Count
AT&T 1 OfficeMax 1 Advance Auto Parts 1 Old Navy 1 AutoZone 2 PetSmart 1 Bed Bath & Beyond 1 Pizza Hut 1 CVS 1 Popeyes 1 Chipotle 1 RadioShack 2 Church's Chicken 1 Rue21 1 Cricket Wireless 3 SONIC Drive-In 2 Domino's Pizza 1 Sprint Nextel 1 Extended Stay Deluxe 1 Staples 1 Famous Footwear 1 Starbucks 1 FedEx 3 Subway 1 H&R Block 1 Super 8 1 Hilton 1 T-Mobile 1 Home Depot 1 Taco Bell 1 Jack In The Box 1 Target 1 KFC 1 Toys"R"Us 1 Lane Furniture 2 U-Haul 1 Long John Silver's 1 UPS 3 McDonald's 1 Walgreens 1 Nike 1 YMCA 1

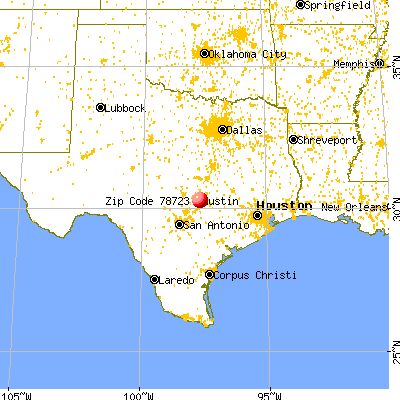


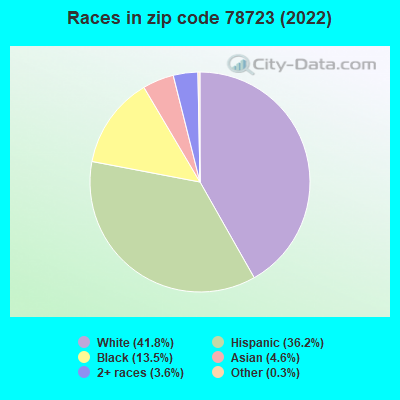


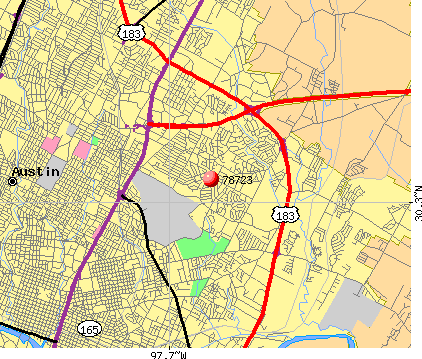 Nearest zip codes: 78722, 78752, 78721, 78751, 78702, 78712.
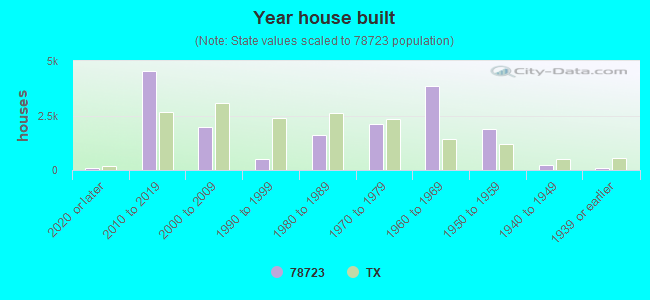

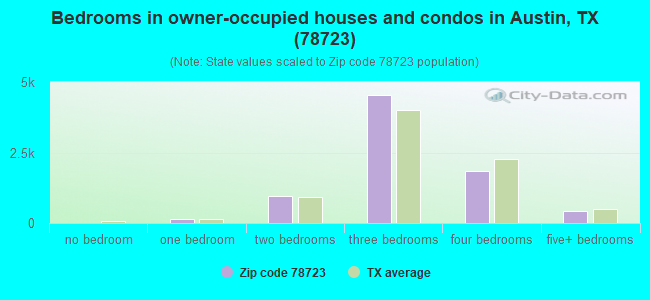
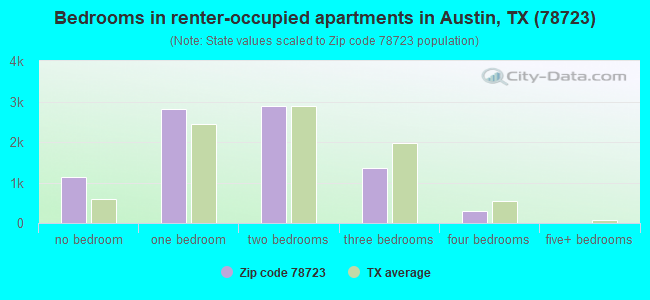
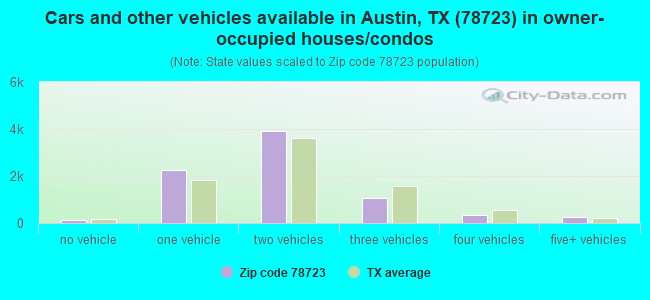
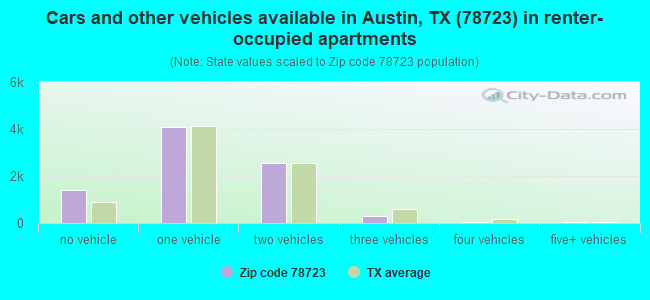


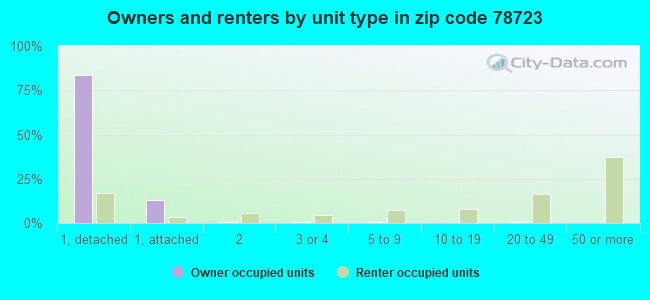
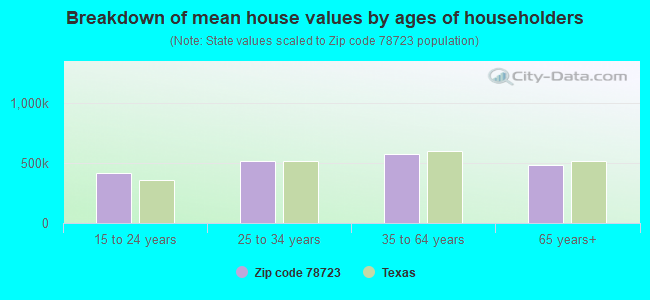


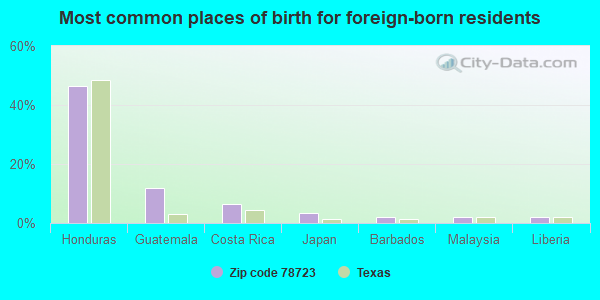
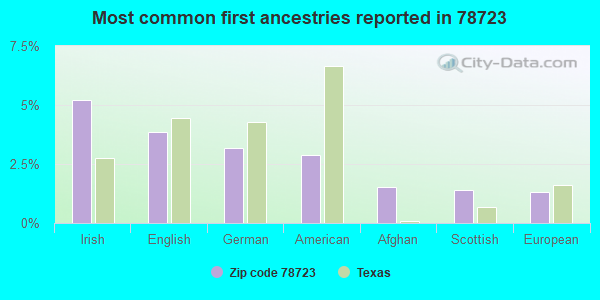
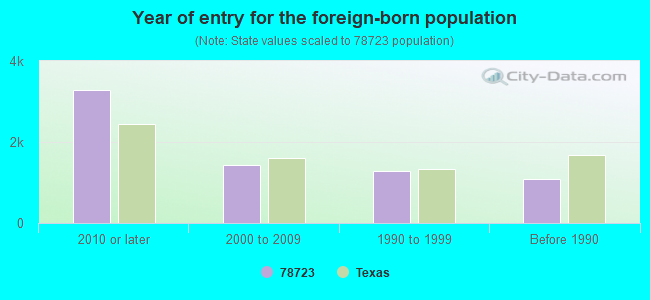

 . Federal Facility. U.S. ARMY
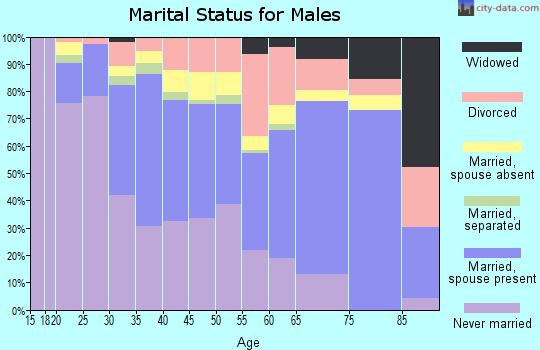

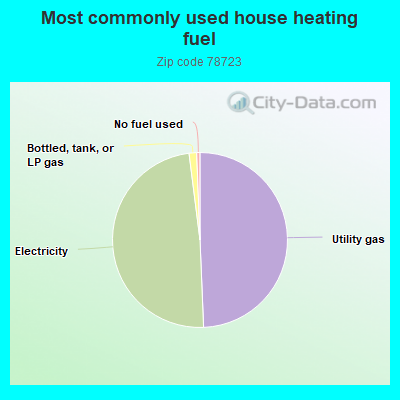
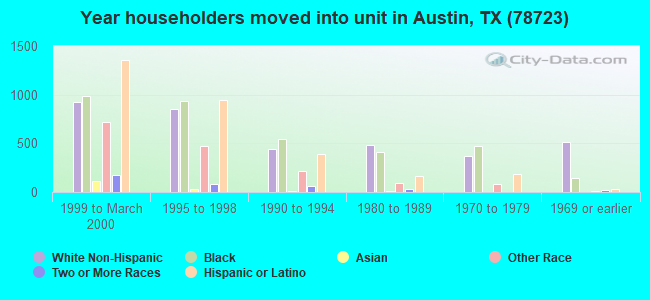
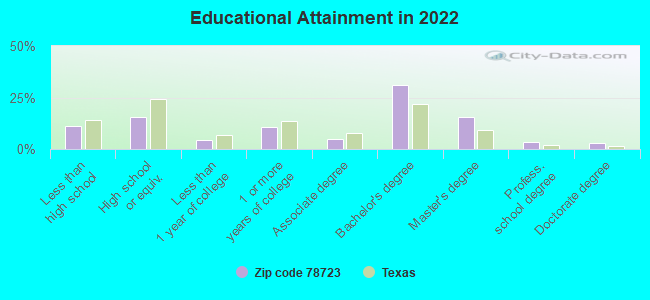
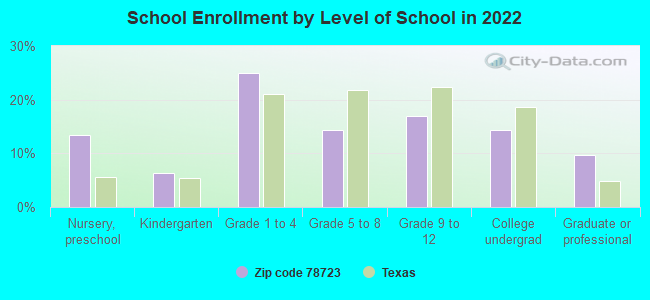
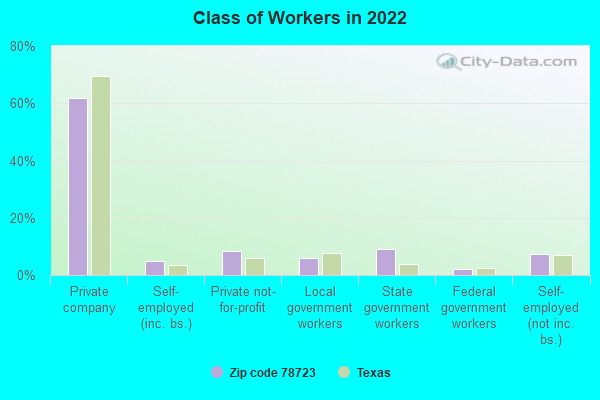

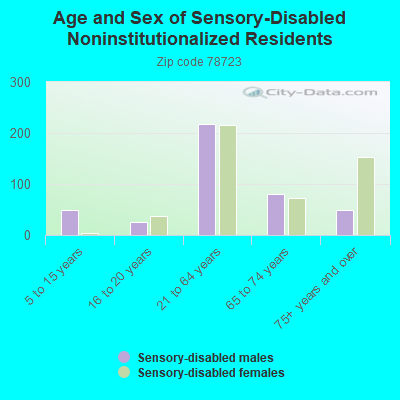
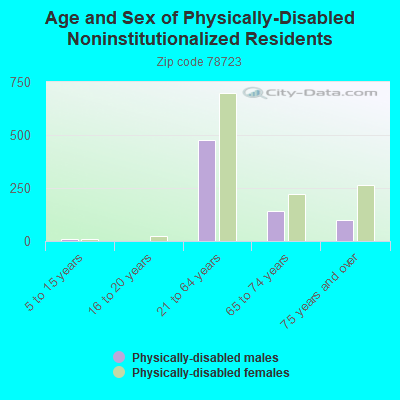
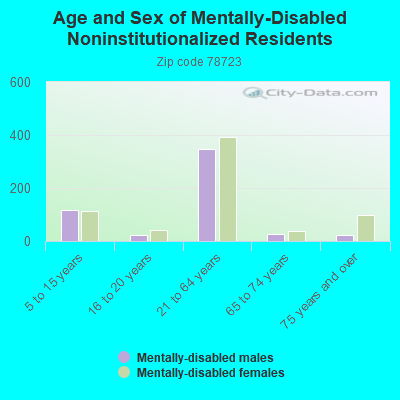
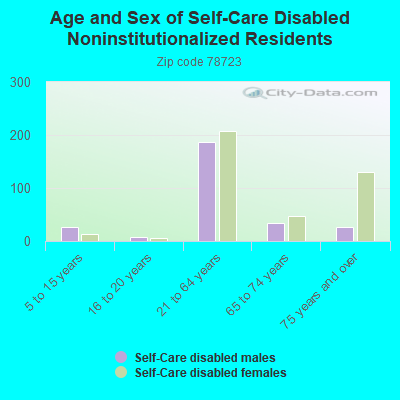
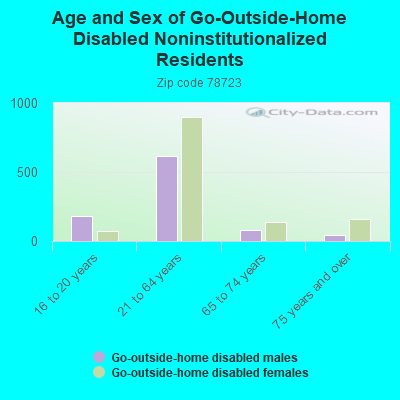
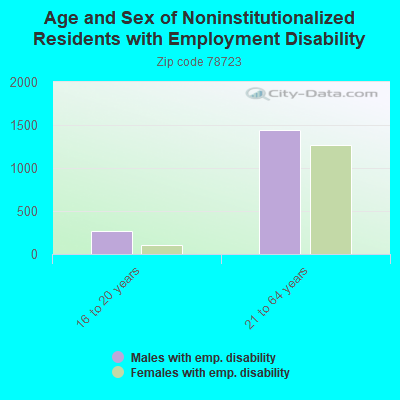
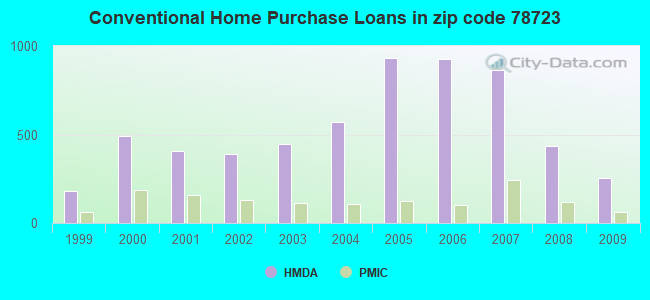
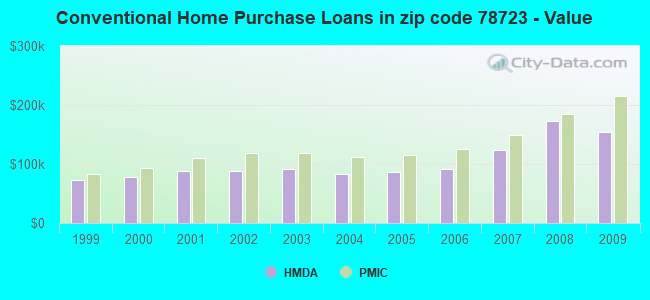
 Based on the data from the years 2002 - 2018 the average number of fire incidents per year is 95. The highest number of reported fires - 145 took place in 2009, and the least - 13 in 2017. The data has a dropping trend.
 When looking into fire subcategories, the most incidents belonged to: Outside Fires (45.5%), and Structure Fires (30.2%).