West End neighborhood in Austin, Texas (TX), 78701, 78703 detailed profile
Settings
X

Business Search - 14 Million verified businesses
Area: 0.110 square miles
Population: 1,700
Population density:
| West End: | 15,458 people per square mile |
| Austin: | 3,878 people per square mile |

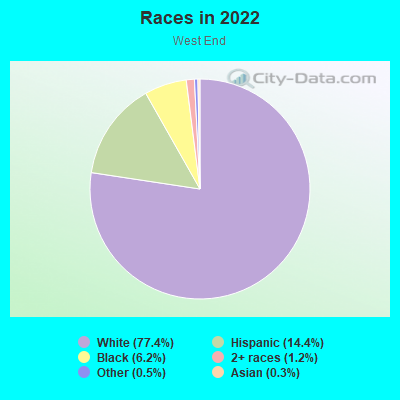
- 1,25970.6%White
- 1689.4%Hispanic or Latino
- 1639.1%Asian
- 1247.0%Two or more races
- 402.2%Black
- 181.0%Some other race
- 110.6%American Indian
Median household income in 2022:
| West End: | $92,374 |
| Austin: | $89,415 |
Distribution of median household income
![Distribution of median household income]()
- 11Less than $10,000
- 12$10,000 to $19,999
- 47$20,000 to $29,999
- 66$30,000 to $39,999
- 26$40,000 to $49,999
- 28$50,000 to $59,999
- 192$60,000 to $74,999
- 92$75,000 to $99,999
- 54$100,000 to $124,999
- 196$125,000 to $149,999
- 261$150,000 to $199,999
- 379$200,000 or more

Distribution of owner-occupied house/condo value
![Distribution of owner-occupied house/condo value]()
- 30Less than $50,000
- 9$50,000 to $99,999
- 6$150,000 to $199,999
- 12$200,000 to $249,999
- 5$250,000 to $299,999
- 20$300,000 to $399,999
- 11$400,000 to $499,999
- 69$500,000 to $749,999
- 211$750,000 to $999,999
- 255$1,000,000 or more

Distribution of rent paid by renters
![Distribution of rent paid by renters]()
- 59Less than $100
- 6$400 to $499
- 3$600 to $699
- 17$700 to $799
- 26$800 to $899
- 15$900 to $999
- 37$1,000 to $1,249
- 13$1,250 to $1,499
- 65$1,500 to $1,999
- 1,278$2,000 or more

Median rent in 2022:
| West End: | $2,299 |
| Austin: | $1,437 |
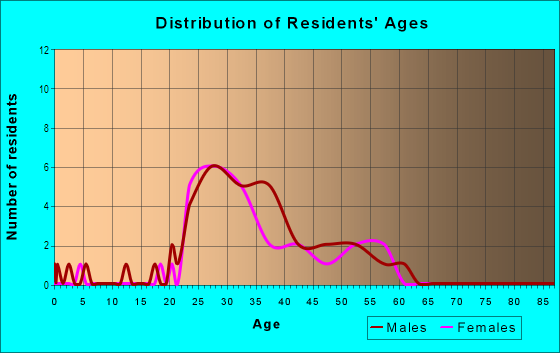
| Males: | 991 |
| Females: | 708 |
Males:
| This neighborhood: | 44.7 years |
| Whole city: | 34.5 years |
| This neighborhood: | 41.0 years |
| Whole city: | 34.4 years |
Average household size:
| West End: | 4.9 people |
| Austin: | 28.0 people |
Percentage of family households:
| West End: | 26.8% |
| Austin: | 36.6% |
| Here: | 29.3% |
| Austin: | 35.3% |
Percentage of married-couple families with children (among all households):
| West End: | 50.7% |
| Austin: | 36.3% |
Percentage of single-mother households (among all households):
| West End: | 22.5% |
| Austin: | 7.9% |
Percentage of never married males 15 years old and over:
Percentage of never married females 15 years old and over:
| West End: | 33.9% |
| Austin: | 25.0% |
Percentage of never married females 15 years old and over:
| West End: | 14.9% |
| city: | 19.9% |
Percentage of people that speak English not well or not at all:
| West End: | 0.0% |
| Austin: | 5.2% |
Percentage of people born in this state:
Percentage of people born in another U.S. state:
Percentage of native residents but born outside the U.S.:
Percentage of foreign born residents:
| Here: | 37.8% |
| Austin: | 48.2% |
Percentage of people born in another U.S. state:
| West End: | 51.3% |
| Austin: | 31.8% |
Percentage of native residents but born outside the U.S.:
| Here: | 3.0% |
| city: | 2.3% |
Percentage of foreign born residents:
| Here: | 7.9% |
| Austin: | 17.8% |
Owner-occupied
Renter-occupied

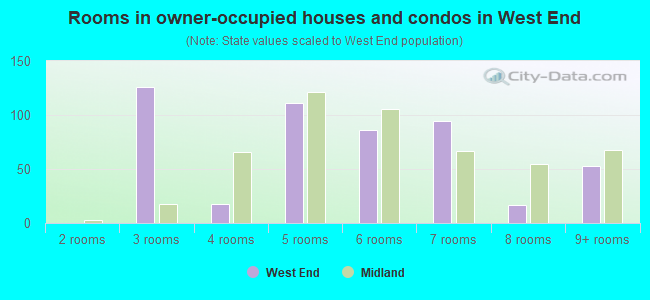
- Rooms in owner-occupied houses and condos in West End
- 161 room
- 222 rooms
- 2573 rooms
- 804 rooms
- 1485 rooms
- 296 rooms
- 127 rooms
- 138 rooms
- 789+ rooms
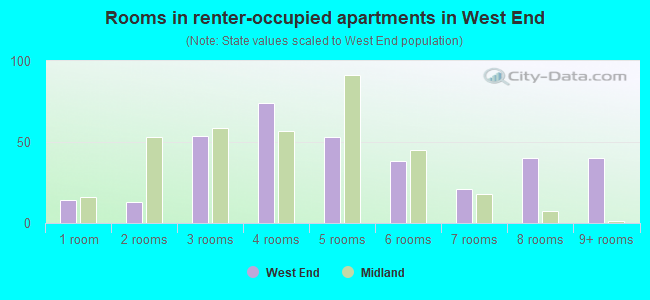
- Rooms in renter-occupied apartments in West End
- 851 room
- 2682 rooms
- 2363 rooms
- 264 rooms
- 695 rooms
- 536 rooms
- 27 rooms
- 08 rooms
- 49+ rooms
Owner-occupied
Renter-occupied
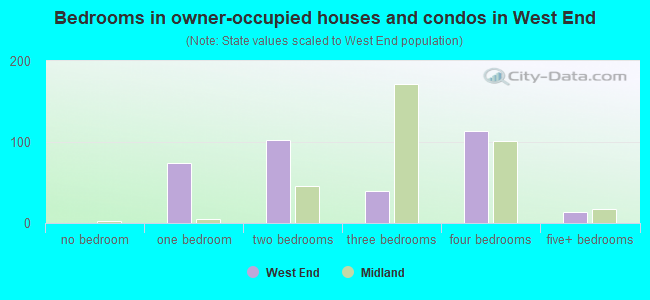
- Bedrooms in owner-occupied houses and condos in West End
- 16no bedroom
- 1901 bedroom
- 2912 bedrooms
- 223 bedrooms
- 154 bedrooms
- 485+ bedrooms
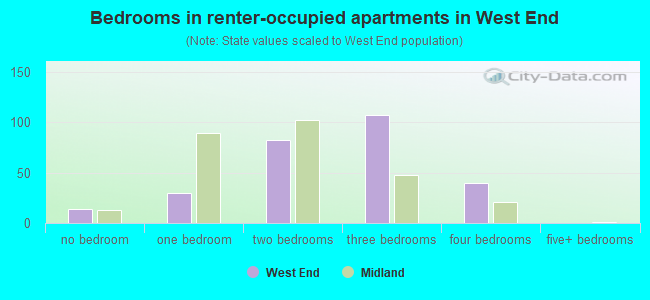
- Bedrooms in renter-occupied apartments in West End
- 39no bedroom
- 4351 bedroom
- 1682 bedrooms
- 143 bedrooms
- 404 bedrooms
- 45+ bedrooms
Average number of cars or other vehicles available in houses/condos:
Average number of cars or other vehicles available in apartments:
| This neighborhood: | 1.4 |
| Austin: | 1.9 |
Average number of cars or other vehicles available in apartments:
| Here: | 1.2 |
| city: | 1.3 |
Percentage of units with a mortgage:
| West End: | 53.1% |
| Austin: | 68.5% |
Average estimated '22 value of housing units in 5-or-more-unit structures (87.9% of all units):
| West End: | $940,377 |
| Austin: | $800,345 |
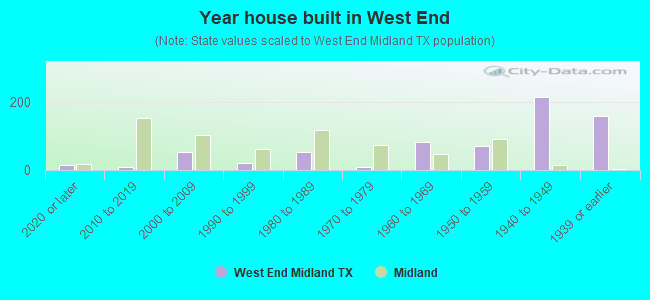
- Year house built in West End
- 22020 or later
- 1,3162010 to 2019
- 5722000 to 2009
- 711990 to 1999
- 651980 to 1989
- 371970 to 1979
- 61960 to 1969
- 101950 to 1959
- 471940 to 1949
- 711939 or earlier
City-data.com crime index for city in 2020 (higher means more crime):
| City: | 316.8 |
| U.S. average: | 219.5 |
Travel time to work (commute)
![Travel time to work (commute)]()
- 18Less than 5 minutes
- 675 to 9 minutes
- 10110 to 14 minutes
- 9815 to 19 minutes
- 5220 to 24 minutes
- 5525 to 29 minutes
- 6530 to 34 minutes
- 535 to 39 minutes
- 640 to 44 minutes
- 1545 to 59 minutes
- 4960 to 89 minutes

Means of transportation to work
![Means of transportation to work]()
- 39.2%514Drove a car alone
- 1.4%18Carpooled
- 2.1%27Bus
- 0.5%6Subway or elevated rail
- 2.3%30Taxi
- 0.5%6Motorcycle
- 14.9%195Bicycle
- 18.1%237Walked
- 0.1%1Other means
- 42.4%556Worked at home

Time leaving home to go to work
![Time leaving home to go to work]()
- 25:00 a.m. to 5:29 a.m.
- 85:30 a.m. to 5:59 a.m.
- 166:00 a.m. to 6:29 a.m.
- 266:30 a.m. to 6:59 a.m.
- 527:00 a.m. to 7:29 a.m.
- 567:30 a.m. to 7:59 a.m.
- 1228:00 a.m. to 8:29 a.m.
- 648:30 a.m. to 8:59 a.m.
- 1209:00 a.m. to 9:59 a.m.
- 2110:00 a.m. to 10:59 a.m.
- 211:00 a.m. to 11:59 a.m.
- 312:00 p.m. to 3:59 p.m.
- 84:00 p.m. to 11:59 p.m.

Occupations of males:
- Percentage of males in management occupations (except farmers):
Here: 39.0% city: 15.3%
- Percentage of males in business and financial operations occupations:
Here: 10.6% city: 7.0%
- Percentage of males in computer and mathematical occupations:
Here: 7.9% city: 12.0%
- Percentage of males in architecture and engineering occupations:
Here: 5.8% city: 5.1%
- Percentage of males in life, physical, and social science occupations:
Here: 1.4% city: 1.3%
- Percentage of males in community and social services occupations:
Here: 1.8% city: 1.0%
- Percentage of males in legal occupations:
Here: 9.1% city: 1.9%
- Percentage of males in education, training, and library occupations:
Here: 3.8% city: 4.1%
- Percentage of males in arts, design, entertainment, sports, and media occupations:
Here: 1.2% city: 4.1%
- Percentage of males in healthcare practitioners and technical occupations:
Here: 3.6% city: 2.3%
- Percentage of males in service occupations:
Here: 2.5% city: 11.2%
- Percentage of males in sales and office occupations:
Here: 9.4% city: 14.9%
- Percentage of males in production occupations:
Here: 3.9% city: 3.4%
Occupations of females:
- Percentage of females in management occupations (except farmers):
Here: 21.9% city: 13.5%
- Percentage of females in business and financial operations occupations:
Here: 9.0% city: 11.0%
- Percentage of females in computer and mathematical occupations:
Here: 7.7% city: 4.0%
- Percentage of females in architecture and engineering occupations:
Here: 2.0% city: 1.6%
- Percentage of females in life, physical, and social science occupations:
Here: 2.4% city: 1.7%
- Percentage of females in education, training, and library occupations:
Here: 3.2% city: 9.0%
- Percentage of females in arts, design, entertainment, sports, and media occupations:
Here: 9.7% city: 4.5%
- Percentage of females in healthcare practitioners and technical occupations:
Here: 14.0% city: 7.8%
- Percentage of females in service occupations:
Here: 5.7% city: 15.8%
- Percentage of females in sales and office occupations:
Here: 22.2% city: 22.9%
- Percentage of females in production occupations:
Here: 1.5% city: 1.5%
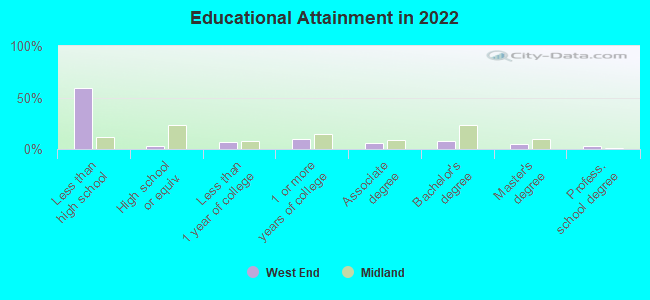
Education in this neighborhood (subdivision or community):
- Percentage of people 3 years and older in K-12 schools:
West End: 8.3% Austin: 12.4%
- Percentage of people 3 years and older in undergraduate colleges:
West End: 2.8% Austin: 6.1%
- Percentage of people 3 years and older in grad. or professional schools:
West End: 2.9% Austin: 2.5%
- Percentage of students K-12 enrolled in private schools:
West End: 76.8% Austin: 11.8%
Percentage of population below poverty level:
| West End: | 4.5% |
| Austin: | 11.1% |
Median year owner moved in (as recorded in 2022):
Median year renter moved in (as recorded in 2022):
| West End: | 2011 |
| Austin: | 2013 |
Median year renter moved in (as recorded in 2022):
| West End: | 2018 |
| Austin: | 2021 |
Percentage of married-couple families with both working:
| West End: | 164.5% |
| Austin: | 68.5% |
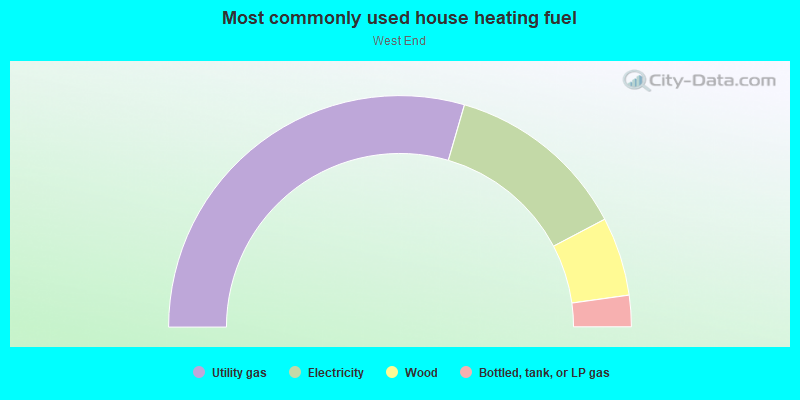
- 57.2%Electricity
- 33.4%Utility gas
- 3.4%Bottled, tank, or LP gas
- 2.3%No fuel used
- 2.2%Wood
- 1.1%Fuel oil, kerosene, etc.
- 0.5%Other fuel
Roads and streets:
N Lamar Blvd
Length: 0.51 miles
Direction: SW-NE
Address range: 500 to 1199
Direction: SW-NE
Address range: 500 to 1199
W 6th St
Length: 0.40 miles
Direction: E-W
Address range: 1000 to 1317
Direction: E-W
Address range: 1000 to 1317
Baylor St
Length: 0.07 miles
Direction: SW-NE
Address range: 500 to 599
Direction: SW-NE
Address range: 500 to 599
Winflo Dr
Length: 0.06 miles
Direction: SW-NE
Address range: 600 to 699
Direction: SW-NE
Address range: 600 to 699
W 10th St
Length: 0.05 miles
Direction: E-W
Address range: 900 to 999
Direction: E-W
Address range: 900 to 999
Sayers St
Length: 0.04 miles
Direction: E-W
Address range: 1146 to 1299
Direction: E-W
Address range: 1146 to 1299
W 5th St
Length: 0.02 miles
Direction: E-W
Address range: 990 to 1011
Direction: E-W
Address range: 990 to 1011