Estimated zip code population in 2022: 9,256 Zip code population in 2010: 8,762 Zip code population in 2000: 8,716
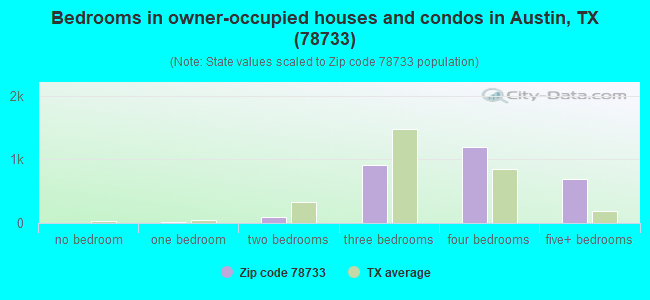
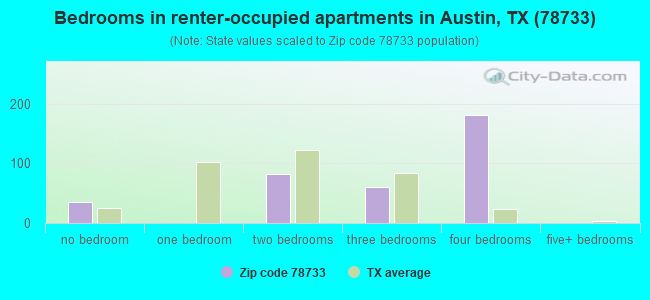
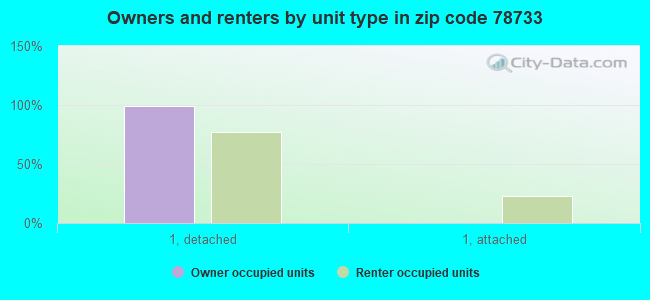
Houses and condos: 3,491 Renter-occupied apartments: 350
% of renters here:
11%
State:
38%
March 2022 cost of living index in zip code 78733: 99.5 (near average, U.S. average is 100)
Land area: 11.5 sq. mi. Water area: 0.3 sq. mi.
Population density: 808 people per square mile
(low).
OSM Map
General Map
Google Map
MSN Map
OSM Map
General Map
Google Map
MSN Map
OSM Map
General Map
Google Map
MSN Map
OSM Map
General Map
Google Map
MSN Map
Please wait while loading the map...
Real estate property taxes paid for housing units in 2022:
This zip code:
1.1% ($10,460)
Texas:
1.5% ($4,050)
Median real estate property taxes paid for housing units with mortgages in 2022: $10,505 (1.0%) Median real estate property taxes paid for housing units with no mortgage in 2022: $10,700 (1.1%)
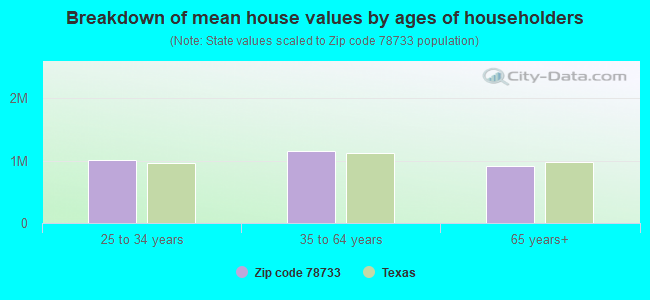
Estimated median house/condo value in 2022: $994,101
78733:
$994,101
Texas:
$275,400
According to our research of Texas and other state lists, there were 3 registered sex offenders living in 78733 zip code as of April 27, 2024. The ratio of all residents to sex offenders in zip code 78733 is 3,004 to 1. The ratio of registered sex offenders to all residents in this zip code is much lower than the state average.
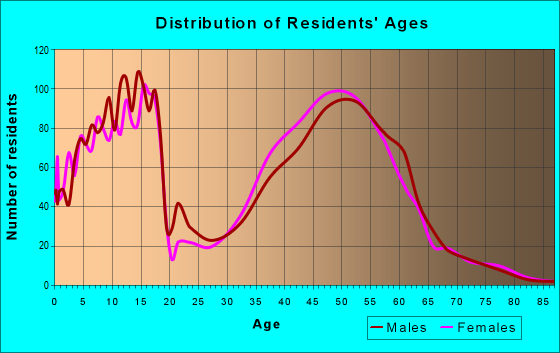
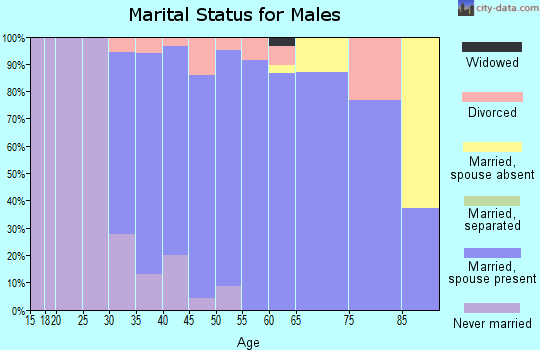
Median resident age:
This zip code:
43.8 years
Texas median age:
35.6 years
Average household size:
This zip code:
2.9 people
Texas:
2.6 people
Averages for the 2020 tax year for zip code 78733, filed in 2021:
Average Adjusted Gross Income (AGI) in 2020: $408,624 (Individual Income Tax Returns)
Here:
$408,624
State:
$77,054
Salary/wage: $261,664 (reported on 77.2% of returns)
Here:
$261,664
State:
$62,766
(% of AGI for various income ranges: 1120.6% for AGIs below $25k, 3644.4% for AGIs $25k-50k, 6356.7% for AGIs $50k-75k, 10468.5% for AGIs $75k-100k, 20682.4% for AGIs $100k-200k, 193844.4% for AGIs over 200k)
Taxable interest for individuals: $8,151 (reported on 58.5% of returns)
This zip code:
$8,151
Texas:
$2,665
(% of AGI for various income ranges: 45.9% for AGIs below $25k, 76.3% for AGIs $25k-50k, 188.3% for AGIs $50k-75k, 292.3% for AGIs $75k-100k, 405.3% for AGIs $100k-200k, 4596.1% for AGIs over 200k)
Ordinary dividends: $34,207 (reported on 52.8% of returns)
Here:
$34,207
State:
$10,044
(% of AGI for various income ranges: 103.9% for AGIs below $25k, 320.7% for AGIs $25k-50k, 422.2% for AGIs $50k-75k, 640.8% for AGIs $75k-100k, 1549.1% for AGIs $100k-200k, 17761.4% for AGIs over 200k)
Net capital gain/loss in AGI: +$213,340 (reported on 52.5% of returns)
Here:
+$213,340
State:
+$39,590
(% of AGI for various income ranges: 97.8% for AGIs below $25k, 148.5% for AGIs $25k-50k, 563.9% for AGIs $50k-75k, 899.2% for AGIs $75k-100k, 1859.1% for AGIs $100k-200k, 121841.7% for AGIs over 200k)
Profit/loss from business: +$37,459 (reported on 29.0% of returns)
Here:
+$37,459
State:
+$10,888
(% of AGI for various income ranges: 193.5% for AGIs below $25k, 683.0% for AGIs $25k-50k, 1048.3% for AGIs $50k-75k, 1465.4% for AGIs $75k-100k, 2518.2% for AGIs $100k-200k, 7863.1% for AGIs over 200k)
Taxable individual retirement arrangement distribution: $31,015 (reported on 10.2% of returns)
78733:
$31,015
Texas:
$24,740
(% of AGI for various income ranges: 54.1% for AGIs below $25k, 233.0% for AGIs $25k-50k, 343.9% for AGIs $50k-75k, 583.8% for AGIs $75k-100k, 977.9% for AGIs $100k-200k, 1977.5% for AGIs over 200k)
Self-employed (Keogh) retirement plans: $32,088 (reported on 4.2% of returns)
78733:
$32,088
Texas:
$29,298
(% of AGI for various income ranges: 176.8% for AGIs $100k-200k, 1348.3% for AGIs over 200k)
Total itemized deductions: $56,221 (reported on 28.7% of returns)
Here:
$56,221
State:
$40,428
(% of AGI for various income ranges: 150.0% for AGIs below $25k, 541.1% for AGIs $25k-50k, 711.1% for AGIs $50k-75k, 1403.1% for AGIs $75k-100k, 2080.6% for AGIs $100k-200k, 14522.2% for AGIs over 200k)
Charity contributions: $30,488 (reported on 24.5% of returns)
Here:
$30,488
State:
$18,201
(% of AGI for various income ranges: 51.1% for AGIs $25k-50k, 72.2% for AGIs $50k-75k, 231.5% for AGIs $75k-100k, 426.2% for AGIs $100k-200k, 7738.9% for AGIs over 200k)
Taxes paid: $9,350 (reported on 28.2% of returns)
78733:
$9,350
State:
$7,821
(% of AGI for various income ranges: 31.0% for AGIs below $25k, 129.6% for AGIs $25k-50k, 172.2% for AGIs $50k-75k, 369.2% for AGIs $75k-100k, 510.6% for AGIs $100k-200k, 2093.9% for AGIs over 200k)
Earned income credit: $1,483 (reported on 4.5% of returns)
Here:
$1,483
State:
$2,584
(% of AGI for various income ranges: 39.6% for AGIs below $25k, 27.0% for AGIs $25k-50k)
Percentage of individuals using paid preparers for their 2020 taxes: 90.5%
Here:
90%
State:
92%
(% for various income ranges: 88.2% for AGIs below $25k, 88.4% for AGIs $25k-50k, 93.3% for AGIs $50k-75k, 88.5% for AGIs $75k-100k, 92.0% for AGIs $100k-200k, 91.5% for AGIs over 200k)
Averages for the 2012 tax year for zip code 78733, filed in 2013:
Average Adjusted Gross Income (AGI) in 2012: $300,805 (Individual Income Tax Returns)
Here:
$300,805
State:
$65,384
Salary/wage: $142,761 (reported on 81.9% of returns)
Here:
$142,761
State:
$52,524
(% of AGI for various income ranges: 74.3% for AGIs below $25k, 69.9% for AGIs $25k-50k, 65.7% for AGIs $50k-75k, 66.8% for AGIs $75k-100k, 73.7% for AGIs $100k-200k, 32.6% for AGIs over 200k)
Taxable interest for individuals: $5,717 (reported on 56.3% of returns)
This zip code:
$5,717
Texas:
$2,372
(% of AGI for various income ranges: 1.8% for AGIs below $25k, 2.7% for AGIs $25k-50k, 1.3% for AGIs $50k-75k, 1.8% for AGIs $75k-100k, 0.8% for AGIs $100k-200k, 1.1% for AGIs over 200k)
Ordinary dividends: $22,407 (reported on 47.8% of returns)
Here:
$22,407
State:
$9,721
(% of AGI for various income ranges: 6.0% for AGIs below $25k, 4.9% for AGIs $25k-50k, 4.0% for AGIs $50k-75k, 4.2% for AGIs $75k-100k, 3.2% for AGIs $100k-200k, 3.5% for AGIs over 200k)
Net capital gain/loss in AGI: +$103,370 (reported on 44.2% of returns)
Here:
+$103,370
State:
+$35,319
(% of AGI for various income ranges: 0.6% for AGIs below $25k, 0.6% for AGIs $25k-50k, 0.8% for AGIs $50k-75k, 0.4% for AGIs $75k-100k, 2.1% for AGIs $100k-200k, 17.8% for AGIs over 200k)
Profit/loss from business: +$40,657 (reported on 27.9% of returns)
Here:
+$40,657
State:
+$13,732
(% of AGI for various income ranges: 15.8% for AGIs below $25k, 11.2% for AGIs $25k-50k, 10.2% for AGIs $50k-75k, 8.4% for AGIs $75k-100k, 6.4% for AGIs $100k-200k, 2.9% for AGIs over 200k)
Taxable individual retirement arrangement distribution: $45,734 (reported on 9.8% of returns)
78733:
$45,734
Texas:
$19,511
(% of AGI for various income ranges: 2.9% for AGIs below $25k, 1.8% for AGIs $25k-50k, 3.6% for AGIs $50k-75k, 4.2% for AGIs $75k-100k, 3.6% for AGIs $100k-200k, 1.1% for AGIs over 200k)
Self-employment retirement plans: $27,027 (reported on 3.9% of returns)
78733:
$27,027
Texas:
$23,938
(% of AGI for various income ranges: 1.7% for AGIs below $25k, 0.7% for AGIs $100k-200k, 0.3% for AGIs over 200k)
Total itemized deductions: $48,740 (10% of AGI, reported on 56.8% of returns)
Here:
$48,740
State:
$24,724
Here:
9.8% of AGI
State:
15.9% of AGI
(% of AGI for various income ranges: 21.1% for AGIs below $25k, 18.1% for AGIs $25k-50k, 20.0% for AGIs $50k-75k, 17.6% for AGIs $75k-100k, 16.2% for AGIs $100k-200k, 7.7% for AGIs over 200k)
Charity contributions: $11,543 (reported on 48.3% of returns)
Here:
$11,543
State:
$6,808
(% of AGI for various income ranges: 1.0% for AGIs below $25k, 1.5% for AGIs $25k-50k, 1.8% for AGIs $50k-75k, 1.3% for AGIs $75k-100k, 1.8% for AGIs $100k-200k, 1.9% for AGIs over 200k)
Taxes paid: $15,911 (reported on 56.3% of returns)
78733:
$15,911
State:
$6,921
(% of AGI for various income ranges: 6.8% for AGIs below $25k, 5.4% for AGIs $25k-50k, 6.5% for AGIs $50k-75k, 6.5% for AGIs $75k-100k, 6.6% for AGIs $100k-200k, 2.3% for AGIs over 200k)
Earned income credit: $1,516 (reported on 6.5% of returns)
Here:
$1,516
State:
$2,570
(% of AGI for various income ranges: 2.7% for AGIs below $25k, 0.6% for AGIs $25k-50k)
Percentage of individuals using paid preparers for their 2012 taxes: 48.6%
Here:
49%
State:
51%
(% for various income ranges: 35.6% for AGIs below $25k, 41.3% for AGIs $25k-50k, 50.0% for AGIs $50k-75k, 44.0% for AGIs $75k-100k, 50.6% for AGIs $100k-200k, 65.3% for AGIs over 200k)
Averages for the 2004 tax year for zip code 78733, filed in 2005:
Average Adjusted Gross Income (AGI) in 2004: $168,606 (Individual Income Tax Returns)
Here:
$168,606
State:
$47,881
Salary/wage: $114,455 (reported on 81.0% of returns)
Here:
$114,455
State:
$41,947
(% of AGI for various income ranges: 69.6% for AGIs $10k-25k, 76.9% for AGIs $25k-50k, 72.4% for AGIs $50k-75k, 75.9% for AGIs $75k-100k, 51.9% for AGIs over 100k)
Taxable interest for individuals: $4,657 (reported on 64.3% of returns)
This zip code:
$4,657
Texas:
$2,255
(% of AGI for various income ranges: 2.2% for AGIs $10k-25k, 2.5% for AGIs $25k-50k, 1.8% for AGIs $50k-75k, 2.2% for AGIs $75k-100k, 1.7% for AGIs over 100k)
Taxable dividends: $8,383 (reported on 49.4% of returns)
Here:
$8,383
State:
$4,261
(% of AGI for various income ranges: 3.2% for AGIs $10k-25k, 1.7% for AGIs $25k-50k, 1.7% for AGIs $50k-75k, 2.6% for AGIs $75k-100k, 2.4% for AGIs over 100k)
Net capital gain/loss: +$86,052 (reported on 48.0% of returns)
Here:
+$86,052
State:
+$16,110
(% of AGI for various income ranges: 2.0% for AGIs $10k-25k, 0.9% for AGIs $25k-50k, 5.3% for AGIs $50k-75k, 3.5% for AGIs $75k-100k, 27.3% for AGIs over 100k)
Profit/loss from business: +$23,019 (reported on 26.4% of returns)
Here:
+$23,019
State:
+$11,013
(% of AGI for various income ranges: 17.7% for AGIs $10k-25k, 11.4% for AGIs $25k-50k, 7.8% for AGIs $50k-75k, 7.5% for AGIs $75k-100k, 2.8% for AGIs over 100k)
IRA payment deduction: $3,569 (reported on 3.9% of returns)
78733:
$3,569
Texas:
$3,120
(% of AGI for various income ranges: 0.6% for AGIs $25k-50k, 0.3% for AGIs $50k-75k, 0.4% for AGIs $75k-100k, 0.0% for AGIs over 100k)
Self-employed pension: $18,338 (reported on 4.2% of returns)
Here:
$18,338
Texas:
$16,401
(% of AGI for various income ranges: 0.4% for AGIs $50k-75k, 0.4% for AGIs $75k-100k, 0.5% for AGIs over 100k)
Total itemized deductions: $33,434 (13% of AGI, reported on 55.7% of returns)
Here:
$33,434
State:
$19,631
Here:
13.3% of AGI
State:
18.9% of AGI
(% of AGI for various income ranges: 20.5% for AGIs $10k-25k, 20.3% for AGIs $25k-50k, 23.2% for AGIs $50k-75k, 20.2% for AGIs $75k-100k, 9.6% for AGIs over 100k)
Charity contributions deductions: $5,419 (2% of AGI, reported on 48.5% of returns)
Here:
$5,419
State:
$4,753
Here:
2.1% of AGI
State:
4.2% of AGI
(% of AGI for various income ranges: 1.2% for AGIs $10k-25k, 2.0% for AGIs $25k-50k, 2.0% for AGIs $50k-75k, 1.7% for AGIs $75k-100k, 1.5% for AGIs over 100k)
Total tax: $41,523 (reported on 81.2% of returns)
78733:
$41,523
State:
$9,058
(% of AGI for various income ranges: 6.7% for AGIs $10k-25k, 8.4% for AGIs $25k-50k, 9.0% for AGIs $50k-75k, 10.7% for AGIs $75k-100k, 21.4% for AGIs over 100k)
Earned income credit: $1,488 (reported on 5.3% of returns)
Here:
$1,488
State:
$2,024
Percentage of individuals using paid preparers for their 2004 taxes: 48.1%
Here:
48%
State:
57%
(% for various income ranges: 39.3% for AGIs below $10k, 41.6% for AGIs $10k-25k, 42.7% for AGIs $25k-50k, 47.9% for AGIs $50k-75k, 52.1% for AGIs $75k-100k, 56.1% for AGIs over 100k)
Likely homosexual households (counted as self-reported same-sex unmarried-partner households)
Lesbian couples: 0.0% of all households
Gay men: 0.3% of all households
Household received Food Stamps/SNAP in the past 12 months: 38 Household did not receive Food Stamps/SNAP in the past 12 months: 3,188
Women who had a birth in the past 12 months: 2 (2 now married, 0 unmarried) Women who did not have a birth in the past 12 months: 1,848 (1,279 now married, 554 unmarried)
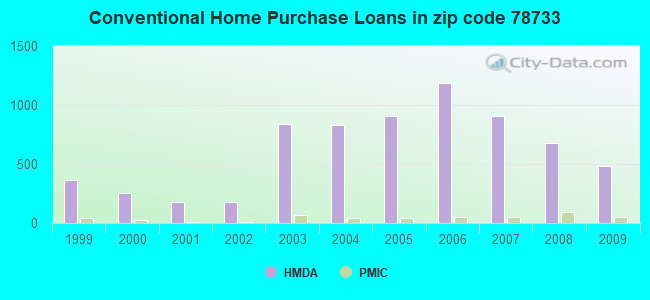
Housing units in zip code 78733 with a mortgage: 1,909 (380 second mortgage, 371 both second mortgage and home equity loan) Houses without a mortgage: 32
Median monthly owner costs for units with a mortgage: $3,652 Median monthly owner costs for units without a mortgage: $1,533
Residents with income below the poverty level in 2022:
This zip code:
1.8%
Whole state:
14.0%
Residents with income below 50% of the poverty level in 2022:
This zip code:
1.2%
Whole state:
7.4%
Median number of rooms in houses and condos:
Here:
8.1
State:
6.3
Median number of rooms in apartments:
Here:
5.6
State:
4.0
Notable locations in this zip code not listed on our city pages
Churches in zip code 78733 include: Saint James Park Church (A), The Church of Jesus Christ of Latter Day Saints (B), All Saints Presbyterian Church (C). Display/hide their locations on the map
Size of family households: 1,068 2-persons, 618 3-persons, 753 4-persons, 245 5-persons, 155 6-persons, 6 7-or-more-persons
Size of nonfamily households: 282 1-person, 78 2-persons
2,433 married couples with children.
351 single-parent households (17 men, 334 women).
78.5% of residents of 78733 zip code speak English at home.
7.5% of residents speak Spanish at home (100% very well).
6.3% of residents speak other Indo-European language at home (82% very well, 18% well).
7.6% of residents speak Asian or Pacific Island language at home (82% very well, 7% well, 6% not well, 5% not at all).
0.6% of residents speak other language at home (100% very well).
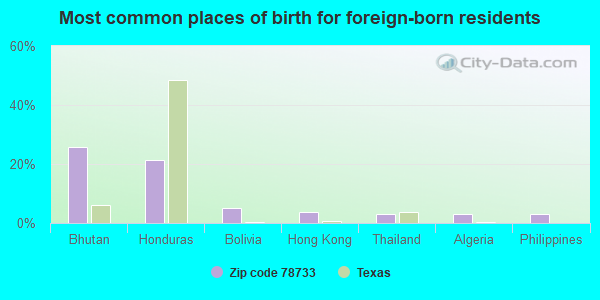
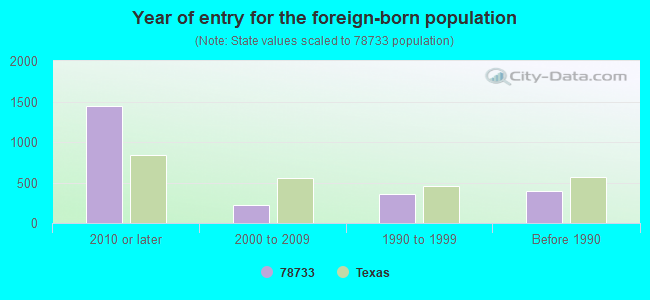
Foreign born population: 1,766 (19.1%) (60.8% of them are naturalized citizens)
Facilities with environmental interests located in this zip code:
BARTON CREEK EL (1370 PATTERSON RD in AUSTIN, TX)
(National Center for Education Statistics) - STATE ID-227909105 Organizations: EANES ISD (SCHOOL DISTRICT)
ADVANCED STAINLESS TECHNOLOGIES (225 S COMMONS FORD RD in AUSTIN, TX)
(Resource Conservation and Recovery Act (tracking hazardous waste)) Business NAICS classification: OTHER METAL VALVE AND PIPE FITTING MANUFACTURING. Organizations: ADVANCED STAINLESS TECHNOLOGIES INC (CONTACT/OPERATOR)
Housing units lacking complete kitchen facilities: 2.4%
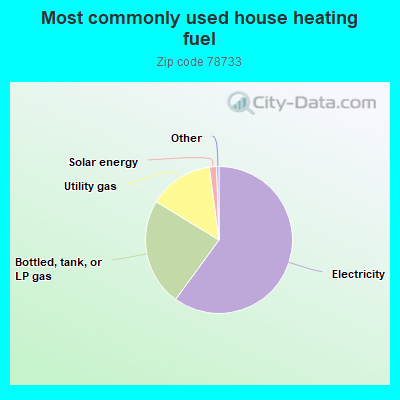
60.1%Electricity
23.7%Bottled, tank, or LP gas
14.2%Utility gas
1.6%Solar energy
Population in 1990: 4,083. Population change in the 1990s: +4,633 (+113.5%).
Place of birth for U.S.-born residents:
This state: 4,017
Northeast: 590
Midwest: 753
South: 787
West: 885
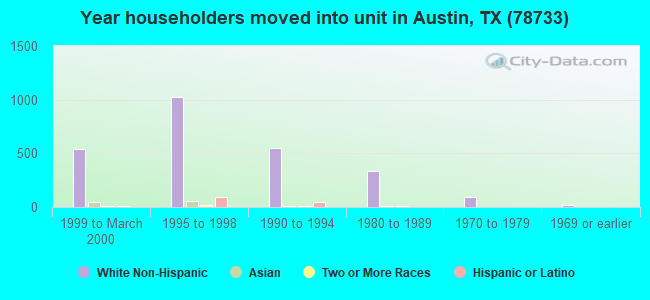
40% of the 78733 zip code residents lived in the same house 5 years ago. Out of people who lived in different houses, 46% lived in this county. Out of people who lived in different counties, 50% lived in Texas.
94% of the 78733 zip code residents lived in the same house 1 year ago. Out of people who lived in different houses, 55% moved from this county. Out of people who lived in different houses, 9% moved from different county within same state. Out of people who lived in different houses, 31% moved from different state. Out of people who lived in different houses, 10% moved from abroad.
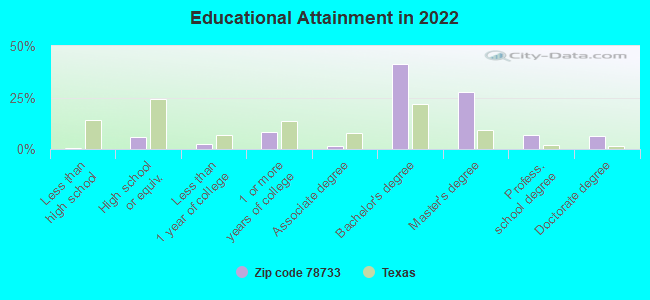
Private vs. public school enrollment:
Students in private schools in grades 1 to 8 (elementary and middle school): 169
Here:
10.1%
Texas:
8.8%
Students in private schools in grades 9 to 12 (high school): 111
Here:
12.1%
Texas:
8.0%
Students in private undergraduate colleges: 23
Here:
21.9%
Texas:
16.2%
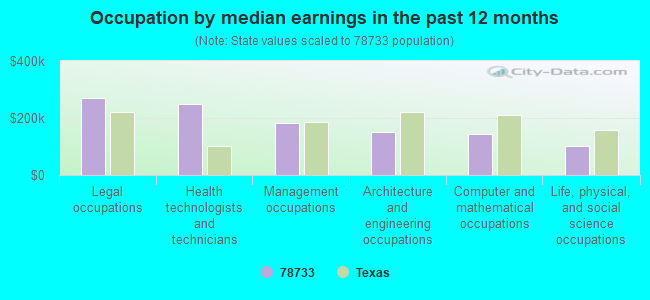
Occupation by median earnings in the past 12 months ($)
269,524Legal occupations
247,643Health technologists and technicians
183,917Management occupations
151,395Architecture and engineering occupations
145,018Computer and mathematical occupations
100,067Life, physical, and social science occupations
Companies with federal contracts located in this zip code (AUSTIN, TX):
TEXAS RESEARCH INST AUSTIN (9063 BEE CAVES RD) : $33,930,360 in 206 contractsfrom 1999 to 2006
Contracts for Technology Sharing/Utilization Services, Other Defense -- Applied Research and Exploratory Development (R&D), Defense Aircraft -- Management and Support (R&D), Other Research and Development -- Applied Research and Exploratory Development (R&D), and moreby Defense Logistics Agency, Department of Defense, Navy, Air Force, and others Signed by year:2000: $4,924,247; 2001: $4,412,105; 2002: $4,614,626; 2003: $5,363,313; 2004: $4,324,121; 2005: $5,843,246; 2006: $3,272,556.
Biggest contracts:
$1,253,405 with Defense Logistics Agency for Technology Sharing/Utilization Services. Signed on 2000-11-03. Completion date: 2002-11-02.
$783,655 with Department of Defense for Technology Sharing/Utilization Services. Signed on 2003-09-29. Completion date: 2004-09-28.
$779,541 with Navy for Other Defense -- Applied Research and Exploratory Development (R&D). Signed on 2005-07-26. Completion date: 2006-07-26.
$740,029 with Air Force for Defense Aircraft -- Management and Support (R&D). Signed on 2002-09-26. Completion date: 2005-01-31.
SHEILA BECKETT (9607 SOUTHWARD COVE; small business) : $574,099 in 6 contractsfrom 2004 to 2006
Contracts for Personal Services Contracts by Departmental Offices Signed by year:2000: $0; 2001: $0; 2002: $0; 2003: $0; 2004: $181,037; 2005: $190,202; 2006: $202,860.
Biggest contracts:
$202,860 with Departmental Offices for Personal Services Contracts. Taking place in DC. Signed on 2006-05-23. Effective on 2006-06-01. Completion date: 2007-05-31.
$181,037, same as above.Signed on 2004-03-30. Completion date: 2005-05-31.
$136,284, same as above.Signed on 2005-08-09. Completion date: 2006-05-31.
$51,551, same as above.Signed on 2005-05-26. Effective on 2005-06-01. Completion date: 2006-05-31.
TRI AIRTESTING INC (9063 BEE CAVES RD; small business) : $288,381 in 35 contractsfrom 2004 to 2006
Contracts for Gases: Compressed and Liquefied, Equipment and Materials Testing -- Clothing, Individual Equipment, and Insignia, Hazard-Detecting Instruments and Apparatus, Maintenance, Repair and Rebuilding of Equipment -- Instruments and Laboratory Equipment, and moreby Navy, Army Signed by year:2000: $0; 2001: $0; 2002: $0; 2003: $0; 2004: $89,251; 2005: $94,617; 2006: $104,513.
Biggest contracts:
$49,162 with Navy for Gases: Compressed and Liquefied. Signed on 2006-06-28. Completion date: 2006-09-30.
$29,580 with Navy for Gases: Compressed and Liquefied. Taking place in FL. Signed on 2004-05-27. Completion date: 2004-09-30.
$24,655 with Navy for Gases: Compressed and Liquefied. Signed on 2004-10-26. Completion date: 2004-12-31.
$22,360, same as above.Signed on 2005-08-04. Completion date: 2005-09-30.
TEXAS RESEARCH INTL INC (9063 BEE CAVES RD; small business) : $150,076 in 4 contractsfrom 2000 to 2003
$48,280 with Navy for Air Quality Analyses. Signed on 2002-11-14. Completion date: 2003-03-31.
$35,075, same as above.Signed on 2003-04-02. Completion date: 2003-06-30.
$34,648, same as above.Signed on 2002-04-11. Completion date: 2002-07-31.
$32,073, same as above.Signed on 2000-06-05. Completion date: 2000-09-30.
TRI ENVIRONMENTAL INC (9063 BEE CAVES RD; small business) : $41,751 in 17 contractsfrom 2002 to 2004
Contracts for Air Quality Analyses, Safety and Rescue Equipment, Maintenance, Repair and Rebuilding of Equipment -- Miscellaneous, Other Quality Control, Testing and Inspection Services -- Miscellaneous, and moreby Navy, Army, Bureau of Reclamation Signed by year:2000: $0; 2001: $0; 2002: $662; 2003: $41,681; 2004: -$592; 2005: $0; 2006: $0.
Biggest contracts:
$25,000 with Navy for Air Quality Analyses. Signed on 2003-11-19. Completion date: 2004-02-18.
$12,500, same as above.Signed on 2004-03-03. Completion date: 2004-03-31.
$7,662, same as above.Signed on 2003-10-22. Completion date: 2003-11-17.
$6,024 with Navy for Safety and Rescue Equipment. Signed on 2003-10-23. Completion date: 2003-10-27.
HOLY TRANSFIGURATION GREEK ORT (2800 DE SOTO DR) : $1,500 in 4 contractsfrom 2003 to 2006
$2,700 with Army for Other Management Support Services. Signed on 2004-03-16. Completion date: 2004-09-30.
$300, same as above.Signed on 2003-08-15. Completion date: 2003-09-30.
$0, same as above.Signed on 2006-02-24. Completion date: 2004-09-30.
-$1,500, same as above.Signed on 2006-02-24. Completion date: 2004-09-30.
Top industries in this zip code by the number of employees in 2005:
Health Care and Social Assistance: Residential Mental Retardation Facilities (500-999 employees: 1 establishment)
Professional, Scientific, and Technical Services: Research and Development in the Physical, Engineering, and Life Sciences (100-249: 1, 20-49: 2, 1-4: 1)
2002 - 2018 National Fire Incident Reporting System (NFIRS) incidents
Based on the data from the years 2002 - 2018 the average number of fire incidents per year is 20. The highest number of fires - 49 took place in 2007, and the least - 0 in 2004. The data has a growing trend.
When looking into fire subcategories, the most incidents belonged to: Structure Fires (47.2%), and Outside Fires (38.9%).
Fire incident types reported to NFIRS in Zip Code 78733
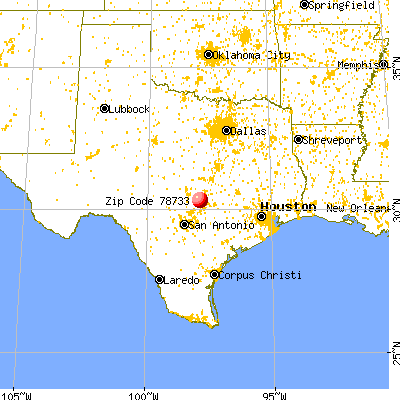


 Nearest zip codes: 78735, 78732, 78730, 78738, 78746, 78734.
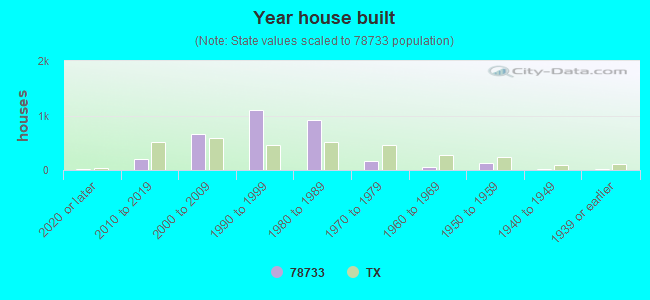


 Based on the data from the years 2002 - 2018 the average number of fire incidents per year is 20. The highest number of fires - 49 took place in 2007, and the least - 0 in 2004. The data has a growing trend.
 When looking into fire subcategories, the most incidents belonged to: Structure Fires (47.2%), and Outside Fires (38.9%).