Estimated zip code population in 2022: 22,268 Zip code population in 2010: 17,655 Zip code population in 2000: 12,925
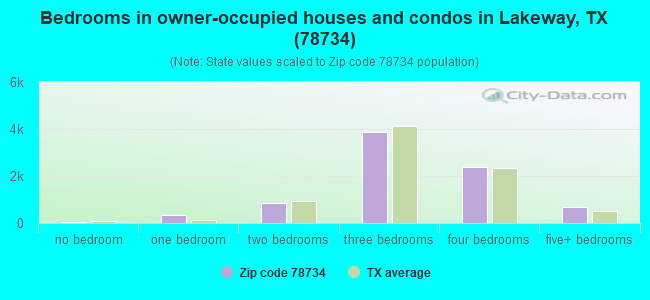
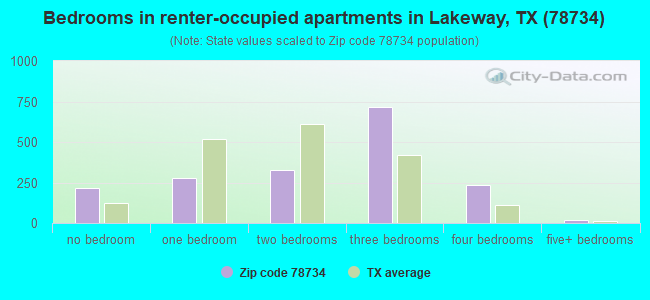
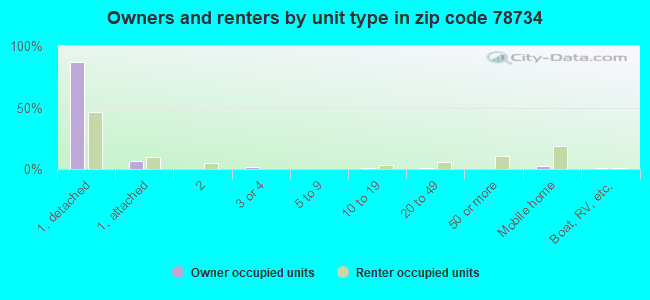
Houses and condos: 10,839 Renter-occupied apartments: 1,773
% of renters here:
18%
State:
38%
March 2022 cost of living index in zip code 78734: 96.0 (near average, U.S. average is 100)
Land area: 20.0 sq. mi. Water area: 4.3 sq. mi.
Population density: 1,111 people per square mile
(low).
OSM Map
General Map
Google Map
MSN Map
OSM Map
General Map
Google Map
MSN Map
OSM Map
General Map
Google Map
MSN Map
OSM Map
General Map
Google Map
MSN Map
Please wait while loading the map...
Real estate property taxes paid for housing units in 2022:
This zip code:
1.2% ($7,813)
Texas:
1.5% ($4,050)
Median real estate property taxes paid for housing units with mortgages in 2022: $7,811 (1.3%) Median real estate property taxes paid for housing units with no mortgage in 2022: $8,071 (1.1%)
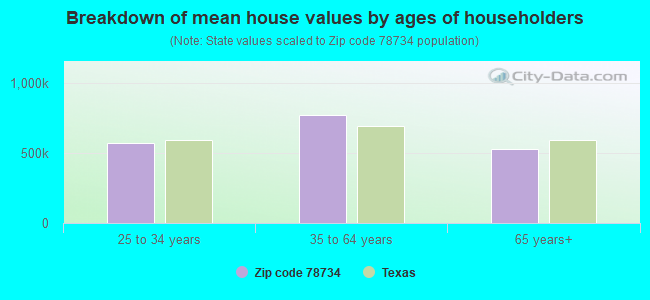
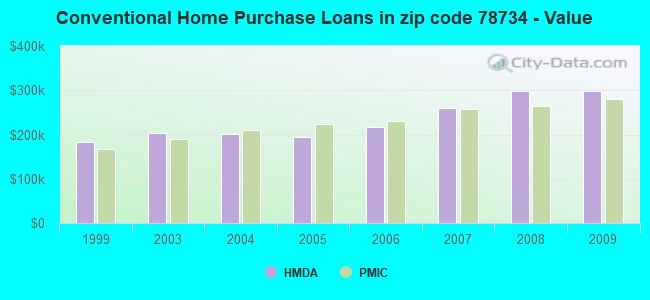
Estimated median house/condo value in 2022: $660,844
78734:
$660,844
Texas:
$275,400
According to our research of Texas and other state lists, there were 14 registered sex offenders living in 78734 zip code as of April 26, 2024. The ratio of all residents to sex offenders in zip code 78734 is 1,376 to 1. The ratio of registered sex offenders to all residents in this zip code is much lower than the state average.
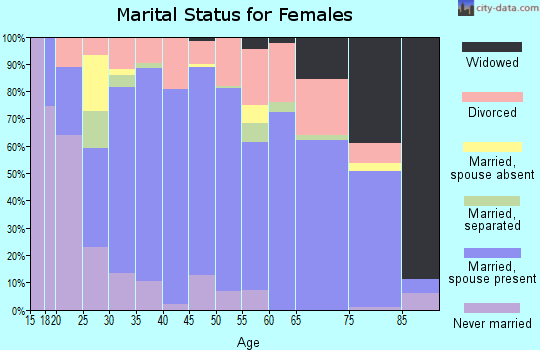
Median resident age:
This zip code:
50.7 years
Texas median age:
35.6 years
Average household size:
This zip code:
2.2 people
Texas:
2.6 people
Averages for the 2020 tax year for zip code 78734, filed in 2021:
Average Adjusted Gross Income (AGI) in 2020: $170,126 (Individual Income Tax Returns)
Here:
$170,126
State:
$77,054
Salary/wage: $117,897 (reported on 72.2% of returns)
Here:
$117,897
State:
$62,766
(% of AGI for various income ranges: 1154.9% for AGIs below $25k, 3680.5% for AGIs $25k-50k, 6440.5% for AGIs $50k-75k, 8910.6% for AGIs $75k-100k, 18452.8% for AGIs $100k-200k, 101674.4% for AGIs over 200k)
Taxable interest for individuals: $5,122 (reported on 46.8% of returns)
This zip code:
$5,122
Texas:
$2,665
(% of AGI for various income ranges: 44.7% for AGIs below $25k, 74.0% for AGIs $25k-50k, 126.8% for AGIs $50k-75k, 288.1% for AGIs $75k-100k, 315.9% for AGIs $100k-200k, 3308.6% for AGIs over 200k)
Ordinary dividends: $16,438 (reported on 40.1% of returns)
Here:
$16,438
State:
$10,044
(% of AGI for various income ranges: 112.1% for AGIs below $25k, 187.3% for AGIs $25k-50k, 333.3% for AGIs $50k-75k, 613.8% for AGIs $75k-100k, 1071.6% for AGIs $100k-200k, 8937.8% for AGIs over 200k)
Net capital gain/loss in AGI: +$76,211 (reported on 40.7% of returns)
Here:
+$76,211
State:
+$39,590
(% of AGI for various income ranges: 31.1% for AGIs below $25k, 112.5% for AGIs $25k-50k, 265.5% for AGIs $50k-75k, 658.7% for AGIs $75k-100k, 1357.5% for AGIs $100k-200k, 55582.4% for AGIs over 200k)
Profit/loss from business: +$29,172 (reported on 25.6% of returns)
Here:
+$29,172
State:
+$10,888
(% of AGI for various income ranges: 281.6% for AGIs below $25k, 448.1% for AGIs $25k-50k, 815.2% for AGIs $50k-75k, 846.8% for AGIs $75k-100k, 1403.9% for AGIs $100k-200k, 8267.3% for AGIs over 200k)
Taxable individual retirement arrangement distribution: $41,425 (reported on 14.6% of returns)
78734:
$41,425
Texas:
$24,740
(% of AGI for various income ranges: 108.0% for AGIs below $25k, 203.9% for AGIs $25k-50k, 509.9% for AGIs $50k-75k, 825.7% for AGIs $75k-100k, 1829.1% for AGIs $100k-200k, 6009.0% for AGIs over 200k)
Self-employed (Keogh) retirement plans: $27,517 (reported on 1.6% of returns)
78734:
$27,517
Texas:
$29,298
(% of AGI for various income ranges: 32.2% for AGIs $50k-75k, 82.6% for AGIs $100k-200k, 640.0% for AGIs over 200k)
Total itemized deductions: $39,743 (reported on 21.0% of returns)
Here:
$39,743
State:
$40,428
(% of AGI for various income ranges: 170.8% for AGIs below $25k, 361.8% for AGIs $25k-50k, 623.8% for AGIs $50k-75k, 1260.2% for AGIs $75k-100k, 1746.4% for AGIs $100k-200k, 9621.5% for AGIs over 200k)
Charity contributions: $14,415 (reported on 17.3% of returns)
Here:
$14,415
State:
$18,201
(% of AGI for various income ranges: 14.2% for AGIs below $25k, 37.8% for AGIs $25k-50k, 79.6% for AGIs $50k-75k, 195.8% for AGIs $75k-100k, 342.4% for AGIs $100k-200k, 3744.4% for AGIs over 200k)
Taxes paid: $8,600 (reported on 20.9% of returns)
78734:
$8,600
State:
$7,821
(% of AGI for various income ranges: 40.7% for AGIs below $25k, 90.7% for AGIs $25k-50k, 148.2% for AGIs $50k-75k, 282.6% for AGIs $75k-100k, 473.2% for AGIs $100k-200k, 1810.5% for AGIs over 200k)
Earned income credit: $1,759 (reported on 6.9% of returns)
Here:
$1,759
State:
$2,584
(% of AGI for various income ranges: 60.0% for AGIs below $25k, 38.5% for AGIs $25k-50k)
Percentage of individuals using paid preparers for their 2020 taxes: 89.9%
Here:
90%
State:
92%
(% for various income ranges: 87.4% for AGIs below $25k, 89.5% for AGIs $25k-50k, 90.5% for AGIs $50k-75k, 89.7% for AGIs $75k-100k, 90.1% for AGIs $100k-200k, 92.6% for AGIs over 200k)
Averages for the 2012 tax year for zip code 78734, filed in 2013:
Average Adjusted Gross Income (AGI) in 2012: $139,621 (Individual Income Tax Returns)
Here:
$139,621
State:
$65,384
Salary/wage: $100,372 (reported on 75.3% of returns)
Here:
$100,372
State:
$52,524
(% of AGI for various income ranges: 65.1% for AGIs below $25k, 69.2% for AGIs $25k-50k, 66.3% for AGIs $50k-75k, 62.6% for AGIs $75k-100k, 67.0% for AGIs $100k-200k, 46.4% for AGIs over 200k)
Taxable interest for individuals: $4,773 (reported on 47.4% of returns)
This zip code:
$4,773
Texas:
$2,372
(% of AGI for various income ranges: 2.2% for AGIs below $25k, 1.6% for AGIs $25k-50k, 1.2% for AGIs $50k-75k, 1.3% for AGIs $75k-100k, 1.2% for AGIs $100k-200k, 1.8% for AGIs over 200k)
Ordinary dividends: $14,941 (reported on 35.9% of returns)
Here:
$14,941
State:
$9,721
(% of AGI for various income ranges: 5.9% for AGIs below $25k, 3.7% for AGIs $25k-50k, 2.6% for AGIs $50k-75k, 2.6% for AGIs $75k-100k, 2.8% for AGIs $100k-200k, 4.3% for AGIs over 200k)
Net capital gain/loss in AGI: +$54,037 (reported on 34.9% of returns)
Here:
+$54,037
State:
+$35,319
(% of AGI for various income ranges: 0.3% for AGIs below $25k, 0.4% for AGIs $25k-50k, 2.2% for AGIs $50k-75k, 2.2% for AGIs $75k-100k, 2.4% for AGIs $100k-200k, 20.7% for AGIs over 200k)
Profit/loss from business: +$26,670 (reported on 27.6% of returns)
Here:
+$26,670
State:
+$13,732
(% of AGI for various income ranges: 17.6% for AGIs below $25k, 9.9% for AGIs $25k-50k, 9.1% for AGIs $50k-75k, 6.1% for AGIs $75k-100k, 6.3% for AGIs $100k-200k, 3.7% for AGIs over 200k)
Taxable individual retirement arrangement distribution: $36,179 (reported on 14.6% of returns)
78734:
$36,179
Texas:
$19,511
(% of AGI for various income ranges: 4.3% for AGIs below $25k, 3.2% for AGIs $25k-50k, 4.3% for AGIs $50k-75k, 6.0% for AGIs $75k-100k, 5.3% for AGIs $100k-200k, 3.0% for AGIs over 200k)
Self-employment retirement plans: $22,075 (reported on 2.1% of returns)
78734:
$22,075
Texas:
$23,938
(% of AGI for various income ranges: 0.7% for AGIs $50k-75k, 0.4% for AGIs $100k-200k, 0.3% for AGIs over 200k)
Total itemized deductions: $33,514 (14% of AGI, reported on 50.0% of returns)
Here:
$33,514
State:
$24,724
Here:
14.4% of AGI
State:
15.9% of AGI
(% of AGI for various income ranges: 22.4% for AGIs below $25k, 18.3% for AGIs $25k-50k, 17.9% for AGIs $50k-75k, 15.9% for AGIs $75k-100k, 15.8% for AGIs $100k-200k, 9.0% for AGIs over 200k)
Charity contributions: $6,100 (reported on 41.2% of returns)
Here:
$6,100
State:
$6,808
(% of AGI for various income ranges: 1.1% for AGIs below $25k, 1.5% for AGIs $25k-50k, 1.7% for AGIs $50k-75k, 1.6% for AGIs $75k-100k, 2.1% for AGIs $100k-200k, 1.8% for AGIs over 200k)
Taxes paid: $12,023 (reported on 49.4% of returns)
78734:
$12,023
State:
$6,921
(% of AGI for various income ranges: 5.8% for AGIs below $25k, 5.0% for AGIs $25k-50k, 5.5% for AGIs $50k-75k, 5.3% for AGIs $75k-100k, 5.4% for AGIs $100k-200k, 3.5% for AGIs over 200k)
Earned income credit: $1,854 (reported on 9.0% of returns)
Here:
$1,854
State:
$2,570
(% of AGI for various income ranges: 4.0% for AGIs below $25k, 0.6% for AGIs $25k-50k)
Percentage of individuals using paid preparers for their 2012 taxes: 49.9%
Here:
50%
State:
51%
(% for various income ranges: 41.0% for AGIs below $25k, 43.9% for AGIs $25k-50k, 46.8% for AGIs $50k-75k, 51.1% for AGIs $75k-100k, 53.2% for AGIs $100k-200k, 72.9% for AGIs over 200k)
Averages for the 2004 tax year for zip code 78734, filed in 2005:
Average Adjusted Gross Income (AGI) in 2004: $105,445 (Individual Income Tax Returns)
Here:
$105,445
State:
$47,881
Salary/wage: $77,784 (reported on 75.0% of returns)
Here:
$77,784
State:
$41,947
(% of AGI for various income ranges: 64.8% for AGIs $10k-25k, 69.1% for AGIs $25k-50k, 63.7% for AGIs $50k-75k, 62.5% for AGIs $75k-100k, 50.9% for AGIs over 100k)
Taxable interest for individuals: $3,842 (reported on 57.6% of returns)
This zip code:
$3,842
Texas:
$2,255
(% of AGI for various income ranges: 3.6% for AGIs $10k-25k, 2.5% for AGIs $25k-50k, 2.3% for AGIs $50k-75k, 2.0% for AGIs $75k-100k, 1.9% for AGIs over 100k)
Taxable dividends: $8,652 (reported on 41.7% of returns)
Here:
$8,652
State:
$4,261
(% of AGI for various income ranges: 4.3% for AGIs $10k-25k, 2.7% for AGIs $25k-50k, 3.7% for AGIs $50k-75k, 3.4% for AGIs $75k-100k, 3.3% for AGIs over 100k)
Net capital gain/loss: +$20,006 (reported on 40.2% of returns)
Here:
+$20,006
State:
+$16,110
(% of AGI for various income ranges: -0.0% for AGIs $10k-25k, 1.0% for AGIs $25k-50k, 1.7% for AGIs $50k-75k, 2.5% for AGIs $75k-100k, 9.4% for AGIs over 100k)
Profit/loss from business: +$25,612 (reported on 26.6% of returns)
Here:
+$25,612
State:
+$11,013
(% of AGI for various income ranges: 17.4% for AGIs $10k-25k, 9.1% for AGIs $25k-50k, 7.4% for AGIs $50k-75k, 7.3% for AGIs $75k-100k, 5.5% for AGIs over 100k)
IRA payment deduction: $3,429 (reported on 3.6% of returns)
78734:
$3,429
Texas:
$3,120
(% of AGI for various income ranges: 0.4% for AGIs $10k-25k, 0.3% for AGIs $25k-50k, 0.3% for AGIs $50k-75k, 0.2% for AGIs $75k-100k, 0.1% for AGIs over 100k)
Self-employed pension: $17,289 (reported on 2.8% of returns)
Here:
$17,289
Texas:
$16,401
(% of AGI for various income ranges: 0.2% for AGIs $25k-50k, 0.3% for AGIs $50k-75k, 0.5% for AGIs $75k-100k, 0.5% for AGIs over 100k)
Total itemized deductions: $26,952 (16% of AGI, reported on 52.9% of returns)
Here:
$26,952
State:
$19,631
Here:
16.1% of AGI
State:
18.9% of AGI
(% of AGI for various income ranges: 24.0% for AGIs $10k-25k, 20.9% for AGIs $25k-50k, 21.5% for AGIs $50k-75k, 21.9% for AGIs $75k-100k, 10.5% for AGIs over 100k)
Charity contributions deductions: $4,312 (2% of AGI, reported on 45.0% of returns)
Here:
$4,312
State:
$4,753
Here:
2.4% of AGI
State:
4.2% of AGI
(% of AGI for various income ranges: 1.4% for AGIs $10k-25k, 1.6% for AGIs $25k-50k, 2.0% for AGIs $50k-75k, 2.4% for AGIs $75k-100k, 1.8% for AGIs over 100k)
Total tax: $22,682 (reported on 81.9% of returns)
78734:
$22,682
State:
$9,058
(% of AGI for various income ranges: 5.9% for AGIs $10k-25k, 8.1% for AGIs $25k-50k, 10.0% for AGIs $50k-75k, 11.3% for AGIs $75k-100k, 19.9% for AGIs over 100k)
Earned income credit: $1,527 (reported on 8.1% of returns)
Here:
$1,527
State:
$2,024
Percentage of individuals using paid preparers for their 2004 taxes: 52.8%
Here:
53%
State:
57%
(% for various income ranges: 43.6% for AGIs below $10k, 51.3% for AGIs $10k-25k, 48.1% for AGIs $25k-50k, 53.3% for AGIs $50k-75k, 52.9% for AGIs $75k-100k, 62.9% for AGIs over 100k)
Likely homosexual households (counted as self-reported same-sex unmarried-partner households)
Lesbian couples: 0.1% of all households
Gay men: 0.4% of all households
Household received Food Stamps/SNAP in the past 12 months: 166 Household did not receive Food Stamps/SNAP in the past 12 months: 9,679
Women who had a birth in the past 12 months: 180 (184 now married, 0 unmarried) Women who did not have a birth in the past 12 months: 3,831 (1,879 now married, 1,945 unmarried)
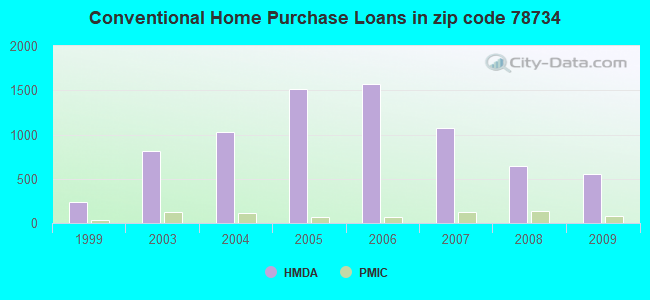
Housing units in zip code 78734 with a mortgage: 5,130 (387 second mortgage, 58 home equity loan, 255 both second mortgage and home equity loan) Houses without a mortgage: 108
Median monthly owner costs for units with a mortgage: $2,864 Median monthly owner costs for units without a mortgage: $1,181
Residents with income below the poverty level in 2022:
This zip code:
6.0%
Whole state:
14.0%
Residents with income below 50% of the poverty level in 2022:
This zip code:
3.3%
Whole state:
7.4%
Median number of rooms in houses and condos:
Here:
6.6
State:
6.3
Median number of rooms in apartments:
Here:
5.3
State:
4.0
Notable locations in this zip code not listed on our city pages
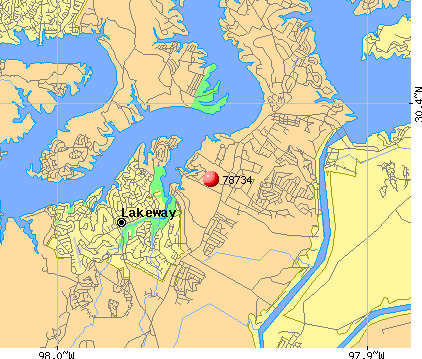
Notable locations in zip code 78734: Three Points (A), Travis County Emergency Services District 6 Station 1 Hudson Bend (B), Travis County Emergency Services District 6 Station 2 Lakeway (C), Austin / Travis County Emergency Medical Service - Medic 09 (D), Travis County Emergency Services District 6 Station 1 (E). Display/hide their locations on the map
3,122 married couples with children.
963 single-parent households (405 men, 558 women).
86.6% of residents of 78734 zip code speak English at home.
9.1% of residents speak Spanish at home (57% very well, 23% well, 12% not well, 8% not at all).
2.7% of residents speak other Indo-European language at home (85% very well, 15% well).
1.6% of residents speak Asian or Pacific Island language at home (77% very well, 20% well, 3% not well).
0.5% of residents speak other language at home (100% very well).
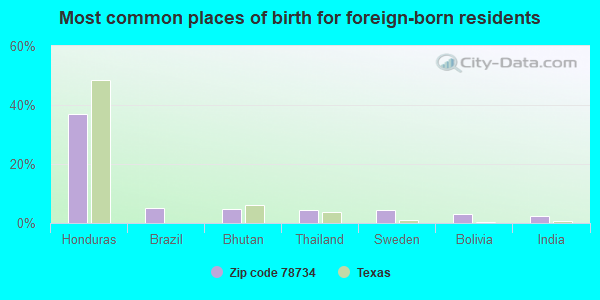
Foreign born population: 2,387 (10.7%) (51.5% of them are naturalized citizens)
This zip code:
10.7%
Whole state:
17.2%
37%Honduras
5%Brazil
5%Bhutan
5%Thailand
4%Sweden
3%Bolivia
2%India
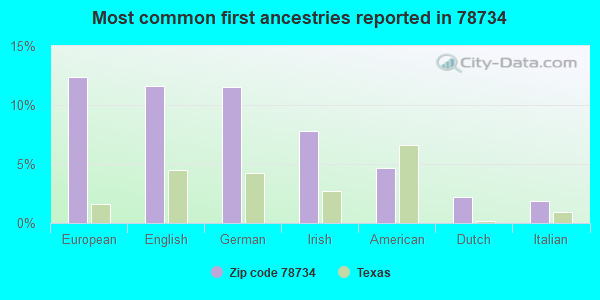
12%European
12%English
12%German
8%Irish
5%American
2%Dutch
2%Italian
Year of entry for the foreign-born population
4112010 or later
5842000 to 2009
5991990 to 1999
906Before 1990
Housing units lacking complete plumbing facilities: 1.1% Housing units lacking complete kitchen facilities: 3.3%
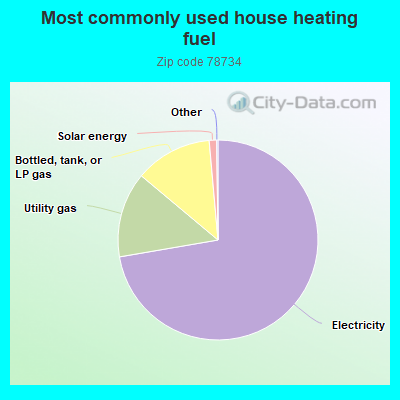
72.3%Electricity
13.8%Utility gas
12.5%Bottled, tank, or LP gas
1.2%Solar energy
Population in 1990: 7,495. Population change in the 1990s: +5,430 (+72.4%).
Place of birth for U.S.-born residents:
This state: 10,563
Northeast: 1,445
Midwest: 2,862
South: 2,250
West: 2,663
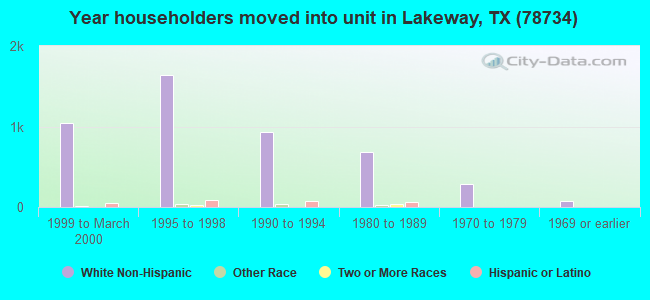
47% of the 78734 zip code residents lived in the same house 5 years ago. Out of people who lived in different houses, 45% lived in this county. Out of people who lived in different counties, 50% lived in Texas.
89% of the 78734 zip code residents lived in the same house 1 year ago. Out of people who lived in different houses, 43% moved from this county. Out of people who lived in different houses, 19% moved from different county within same state. Out of people who lived in different houses, 38% moved from different state. Out of people who lived in different houses, 4% moved from abroad.
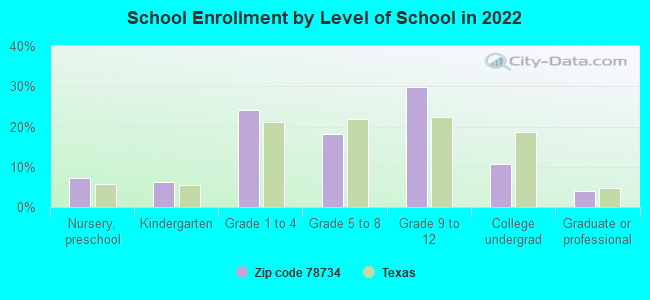
Private vs. public school enrollment:
Students in private schools in grades 1 to 8 (elementary and middle school): 147
Here:
7.7%
Texas:
8.8%
Students in private schools in grades 9 to 12 (high school): 67
Here:
5.0%
Texas:
8.0%
Students in private undergraduate colleges: 293
Here:
58.9%
Texas:
16.2%
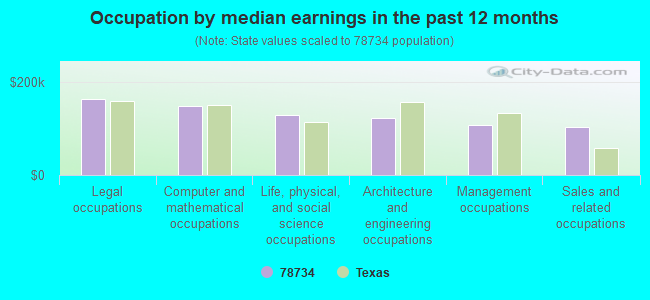
Occupation by median earnings in the past 12 months ($)
162,692Legal occupations
146,909Computer and mathematical occupations
128,228Life, physical, and social science occupations
121,919Architecture and engineering occupations
107,028Management occupations
102,187Sales and related occupations
Companies with federal contracts located in this zip code (AUSTIN, TX):
INTELLIMOTIVE ENVIRONMENTAL SY (5206 BEACON DRIVE; small business) : $1,759,953 in 6 contractsfrom 2001 to 2005
Contracts for Defense Aircraft -- Basic Research (R&D) by Air Force Signed by year:2000: $0; 2001: $99,961; 2002: $749,992; 2003: $0; 2004: $535,000; 2005: $375,000; 2006: $0.
Biggest contracts:
$749,992 with Air Force for Defense Aircraft -- Basic Research (R&D). Signed on 2002-08-14. Completion date: 2004-08-31.
$535,000, same as above.Signed on 2004-09-25. Completion date: 2006-12-31.
$375,000, same as above.Signed on 2005-11-23. Completion date: 2006-12-31.
$249,992, same as above.Signed on 2002-12-18. Completion date: 2004-08-31.
SCIMITAR TECHNOLOGIES LLC (2005 BIG HORN DRIVE; small business) : $337,809 in 4 contractsfrom 2004 to 2005
$99,994 with Missile Defense Agency for Defense Missile and Space Systems -- Basic Research (R&D). Signed on 2005-03-02. Completion date: 2005-09-01.
$97,822 with Navy for Defense Missile and Space Systems -- Advanced Development (R&D). Signed on 2004-08-19. Completion date: 2005-02-19.
$69,999 with Navy for Other Defense -- Basic Research (R&D). Signed on 2004-10-21. Completion date: 2005-04-21.
$69,994, same as above.Signed on 2005-11-07. Completion date: 2006-05-20.
GLOBAL DEFENSE INC (2009 RANCH ROAD 620 NORTH; small business) : $203,934 in 2 contractsfrom 2003 to 2004
$108,624 with Defense Information Systems Agency for Other ADP and Telecommunications Services (includes data storage on tapes, compact disks, etc.). Signed on 2004-07-08. Completion date: 2004-09-30.
$95,310 with Department of Defense for Other ADP and Telecommunications Services (includes data storage on tapes, compact disks, etc.). Signed on 2003-09-27. Completion date: 2004-09-30.
360 TECHNOLOGIES, INC (15304 PHEASANT LANE; small business) : $22,259 in 5 contractsfrom 2004 to 2006
Contracts for ADP Components, Individual Equipment, ADP Input/Output and Storage Devices by Navy, Federal Emergency Management Agency, Army Signed by year:2000: $0; 2001: $0; 2002: $0; 2003: $0; 2004: $5,000; 2005: $12,074; 2006: $5,185.
Biggest contracts:
$13,568 with Navy for ADP Components. Signed on 2005-12-21. Completion date: 2005-12-30.
$5,185, same as above.Signed on 2006-02-08. Completion date: 2006-03-30.
$5,000 with Federal Emergency Management Agency for Individual Equipment. Taking place in GA. Signed on 2004-10-04. Completion date: 2005-03-30.
$1,491 with Army for ADP Input/Output and Storage Devices. Signed on 2005-06-08. Completion date: 2005-06-24.
BLUE SKIES ASSOCIATES (3805 LAKEWAY BLVD; small business)
$20,927 with Air Force for Construction of Structures and Facilities -- Recreation Facilities (Non-Building). Signed on 2003-09-29. Completion date: 2003-11-28.
BEHRINGER HARVARD LAKEWAY LP (101 LAKEWAY DR) : $7,814 in 3 contractsfrom 2005 to 2006
$4,080 with Army for Other Education and Training Services. Signed on 2006-03-10. Completion date: 2006-05-04.
$3,730 with Army for Lodging - Hotel/Motel. Signed on 2005-07-28. Completion date: 2005-07-31.
$4 with Army for Other Education and Training Services. Signed on 2006-05-15. Completion date: 2006-05-04.
KLEIN,THEODORE A (14456 AGARITA RD; small business)
$4,150 with Air Force for Other Education and Training Services. Signed on 2005-06-27. Completion date: 2005-08-19.
KINKO S CLASSIC OF AUSTIN (5 LAKEWAY CTR CT STE 101; small business)
$3,000 with Army for Printing, Duplicating, and Bookbinding Equipment. Signed on 2005-09-13. Completion date: 2005-09-30.
Top industries in this zip code by the number of employees in 2005:
Administrative and Support and Waste Management and Remediation Services: Professional Employer Organizations (500-999 employees: 1 establishment)
Accommodation and Food Services: Hotels (except Casino Hotels) and Motels (100-249: 3, 20-49: 1)
2003 - 2018 National Fire Incident Reporting System (NFIRS) incidents
Based on the data from the years 2003 - 2018 the average number of fire incidents per year is 34. The highest number of fires - 85 took place in 2011, and the least - 0 in 2005. The data has a growing trend.
When looking into fire subcategories, the most incidents belonged to: Outside Fires (46.7%), and Structure Fires (33.1%).
Fire incident types reported to NFIRS in Zip Code 78734

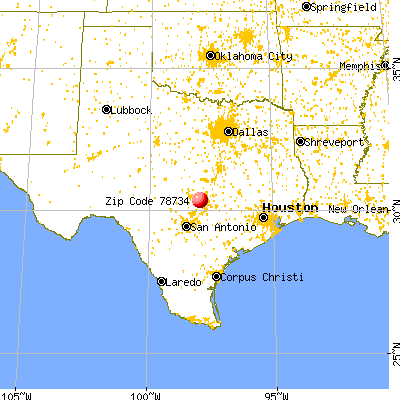


 Nearest zip codes: 78732, 78738, 78645, 78733, 78730, 78736.


 : $1,759,953 in 6 contracts from 2001 to 2005
 Based on the data from the years 2003 - 2018 the average number of fire incidents per year is 34. The highest number of fires - 85 took place in 2011, and the least - 0 in 2005. The data has a growing trend.
 When looking into fire subcategories, the most incidents belonged to: Outside Fires (46.7%), and Structure Fires (33.1%).