Estimated zip code population in 2022: 59,312 Zip code population in 2010: 50,606 Zip code population in 2000: 31,958
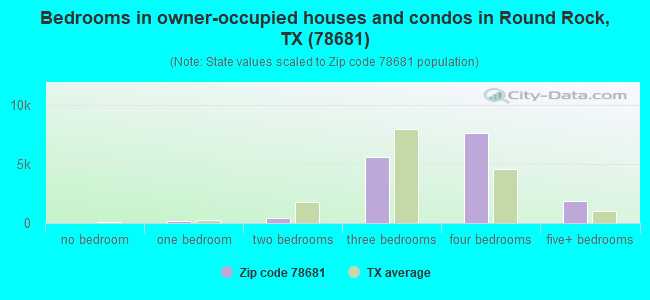
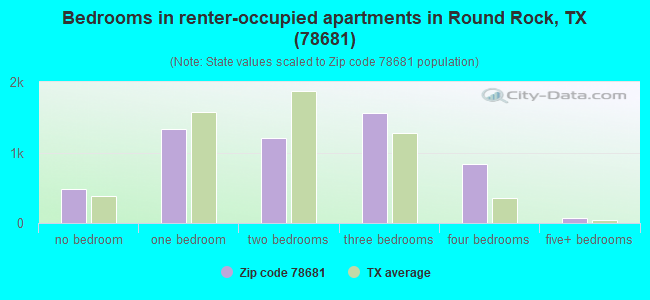
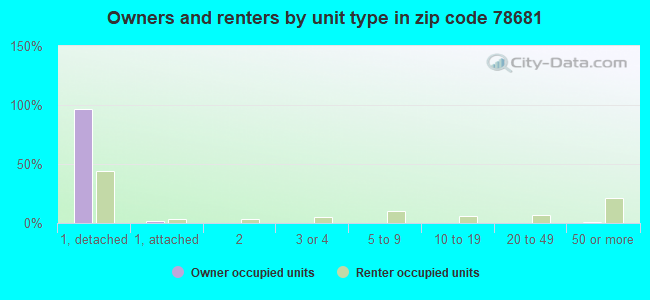
Houses and condos: 21,570 Renter-occupied apartments: 5,446
% of renters here:
26%
State:
38%
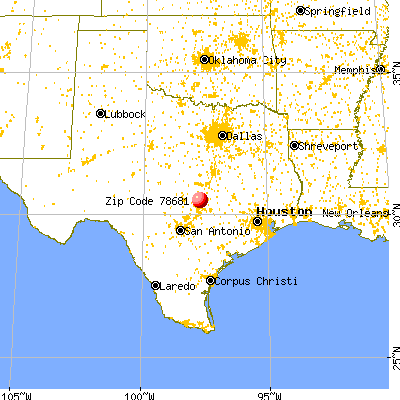
March 2022 cost of living index in zip code 78681: 94.2 (less than average, U.S. average is 100)
Land area: 21.7 sq. mi. Water area: 0.2 sq. mi.
Population density: 2,730 people per square mile
(average).
OSM Map
General Map
Google Map
MSN Map
OSM Map
General Map
Google Map
MSN Map
OSM Map
General Map
Google Map
MSN Map
OSM Map
General Map
Google Map
MSN Map
Please wait while loading the map...
Real estate property taxes paid for housing units in 2022:
This zip code:
1.7% ($8,085)
Texas:
1.5% ($4,050)
Median real estate property taxes paid for housing units with mortgages in 2022: $8,902 (1.7%) Median real estate property taxes paid for housing units with no mortgage in 2022: $6,543 (1.6%)
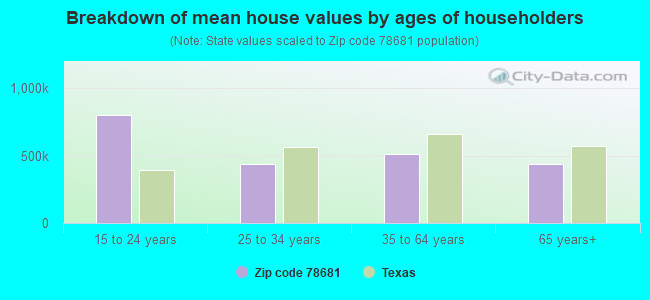
Estimated median house/condo value in 2022: $484,727
78681:
$484,727
Texas:
$275,400
According to our research of Texas and other state lists, there were 35 registered sex offenders living in 78681 zip code as of April 27, 2024. The ratio of all residents to sex offenders in zip code 78681 is 1,625 to 1. The ratio of registered sex offenders to all residents in this zip code is much lower than the state average.
Median resident age:
This zip code:
39.8 years
Texas median age:
35.6 years
Average household size:
This zip code:
2.8 people
Texas:
2.6 people
Averages for the 2020 tax year for zip code 78681, filed in 2021:
Average Adjusted Gross Income (AGI) in 2020: $109,862 (Individual Income Tax Returns)
Here:
$109,862
State:
$77,054
Salary/wage: $98,388 (reported on 86.1% of returns)
Here:
$98,388
State:
$62,766
(% of AGI for various income ranges: 1143.2% for AGIs below $25k, 3619.5% for AGIs $25k-50k, 6637.7% for AGIs $50k-75k, 9658.0% for AGIs $75k-100k, 20081.1% for AGIs $100k-200k, 76442.1% for AGIs over 200k)
Taxable interest for individuals: $1,458 (reported on 37.9% of returns)
This zip code:
$1,458
Texas:
$2,665
(% of AGI for various income ranges: 14.0% for AGIs below $25k, 25.4% for AGIs $25k-50k, 36.2% for AGIs $50k-75k, 72.4% for AGIs $75k-100k, 107.5% for AGIs $100k-200k, 538.9% for AGIs over 200k)
Ordinary dividends: $4,695 (reported on 29.5% of returns)
Here:
$4,695
State:
$10,044
(% of AGI for various income ranges: 26.5% for AGIs below $25k, 52.2% for AGIs $25k-50k, 82.9% for AGIs $50k-75k, 145.6% for AGIs $75k-100k, 276.7% for AGIs $100k-200k, 1452.3% for AGIs over 200k)
Net capital gain/loss in AGI: +$22,861 (reported on 28.1% of returns)
Here:
+$22,861
State:
+$39,590
(% of AGI for various income ranges: 18.5% for AGIs below $25k, 41.7% for AGIs $25k-50k, 99.9% for AGIs $50k-75k, 176.6% for AGIs $75k-100k, 518.8% for AGIs $100k-200k, 10982.5% for AGIs over 200k)
Profit/loss from business: +$14,435 (reported on 18.9% of returns)
Here:
+$14,435
State:
+$10,888
(% of AGI for various income ranges: 107.0% for AGIs below $25k, 156.7% for AGIs $25k-50k, 242.5% for AGIs $50k-75k, 310.9% for AGIs $75k-100k, 607.3% for AGIs $100k-200k, 2178.0% for AGIs over 200k)
Taxable individual retirement arrangement distribution: $21,717 (reported on 8.1% of returns)
78681:
$21,717
Texas:
$24,740
(% of AGI for various income ranges: 39.5% for AGIs below $25k, 94.1% for AGIs $25k-50k, 203.1% for AGIs $50k-75k, 275.8% for AGIs $75k-100k, 500.7% for AGIs $100k-200k, 1023.5% for AGIs over 200k)
Self-employed (Keogh) retirement plans: $22,522 (reported on 0.7% of returns)
78681:
$22,522
Texas:
$29,298
(% of AGI for various income ranges: 3.2% for AGIs below $25k, 24.9% for AGIs $100k-200k, 245.2% for AGIs over 200k)
Total itemized deductions: $32,536 (reported on 11.2% of returns)
Here:
$32,536
State:
$40,428
(% of AGI for various income ranges: 45.4% for AGIs below $25k, 120.9% for AGIs $25k-50k, 297.1% for AGIs $50k-75k, 433.5% for AGIs $75k-100k, 807.6% for AGIs $100k-200k, 3531.5% for AGIs over 200k)
Charity contributions: $12,600 (reported on 9.4% of returns)
Here:
$12,600
State:
$18,201
(% of AGI for various income ranges: 3.3% for AGIs below $25k, 15.8% for AGIs $25k-50k, 45.0% for AGIs $50k-75k, 86.0% for AGIs $75k-100k, 234.0% for AGIs $100k-200k, 1502.0% for AGIs over 200k)
Taxes paid: $8,666 (reported on 11.1% of returns)
78681:
$8,666
State:
$7,821
(% of AGI for various income ranges: 9.7% for AGIs below $25k, 31.0% for AGIs $25k-50k, 81.6% for AGIs $50k-75k, 124.5% for AGIs $75k-100k, 240.0% for AGIs $100k-200k, 844.0% for AGIs over 200k)
Earned income credit: $2,096 (reported on 8.1% of returns)
Here:
$2,096
State:
$2,584
(% of AGI for various income ranges: 59.7% for AGIs below $25k, 49.0% for AGIs $25k-50k, 1.2% for AGIs $50k-75k)
Percentage of individuals using paid preparers for their 2020 taxes: 92.6%
Here:
93%
State:
92%
(% for various income ranges: 90.8% for AGIs below $25k, 92.7% for AGIs $25k-50k, 91.7% for AGIs $50k-75k, 92.0% for AGIs $75k-100k, 93.6% for AGIs $100k-200k, 95.0% for AGIs over 200k)
Averages for the 2012 tax year for zip code 78681, filed in 2013:
Average Adjusted Gross Income (AGI) in 2012: $83,912 (Individual Income Tax Returns)
Here:
$83,912
State:
$65,384
Salary/wage: $75,166 (reported on 88.8% of returns)
Here:
$75,166
State:
$52,524
(% of AGI for various income ranges: 79.8% for AGIs below $25k, 82.8% for AGIs $25k-50k, 80.5% for AGIs $50k-75k, 81.3% for AGIs $75k-100k, 86.2% for AGIs $100k-200k, 67.4% for AGIs over 200k)
Taxable interest for individuals: $1,319 (reported on 39.6% of returns)
This zip code:
$1,319
Texas:
$2,372
(% of AGI for various income ranges: 1.0% for AGIs below $25k, 0.5% for AGIs $25k-50k, 0.6% for AGIs $50k-75k, 0.5% for AGIs $75k-100k, 0.4% for AGIs $100k-200k, 1.0% for AGIs over 200k)
Ordinary dividends: $4,149 (reported on 26.4% of returns)
Here:
$4,149
State:
$9,721
(% of AGI for various income ranges: 2.1% for AGIs below $25k, 0.9% for AGIs $25k-50k, 1.0% for AGIs $50k-75k, 0.9% for AGIs $75k-100k, 0.9% for AGIs $100k-200k, 2.3% for AGIs over 200k)
Net capital gain/loss in AGI: +$8,982 (reported on 23.2% of returns)
Here:
+$8,982
State:
+$35,319
(% of AGI for various income ranges: 0.2% for AGIs $25k-50k, 0.6% for AGIs $50k-75k, 0.3% for AGIs $75k-100k, 0.9% for AGIs $100k-200k, 7.5% for AGIs over 200k)
Profit/loss from business: +$14,731 (reported on 17.9% of returns)
Here:
+$14,731
State:
+$13,732
(% of AGI for various income ranges: 7.5% for AGIs below $25k, 3.7% for AGIs $25k-50k, 3.2% for AGIs $50k-75k, 3.3% for AGIs $75k-100k, 2.6% for AGIs $100k-200k, 3.1% for AGIs over 200k)
Taxable individual retirement arrangement distribution: $17,090 (reported on 8.4% of returns)
78681:
$17,090
Texas:
$19,511
(% of AGI for various income ranges: 2.3% for AGIs below $25k, 2.0% for AGIs $25k-50k, 2.2% for AGIs $50k-75k, 2.1% for AGIs $75k-100k, 1.6% for AGIs $100k-200k, 1.4% for AGIs over 200k)
Self-employment retirement plans: $15,493 (reported on 0.7% of returns)
78681:
$15,493
Texas:
$23,938
(% of AGI for various income ranges: 0.1% for AGIs $25k-50k, 0.1% for AGIs $100k-200k, 0.3% for AGIs over 200k)
Total itemized deductions: $21,338 (16% of AGI, reported on 44.4% of returns)
Here:
$21,338
State:
$24,724
Here:
16.2% of AGI
State:
15.9% of AGI
(% of AGI for various income ranges: 10.0% for AGIs below $25k, 10.7% for AGIs $25k-50k, 13.5% for AGIs $50k-75k, 13.5% for AGIs $75k-100k, 12.4% for AGIs $100k-200k, 8.2% for AGIs over 200k)
Charity contributions: $4,317 (reported on 36.6% of returns)
Here:
$4,317
State:
$6,808
(% of AGI for various income ranges: 0.6% for AGIs below $25k, 1.1% for AGIs $25k-50k, 1.6% for AGIs $50k-75k, 2.0% for AGIs $75k-100k, 2.1% for AGIs $100k-200k, 2.0% for AGIs over 200k)
Taxes paid: $7,587 (reported on 43.9% of returns)
78681:
$7,587
State:
$6,921
(% of AGI for various income ranges: 2.7% for AGIs below $25k, 3.4% for AGIs $25k-50k, 4.3% for AGIs $50k-75k, 4.6% for AGIs $75k-100k, 4.6% for AGIs $100k-200k, 3.1% for AGIs over 200k)
Earned income credit: $2,162 (reported on 10.3% of returns)
Here:
$2,162
State:
$2,570
(% of AGI for various income ranges: 5.1% for AGIs below $25k, 1.0% for AGIs $25k-50k)
Percentage of individuals using paid preparers for their 2012 taxes: 35.3%
Here:
35%
State:
51%
(% for various income ranges: 30.8% for AGIs below $25k, 33.2% for AGIs $25k-50k, 36.9% for AGIs $50k-75k, 34.4% for AGIs $75k-100k, 36.4% for AGIs $100k-200k, 53.9% for AGIs over 200k)
Averages for the 2004 tax year for zip code 78681, filed in 2005:
Average Adjusted Gross Income (AGI) in 2004: $67,423 (Individual Income Tax Returns)
Here:
$67,423
State:
$47,881
Salary/wage: $63,567 (reported on 90.4% of returns)
Here:
$63,567
State:
$41,947
(% of AGI for various income ranges: 126.3% for AGIs below $10k, 83.9% for AGIs $10k-25k, 85.6% for AGIs $25k-50k, 84.6% for AGIs $50k-75k, 88.1% for AGIs $75k-100k, 83.9% for AGIs over 100k)
Taxable interest for individuals: $1,097 (reported on 49.9% of returns)
This zip code:
$1,097
Texas:
$2,255
(% of AGI for various income ranges: 4.2% for AGIs below $10k, 1.6% for AGIs $10k-25k, 0.9% for AGIs $25k-50k, 0.8% for AGIs $50k-75k, 0.8% for AGIs $75k-100k, 0.7% for AGIs over 100k)
Taxable dividends: $1,971 (reported on 29.6% of returns)
Here:
$1,971
State:
$4,261
(% of AGI for various income ranges: 3.6% for AGIs below $10k, 1.1% for AGIs $10k-25k, 0.7% for AGIs $25k-50k, 0.6% for AGIs $50k-75k, 0.5% for AGIs $75k-100k, 1.0% for AGIs over 100k)
Net capital gain/loss: +$5,342 (reported on 29.0% of returns)
Here:
+$5,342
State:
+$16,110
(% of AGI for various income ranges: -1.8% for AGIs below $10k, 0.7% for AGIs $10k-25k, 0.4% for AGIs $25k-50k, 0.7% for AGIs $50k-75k, 0.8% for AGIs $75k-100k, 3.8% for AGIs over 100k)
Profit/loss from business: +$12,094 (reported on 17.4% of returns)
Here:
+$12,094
State:
+$11,013
(% of AGI for various income ranges: 2.5% for AGIs below $10k, 4.9% for AGIs $10k-25k, 3.6% for AGIs $25k-50k, 2.8% for AGIs $50k-75k, 2.7% for AGIs $75k-100k, 3.2% for AGIs over 100k)
IRA payment deduction: $3,133 (reported on 2.8% of returns)
78681:
$3,133
Texas:
$3,120
(% of AGI for various income ranges: 0.2% for AGIs below $10k, 0.2% for AGIs $10k-25k, 0.2% for AGIs $25k-50k, 0.2% for AGIs $50k-75k, 0.1% for AGIs $75k-100k, 0.1% for AGIs over 100k)
Self-employed pension: $11,813 (reported on 1.0% of returns)
Here:
$11,813
Texas:
$16,401
(% of AGI for various income ranges: 0.1% for AGIs $25k-50k, 0.0% for AGIs $50k-75k, 0.2% for AGIs $75k-100k, 0.2% for AGIs over 100k)
Total itemized deductions: $18,952 (19% of AGI, reported on 52.5% of returns)
Here:
$18,952
State:
$19,631
Here:
19.2% of AGI
State:
18.9% of AGI
(% of AGI for various income ranges: 16.8% for AGIs below $10k, 12.6% for AGIs $10k-25k, 14.7% for AGIs $25k-50k, 17.6% for AGIs $50k-75k, 17.3% for AGIs $75k-100k, 13.3% for AGIs over 100k)
Charity contributions deductions: $3,223 (3% of AGI, reported on 45.2% of returns)
Here:
$3,223
State:
$4,753
Here:
3.1% of AGI
State:
4.2% of AGI
(% of AGI for various income ranges: 0.9% for AGIs below $10k, 1.0% for AGIs $10k-25k, 1.4% for AGIs $25k-50k, 2.1% for AGIs $50k-75k, 2.1% for AGIs $75k-100k, 2.4% for AGIs over 100k)
Total tax: $10,478 (reported on 82.6% of returns)
78681:
$10,478
State:
$9,058
(% of AGI for various income ranges: 3.9% for AGIs below $10k, 4.4% for AGIs $10k-25k, 7.0% for AGIs $25k-50k, 8.6% for AGIs $50k-75k, 10.0% for AGIs $75k-100k, 16.7% for AGIs over 100k)
Earned income credit: $1,702 (reported on 8.3% of returns)
Here:
$1,702
State:
$2,024
Percentage of individuals using paid preparers for their 2004 taxes: 36.9%
Here:
37%
State:
57%
(% for various income ranges: 31.2% for AGIs below $10k, 43.4% for AGIs $10k-25k, 38.2% for AGIs $25k-50k, 36.6% for AGIs $50k-75k, 33.2% for AGIs $75k-100k, 37.9% for AGIs over 100k)
Likely homosexual households (counted as self-reported same-sex unmarried-partner households)
Lesbian couples: 0.0% of all households
Gay men: 0.2% of all households
Household received Food Stamps/SNAP in the past 12 months: 750 Household did not receive Food Stamps/SNAP in the past 12 months: 20,307
Women who had a birth in the past 12 months: 504 (461 now married, 49 unmarried) Women who did not have a birth in the past 12 months: 13,791 (7,913 now married, 5,820 unmarried)
Housing units in zip code 78681 with a mortgage: 10,755 (591 second mortgage, 24 home equity loan, 463 both second mortgage and home equity loan) Houses without a mortgage: 41
Median monthly owner costs for units with a mortgage: $2,540 Median monthly owner costs for units without a mortgage: $934
Residents with income below the poverty level in 2022:
This zip code:
4.8%
Whole state:
14.0%
Residents with income below 50% of the poverty level in 2022:
This zip code:
3.2%
Whole state:
7.4%
Median number of rooms in houses and condos:
Here:
7.3
State:
6.3
Median number of rooms in apartments:
Here:
4.4
State:
4.0
Notable locations in this zip code not listed on our city pages
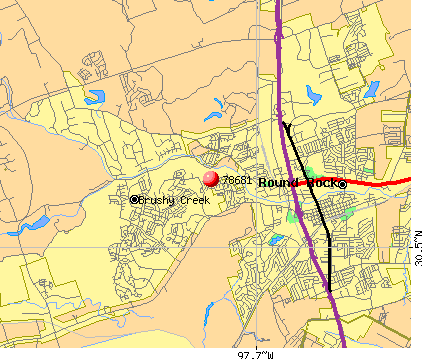
Notable locations in zip code 78681: La Frontera in Round Rock (A), The Market at Round Rock (B), Inn at Brushy Creek (C), Round Rock Fire Department Station 5 (D), Round Rock Fire Department Station 3 (E), Sam Bass Volunteer Fire Department Station 1 (F), Sam Bass Volunteer Fire Department Station 2 (G), Williamson County Emergency Medical Services (H), Williamson County Emergency Medical Services Round Rock (I). Display/hide their locations on the map
Shopping Centers: Hesters Crossing Shopping Center (1), Round Rock West Shopping Center (2), Town and Country Mall Shopping Center (3). Display/hide their locations on the map
Churches in zip code 78681 include: Faith Missionary Baptist Church (A), Saint Andrews Anglican Church (B), Round Rock Community Church (C), New Hope Community Church (D), Round Rock Presbyterian Church (E), The Church of Jesus Christ of Latter Day Saints (F), Grace Lutheran Church (G), Saint Williams Catholic Church (H), Sweethome Baptist Church Round Rock (I). Display/hide their locations on the map
Reservoirs: Soil Conservation Service Site 13a Reservoir (A), Soil Conservation Service Site 5 Reservoir (B), Soil Conservation Service Site 12 Reservoir (C), Soil Conservation Service Site 10b Reservoir (D). Display/hide their locations on the map
Parks in zip code 78681 include: Roundrock West Park (1), Old Settlers Park (2), Round Rock High School Softball Field (3), Dragon Stadium (4), Frontier Park (5), Creekmont West Park (6), Chisholm Valley Park (7), Bustin Memorial Park (8). Display/hide their locations on the map
12,825 married couples with children.
2,652 single-parent households (873 men, 1,779 women).
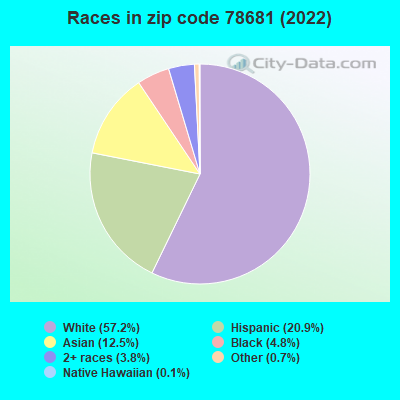
73.6% of residents of 78681 zip code speak English at home.
13.2% of residents speak Spanish at home (66% very well, 14% well, 12% not well, 8% not at all).
4.2% of residents speak other Indo-European language at home (85% very well, 11% well, 3% not well, 1% not at all).
8.2% of residents speak Asian or Pacific Island language at home (80% very well, 15% well, 3% not well, 1% not at all).
1.0% of residents speak other language at home (100% very well).
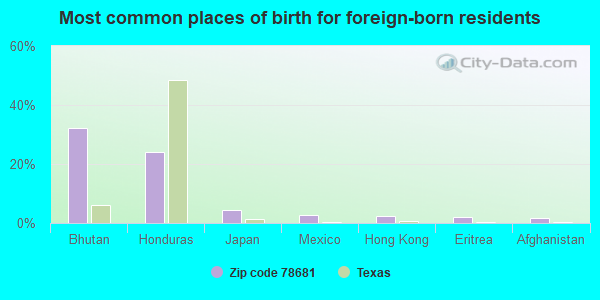
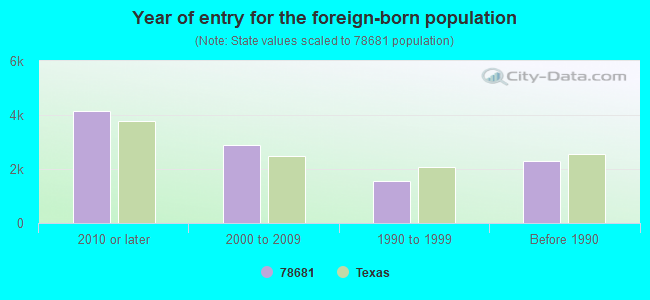
Foreign born population: 9,458 (15.9%) (47.5% of them are naturalized citizens)
Housing units lacking complete plumbing facilities: 0.4% Housing units lacking complete kitchen facilities: 1.7%
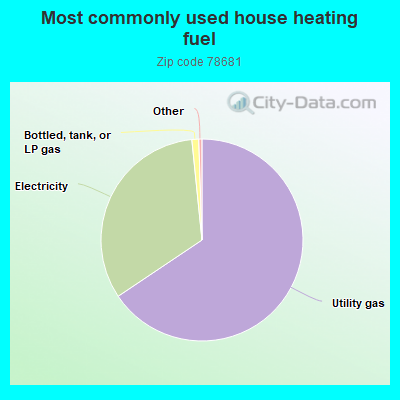
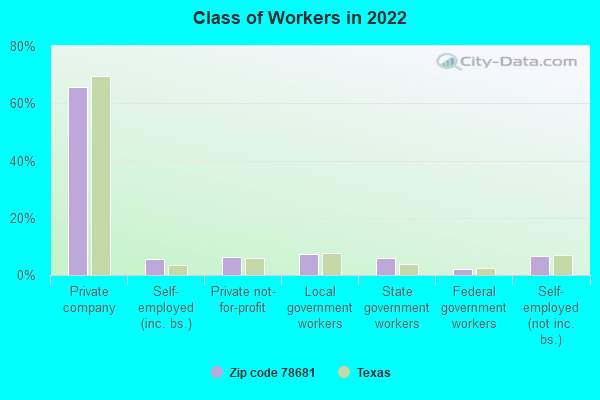
65.6%Utility gas
32.8%Electricity
1.1%Bottled, tank, or LP gas
Population in 1990: 17,196. Population change in the 1990s: +14,762 (+85.8%).
Place of birth for U.S.-born residents:
This state: 29,030
Northeast: 3,545
Midwest: 5,262
South: 4,723
West: 6,249
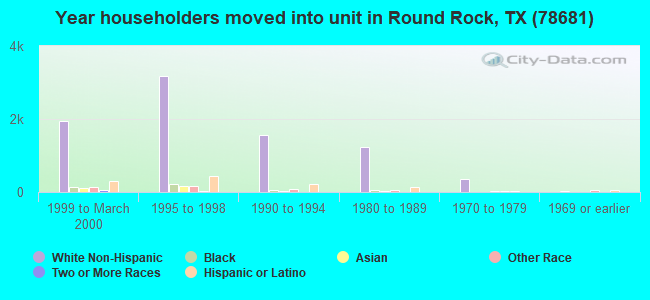
42% of the 78681 zip code residents lived in the same house 5 years ago. Out of people who lived in different houses, 31% lived in this county. Out of people who lived in different counties, 50% lived in Texas.
88% of the 78681 zip code residents lived in the same house 1 year ago. Out of people who lived in different houses, 37% moved from this county. Out of people who lived in different houses, 34% moved from different county within same state. Out of people who lived in different houses, 25% moved from different state. Out of people who lived in different houses, 7% moved from abroad.
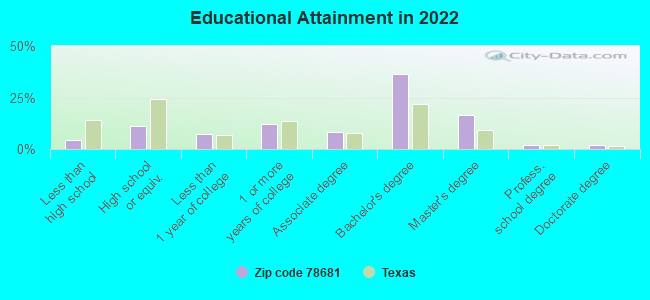
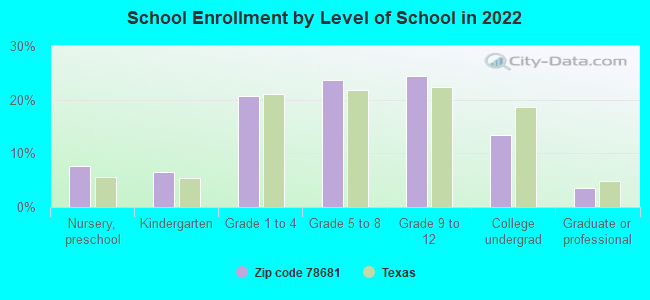
Private vs. public school enrollment:
Students in private schools in grades 1 to 8 (elementary and middle school): 374
Here:
4.8%
Texas:
8.8%
Students in private schools in grades 9 to 12 (high school): 397
Here:
9.2%
Texas:
8.0%
Students in private undergraduate colleges: 205
Here:
8.7%
Texas:
16.2%
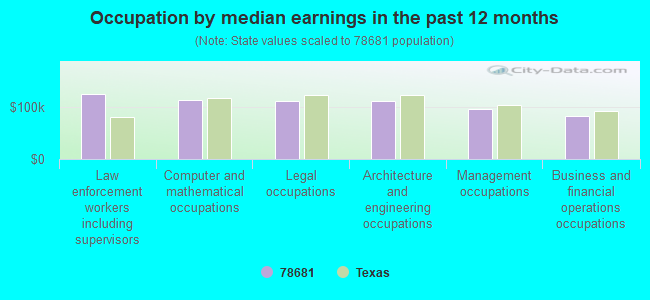
Occupation by median earnings in the past 12 months ($)
124,834Law enforcement workers including supervisors
113,144Computer and mathematical occupations
111,460Legal occupations
111,341Architecture and engineering occupations
96,045Management occupations
81,327Business and financial operations occupations
Companies with biggest federal contracts located in this zip code (ROUND ROCK, TX):
TECO WESTINGHOUSE MOTOR COMPAN (5100 N I H 35; small business) : $3,123,751 in 21 contractsfrom 2000 to 2006
Contracts for Motors, Electrical, Miscellaneous Ship and Marine Equipment, Miscellaneous Electric Power and Distribution Equipment, Generators and Generators Sets, Electrical, and moreby Navy, Air Force, United States Coast Guard (disused code: now 7008), U.S. Coast Guard, and others Signed by year:2000: $1,293,856; 2001: $1,055,443; 2002: $160,565; 2003: $543,199; 2004: $0; 2005: $61,620; 2006: $9,068.
Biggest contracts:
$697,500 with Navy for Motors, Electrical. Signed on 2000-04-18. Completion date: 2001-04-30.
$636,333 with Air Force for Motors, Electrical. Signed on 2001-09-28. Completion date: 2002-04-30.
$543,199, same as above.Signed on 2003-03-14. Completion date: 2003-10-01.
$436,998, same as above.Signed on 2000-09-29. Completion date: 2001-07-29.
C & H TECHNOLOGIES, INC (445 ROUND ROCK WEST DR; small business) : $79,171 in 5 contractsfrom 2003 to 2005
Contracts for Maintenance, Repair and Rebuilding of Equipment -- Electrical and Electronic Equipment Components, Other Quality Control, Testing and Inspection Services -- Miscellaneous by Air Force Signed by year:2000: $0; 2001: $0; 2002: $0; 2003: $53,800; 2004: $0; 2005: $25,371; 2006: $0.
Biggest contracts:
$29,069 with Air Force for Maintenance, Repair and Rebuilding of Equipment -- Electrical and Electronic Equipment Components. Taking place in UT. Signed on 2005-11-16. Completion date: 2006-09-30.
$27,700, same as above.Signed on 2003-10-22. Completion date: 2004-09-30.
$26,100 with Air Force for Other Quality Control, Testing and Inspection Services -- Miscellaneous. Taking place in UT. Signed on 2003-04-08. Completion date: 2003-09-30.
$0, same as above.Signed on 2003-04-08. Completion date: 2003-09-30.
SABRETEL INC (1902 FLINT ROCK DR; small business)
$69,997 with Army for Other Defense -- Applied Research and Exploratory Development (R&D). Signed on 2005-02-02. Completion date: 2006-02-02.
AIR INSTRUMENTATION INC (1609 BLACKJACK DRIVE; small business) : $52,147 in 4 contractsfrom 2003 to 2005
$23,690 with Army for Hazard-Detecting Instruments and Apparatus. Signed on 2003-09-10. Completion date: 2003-12-23.
$14,653 with Army for Liquid and Gas Flow, Liquid Level, and Mechanical Motion Measuring Instruments. Signed on 2003-08-13. Completion date: 2003-09-09.
$8,496 with Air Force for Safety and Rescue Equipment. Signed on 2005-09-29. Completion date: 2005-12-01.
$5,308 with Air Force for Time Measuring Instruments. Signed on 2005-09-30. Completion date: 2005-12-01.
MEDIA RECOVERY INC (900 ROUND ROCK AVE; small business)
$39,717 with Department of Defense for Office Supplies. Signed on 2000-10-30. Completion date: 2000-11-01.
ANTX INC (475 ROUND ROCK DR W STE 15; small business) : $36,554 in 4 contractsfrom 2005 to 2006
$22,543 with National Institutes of Health for . Taking place in MD. Signed on 2005-09-29. Effective on 2005-09-09. Completion date: 2005-11-30.
$7,740 with Navy for Miscellaneous Alarm, Signal and Security Detection Systems. Signed on 2005-08-23. Completion date: 2005-09-09.
$4,271 with Air Force for Miscellaneous Alarm, Signal and Security Detection Systems. Signed on 2006-04-04. Completion date: 2006-04-30.
$2,000 with National Institutes of Health for . Taking place in MD. Signed on 2005-09-29. Effective on 2005-09-09. Completion date: 2005-11-30.
ROUND ROCK INDUSTRIAL EQUIPMEN (1901 SHADOWBROOK CIRCLE; small business)
$32,600 with Army for Plastics Fabricated Materials. Signed on 2002-04-08. Completion date: 2002-04-30.
SYSCO FOOD SERVICES OF AUSTIN, (101 S CHISHOLM TRAIL) : $20,741 in 5 contractsfrom 2002 to 2003
Contracts for Condiments and Related Products, Composite Food Packages, Forage and Feed, Food Services by Army Signed by year:2000: $0; 2001: $0; 2002: $3,306; 2003: $17,435; 2004: $0; 2005: $0; 2006: $0.
Biggest contracts:
$5,928 with Army for Condiments and Related Products. Signed on 2003-11-04. Completion date: 2003-11-23.
$4,150 with Army for Composite Food Packages. Signed on 2003-01-31. Completion date: 2002-12-13.
$3,966 with Army for Forage and Feed. Signed on 2003-05-08. Completion date: 2003-05-17.
$3,391 with Army for Composite Food Packages. Signed on 2003-02-06. Completion date: 2003-02-06.
EXCELLENCE BODY & PAINT (1307 CLARK ST; small business)
$17,500 with Army for Modification of Equipment -- Ground Effect Vehicles, Motor Vehicles, Trailers, and Cycles. Signed on 2005-06-03. Completion date: 2005-06-23.
TEXAS HIGHWAY PRODUCTS, LTD (1309-B CLARK ST; small business)
$4,025 with Air Force for Cameras, Still Picture. Signed on 2006-05-24. Completion date: 2006-09-12.
Top industries in this zip code by the number of employees in 2005:
2002 - 2017 National Fire Incident Reporting System (NFIRS) incidents
Based on the data from the years 2002 - 2017 the average number of fire incidents per year is 94. The highest number of reported fires - 167 took place in 2008, and the least - 50 in 2002. The data has an increasing trend.
When looking into fire subcategories, the most incidents belonged to: Outside Fires (45.8%), and Structure Fires (32.7%).
Fire incident types reported to NFIRS in Zip Code 78681


 Nearest zip codes: 78717, 78665, 78729, 78664, 78728, 78613.
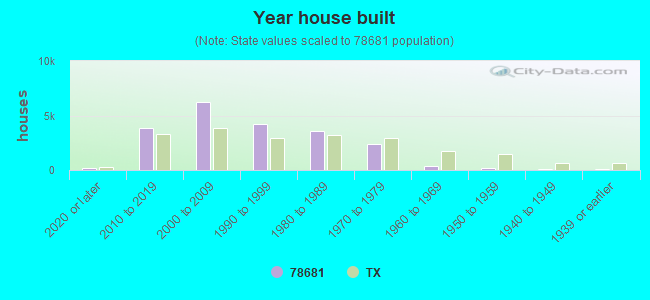


 : $3,123,751 in 21 contracts from 2000 to 2006

 Based on the data from the years 2002 - 2017 the average number of fire incidents per year is 94. The highest number of reported fires - 167 took place in 2008, and the least - 50 in 2002. The data has an increasing trend.
 When looking into fire subcategories, the most incidents belonged to: Outside Fires (45.8%), and Structure Fires (32.7%).