Estimated zip code population in 2022: 33,768
Zip code population in 2010: 16,375
Zip code population in 2000: 4,715
Houses and condos: 11,065
Renter-occupied apartments: 1,307
% of renters here:
12%State:
38%
March 2022 cost of living index in zip code 78653: 93.4
(less than average, U.S. average is 100)
Land area: 104.6
sq. mi.
Water area: 0.5
sq. mi.
Population density: 323 people per square mile (very low).
OSM Map
General Map
Google Map
MSN Map
OSM Map
General Map
Google Map
MSN Map
OSM Map
General Map
Google Map
MSN Map
OSM Map
General Map
Google Map
MSN Map
Please wait while loading the map...
Real estate property taxes paid for housing units in 2022:
This zip code:
1.7% ($5,689)Texas:
1.5% ($4,050)
Median real estate property taxes paid for housing units with mortgages in 2022: $6,042 (1.7%)
Median real estate property taxes paid for housing units with no mortgage in 2022: $4,599 (1.6%)
Profiles of local businesses
Business Search - 14 Million verified businesses
Males: 16,628 Females: 17,139
For population 25 years and over in 78653:
High school or higher: 82.0%Bachelor's degree or higher: 30.2%Graduate or professional degree: 10.2%Unemployed: 4.6%Mean travel time to work (commute): 33.0 minutes
For population 15 years and over in 78653:
Never married: 36.5%Now married: 51.8%Separated: 1.2%Widowed: 2.0%Divorced: 8.5%
Zip code 78653 compared to state average:
Renting percentage significantly below state average. Length of stay since moving in significantly below state average. House age significantly below state average. 18,881 55.9% Hispanic or Latino 7,669 22.7% White 5,519 16.3% Black 881 2.6% Two or more races 701 2.1% Asian 80 0.2% Some other race 34 0.1% Native Hawaiian and Other
Data:
Median household income ($)
Median household income (% change since 2000)
Household income diversity
Ratio of average income to average house value (%)
Ratio of average income to average rent
Median household income ($) - White
Median household income ($) - Black or African American
Median household income ($) - Asian
Median household income ($) - Hispanic or Latino
Median household income ($) - American Indian and Alaska Native
Median household income ($) - Multirace
Median household income ($) - Other Race
Median household income for houses/condos with a mortgage ($)
Median household income for apartments without a mortgage ($)
Races - White alone (%)
Races - White alone (% change since 2000)
Races - Black alone (%)
Races - Black alone (% change since 2000)
Races - American Indian alone (%)
Races - American Indian alone (% change since 2000)
Races - Asian alone (%)
Races - Asian alone (% change since 2000)
Races - Hispanic (%)
Races - Hispanic (% change since 2000)
Races - Native Hawaiian and Other Pacific Islander alone (%)
Races - Native Hawaiian and Other Pacific Islander alone (% change since 2000)
Races - Two or more races (%)
Races - Two or more races (% change since 2000)
Races - Other race alone (%)
Races - Other race alone (% change since 2000)
Racial diversity
Unemployment (%)
Unemployment (% change since 2000)
Unemployment (%) - White
Unemployment (%) - Black or African American
Unemployment (%) - Asian
Unemployment (%) - Hispanic or Latino
Unemployment (%) - American Indian and Alaska Native
Unemployment (%) - Multirace
Unemployment (%) - Other Race
Population density (people per square mile)
Population - Males (%)
Population - Females (%)
Population - Males (%) - White
Population - Males (%) - Black or African American
Population - Males (%) - Asian
Population - Males (%) - Hispanic or Latino
Population - Males (%) - American Indian and Alaska Native
Population - Males (%) - Multirace
Population - Males (%) - Other Race
Population - Females (%) - White
Population - Females (%) - Black or African American
Population - Females (%) - Asian
Population - Females (%) - Hispanic or Latino
Population - Females (%) - American Indian and Alaska Native
Population - Females (%) - Multirace
Population - Females (%) - Other Race
Coronavirus confirmed cases (Apr 27, 2024)
Deaths caused by coronavirus (Apr 27, 2024)
Coronavirus confirmed cases (per 100k population) (Apr 27, 2024)
Deaths caused by coronavirus (per 100k population) (Apr 27, 2024)
Daily increase in number of cases (Apr 27, 2024)
Weekly increase in number of cases (Apr 27, 2024)
Cases doubled (in days) (Apr 27, 2024)
Hospitalized patients (Apr 18, 2022)
Negative test results (Apr 18, 2022)
Total test results (Apr 18, 2022)
COVID Vaccine doses distributed (per 100k population) (Sep 19, 2023)
COVID Vaccine doses administered (per 100k population) (Sep 19, 2023)
COVID Vaccine doses distributed (Sep 19, 2023)
COVID Vaccine doses administered (Sep 19, 2023)
Likely homosexual households (%)
Likely homosexual households (% change since 2000)
Likely homosexual households - Lesbian couples (%)
Likely homosexual households - Lesbian couples (% change since 2000)
Likely homosexual households - Gay men (%)
Likely homosexual households - Gay men (% change since 2000)
Cost of living index
Median gross rent ($)
Median contract rent ($)
Median monthly housing costs ($)
Median house or condo value ($)
Median house or condo value ($ change since 2000)
Mean house or condo value by units in structure - 1, detached ($)
Mean house or condo value by units in structure - 1, attached ($)
Mean house or condo value by units in structure - 2 ($)
Mean house or condo value by units in structure by units in structure - 3 or 4 ($)
Mean house or condo value by units in structure - 5 or more ($)
Mean house or condo value by units in structure - Boat, RV, van, etc. ($)
Mean house or condo value by units in structure - Mobile home ($)
Median house or condo value ($) - White
Median house or condo value ($) - Black or African American
Median house or condo value ($) - Asian
Median house or condo value ($) - Hispanic or Latino
Median house or condo value ($) - American Indian and Alaska Native
Median house or condo value ($) - Multirace
Median house or condo value ($) - Other Race
Median resident age
Resident age diversity
Median resident age - Males
Median resident age - Females
Median resident age - White
Median resident age - Black or African American
Median resident age - Asian
Median resident age - Hispanic or Latino
Median resident age - American Indian and Alaska Native
Median resident age - Multirace
Median resident age - Other Race
Median resident age - Males - White
Median resident age - Males - Black or African American
Median resident age - Males - Asian
Median resident age - Males - Hispanic or Latino
Median resident age - Males - American Indian and Alaska Native
Median resident age - Males - Multirace
Median resident age - Males - Other Race
Median resident age - Females - White
Median resident age - Females - Black or African American
Median resident age - Females - Asian
Median resident age - Females - Hispanic or Latino
Median resident age - Females - American Indian and Alaska Native
Median resident age - Females - Multirace
Median resident age - Females - Other Race
Commute - mean travel time to work (minutes)
Travel time to work - Less than 5 minutes (%)
Travel time to work - Less than 5 minutes (% change since 2000)
Travel time to work - 5 to 9 minutes (%)
Travel time to work - 5 to 9 minutes (% change since 2000)
Travel time to work - 10 to 19 minutes (%)
Travel time to work - 10 to 19 minutes (% change since 2000)
Travel time to work - 20 to 29 minutes (%)
Travel time to work - 20 to 29 minutes (% change since 2000)
Travel time to work - 30 to 39 minutes (%)
Travel time to work - 30 to 39 minutes (% change since 2000)
Travel time to work - 40 to 59 minutes (%)
Travel time to work - 40 to 59 minutes (% change since 2000)
Travel time to work - 60 to 89 minutes (%)
Travel time to work - 60 to 89 minutes (% change since 2000)
Travel time to work - 90 or more minutes (%)
Travel time to work - 90 or more minutes (% change since 2000)
Marital status - Never married (%)
Marital status - Now married (%)
Marital status - Separated (%)
Marital status - Widowed (%)
Marital status - Divorced (%)
Median family income ($)
Median family income (% change since 2000)
Median non-family income ($)
Median non-family income (% change since 2000)
Median per capita income ($)
Median per capita income (% change since 2000)
Median family income ($) - White
Median family income ($) - Black or African American
Median family income ($) - Asian
Median family income ($) - Hispanic or Latino
Median family income ($) - American Indian and Alaska Native
Median family income ($) - Multirace
Median family income ($) - Other Race
Median year house/condo built
Median year apartment built
Year house built - Built 2005 or later (%)
Year house built - Built 2000 to 2004 (%)
Year house built - Built 1990 to 1999 (%)
Year house built - Built 1980 to 1989 (%)
Year house built - Built 1970 to 1979 (%)
Year house built - Built 1960 to 1969 (%)
Year house built - Built 1950 to 1959 (%)
Year house built - Built 1940 to 1949 (%)
Year house built - Built 1939 or earlier (%)
Average household size
Household density (households per square mile)
Average household size - White
Average household size - Black or African American
Average household size - Asian
Average household size - Hispanic or Latino
Average household size - American Indian and Alaska Native
Average household size - Multirace
Average household size - Other Race
Occupied housing units (%)
Vacant housing units (%)
Owner occupied housing units (%)
Renter occupied housing units (%)
Vacancy status - For rent (%)
Vacancy status - For sale only (%)
Vacancy status - Rented or sold, not occupied (%)
Vacancy status - For seasonal, recreational, or occasional use (%)
Vacancy status - For migrant workers (%)
Vacancy status - Other vacant (%)
Residents with income below the poverty level (%)
Residents with income below 50% of the poverty level (%)
Children below poverty level (%)
Poor families by family type - Married-couple family (%)
Poor families by family type - Male, no wife present (%)
Poor families by family type - Female, no husband present (%)
Poverty status for native-born residents (%)
Poverty status for foreign-born residents (%)
Poverty among high school graduates not in families (%)
Poverty among people who did not graduate high school not in families (%)
Residents with income below the poverty level (%) - White
Residents with income below the poverty level (%) - Black or African American
Residents with income below the poverty level (%) - Asian
Residents with income below the poverty level (%) - Hispanic or Latino
Residents with income below the poverty level (%) - American Indian and Alaska Native
Residents with income below the poverty level (%) - Multirace
Residents with income below the poverty level (%) - Other Race
Air pollution - Air Quality Index (AQI)
Air pollution - CO
Air pollution - NO2
Air pollution - SO2
Air pollution - Ozone
Air pollution - PM10
Air pollution - PM25
Air pollution - Pb
Crime - Murders per 100,000 population
Crime - Rapes per 100,000 population
Crime - Robberies per 100,000 population
Crime - Assaults per 100,000 population
Crime - Burglaries per 100,000 population
Crime - Thefts per 100,000 population
Crime - Auto thefts per 100,000 population
Crime - Arson per 100,000 population
Crime - City-data.com crime index
Crime - Violent crime index
Crime - Property crime index
Crime - Murders per 100,000 population (5 year average)
Crime - Rapes per 100,000 population (5 year average)
Crime - Robberies per 100,000 population (5 year average)
Crime - Assaults per 100,000 population (5 year average)
Crime - Burglaries per 100,000 population (5 year average)
Crime - Thefts per 100,000 population (5 year average)
Crime - Auto thefts per 100,000 population (5 year average)
Crime - Arson per 100,000 population (5 year average)
Crime - City-data.com crime index (5 year average)
Crime - Violent crime index (5 year average)
Crime - Property crime index (5 year average)
1996 Presidential Elections Results (%) - Democratic Party (Clinton)
1996 Presidential Elections Results (%) - Republican Party (Dole)
1996 Presidential Elections Results (%) - Other
2000 Presidential Elections Results (%) - Democratic Party (Gore)
2000 Presidential Elections Results (%) - Republican Party (Bush)
2000 Presidential Elections Results (%) - Other
2004 Presidential Elections Results (%) - Democratic Party (Kerry)
2004 Presidential Elections Results (%) - Republican Party (Bush)
2004 Presidential Elections Results (%) - Other
2008 Presidential Elections Results (%) - Democratic Party (Obama)
2008 Presidential Elections Results (%) - Republican Party (McCain)
2008 Presidential Elections Results (%) - Other
2012 Presidential Elections Results (%) - Democratic Party (Obama)
2012 Presidential Elections Results (%) - Republican Party (Romney)
2012 Presidential Elections Results (%) - Other
2016 Presidential Elections Results (%) - Democratic Party (Clinton)
2016 Presidential Elections Results (%) - Republican Party (Trump)
2016 Presidential Elections Results (%) - Other
2020 Presidential Elections Results (%) - Democratic Party (Biden)
2020 Presidential Elections Results (%) - Republican Party (Trump)
2020 Presidential Elections Results (%) - Other
Ancestries Reported - Arab (%)
Ancestries Reported - Czech (%)
Ancestries Reported - Danish (%)
Ancestries Reported - Dutch (%)
Ancestries Reported - English (%)
Ancestries Reported - French (%)
Ancestries Reported - French Canadian (%)
Ancestries Reported - German (%)
Ancestries Reported - Greek (%)
Ancestries Reported - Hungarian (%)
Ancestries Reported - Irish (%)
Ancestries Reported - Italian (%)
Ancestries Reported - Lithuanian (%)
Ancestries Reported - Norwegian (%)
Ancestries Reported - Polish (%)
Ancestries Reported - Portuguese (%)
Ancestries Reported - Russian (%)
Ancestries Reported - Scotch-Irish (%)
Ancestries Reported - Scottish (%)
Ancestries Reported - Slovak (%)
Ancestries Reported - Subsaharan African (%)
Ancestries Reported - Swedish (%)
Ancestries Reported - Swiss (%)
Ancestries Reported - Ukrainian (%)
Ancestries Reported - United States (%)
Ancestries Reported - Welsh (%)
Ancestries Reported - West Indian (%)
Ancestries Reported - Other (%)
Educational Attainment - No schooling completed (%)
Educational Attainment - Less than high school (%)
Educational Attainment - High school or equivalent (%)
Educational Attainment - Less than 1 year of college (%)
Educational Attainment - 1 or more years of college (%)
Educational Attainment - Associate degree (%)
Educational Attainment - Bachelor's degree (%)
Educational Attainment - Master's degree (%)
Educational Attainment - Professional school degree (%)
Educational Attainment - Doctorate degree (%)
School Enrollment - Nursery, preschool (%)
School Enrollment - Kindergarten (%)
School Enrollment - Grade 1 to 4 (%)
School Enrollment - Grade 5 to 8 (%)
School Enrollment - Grade 9 to 12 (%)
School Enrollment - College undergrad (%)
School Enrollment - Graduate or professional (%)
School Enrollment - Not enrolled in school (%)
School enrollment - Public schools (%)
School enrollment - Private schools (%)
School enrollment - Not enrolled (%)
Median number of rooms in houses and condos
Median number of rooms in apartments
Housing units lacking complete plumbing facilities (%)
Housing units lacking complete kitchen facilities (%)
Density of houses
Urban houses (%)
Rural houses (%)
Households with people 60 years and over (%)
Households with people 65 years and over (%)
Households with people 75 years and over (%)
Households with one or more nonrelatives (%)
Households with no nonrelatives (%)
Population in households (%)
Family households (%)
Nonfamily households (%)
Population in families (%)
Family households with own children (%)
Median number of bedrooms in owner occupied houses
Mean number of bedrooms in owner occupied houses
Median number of bedrooms in renter occupied houses
Mean number of bedrooms in renter occupied houses
Median number of vehichles in owner occupied houses
Mean number of vehichles in owner occupied houses
Median number of vehichles in renter occupied houses
Mean number of vehichles in renter occupied houses
Mortgage status - with mortgage (%)
Mortgage status - with second mortgage (%)
Mortgage status - with home equity loan (%)
Mortgage status - with both second mortgage and home equity loan (%)
Mortgage status - without a mortgage (%)
Average family size
Average family size - White
Average family size - Black or African American
Average family size - Asian
Average family size - Hispanic or Latino
Average family size - American Indian and Alaska Native
Average family size - Multirace
Average family size - Other Race
Geographical mobility - Same house 1 year ago (%)
Geographical mobility - Moved within same county (%)
Geographical mobility - Moved from different county within same state (%)
Geographical mobility - Moved from different state (%)
Geographical mobility - Moved from abroad (%)
Place of birth - Born in state of residence (%)
Place of birth - Born in other state (%)
Place of birth - Native, outside of US (%)
Place of birth - Foreign born (%)
Housing units in structures - 1, detached (%)
Housing units in structures - 1, attached (%)
Housing units in structures - 2 (%)
Housing units in structures - 3 or 4 (%)
Housing units in structures - 5 to 9 (%)
Housing units in structures - 10 to 19 (%)
Housing units in structures - 20 to 49 (%)
Housing units in structures - 50 or more (%)
Housing units in structures - Mobile home (%)
Housing units in structures - Boat, RV, van, etc. (%)
House/condo owner moved in on average (years ago)
Renter moved in on average (years ago)
Year householder moved into unit - Moved in 1999 to March 2000 (%)
Year householder moved into unit - Moved in 1995 to 1998 (%)
Year householder moved into unit - Moved in 1990 to 1994 (%)
Year householder moved into unit - Moved in 1980 to 1989 (%)
Year householder moved into unit - Moved in 1970 to 1979 (%)
Year householder moved into unit - Moved in 1969 or earlier (%)
Means of transportation to work - Drove car alone (%)
Means of transportation to work - Carpooled (%)
Means of transportation to work - Public transportation (%)
Means of transportation to work - Bus or trolley bus (%)
Means of transportation to work - Streetcar or trolley car (%)
Means of transportation to work - Subway or elevated (%)
Means of transportation to work - Railroad (%)
Means of transportation to work - Ferryboat (%)
Means of transportation to work - Taxicab (%)
Means of transportation to work - Motorcycle (%)
Means of transportation to work - Bicycle (%)
Means of transportation to work - Walked (%)
Means of transportation to work - Other means (%)
Working at home (%)
Industry diversity
Most Common Industries - Agriculture, forestry, fishing and hunting, and mining (%)
Most Common Industries - Agriculture, forestry, fishing and hunting (%)
Most Common Industries - Mining, quarrying, and oil and gas extraction (%)
Most Common Industries - Construction (%)
Most Common Industries - Manufacturing (%)
Most Common Industries - Wholesale trade (%)
Most Common Industries - Retail trade (%)
Most Common Industries - Transportation and warehousing, and utilities (%)
Most Common Industries - Transportation and warehousing (%)
Most Common Industries - Utilities (%)
Most Common Industries - Information (%)
Most Common Industries - Finance and insurance, and real estate and rental and leasing (%)
Most Common Industries - Finance and insurance (%)
Most Common Industries - Real estate and rental and leasing (%)
Most Common Industries - Professional, scientific, and management, and administrative and waste management services (%)
Most Common Industries - Professional, scientific, and technical services (%)
Most Common Industries - Management of companies and enterprises (%)
Most Common Industries - Administrative and support and waste management services (%)
Most Common Industries - Educational services, and health care and social assistance (%)
Most Common Industries - Educational services (%)
Most Common Industries - Health care and social assistance (%)
Most Common Industries - Arts, entertainment, and recreation, and accommodation and food services (%)
Most Common Industries - Arts, entertainment, and recreation (%)
Most Common Industries - Accommodation and food services (%)
Most Common Industries - Other services, except public administration (%)
Most Common Industries - Public administration (%)
Occupation diversity
Most Common Occupations - Management, business, science, and arts occupations (%)
Most Common Occupations - Management, business, and financial occupations (%)
Most Common Occupations - Management occupations (%)
Most Common Occupations - Business and financial operations occupations (%)
Most Common Occupations - Computer, engineering, and science occupations (%)
Most Common Occupations - Computer and mathematical occupations (%)
Most Common Occupations - Architecture and engineering occupations (%)
Most Common Occupations - Life, physical, and social science occupations (%)
Most Common Occupations - Education, legal, community service, arts, and media occupations (%)
Most Common Occupations - Community and social service occupations (%)
Most Common Occupations - Legal occupations (%)
Most Common Occupations - Education, training, and library occupations (%)
Most Common Occupations - Arts, design, entertainment, sports, and media occupations (%)
Most Common Occupations - Healthcare practitioners and technical occupations (%)
Most Common Occupations - Health diagnosing and treating practitioners and other technical occupations (%)
Most Common Occupations - Health technologists and technicians (%)
Most Common Occupations - Service occupations (%)
Most Common Occupations - Healthcare support occupations (%)
Most Common Occupations - Protective service occupations (%)
Most Common Occupations - Fire fighting and prevention, and other protective service workers including supervisors (%)
Most Common Occupations - Law enforcement workers including supervisors (%)
Most Common Occupations - Food preparation and serving related occupations (%)
Most Common Occupations - Building and grounds cleaning and maintenance occupations (%)
Most Common Occupations - Personal care and service occupations (%)
Most Common Occupations - Sales and office occupations (%)
Most Common Occupations - Sales and related occupations (%)
Most Common Occupations - Office and administrative support occupations (%)
Most Common Occupations - Natural resources, construction, and maintenance occupations (%)
Most Common Occupations - Farming, fishing, and forestry occupations (%)
Most Common Occupations - Construction and extraction occupations (%)
Most Common Occupations - Installation, maintenance, and repair occupations (%)
Most Common Occupations - Production, transportation, and material moving occupations (%)
Most Common Occupations - Production occupations (%)
Most Common Occupations - Transportation occupations (%)
Most Common Occupations - Material moving occupations (%)
People in Group quarters - Institutionalized population (%)
People in Group quarters - Correctional institutions (%)
People in Group quarters - Federal prisons and detention centers (%)
People in Group quarters - Halfway houses (%)
People in Group quarters - Local jails and other confinement facilities (including police lockups) (%)
People in Group quarters - Military disciplinary barracks (%)
People in Group quarters - State prisons (%)
People in Group quarters - Other types of correctional institutions (%)
People in Group quarters - Nursing homes (%)
People in Group quarters - Hospitals/wards, hospices, and schools for the handicapped (%)
People in Group quarters - Hospitals/wards and hospices for chronically ill (%)
People in Group quarters - Hospices or homes for chronically ill (%)
People in Group quarters - Military hospitals or wards for chronically ill (%)
People in Group quarters - Other hospitals or wards for chronically ill (%)
People in Group quarters - Hospitals or wards for drug/alcohol abuse (%)
People in Group quarters - Mental (Psychiatric) hospitals or wards (%)
People in Group quarters - Schools, hospitals, or wards for the mentally retarded (%)
People in Group quarters - Schools, hospitals, or wards for the physically handicapped (%)
People in Group quarters - Institutions for the deaf (%)
People in Group quarters - Institutions for the blind (%)
People in Group quarters - Orthopedic wards and institutions for the physically handicapped (%)
People in Group quarters - Wards in general hospitals for patients who have no usual home elsewhere (%)
People in Group quarters - Wards in military hospitals for patients who have no usual home elsewhere (%)
People in Group quarters - Juvenile institutions (%)
People in Group quarters - Long-term care (%)
People in Group quarters - Homes for abused, dependent, and neglected children (%)
People in Group quarters - Residential treatment centers for emotionally disturbed children (%)
People in Group quarters - Training schools for juvenile delinquents (%)
People in Group quarters - Short-term care, detention or diagnostic centers for delinquent children (%)
People in Group quarters - Type of juvenile institution unknown (%)
People in Group quarters - Noninstitutionalized population (%)
People in Group quarters - College dormitories (includes college quarters off campus) (%)
People in Group quarters - Military quarters (%)
People in Group quarters - On base (%)
People in Group quarters - Barracks, unaccompanied personnel housing (UPH), (Enlisted/Officer), ;and similar group living quarters for military personnel (%)
People in Group quarters - Transient quarters for temporary residents (%)
People in Group quarters - Military ships (%)
People in Group quarters - Group homes (%)
People in Group quarters - Homes or halfway houses for drug/alcohol abuse (%)
People in Group quarters - Homes for the mentally ill (%)
People in Group quarters - Homes for the mentally retarded (%)
People in Group quarters - Homes for the physically handicapped (%)
People in Group quarters - Other group homes (%)
People in Group quarters - Religious group quarters (%)
People in Group quarters - Dormitories (%)
People in Group quarters - Agriculture workers' dormitories on farms (%)
People in Group quarters - Job Corps and vocational training facilities (%)
People in Group quarters - Other workers' dormitories (%)
People in Group quarters - Crews of maritime vessels (%)
People in Group quarters - Other nonhousehold living situations (%)
People in Group quarters - Other noninstitutional group quarters (%)
Residents speaking English at home (%)
Residents speaking English at home - Born in the United States (%)
Residents speaking English at home - Native, born elsewhere (%)
Residents speaking English at home - Foreign born (%)
Residents speaking Spanish at home (%)
Residents speaking Spanish at home - Born in the United States (%)
Residents speaking Spanish at home - Native, born elsewhere (%)
Residents speaking Spanish at home - Foreign born (%)
Residents speaking other language at home (%)
Residents speaking other language at home - Born in the United States (%)
Residents speaking other language at home - Native, born elsewhere (%)
Residents speaking other language at home - Foreign born (%)
Class of Workers - Employee of private company (%)
Class of Workers - Self-employed in own incorporated business (%)
Class of Workers - Private not-for-profit wage and salary workers (%)
Class of Workers - Local government workers (%)
Class of Workers - State government workers (%)
Class of Workers - Federal government workers (%)
Class of Workers - Self-employed workers in own not incorporated business and Unpaid family workers (%)
House heating fuel used in houses and condos - Utility gas (%)
House heating fuel used in houses and condos - Bottled, tank, or LP gas (%)
House heating fuel used in houses and condos - Electricity (%)
House heating fuel used in houses and condos - Fuel oil, kerosene, etc. (%)
House heating fuel used in houses and condos - Coal or coke (%)
House heating fuel used in houses and condos - Wood (%)
House heating fuel used in houses and condos - Solar energy (%)
House heating fuel used in houses and condos - Other fuel (%)
House heating fuel used in houses and condos - No fuel used (%)
House heating fuel used in apartments - Utility gas (%)
House heating fuel used in apartments - Bottled, tank, or LP gas (%)
House heating fuel used in apartments - Electricity (%)
House heating fuel used in apartments - Fuel oil, kerosene, etc. (%)
House heating fuel used in apartments - Coal or coke (%)
House heating fuel used in apartments - Wood (%)
House heating fuel used in apartments - Solar energy (%)
House heating fuel used in apartments - Other fuel (%)
House heating fuel used in apartments - No fuel used (%)
Armed forces status - In Armed Forces (%)
Armed forces status - Civilian (%)
Armed forces status - Civilian - Veteran (%)
Armed forces status - Civilian - Nonveteran (%)
Fatal accidents locations in years 2005-2021
Fatal accidents locations in 2005
Fatal accidents locations in 2006
Fatal accidents locations in 2007
Fatal accidents locations in 2008
Fatal accidents locations in 2009
Fatal accidents locations in 2010
Fatal accidents locations in 2011
Fatal accidents locations in 2012
Fatal accidents locations in 2013
Fatal accidents locations in 2014
Fatal accidents locations in 2015
Fatal accidents locations in 2016
Fatal accidents locations in 2017
Fatal accidents locations in 2018
Fatal accidents locations in 2019
Fatal accidents locations in 2020
Fatal accidents locations in 2021
Alcohol use - People drinking some alcohol every month (%)
Alcohol use - People not drinking at all (%)
Alcohol use - Average days/month drinking alcohol
Alcohol use - Average drinks/week
Alcohol use - Average days/year people drink much
Audiometry - Average condition of hearing (%)
Audiometry - People that can hear a whisper from across a quiet room (%)
Audiometry - People that can hear normal voice from across a quiet room (%)
Audiometry - Ears ringing, roaring, buzzing (%)
Audiometry - Had a job exposure to loud noise (%)
Audiometry - Had off-work exposure to loud noise (%)
Blood Pressure & Cholesterol - Has high blood pressure (%)
Blood Pressure & Cholesterol - Checking blood pressure at home (%)
Blood Pressure & Cholesterol - Frequently checking blood cholesterol (%)
Blood Pressure & Cholesterol - Has high cholesterol level (%)
Consumer Behavior - Money monthly spent on food at supermarket/grocery store
Consumer Behavior - Money monthly spent on food at other stores
Consumer Behavior - Money monthly spent on eating out
Consumer Behavior - Money monthly spent on carryout/delivered foods
Consumer Behavior - Income spent on food at supermarket/grocery store (%)
Consumer Behavior - Income spent on food at other stores (%)
Consumer Behavior - Income spent on eating out (%)
Consumer Behavior - Income spent on carryout/delivered foods (%)
Current Health Status - General health condition (%)
Current Health Status - Blood donors (%)
Current Health Status - Has blood ever tested for HIV virus (%)
Current Health Status - Left-handed people (%)
Dermatology - People using sunscreen (%)
Diabetes - Diabetics (%)
Diabetes - Had a blood test for high blood sugar (%)
Diabetes - People taking insulin (%)
Diet Behavior & Nutrition - Diet health (%)
Diet Behavior & Nutrition - Milk product consumption (# of products/month)
Diet Behavior & Nutrition - Meals not home prepared (#/week)
Diet Behavior & Nutrition - Meals from fast food or pizza place (#/week)
Diet Behavior & Nutrition - Ready-to-eat foods (#/month)
Diet Behavior & Nutrition - Frozen meals/pizza (#/month)
Drug Use - People that ever used marijuana or hashish (%)
Drug Use - Ever used hard drugs (%)
Drug Use - Ever used any form of cocaine (%)
Drug Use - Ever used heroin (%)
Drug Use - Ever used methamphetamine (%)
Health Insurance - People covered by health insurance (%)
Kidney Conditions-Urology - Avg. # of times urinating at night
Medical Conditions - People with asthma (%)
Medical Conditions - People with anemia (%)
Medical Conditions - People with psoriasis (%)
Medical Conditions - People with overweight (%)
Medical Conditions - Elderly people having difficulties in thinking or remembering (%)
Medical Conditions - People who ever received blood transfusion (%)
Medical Conditions - People having trouble seeing even with glass/contacts (%)
Medical Conditions - People with arthritis (%)
Medical Conditions - People with gout (%)
Medical Conditions - People with congestive heart failure (%)
Medical Conditions - People with coronary heart disease (%)
Medical Conditions - People with angina pectoris (%)
Medical Conditions - People who ever had heart attack (%)
Medical Conditions - People who ever had stroke (%)
Medical Conditions - People with emphysema (%)
Medical Conditions - People with thyroid problem (%)
Medical Conditions - People with chronic bronchitis (%)
Medical Conditions - People with any liver condition (%)
Medical Conditions - People who ever had cancer or malignancy (%)
Mental Health - People who have little interest in doing things (%)
Mental Health - People feeling down, depressed, or hopeless (%)
Mental Health - People who have trouble sleeping or sleeping too much (%)
Mental Health - People feeling tired or having little energy (%)
Mental Health - People with poor appetite or overeating (%)
Mental Health - People feeling bad about themself (%)
Mental Health - People who have trouble concentrating on things (%)
Mental Health - People moving or speaking slowly or too fast (%)
Mental Health - People having thoughts they would be better off dead (%)
Oral Health - Average years since last visit a dentist
Oral Health - People embarrassed because of mouth (%)
Oral Health - People with gum disease (%)
Oral Health - General health of teeth and gums (%)
Oral Health - Average days a week using dental floss/device
Oral Health - Average days a week using mouthwash for dental problem
Oral Health - Average number of teeth
Pesticide Use - Households using pesticides to control insects (%)
Pesticide Use - Households using pesticides to kill weeds (%)
Physical Activity - People doing vigorous-intensity work activities (%)
Physical Activity - People doing moderate-intensity work activities (%)
Physical Activity - People walking or bicycling (%)
Physical Activity - People doing vigorous-intensity recreational activities (%)
Physical Activity - People doing moderate-intensity recreational activities (%)
Physical Activity - Average hours a day doing sedentary activities
Physical Activity - Average hours a day watching TV or videos
Physical Activity - Average hours a day using computer
Physical Functioning - People having limitations keeping them from working (%)
Physical Functioning - People limited in amount of work they can do (%)
Physical Functioning - People that need special equipment to walk (%)
Physical Functioning - People experiencing confusion/memory problems (%)
Physical Functioning - People requiring special healthcare equipment (%)
Prescription Medications - Average number of prescription medicines taking
Preventive Aspirin Use - Adults 40+ taking low-dose aspirin (%)
Reproductive Health - Vaginal deliveries (%)
Reproductive Health - Cesarean deliveries (%)
Reproductive Health - Deliveries resulted in a live birth (%)
Reproductive Health - Pregnancies resulted in a delivery (%)
Reproductive Health - Women breastfeeding newborns (%)
Reproductive Health - Women that had a hysterectomy (%)
Reproductive Health - Women that had both ovaries removed (%)
Reproductive Health - Women that have ever taken birth control pills (%)
Reproductive Health - Women taking birth control pills (%)
Reproductive Health - Women that have ever used Depo-Provera or injectables (%)
Reproductive Health - Women that have ever used female hormones (%)
Sexual Behavior - People 18+ that ever had sex (vaginal, anal, or oral) (%)
Sexual Behavior - Males 18+ that ever had vaginal sex with a woman (%)
Sexual Behavior - Males 18+ that ever performed oral sex on a woman (%)
Sexual Behavior - Males 18+ that ever had anal sex with a woman (%)
Sexual Behavior - Males 18+ that ever had any sex with a man (%)
Sexual Behavior - Females 18+ that ever had vaginal sex with a man (%)
Sexual Behavior - Females 18+ that ever performed oral sex on a man (%)
Sexual Behavior - Females 18+ that ever had anal sex with a man (%)
Sexual Behavior - Females 18+ that ever had any kind of sex with a woman (%)
Sexual Behavior - Average age people first had sex
Sexual Behavior - Average number of female sex partners in lifetime (males 18+)
Sexual Behavior - Average number of female vaginal sex partners in lifetime (males 18+)
Sexual Behavior - Average age people first performed oral sex on a woman (18+)
Sexual Behavior - Average number of woman performed oral sex on in lifetime (18+)
Sexual Behavior - Average number of male sex partners in lifetime (males 18+)
Sexual Behavior - Average number of male anal sex partners in lifetime (males 18+)
Sexual Behavior - Average age people first performed oral sex on a man (18+)
Sexual Behavior - Average number of male oral sex partners in lifetime (18+)
Sexual Behavior - People using protection when performing oral sex (%)
Sexual Behavior - Average number of times people have vaginal or anal sex a year
Sexual Behavior - People having sex without condom (%)
Sexual Behavior - Average number of male sex partners in lifetime (females 18+)
Sexual Behavior - Average number of male vaginal sex partners in lifetime (females 18+)
Sexual Behavior - Average number of female sex partners in lifetime (females 18+)
Sexual Behavior - Circumcised males 18+ (%)
Sleep Disorders - Average hours sleeping at night
Sleep Disorders - People that has trouble sleeping (%)
Smoking-Cigarette Use - People smoking cigarettes (%)
Taste & Smell - People 40+ having problems with smell (%)
Taste & Smell - People 40+ having problems with taste (%)
Taste & Smell - People 40+ that ever had wisdom teeth removed (%)
Taste & Smell - People 40+ that ever had tonsils teeth removed (%)
Taste & Smell - People 40+ that ever had a loss of consciousness because of a head injury (%)
Taste & Smell - People 40+ that ever had a broken nose or other serious injury to face or skull (%)
Taste & Smell - People 40+ that ever had two or more sinus infections (%)
Weight - Average height (inches)
Weight - Average weight (pounds)
Weight - Average BMI
Weight - People that are obese (%)
Weight - People that ever were obese (%)
Weight - People trying to lose weight (%)
100%
rural population.
Estimated median house/condo value in 2022: $333,836
78653:
$333,836Texas:
$275,400
Median resident age: This zip code:
32.1 yearsTexas median age:
35.6 years
Average household size: This zip code:
3.2 peopleTexas:
2.6 people
Averages for the 2020 tax year for zip code 78653, filed in 2021:
Average Adjusted Gross Income (AGI) in 2020: $57,636 (Individual Income Tax Returns) Here:
$57,636State:
$77,054
Salary/wage: $54,931 (reported on 87.7% of returns )Here:
$54,931State:
$62,766
(% of AGI for various income ranges: 1260.0% for AGIs below $25k , 3976.6% for AGIs $25k-50k , 6946.4% for AGIs $50k-75k , 10267.9% for AGIs $75k-100k , 18377.4% for AGIs $100k-200k , 59677.3% for AGIs over 200k ) Taxable interest for individuals: $696 (reported on 15.5% of returns )This zip code:
$696Texas:
$2,665
(% of AGI for various income ranges: 5.8% for AGIs below $25k , 5.8% for AGIs $25k-50k , 14.9% for AGIs $50k-75k , 14.7% for AGIs $75k-100k , 43.2% for AGIs $100k-200k , 254.5% for AGIs over 200k ) Ordinary dividends: $2,407 (reported on 8.6% of returns )(% of AGI for various income ranges: 5.0% for AGIs below $25k , 4.3% for AGIs $25k-50k , 15.7% for AGIs $50k-75k , 25.6% for AGIs $75k-100k , 81.1% for AGIs $100k-200k , 1220.9% for AGIs over 200k ) Net capital gain/loss in AGI: +$9,640 (reported on 9.1% of returns )Here:
+$9,640State:
+$39,590
(% of AGI for various income ranges: 6.1% for AGIs below $25k , 7.1% for AGIs $25k-50k , 26.3% for AGIs $50k-75k , 49.8% for AGIs $75k-100k , 247.8% for AGIs $100k-200k , 8585.5% for AGIs over 200k ) Profit/loss from business: +$10,796 (reported on 21.7% of returns )Here:
+$10,796State:
+$10,888
(% of AGI for various income ranges: 243.4% for AGIs below $25k , 237.3% for AGIs $25k-50k , 270.3% for AGIs $50k-75k , 410.2% for AGIs $75k-100k , 542.5% for AGIs $100k-200k , 2413.6% for AGIs over 200k ) Taxable individual retirement arrangement distribution: $17,878 (reported on 2.8% of returns )78653:
$17,878Texas:
$24,740
(% of AGI for various income ranges: 13.8% for AGIs below $25k , 14.9% for AGIs $25k-50k , 37.9% for AGIs $50k-75k , 68.0% for AGIs $75k-100k , 298.6% for AGIs $100k-200k , 1606.4% for AGIs over 200k ) Total itemized deductions: $24,626 (reported on 9.0% of returns )Here:
$24,626State:
$40,428
(% of AGI for various income ranges: 49.6% for AGIs below $25k , 151.6% for AGIs $25k-50k , 375.6% for AGIs $50k-75k , 504.7% for AGIs $75k-100k , 703.0% for AGIs $100k-200k , 4101.8% for AGIs over 200k ) Charity contributions: $7,518 (reported on 5.4% of returns )(% of AGI for various income ranges: 4.6% for AGIs below $25k , 17.0% for AGIs $25k-50k , 54.8% for AGIs $50k-75k , 71.7% for AGIs $75k-100k , 173.1% for AGIs $100k-200k , 1341.8% for AGIs over 200k ) Taxes paid: $7,135 (reported on 8.8% of returns )(% of AGI for various income ranges: 10.7% for AGIs below $25k , 45.0% for AGIs $25k-50k , 110.9% for AGIs $50k-75k , 157.7% for AGIs $75k-100k , 203.6% for AGIs $100k-200k , 814.5% for AGIs over 200k ) Earned income credit: $2,395 (reported on 17.6% of returns )(% of AGI for various income ranges: 121.6% for AGIs below $25k , 76.6% for AGIs $25k-50k , 1.4% for AGIs $50k-75k ) Percentage of individuals using paid preparers for their 2020 taxes: 91.6%(% for various income ranges: 90.0% for AGIs below $25k , 92.2% for AGIs $25k-50k , 91.9% for AGIs $50k-75k , 92.9% for AGIs $75k-100k , 92.2% for AGIs $100k-200k , 93.8% for AGIs over 200k )
Averages for the 2012 tax year for zip code 78653, filed in 2013:
Average Adjusted Gross Income (AGI) in 2012: $45,873 (Individual Income Tax Returns) Here:
$45,873State:
$65,384
Salary/wage: $42,365 (reported on 88.7% of returns )Here:
$42,365State:
$52,524
(% of AGI for various income ranges: 80.0% for AGIs below $25k , 89.1% for AGIs $25k-50k , 86.6% for AGIs $50k-75k , 82.7% for AGIs $75k-100k , 80.9% for AGIs $100k-200k , 51.9% for AGIs over 200k ) Taxable interest for individuals: $935 (reported on 18.5% of returns )This zip code:
$935Texas:
$2,372
(% of AGI for various income ranges: 0.3% for AGIs below $25k , 0.2% for AGIs $25k-50k , 0.3% for AGIs $50k-75k , 0.2% for AGIs $75k-100k , 0.6% for AGIs $100k-200k , 1.1% for AGIs over 200k ) Ordinary dividends: $3,132 (reported on 7.7% of returns )(% of AGI for various income ranges: 0.4% for AGIs below $25k , 0.3% for AGIs $25k-50k , 0.3% for AGIs $50k-75k , 0.4% for AGIs $75k-100k , 0.5% for AGIs $100k-200k , 2.2% for AGIs over 200k ) Net capital gain/loss in AGI: +$12,962 (reported on 6.8% of returns )Here:
+$12,962State:
+$35,319
(% of AGI for various income ranges: 0.1% for AGIs $25k-50k , 0.3% for AGIs $50k-75k , 0.6% for AGIs $75k-100k , 1.5% for AGIs $100k-200k , 16.5% for AGIs over 200k ) Profit/loss from business: +$9,631 (reported on 17.8% of returns )Here:
+$9,631State:
+$13,732
(% of AGI for various income ranges: 11.9% for AGIs below $25k , 4.4% for AGIs $25k-50k , 2.7% for AGIs $50k-75k , 1.6% for AGIs $75k-100k , 2.5% for AGIs $100k-200k , 0.5% for AGIs over 200k ) Taxable individual retirement arrangement distribution: $13,877 (reported on 4.0% of returns )78653:
$13,877Texas:
$19,511
(% of AGI for various income ranges: 0.8% for AGIs below $25k , 0.7% for AGIs $25k-50k , 1.3% for AGIs $50k-75k , 1.1% for AGIs $75k-100k , 2.7% for AGIs $100k-200k ) Total itemized deductions: $17,492 (22% of AGI, reported on 25.4% of returns )Here:
$17,492State:
$24,724
Here:
22.4% of AGIState:
15.9% of AGI
(% of AGI for various income ranges: 6.5% for AGIs below $25k , 8.0% for AGIs $25k-50k , 10.9% for AGIs $50k-75k , 10.8% for AGIs $75k-100k , 11.3% for AGIs $100k-200k , 9.8% for AGIs over 200k ) Charity contributions: $3,769 (reported on 16.6% of returns )(% of AGI for various income ranges: 0.5% for AGIs below $25k , 0.7% for AGIs $25k-50k , 1.4% for AGIs $50k-75k , 1.6% for AGIs $75k-100k , 2.0% for AGIs $100k-200k , 2.6% for AGIs over 200k ) Taxes paid: $5,089 (reported on 25.1% of returns )(% of AGI for various income ranges: 1.7% for AGIs below $25k , 2.2% for AGIs $25k-50k , 3.0% for AGIs $50k-75k , 3.0% for AGIs $75k-100k , 3.6% for AGIs $100k-200k , 3.3% for AGIs over 200k ) Earned income credit: $2,482 (reported on 26.3% of returns )(% of AGI for various income ranges: 9.5% for AGIs below $25k , 1.7% for AGIs $25k-50k ) Percentage of individuals using paid preparers for their 2012 taxes: 39.0%(% for various income ranges: 40.4% for AGIs below $25k , 36.5% for AGIs $25k-50k , 40.0% for AGIs $50k-75k , 38.3% for AGIs $75k-100k , 38.5% for AGIs $100k-200k , 62.5% for AGIs over 200k )
Averages for the 2004 tax year for zip code 78653, filed in 2005:
Average Adjusted Gross Income (AGI) in 2004: $42,658 (Individual Income Tax Returns) Here:
$42,658State:
$47,881
Salary/wage: $38,099 (reported on 88.2% of returns )Here:
$38,099State:
$41,947
(% of AGI for various income ranges: 138.8% for AGIs below $10k , 82.9% for AGIs $10k-25k , 88.8% for AGIs $25k-50k , 86.3% for AGIs $50k-75k , 84.5% for AGIs $75k-100k , 52.5% for AGIs over 100k ) Taxable interest for individuals: $1,294 (reported on 30.3% of returns )This zip code:
$1,294Texas:
$2,255
(% of AGI for various income ranges: 4.1% for AGIs below $10k , 1.0% for AGIs $10k-25k , 0.6% for AGIs $25k-50k , 0.9% for AGIs $50k-75k , 0.3% for AGIs $75k-100k , 1.5% for AGIs over 100k ) Taxable dividends: $2,690 (reported on 11.1% of returns )(% of AGI for various income ranges: 1.9% for AGIs below $10k , 0.5% for AGIs $10k-25k , 0.2% for AGIs $25k-50k , 0.3% for AGIs $50k-75k , 0.3% for AGIs $75k-100k , 2.0% for AGIs over 100k ) Net capital gain/loss: +$16,495 (reported on 12.4% of returns )Here:
+$16,495State:
+$16,110
(% of AGI for various income ranges: -0.9% for AGIs below $10k , 0.4% for AGIs $10k-25k , 0.3% for AGIs $25k-50k , 1.0% for AGIs $50k-75k , 2.1% for AGIs $75k-100k , 17.1% for AGIs over 100k ) Profit/loss from business: +$7,601 (reported on 16.7% of returns )Here:
+$7,601State:
+$11,013
(% of AGI for various income ranges: -2.1% for AGIs below $10k , 7.1% for AGIs $10k-25k , 3.3% for AGIs $25k-50k , 2.3% for AGIs $50k-75k , 0.6% for AGIs $75k-100k , 3.1% for AGIs over 100k ) IRA payment deduction: $2,238 (reported on 1.9% of returns )(% of AGI for various income ranges: 0.2% for AGIs $10k-25k , 0.1% for AGIs $25k-50k , 0.1% for AGIs $50k-75k , 0.1% for AGIs over 100k ) Total itemized deductions: $14,952 (23% of AGI, reported on 31.6% of returns )Here:
$14,952State:
$19,631
Here:
22.6% of AGIState:
18.9% of AGI
(% of AGI for various income ranges: 12.6% for AGIs below $10k , 8.6% for AGIs $10k-25k , 11.1% for AGIs $25k-50k , 13.2% for AGIs $50k-75k , 13.1% for AGIs $75k-100k , 8.9% for AGIs over 100k ) Charity contributions deductions: $2,647 (4% of AGI, reported on 22.1% of returns )Here:
3.6% of AGIState:
4.2% of AGI
(% of AGI for various income ranges: 0.9% for AGIs $10k-25k , 1.0% for AGIs $25k-50k , 1.4% for AGIs $50k-75k , 2.0% for AGIs $75k-100k , 1.7% for AGIs over 100k ) Total tax: $5,799 (reported on 74.4% of returns )(% of AGI for various income ranges: 5.1% for AGIs below $10k , 3.9% for AGIs $10k-25k , 6.6% for AGIs $25k-50k , 8.9% for AGIs $50k-75k , 10.7% for AGIs $75k-100k , 17.7% for AGIs over 100k ) Earned income credit: $1,841 (reported on 18.5% of returns )Percentage of individuals using paid preparers for their 2004 taxes: 50.1%(% for various income ranges: 46.7% for AGIs below $10k , 54.3% for AGIs $10k-25k , 49.4% for AGIs $25k-50k , 45.0% for AGIs $50k-75k , 51.2% for AGIs $75k-100k , 58.5% for AGIs over 100k )
Estimated median household income in 2022: This zip code:
$94,667Texas:
$72,284
Nearest zip codes: 78724 ,
78754 ,
78660 ,
78725 ,
78753 ,
78621 .
Webberville Zip Code Map
Percentage of family households: This zip code:
67.0%Texas:
50.5%
Percentage of households with unmarried partners: This zip code:
6.1%Texas:
48.7%
No gay or lesbian households reported
Household received Food Stamps/SNAP in the past 12 months: 995Household did not receive Food Stamps/SNAP in the past 12 months: 9,590
Women who had a birth in the past 12 months: 725 (371 now married , 346 unmarried) Women who did not have a birth in the past 12 months: 8,149 (4,082 now married , 4,051 unmarried)
Housing units in zip code 78653 with a mortgage: 7,194 (117
second mortgage , 127
both second mortgage and home equity loan )
Median monthly owner costs for units with a mortgage: $1,828
Median monthly owner costs for units without a mortgage: $707
Residents with income below the poverty level in 2022:
This zip code:
10.8%Whole state:
14.0%
Residents with income below 50% of the poverty level in 2022:
This zip code:
7.3%Whole state:
7.4%
Median number of rooms in houses and condos: Median number of rooms in apartments: Notable locations in this zip code not listed on our city pages
Click to draw/clear zip code borders Notable locations in zip code 78653: (A) , Travis County Emergency Services District 12 Station 1 (B) , Germania Hall (C) . Display/hide their locations on the map
Churches in zip code 78653 include: (A) , Kimbro Church (B) , Park Springs Church (C) . Display/hide their locations on the map
Cemeteries: (1) , Brown Cemetery (2) , Woods Cemetery (3) , Easley Cemetery (4) , Hill Cemetery (5) , Glasscock Cemetery (6) , Rosehill Cemetery (7) . Display/hide their locations on the map
Reservoirs: (A) , Sellers Lake (B) . Display/hide their locations on the map
Streams, rivers, and creeks: (A) , Harris Branch (B) , Gilleland Creek (C) , Dry Creek (D) , Cottonwood Creek (E) , Decker Creek (F) . Display/hide their locations on the map
Parks in zip code 78653 include: (1) , Mustang Stadium (2) . Display/hide their locations on the map
Year house built (houses)
709 2020 or later5,876 2010 to 20193,279 2000 to 2009593 1990 to 1999560 1980 to 1989509 1970 to 19792 1960 to 196988 1950 to 195921 1940 to 1949112 1939 or earlier
Zip code 78653 household income distribution in 2022 134 Less than $10,00063 $10,000 to $14,99994 $15,000 to $19,999105 $20,000 to $24,999261 $25,000 to $29,999358 $30,000 to $34,999117 $35,000 to $39,999299 $40,000 to $44,999343 $45,000 to $49,999606 $50,000 to $59,9991,441 $60,000 to $74,9991,927 $75,000 to $99,9991,846 $100,000 to $124,9991,026 $125,000 to $149,9991,043 $150,000 to $199,999895 $200,000 or moreEstimate of home value of owner-occupied houses/condos in 2022 in zip code 78653 95 Less than $10,00087 $15,000 to $19,999103 $25,000 to $29,99974 $30,000 to $34,99917 $35,000 to $39,999158 $40,000 to $49,99954 $50,000 to $59,99969 $60,000 to $69,9999 $70,000 to $79,99910 $80,000 to $89,99918 $90,000 to $99,99958 $100,000 to $124,99967 $125,000 to $149,999199 $150,000 to $174,999611 $175,000 to $199,9991,529 $200,000 to $249,9991,298 $250,000 to $299,9993,074 $300,000 to $399,9991,097 $400,000 to $499,999801 $500,000 to $749,999110 $750,000 to $999,99933 $1,000,000 to $1,499,99975 $2,000,000 or moreRent paid by renters in 2022 in zip code 78653 119 $400 to $44928 $500 to $5499 $650 to $69944 $900 to $999281 $1,000 to $1,249184 $1,250 to $1,499454 $1,500 to $1,999152 $2,000 to $2,49939 $2,500 to $2,99975 No cash rent
Median gross rent in 2022: $1,738.
Median price asked for vacant for-sale houses and condos in 2022: $319,221.
Estimated median house (or condo) value in 2022 for: White Non-Hispanic householders: $419,818Black or African American householders: $241,664American Indian or Alaska Native householders: $73,281Asian householders: $276,839Some other race householders: $217,237Two or more races householders: $89,565Hispanic or Latino householders: $205,186Estimated median house or condo value in 2022: $333,836
78653:
$333,836Texas:
$275,400
Lower value quartile - upper value quartile: $247,976 - $429,508
Mean price in 2022: Detached houses: $225,844Here:
$225,844State:
$369,058
Townhouses or other attached units: $125,109Here:
$125,109State:
$327,631
Mobile homes: $196,346Here:
$196,346State:
$124,413
Housing units in structures:
One, detached: 9,824One, attached: 1843 or 4: 95 to 9: 8310 to 19: 8750 or more: 145Mobile homes: 681Unemployment : 4.6%
Means of transportation to work in zip code 78653 64.7% 10,673 Drove a car alone16.8% 2,775 Carpooled0.0% 5 Bus or trolley bus1.1% 185 Walked0.6% 101 Other means18.1% 2,989 Worked at homeTravel time to work (commute) in zip code 78653 271 Less than 5 minutes349 5 to 9 minutes789 10 to 14 minutes1,007 15 to 19 minutes1,734 20 to 24 minutes1,522 25 to 29 minutes2,840 30 to 34 minutes577 35 to 39 minutes744 40 to 44 minutes1,799 45 to 59 minutes1,908 60 to 89 minutes113 90 or more minutes
Percentage of zip code residents living and working in this county: 88.3%
Household type by relationship:
Households: 33,768
Male householders: 5,809 (738 living alone ), Female householders: 4,784 (710 living alone )5,896 spouses (5,850 opposite-sex spouses ), 936 unmarried partners , (772 opposite-sex unmarried partners ), 12,073 children (10,518 natural , 748 adopted , 816 stepchildren ), 1,769 grandchildren , 235 brothers or sisters , 682 parents , 64 foster children , 463 other relatives , 930 non-relatives In group quarters: 35 (-1 institutionalized population )
Size of family households: 2,130 2-persons , 2,353 3-persons , 1,332 4-persons , 1,484 5-persons , 713 6-persons , 292 7-or-more-persons
Size of nonfamily households: 1,447 1-person , 635 2-persons , 89 3-persons , 50 7-or-more-persons
7,020 married couples with children. single-parent households (445 men , 1,421 women ).
52.5% of residents of 78653 zip code speak English at home. of residents speak Spanish at home (71% very well, 15% well, 9% not well, 5% not at all ).of residents speak other Indo-European language at home (82% very well, 18% well ).of residents speak Asian or Pacific Island language at home (72% very well, 26% well, 2% not well ).of residents speak other language at home (93% very well, 7% well ).
Foreign born population: 5,894 (17.5%)
(40.0%
of them are naturalized citizens )
This zip code:
17.5%Whole state:
17.2%
66% Honduras 6% Guatemala 4% Liberia 2% Thailand 2% Costa Rica 2% Barbados 1% Cabo Verde 2% English 2% German 2% Nigerian 2% American 1% European 1% Irish 1% Scottish
Year of entry for the foreign-born population
1,601 2010 or later 2,015 2000 to 2009 1,725 1990 to 1999 1,227 Before 1990
Facilities with environmental interests located in this zip code:
A R MACHINING INC (967 CALDWELL in MANOR, TX)
(Resource Conservation and Recovery Act (tracking hazardous waste)) Business NAICS classification: AIRCRAFT ENGINE AND ENGINE PARTS MANUFACTURING.Alternative names: AR MACHINING INC
ANDERSON MACHINERY COMPANY (12711 HWY 290 E 2 MI E OF in MANOR, TX)
(Resource Conservation and Recovery Act (tracking hazardous waste))
Housing units lacking complete plumbing facilities: 1.3%
Housing units lacking complete kitchen facilities: 1.4%
72.3% Electricity 21.8% Utility gas 4.7% Bottled, tank, or LP gas 0.6% Solar energy
Population in 1990: 5,359.
Place of birth for U.S.-born residents:
This state: 19,980Northeast: 665Midwest: 1,617South: 1,695West: 3,142
60% of the 78653 zip code residents lived in the same house 5 years ago.
Out of people who lived in different houses, 76% lived in this county.
Out of people who lived in different counties, 50% lived in Texas.
88% of the 78653 zip code residents lived in the same house 1 year ago.
Out of people who lived in different houses, 36% moved from this county.
Out of people who lived in different houses, 44% moved from different county within same state.
Out of people who lived in different houses, 18% moved from different state.
Out of people who lived in different houses, 5% moved from abroad.
Private vs. public school enrollment:
Students in private schools in grades 1 to 8 (elementary and middle school): 520
Students in private schools in grades 9 to 12 (high school): 160
Students in private undergraduate colleges: 174
Occupation by median earnings in the past 12 months ($)
109,877 Law enforcement workers including supervisors 95,961 Legal occupations 86,775 Computer and mathematical occupations 81,620 Management occupations 78,103 Production occupations 72,331 Health diagnosing and treating practitioners and other technical occupations
Companies with federal contracts located in this zip code (MANOR, TX):
CAPITAL CITY COMMUNICATIONS, I (6920B LEE MANOR COVE #400A; small business) in 9 contracts from 2000 to 2005
Contracts for Installation of Equipment -- Communication, Detection, and Coherent Radiation Equipment, Installation of Equipment -- Fiber Optics Materials, Components, Assemblies, and Accessories, Miscellaneous Communication Equipment, Cable, Cord, and Wire Assemblies: Communications Equipment, and more by ArmySigned by year: 2000: $27,610; 2001: $0; 2002: $4,219; 2003: $32,034; 2004: $10,958; 2005: $168,200; 2006: $0.
Biggest contracts: with Army for Installation of Equipment -- Communication, Detection, and Coherent Radiation Equipment. Signed on 2005-05-06. Completion date: 2005-06-15.
with Army for Installation of Equipment -- Fiber Optics Materials, Components, Assemblies, and Accessories. Signed on 2005-10-11. Completion date: 2006-09-30.
, same as above. Signed on 2005-03-24. Completion date: 2005-09-30.
with Army for Miscellaneous Communication Equipment. Signed on 2000-03-30. Completion date: 2000-03-27.
BRISTLECONE VENTURES LLC (14225 FM 973 NORTH; small business)
$17,400 with Army for Specialized Shipping and Storage Containers. Signed on 2005-04-29. Completion date: 2005-04-29.
SIDDONS FIRE APPARATUS, INC (12717 BELTEX DR; small business)
$4,966 with Navy for Maintenance, Repair and Rebuilding of Equipment -- Fire Fighting, Rescue, and Safety Equipment; and Environmental Protection Equipment and Materials. Signed on 2004-06-22. Completion date: 2004-07-23.
OCLANSPILL INC (13320 MIZZEN ST; small business)
$4,929 with Defense Logistics Agency for Hazardous Material Spill Containment and Clean-up Equipment and Material. Signed on 2006-04-07. Completion date: 2006-05-11.
Top industries in this zip code by the number of employees in 2005:
Administrative and Support and Waste Management and Remediation Services: Office Administrative Services (250-499 employees: 1 establishment)Construction: Plumbing, Heating, and Air-Conditioning Contractors (50-99: 1, 20-49: 1, 1-4: 3)Administrative and Support and Waste Management and Remediation Services: Landscaping Services (50-99: 1, 10-19: 1, 1-4: 4)Construction: Electrical Contractors (20-49: 2, 5-9: 1, 1-4: 1)Accommodation and Food Services: Full-Service Restaurants (20-49: 1, 10-19: 1, 1-4: 1)Wholesale Trade: Construction and Mining (except Oil Well) Machinery and Equipment Merchant Wholesalers (20-49: 1, 10-19: 1)Mining: Construction Sand and Gravel Mining (20-49: 1, 1-4: 1)Accommodation and Food Services: Limited-Service Restaurants (20-49: 1)Other Services (except Public Administration): Religious Organizations (5-9: 3, 1-4: 3)
People in group quarters in 2010:
5 people in group homes intended for adults
3 people in workers' group living quarters and job corps centers
Fatal accident statistics in 2014:
Fatal accident count: 5Vehicles involved in fatal accidents: 9Fatal accidents caused by drunken drivers: 2Fatalities: 6Persons involved in fatal accidents: 12Pedestrians involved in fatal accidents: 0
Fatal accident statistics in 2013:
Fatal accident count: 5Vehicles involved in fatal accidents: 7Fatal accidents caused by drunken drivers: 2Fatalities: 5Persons involved in fatal accidents: 12Pedestrians involved in fatal accidents: 0
Home Mortgage Disclosure Act Aggregated Statistics For Year 2009(Based on 8 partial tracts) A) FHA, FSA/RHS & VA B) Conventional C) Refinancings D) Home Improvement Loans F) Non-occupant Loans on G) Loans On Manufactured Number Average Value Number Average Value Number Average Value Number Average Value Number Average Value Number Average Value
LOANS ORIGINATED 972 $149,194 337 $122,092 739 $147,590 28 $33,070 57 $119,892 56 $42,038 APPLICATIONS APPROVED, NOT ACCEPTED 51 $142,327 59 $58,758 94 $142,251 7 $26,481 6 $120,490 48 $35,705 APPLICATIONS DENIED 270 $133,357 72 $98,075 392 $153,043 96 $26,279 36 $116,451 33 $50,167 APPLICATIONS WITHDRAWN 141 $144,736 74 $145,488 262 $149,616 12 $20,159 22 $118,230 2 $104,305 FILES CLOSED FOR INCOMPLETENESS 19 $123,834 9 $126,153 61 $152,266 8 $83,601 3 $97,720 1 $111,110
Aggregated Statistics For Year 2008(Based on 8 partial tracts) A) FHA, FSA/RHS & VA B) Conventional C) Refinancings D) Home Improvement Loans F) Non-occupant Loans on G) Loans On Manufactured Number Average Value Number Average Value Number Average Value Number Average Value Number Average Value Number Average Value
LOANS ORIGINATED 721 $152,014 676 $132,240 341 $143,624 64 $41,962 119 $120,794 83 $50,583 APPLICATIONS APPROVED, NOT ACCEPTED 45 $137,890 127 $123,759 78 $126,951 24 $42,092 18 $107,953 35 $49,151 APPLICATIONS DENIED 168 $141,514 161 $119,169 446 $149,871 189 $33,863 53 $126,146 53 $50,124 APPLICATIONS WITHDRAWN 115 $158,942 120 $144,441 179 $143,941 21 $65,868 28 $104,302 5 $86,760 FILES CLOSED FOR INCOMPLETENESS 12 $136,706 33 $121,502 37 $158,321 9 $35,668 10 $146,252 4 $48,718
Aggregated Statistics For Year 2007(Based on 8 partial tracts) A) FHA, FSA/RHS & VA B) Conventional C) Refinancings D) Home Improvement Loans F) Non-occupant Loans on G) Loans On Manufactured Number Average Value Number Average Value Number Average Value Number Average Value Number Average Value Number Average Value
LOANS ORIGINATED 649 $148,754 1,528 $120,650 280 $130,043 63 $31,213 255 $119,401 96 $47,452 APPLICATIONS APPROVED, NOT ACCEPTED 32 $122,987 192 $107,630 81 $124,001 20 $46,215 40 $104,366 29 $47,044 APPLICATIONS DENIED 97 $140,552 384 $104,941 533 $129,946 175 $36,579 100 $98,652 99 $52,207 APPLICATIONS WITHDRAWN 96 $152,948 215 $139,389 202 $126,115 22 $50,682 31 $119,261 9 $53,594 FILES CLOSED FOR INCOMPLETENESS 6 $118,370 52 $127,587 65 $149,986 6 $30,023 8 $109,342 0 $0
Aggregated Statistics For Year 2006(Based on 8 partial tracts) A) FHA, FSA/RHS & VA B) Conventional C) Refinancings D) Home Improvement Loans F) Non-occupant Loans on G) Loans On Manufactured Number Average Value Number Average Value Number Average Value Number Average Value Number Average Value Number Average Value
LOANS ORIGINATED 548 $142,796 2,135 $99,730 284 $119,335 62 $31,172 547 $91,659 46 $60,898 APPLICATIONS APPROVED, NOT ACCEPTED 21 $153,810 281 $92,643 50 $157,749 21 $32,018 76 $98,627 21 $57,949 APPLICATIONS DENIED 118 $129,303 439 $97,653 499 $131,787 171 $40,780 117 $106,573 67 $56,541 APPLICATIONS WITHDRAWN 138 $145,754 387 $117,115 297 $125,638 19 $78,524 89 $108,232 5 $96,008 FILES CLOSED FOR INCOMPLETENESS 4 $114,262 69 $109,440 61 $123,786 3 $21,583 18 $103,127 0 $0
Aggregated Statistics For Year 2005(Based on 8 partial tracts) A) FHA, FSA/RHS & VA B) Conventional C) Refinancings D) Home Improvement Loans E) Loans on Dwellings For 5+ Families F) Non-occupant Loans on G) Loans On Manufactured Number Average Value Number Average Value Number Average Value Number Average Value Number Average Value Number Average Value Number Average Value
LOANS ORIGINATED 518 $129,059 1,879 $90,130 403 $121,783 69 $73,069 1 $2,451,000 559 $85,318 55 $56,374 APPLICATIONS APPROVED, NOT ACCEPTED 19 $122,846 248 $78,790 81 $118,496 16 $33,291 0 $0 49 $84,153 40 $55,468 APPLICATIONS DENIED 82 $119,791 421 $83,009 630 $115,838 117 $43,540 0 $0 101 $96,842 107 $50,019 APPLICATIONS WITHDRAWN 68 $138,967 304 $99,465 324 $132,980 51 $189,744 0 $0 95 $103,949 16 $80,956 FILES CLOSED FOR INCOMPLETENESS 5 $153,938 45 $99,889 123 $134,379 2 $90,910 0 $0 12 $89,213 0 $0
Aggregated Statistics For Year 2004(Based on 8 partial tracts) A) FHA, FSA/RHS & VA B) Conventional C) Refinancings D) Home Improvement Loans E) Loans on Dwellings For 5+ Families F) Non-occupant Loans on G) Loans On Manufactured Number Average Value Number Average Value Number Average Value Number Average Value Number Average Value Number Average Value Number Average Value
LOANS ORIGINATED 511 $121,500 994 $92,734 538 $112,385 50 $44,574 4 $5,979,235 185 $85,360 82 $52,111 APPLICATIONS APPROVED, NOT ACCEPTED 31 $117,547 145 $77,372 119 $107,734 10 $28,473 0 $0 24 $91,864 50 $53,228 APPLICATIONS DENIED 74 $116,040 255 $75,286 639 $103,774 101 $30,523 0 $0 47 $77,068 144 $49,835 APPLICATIONS WITHDRAWN 63 $125,263 147 $99,414 392 $119,621 15 $45,993 0 $0 37 $96,899 11 $77,129 FILES CLOSED FOR INCOMPLETENESS 9 $104,630 22 $102,890 88 $122,578 3 $28,330 0 $0 3 $109,400 1 $81,920
Aggregated Statistics For Year 2003(Based on 8 partial tracts) A) FHA, FSA/RHS & VA B) Conventional C) Refinancings D) Home Improvement Loans F) Non-occupant Loans on Number Average Value Number Average Value Number Average Value Number Average Value Number Average Value
LOANS ORIGINATED 606 $123,111 656 $99,202 1,120 $115,269 34 $26,945 71 $93,958 APPLICATIONS APPROVED, NOT ACCEPTED 16 $121,852 100 $79,848 162 $102,394 25 $53,643 22 $85,744 APPLICATIONS DENIED 91 $123,654 293 $69,357 515 $103,020 83 $23,735 29 $92,201 APPLICATIONS WITHDRAWN 72 $130,438 140 $120,807 502 $109,583 4 $96,908 25 $84,996 FILES CLOSED FOR INCOMPLETENESS 7 $102,497 17 $121,295 65 $113,141 0 $0 3 $152,250
Aggregated Statistics For Year 2002(Based on 4 partial tracts) A) FHA, FSA/RHS & VA B) Conventional C) Refinancings D) Home Improvement Loans F) Non-occupant Loans on Number Average Value Number Average Value Number Average Value Number Average Value Number Average Value
LOANS ORIGINATED 225 $105,462 102 $73,624 211 $101,537 25 $20,211 16 $63,845 APPLICATIONS APPROVED, NOT ACCEPTED 9 $107,783 28 $56,032 45 $86,669 2 $42,035 3 $76,227 APPLICATIONS DENIED 36 $97,278 87 $63,670 137 $79,815 52 $12,740 5 $58,570 APPLICATIONS WITHDRAWN 30 $106,503 14 $116,797 116 $94,421 7 $22,027 4 $169,392 FILES CLOSED FOR INCOMPLETENESS 3 $112,047 11 $76,237 14 $122,586 2 $9,490 1 $81,920
Aggregated Statistics For Year 2001(Based on 4 partial tracts) A) FHA, FSA/RHS & VA B) Conventional C) Refinancings D) Home Improvement Loans F) Non-occupant Loans on Number Average Value Number Average Value Number Average Value Number Average Value Number Average Value
LOANS ORIGINATED 146 $105,699 135 $76,933 171 $100,277 28 $22,783 22 $84,330 APPLICATIONS APPROVED, NOT ACCEPTED 9 $105,632 42 $70,260 40 $83,633 4 $28,852 5 $71,328 APPLICATIONS DENIED 16 $103,458 138 $53,783 106 $68,393 34 $15,811 6 $57,317 APPLICATIONS WITHDRAWN 6 $119,337 9 $92,854 81 $80,370 11 $12,580 1 $93,910 FILES CLOSED FOR INCOMPLETENESS 3 $113,787 2 $134,765 28 $77,483 0 $0 0 $0
Aggregated Statistics For Year 2000(Based on 4 partial tracts) A) FHA, FSA/RHS & VA B) Conventional C) Refinancings D) Home Improvement Loans F) Non-occupant Loans on Number Average Value Number Average Value Number Average Value Number Average Value Number Average Value
LOANS ORIGINATED 175 $100,111 147 $68,054 51 $85,484 18 $20,513 13 $63,488 APPLICATIONS APPROVED, NOT ACCEPTED 22 $94,686 65 $55,885 16 $82,806 9 $29,557 6 $50,780 APPLICATIONS DENIED 30 $100,220 175 $49,394 58 $56,709 24 $10,897 10 $43,570 APPLICATIONS WITHDRAWN 28 $101,228 17 $79,856 22 $80,298 3 $18,647 2 $81,815 FILES CLOSED FOR INCOMPLETENESS 2 $100,900 5 $77,436 20 $83,230 1 $69,930 0 $0
Aggregated Statistics For Year 1999(Based on 4 partial tracts) A) FHA, FSA/RHS & VA B) Conventional C) Refinancings D) Home Improvement Loans F) Non-occupant Loans on Number Average Value Number Average Value Number Average Value Number Average Value Number Average Value
LOANS ORIGINATED 293 $107,078 396 $76,211 155 $85,084 35 $22,145 32 $63,619 APPLICATIONS APPROVED, NOT ACCEPTED 11 $97,495 104 $57,335 62 $59,103 14 $19,519 10 $54,701 APPLICATIONS DENIED 27 $102,315 420 $51,217 85 $68,141 48 $15,497 25 $50,945 APPLICATIONS WITHDRAWN 41 $115,215 57 $99,306 49 $84,478 2 $12,140 3 $91,047 FILES CLOSED FOR INCOMPLETENESS 3 $116,473 7 $98,457 25 $79,831 1 $101,180 1 $93,590
Detailed HMDA statistics for the following Tracts:
0018.37
,
0018.42 ,
0022.05 ,
0022.06
Private Mortgage Insurance Companies Aggregated Statistics For Year 2009(Based on 8 partial tracts) A) Conventional B) Refinancings C) Non-occupant Loans on Number Average Value Number Average Value Number Average Value
LOANS ORIGINATED 61 $176,172 52 $165,768 3 $210,513 APPLICATIONS APPROVED, NOT ACCEPTED 18 $180,259 22 $162,397 3 $135,097 APPLICATIONS DENIED 6 $157,275 9 $191,358 0 $0 APPLICATIONS WITHDRAWN 3 $166,783 10 $186,051 0 $0 FILES CLOSED FOR INCOMPLETENESS 1 $194,450 1 $154,410 0 $0
Aggregated Statistics For Year 2008(Based on 8 partial tracts) A) Conventional B) Refinancings C) Non-occupant Loans on D) Loans On Manufactured Number Average Value Number Average Value Number Average Value Number Average Value
LOANS ORIGINATED 305 $169,286 46 $163,403 40 $123,544 2 $108,390 APPLICATIONS APPROVED, NOT ACCEPTED 104 $167,980 20 $180,274 17 $121,448 0 $0 APPLICATIONS DENIED 24 $136,493 0 $0 6 $83,133 0 $0 APPLICATIONS WITHDRAWN 10 $131,782 1 $107,890 5 $137,164 0 $0 FILES CLOSED FOR INCOMPLETENESS 11 $167,794 2 $142,565 2 $95,655 0 $0
Aggregated Statistics For Year 2007(Based on 8 partial tracts) A) Conventional B) Refinancings C) Non-occupant Loans on D) Loans On Manufactured Number Average Value Number Average Value Number Average Value Number Average Value
LOANS ORIGINATED 423 $152,153 26 $169,403 52 $132,702 0 $0 APPLICATIONS APPROVED, NOT ACCEPTED 62 $166,289 7 $176,713 9 $130,232 0 $0 APPLICATIONS DENIED 7 $148,777 1 $107,890 2 $96,905 1 $85,910 APPLICATIONS WITHDRAWN 15 $149,611 0 $0 2 $209,560 0 $0 FILES CLOSED FOR INCOMPLETENESS 5 $129,056 2 $158,500 0 $0 0 $0
Aggregated Statistics For Year 2006(Based on 8 partial tracts) A) Conventional B) Refinancings C) Non-occupant Loans on D) Loans On Manufactured Number Average Value Number Average Value Number Average Value Number Average Value
LOANS ORIGINATED 228 $145,598 18 $153,481 41 $144,062 2 $84,450 APPLICATIONS APPROVED, NOT ACCEPTED 27 $152,602 5 $189,210 7 $149,494 0 $0 APPLICATIONS DENIED 5 $169,018 1 $135,620 1 $178,500 0 $0 APPLICATIONS WITHDRAWN 6 $136,302 2 $164,835 1 $92,910 0 $0 FILES CLOSED FOR INCOMPLETENESS 1 $174,840 0 $0 0 $0 0 $0
Aggregated Statistics For Year 2005(Based on 8 partial tracts) A) Conventional B) Refinancings C) Non-occupant Loans on D) Loans On Manufactured Number Average Value Number Average Value Number Average Value Number Average Value
LOANS ORIGINATED 144 $136,373 34 $137,446 54 $120,864 4 $67,128 APPLICATIONS APPROVED, NOT ACCEPTED 25 $123,381 11 $129,992 11 $110,005 0 $0 APPLICATIONS DENIED 5 $125,602 0 $0 1 $201,510 1 $169,830 APPLICATIONS WITHDRAWN 9 $107,284 0 $0 2 $97,420 1 $42,960 FILES CLOSED FOR INCOMPLETENESS 1 $79,920 1 $129,870 0 $0 1 $129,870
Aggregated Statistics For Year 2004(Based on 8 partial tracts) A) Conventional B) Refinancings C) Non-occupant Loans on D) Loans On Manufactured Number Average Value Number Average Value Number Average Value Number Average Value
LOANS ORIGINATED 118 $128,965 41 $135,885 33 $106,703 1 $56,370 APPLICATIONS APPROVED, NOT ACCEPTED 17 $111,402 23 $150,957 6 $113,283 1 $99,900 APPLICATIONS DENIED 5 $97,636 1 $99,900 1 $107,890 0 $0 APPLICATIONS WITHDRAWN 10 $152,938 3 $166,807 1 $107,890 0 $0 FILES CLOSED FOR INCOMPLETENESS 2 $84,415 3 $152,507 2 $71,910 0 $0
Aggregated Statistics For Year 2003(Based on 8 partial tracts) A) Conventional B) Refinancings C) Non-occupant Loans on Number Average Value Number Average Value Number Average Value
LOANS ORIGINATED 126 $146,568 135 $133,216 10 $100,658 APPLICATIONS APPROVED, NOT ACCEPTED 14 $151,813 39 $133,618 2 $104,170 APPLICATIONS DENIED 4 $139,562 0 $0 0 $0 APPLICATIONS WITHDRAWN 11 $158,542 11 $150,261 1 $228,770 FILES CLOSED FOR INCOMPLETENESS 1 $88,210 1 $111,110 0 $0
Aggregated Statistics For Year 2002(Based on 4 partial tracts) A) Conventional B) Refinancings C) Non-occupant Loans on Number Average Value Number Average Value Number Average Value
LOANS ORIGINATED 32 $108,323 19 $107,364 6 $85,812 APPLICATIONS APPROVED, NOT ACCEPTED 2 $115,955 6 $96,945 0 $0 APPLICATIONS DENIED 0 $0 1 $92,910 0 $0 APPLICATIONS WITHDRAWN 4 $58,365 4 $109,080 2 $65,160 FILES CLOSED FOR INCOMPLETENESS 0 $0 0 $0 0 $0
Aggregated Statistics For Year 2001(Based on 4 partial tracts) A) Conventional B) Refinancings C) Non-occupant Loans on Number Average Value Number Average Value Number Average Value
LOANS ORIGINATED 26 $114,405 17 $121,530 4 $79,925 APPLICATIONS APPROVED, NOT ACCEPTED 1 $123,880 4 $104,895 0 $0 APPLICATIONS DENIED 4 $116,882 1 $144,810 0 $0 APPLICATIONS WITHDRAWN 3 $107,227 3 $123,210 0 $0 FILES CLOSED FOR INCOMPLETENESS 0 $0 0 $0 0 $0
Aggregated Statistics For Year 2000(Based on 4 partial tracts) A) Conventional B) Refinancings C) Non-occupant Loans on Number Average Value Number Average Value Number Average Value
LOANS ORIGINATED 31 $100,261 11 $120,473 5 $74,698 APPLICATIONS APPROVED, NOT ACCEPTED 5 $141,124 3 $116,217 0 $0 APPLICATIONS DENIED 2 $129,870 1 $85,910 0 $0 APPLICATIONS WITHDRAWN 2 $73,425 0 $0 1 $27,970 FILES CLOSED FOR INCOMPLETENESS 0 $0 1 $130,870 0 $0
Aggregated Statistics For Year 1999(Based on 4 partial tracts) A) Conventional B) Refinancings C) Non-occupant Loans on Number Average Value Number Average Value Number Average Value
LOANS ORIGINATED 62 $129,480 21 $119,372 1 $45,960 APPLICATIONS APPROVED, NOT ACCEPTED 7 $141,949 4 $132,862 0 $0 APPLICATIONS DENIED 3 $149,353 1 $127,580 0 $0 APPLICATIONS WITHDRAWN 2 $124,295 0 $0 0 $0 FILES CLOSED FOR INCOMPLETENESS 1 $83,380 0 $0 0 $0
Detailed PMIC statistics for the following Tracts:
0018.37
,
0018.42 ,
0022.05 ,
0022.06
2002 - 2018 National Fire Incident Reporting System (NFIRS) incidents See full 2006 National Fire Incident Reporting System statistics for zip code 78653, Texas
Most common first names in zip code 78653 among deceased individuals Name Count Lived (average)
John 27 73.4 years Willie 17 75.6 years William 17 71.8 years Mary 15 76.9 years James 14 71.0 years George 13 76.3 years Robert 13 71.7 years Annie 10 82.3 years Henry 10 77.2 years Albert 10 71.0 years
Most common last names in zip code 78653 among deceased individuals Last name Count Lived (average)
Johnson 24 75.8 years Anderson 20 79.8 years Smith 13 80.8 years Davis 12 82.1 years Carlson 11 83.4 years Brown 11 70.1 years Jones 10 71.6 years Gonzales 9 73.8 years Alexander 8 75.2 years Hill 8 72.5 years
Businesses in zip code 78653
Name Count Name Count
Cricket Wireless 1 SONIC Drive-In 1 Ford 1 Subway 2 Quality 1 U-Haul 1

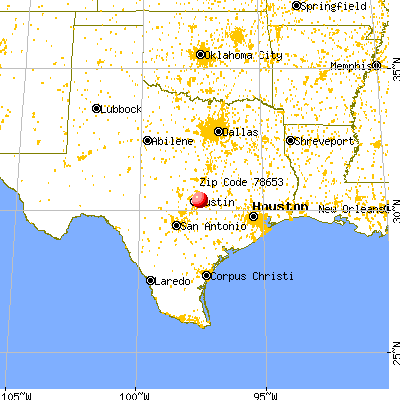


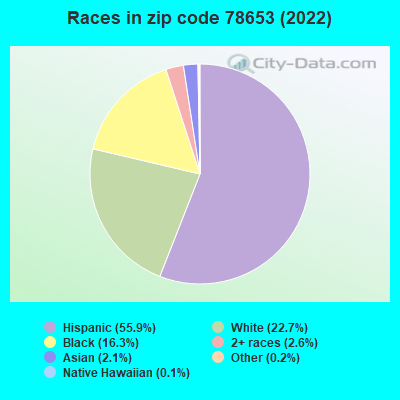


 Nearest zip codes: 78724, 78754, 78660, 78725, 78753, 78621.
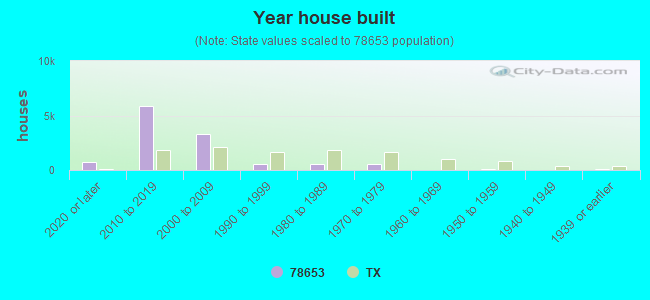

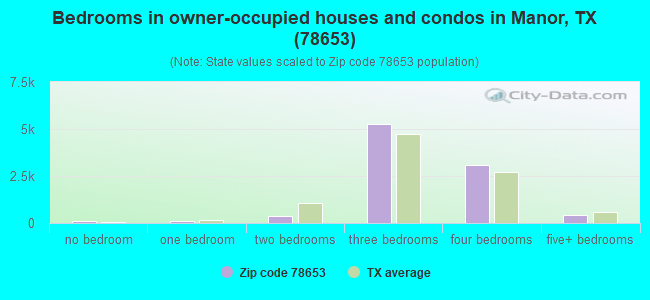
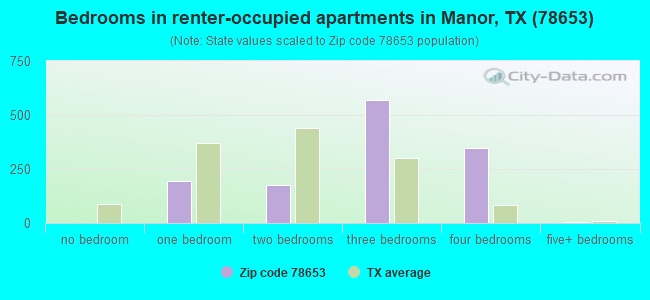
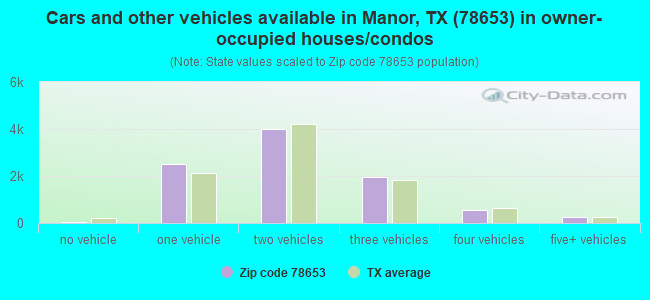
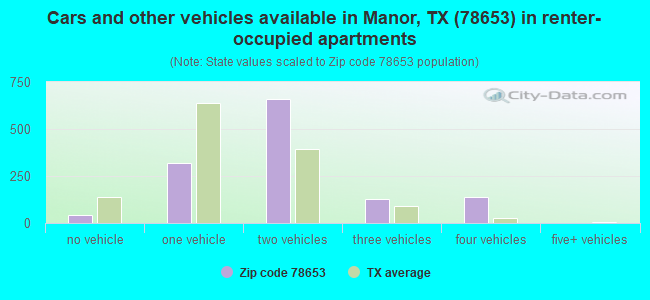


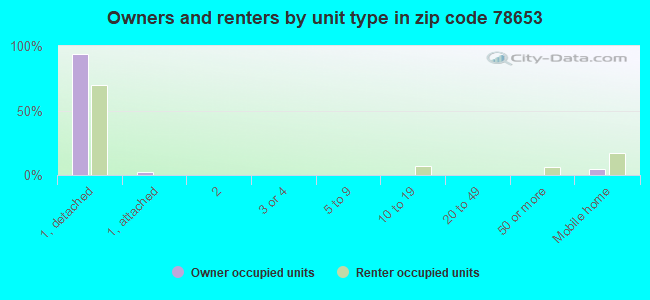
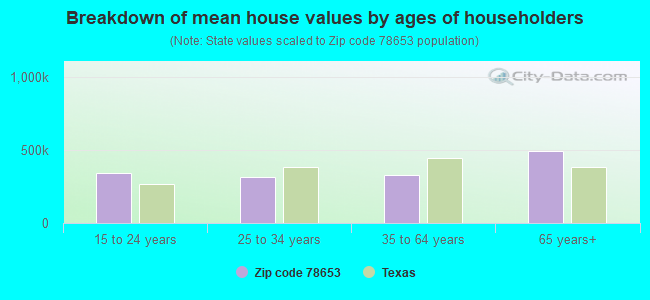


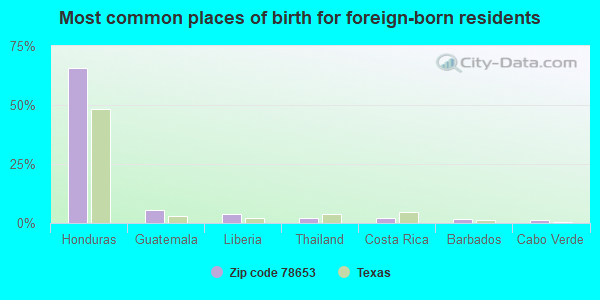
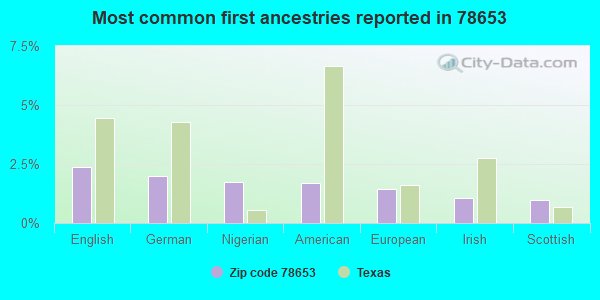


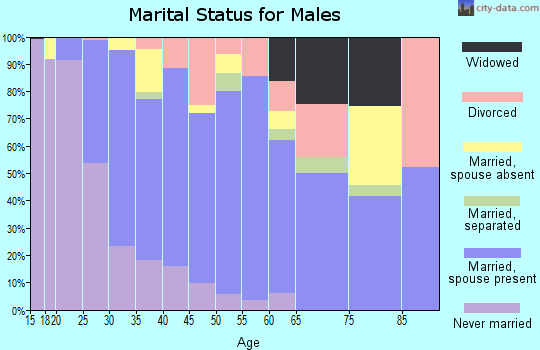

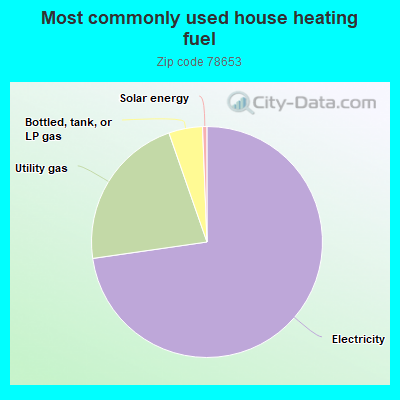
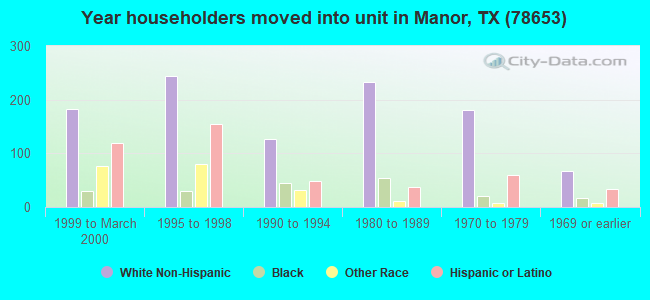
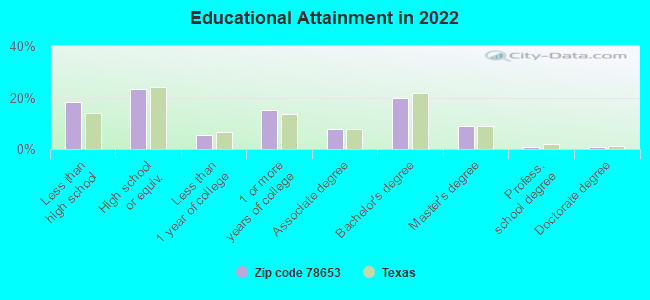
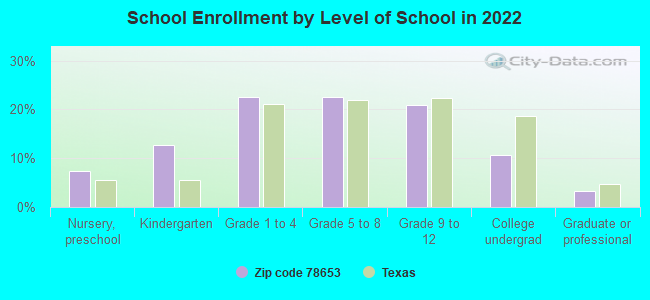
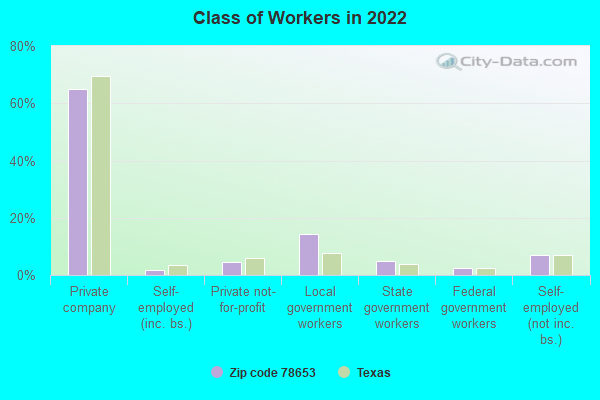

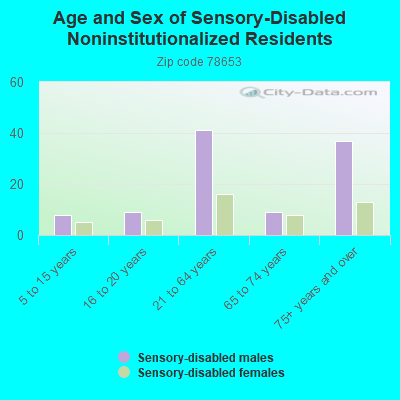
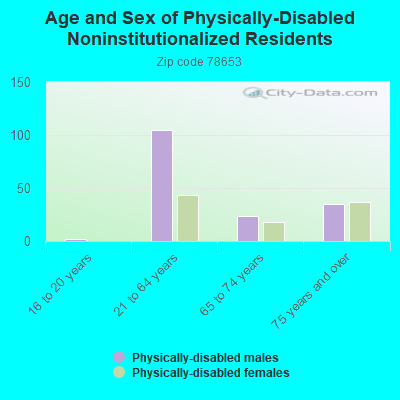
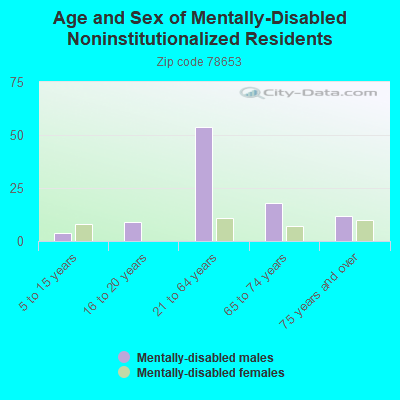
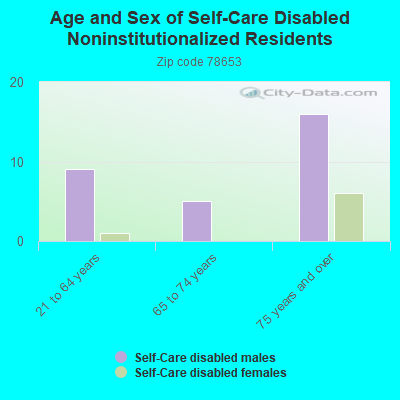
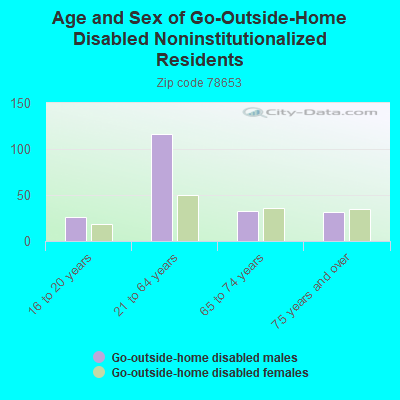

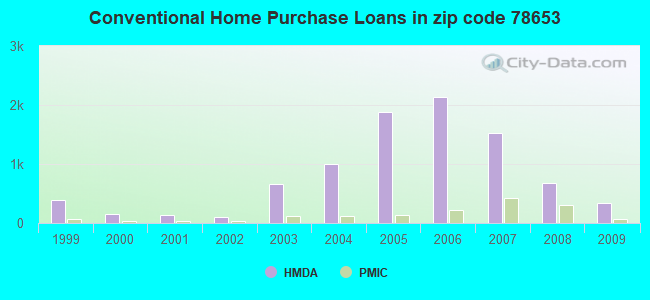
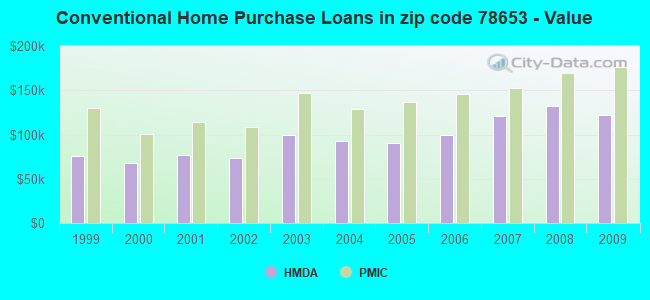
 Based on the data from the years 2002 - 2018 the average number of fire incidents per year is 84. The highest number of fires - 152 took place in 2016, and the least - 12 in 2006. The data has a growing trend.
 When looking into fire subcategories, the most reports belonged to: Outside Fires (56.7%), and Structure Fires (22.9%).