Estimated zip code population in 2022: 29,092
Zip code population in 2010: 21,696
Zip code population in 2000: 15,428
Houses and condos: 9,125
Renter-occupied apartments: 3,000
% of renters here:
34%State:
38%
March 2022 cost of living index in zip code 78724: 92.7
(less than average, U.S. average is 100)
Land area: 24.7
sq. mi.
Water area: 2.0
sq. mi.
Population density: 1,177 people per square mile (low).
OSM Map
General Map
Google Map
MSN Map
OSM Map
General Map
Google Map
MSN Map
OSM Map
General Map
Google Map
MSN Map
OSM Map
General Map
Google Map
MSN Map
Please wait while loading the map...
Real estate property taxes paid for housing units in 2022:
This zip code:
1.1% ($2,778)Texas:
1.5% ($4,050)
Median real estate property taxes paid for housing units with mortgages in 2022: $4,474 (0.7%)
Median real estate property taxes paid for housing units with no mortgage in 2022: $685 (0.1%)
Profiles of local businesses
Business Search - 14 Million verified businesses
Males: 16,121 Females: 12,971
For population 25 years and over in 78724:
High school or higher: 71.2%Bachelor's degree or higher: 23.4%Graduate or professional degree: 8.4%Unemployed: 5.3%Mean travel time to work (commute): 30.0 minutes
For population 15 years and over in 78724:
Never married: 41.4%Now married: 42.7%Separated: 3.0%Widowed: 1.5%Divorced: 11.5%
Zip code 78724 compared to state average:
Foreign-born population percentage above state average. Length of stay since moving in significantly above state average. House age below state average. Percentage of population with a bachelor's degree or higher below state average. 19,552 67.2% Hispanic or Latino 4,451 15.3% Black 3,772 13.0% White 665 2.3% Two or more races 500 1.7% Asian 108 0.4% American Indian 41 0.1% Native Hawaiian and Other
Data:
Median household income ($)
Median household income (% change since 2000)
Household income diversity
Ratio of average income to average house value (%)
Ratio of average income to average rent
Median household income ($) - White
Median household income ($) - Black or African American
Median household income ($) - Asian
Median household income ($) - Hispanic or Latino
Median household income ($) - American Indian and Alaska Native
Median household income ($) - Multirace
Median household income ($) - Other Race
Median household income for houses/condos with a mortgage ($)
Median household income for apartments without a mortgage ($)
Races - White alone (%)
Races - White alone (% change since 2000)
Races - Black alone (%)
Races - Black alone (% change since 2000)
Races - American Indian alone (%)
Races - American Indian alone (% change since 2000)
Races - Asian alone (%)
Races - Asian alone (% change since 2000)
Races - Hispanic (%)
Races - Hispanic (% change since 2000)
Races - Native Hawaiian and Other Pacific Islander alone (%)
Races - Native Hawaiian and Other Pacific Islander alone (% change since 2000)
Races - Two or more races (%)
Races - Two or more races (% change since 2000)
Races - Other race alone (%)
Races - Other race alone (% change since 2000)
Racial diversity
Unemployment (%)
Unemployment (% change since 2000)
Unemployment (%) - White
Unemployment (%) - Black or African American
Unemployment (%) - Asian
Unemployment (%) - Hispanic or Latino
Unemployment (%) - American Indian and Alaska Native
Unemployment (%) - Multirace
Unemployment (%) - Other Race
Population density (people per square mile)
Population - Males (%)
Population - Females (%)
Population - Males (%) - White
Population - Males (%) - Black or African American
Population - Males (%) - Asian
Population - Males (%) - Hispanic or Latino
Population - Males (%) - American Indian and Alaska Native
Population - Males (%) - Multirace
Population - Males (%) - Other Race
Population - Females (%) - White
Population - Females (%) - Black or African American
Population - Females (%) - Asian
Population - Females (%) - Hispanic or Latino
Population - Females (%) - American Indian and Alaska Native
Population - Females (%) - Multirace
Population - Females (%) - Other Race
Coronavirus confirmed cases (Apr 27, 2024)
Deaths caused by coronavirus (Apr 27, 2024)
Coronavirus confirmed cases (per 100k population) (Apr 27, 2024)
Deaths caused by coronavirus (per 100k population) (Apr 27, 2024)
Daily increase in number of cases (Apr 27, 2024)
Weekly increase in number of cases (Apr 27, 2024)
Cases doubled (in days) (Apr 27, 2024)
Hospitalized patients (Apr 18, 2022)
Negative test results (Apr 18, 2022)
Total test results (Apr 18, 2022)
COVID Vaccine doses distributed (per 100k population) (Sep 19, 2023)
COVID Vaccine doses administered (per 100k population) (Sep 19, 2023)
COVID Vaccine doses distributed (Sep 19, 2023)
COVID Vaccine doses administered (Sep 19, 2023)
Likely homosexual households (%)
Likely homosexual households (% change since 2000)
Likely homosexual households - Lesbian couples (%)
Likely homosexual households - Lesbian couples (% change since 2000)
Likely homosexual households - Gay men (%)
Likely homosexual households - Gay men (% change since 2000)
Cost of living index
Median gross rent ($)
Median contract rent ($)
Median monthly housing costs ($)
Median house or condo value ($)
Median house or condo value ($ change since 2000)
Mean house or condo value by units in structure - 1, detached ($)
Mean house or condo value by units in structure - 1, attached ($)
Mean house or condo value by units in structure - 2 ($)
Mean house or condo value by units in structure by units in structure - 3 or 4 ($)
Mean house or condo value by units in structure - 5 or more ($)
Mean house or condo value by units in structure - Boat, RV, van, etc. ($)
Mean house or condo value by units in structure - Mobile home ($)
Median house or condo value ($) - White
Median house or condo value ($) - Black or African American
Median house or condo value ($) - Asian
Median house or condo value ($) - Hispanic or Latino
Median house or condo value ($) - American Indian and Alaska Native
Median house or condo value ($) - Multirace
Median house or condo value ($) - Other Race
Median resident age
Resident age diversity
Median resident age - Males
Median resident age - Females
Median resident age - White
Median resident age - Black or African American
Median resident age - Asian
Median resident age - Hispanic or Latino
Median resident age - American Indian and Alaska Native
Median resident age - Multirace
Median resident age - Other Race
Median resident age - Males - White
Median resident age - Males - Black or African American
Median resident age - Males - Asian
Median resident age - Males - Hispanic or Latino
Median resident age - Males - American Indian and Alaska Native
Median resident age - Males - Multirace
Median resident age - Males - Other Race
Median resident age - Females - White
Median resident age - Females - Black or African American
Median resident age - Females - Asian
Median resident age - Females - Hispanic or Latino
Median resident age - Females - American Indian and Alaska Native
Median resident age - Females - Multirace
Median resident age - Females - Other Race
Commute - mean travel time to work (minutes)
Travel time to work - Less than 5 minutes (%)
Travel time to work - Less than 5 minutes (% change since 2000)
Travel time to work - 5 to 9 minutes (%)
Travel time to work - 5 to 9 minutes (% change since 2000)
Travel time to work - 10 to 19 minutes (%)
Travel time to work - 10 to 19 minutes (% change since 2000)
Travel time to work - 20 to 29 minutes (%)
Travel time to work - 20 to 29 minutes (% change since 2000)
Travel time to work - 30 to 39 minutes (%)
Travel time to work - 30 to 39 minutes (% change since 2000)
Travel time to work - 40 to 59 minutes (%)
Travel time to work - 40 to 59 minutes (% change since 2000)
Travel time to work - 60 to 89 minutes (%)
Travel time to work - 60 to 89 minutes (% change since 2000)
Travel time to work - 90 or more minutes (%)
Travel time to work - 90 or more minutes (% change since 2000)
Marital status - Never married (%)
Marital status - Now married (%)
Marital status - Separated (%)
Marital status - Widowed (%)
Marital status - Divorced (%)
Median family income ($)
Median family income (% change since 2000)
Median non-family income ($)
Median non-family income (% change since 2000)
Median per capita income ($)
Median per capita income (% change since 2000)
Median family income ($) - White
Median family income ($) - Black or African American
Median family income ($) - Asian
Median family income ($) - Hispanic or Latino
Median family income ($) - American Indian and Alaska Native
Median family income ($) - Multirace
Median family income ($) - Other Race
Median year house/condo built
Median year apartment built
Year house built - Built 2005 or later (%)
Year house built - Built 2000 to 2004 (%)
Year house built - Built 1990 to 1999 (%)
Year house built - Built 1980 to 1989 (%)
Year house built - Built 1970 to 1979 (%)
Year house built - Built 1960 to 1969 (%)
Year house built - Built 1950 to 1959 (%)
Year house built - Built 1940 to 1949 (%)
Year house built - Built 1939 or earlier (%)
Average household size
Household density (households per square mile)
Average household size - White
Average household size - Black or African American
Average household size - Asian
Average household size - Hispanic or Latino
Average household size - American Indian and Alaska Native
Average household size - Multirace
Average household size - Other Race
Occupied housing units (%)
Vacant housing units (%)
Owner occupied housing units (%)
Renter occupied housing units (%)
Vacancy status - For rent (%)
Vacancy status - For sale only (%)
Vacancy status - Rented or sold, not occupied (%)
Vacancy status - For seasonal, recreational, or occasional use (%)
Vacancy status - For migrant workers (%)
Vacancy status - Other vacant (%)
Residents with income below the poverty level (%)
Residents with income below 50% of the poverty level (%)
Children below poverty level (%)
Poor families by family type - Married-couple family (%)
Poor families by family type - Male, no wife present (%)
Poor families by family type - Female, no husband present (%)
Poverty status for native-born residents (%)
Poverty status for foreign-born residents (%)
Poverty among high school graduates not in families (%)
Poverty among people who did not graduate high school not in families (%)
Residents with income below the poverty level (%) - White
Residents with income below the poverty level (%) - Black or African American
Residents with income below the poverty level (%) - Asian
Residents with income below the poverty level (%) - Hispanic or Latino
Residents with income below the poverty level (%) - American Indian and Alaska Native
Residents with income below the poverty level (%) - Multirace
Residents with income below the poverty level (%) - Other Race
Air pollution - Air Quality Index (AQI)
Air pollution - CO
Air pollution - NO2
Air pollution - SO2
Air pollution - Ozone
Air pollution - PM10
Air pollution - PM25
Air pollution - Pb
Crime - Murders per 100,000 population
Crime - Rapes per 100,000 population
Crime - Robberies per 100,000 population
Crime - Assaults per 100,000 population
Crime - Burglaries per 100,000 population
Crime - Thefts per 100,000 population
Crime - Auto thefts per 100,000 population
Crime - Arson per 100,000 population
Crime - City-data.com crime index
Crime - Violent crime index
Crime - Property crime index
Crime - Murders per 100,000 population (5 year average)
Crime - Rapes per 100,000 population (5 year average)
Crime - Robberies per 100,000 population (5 year average)
Crime - Assaults per 100,000 population (5 year average)
Crime - Burglaries per 100,000 population (5 year average)
Crime - Thefts per 100,000 population (5 year average)
Crime - Auto thefts per 100,000 population (5 year average)
Crime - Arson per 100,000 population (5 year average)
Crime - City-data.com crime index (5 year average)
Crime - Violent crime index (5 year average)
Crime - Property crime index (5 year average)
1996 Presidential Elections Results (%) - Democratic Party (Clinton)
1996 Presidential Elections Results (%) - Republican Party (Dole)
1996 Presidential Elections Results (%) - Other
2000 Presidential Elections Results (%) - Democratic Party (Gore)
2000 Presidential Elections Results (%) - Republican Party (Bush)
2000 Presidential Elections Results (%) - Other
2004 Presidential Elections Results (%) - Democratic Party (Kerry)
2004 Presidential Elections Results (%) - Republican Party (Bush)
2004 Presidential Elections Results (%) - Other
2008 Presidential Elections Results (%) - Democratic Party (Obama)
2008 Presidential Elections Results (%) - Republican Party (McCain)
2008 Presidential Elections Results (%) - Other
2012 Presidential Elections Results (%) - Democratic Party (Obama)
2012 Presidential Elections Results (%) - Republican Party (Romney)
2012 Presidential Elections Results (%) - Other
2016 Presidential Elections Results (%) - Democratic Party (Clinton)
2016 Presidential Elections Results (%) - Republican Party (Trump)
2016 Presidential Elections Results (%) - Other
2020 Presidential Elections Results (%) - Democratic Party (Biden)
2020 Presidential Elections Results (%) - Republican Party (Trump)
2020 Presidential Elections Results (%) - Other
Ancestries Reported - Arab (%)
Ancestries Reported - Czech (%)
Ancestries Reported - Danish (%)
Ancestries Reported - Dutch (%)
Ancestries Reported - English (%)
Ancestries Reported - French (%)
Ancestries Reported - French Canadian (%)
Ancestries Reported - German (%)
Ancestries Reported - Greek (%)
Ancestries Reported - Hungarian (%)
Ancestries Reported - Irish (%)
Ancestries Reported - Italian (%)
Ancestries Reported - Lithuanian (%)
Ancestries Reported - Norwegian (%)
Ancestries Reported - Polish (%)
Ancestries Reported - Portuguese (%)
Ancestries Reported - Russian (%)
Ancestries Reported - Scotch-Irish (%)
Ancestries Reported - Scottish (%)
Ancestries Reported - Slovak (%)
Ancestries Reported - Subsaharan African (%)
Ancestries Reported - Swedish (%)
Ancestries Reported - Swiss (%)
Ancestries Reported - Ukrainian (%)
Ancestries Reported - United States (%)
Ancestries Reported - Welsh (%)
Ancestries Reported - West Indian (%)
Ancestries Reported - Other (%)
Educational Attainment - No schooling completed (%)
Educational Attainment - Less than high school (%)
Educational Attainment - High school or equivalent (%)
Educational Attainment - Less than 1 year of college (%)
Educational Attainment - 1 or more years of college (%)
Educational Attainment - Associate degree (%)
Educational Attainment - Bachelor's degree (%)
Educational Attainment - Master's degree (%)
Educational Attainment - Professional school degree (%)
Educational Attainment - Doctorate degree (%)
School Enrollment - Nursery, preschool (%)
School Enrollment - Kindergarten (%)
School Enrollment - Grade 1 to 4 (%)
School Enrollment - Grade 5 to 8 (%)
School Enrollment - Grade 9 to 12 (%)
School Enrollment - College undergrad (%)
School Enrollment - Graduate or professional (%)
School Enrollment - Not enrolled in school (%)
School enrollment - Public schools (%)
School enrollment - Private schools (%)
School enrollment - Not enrolled (%)
Median number of rooms in houses and condos
Median number of rooms in apartments
Housing units lacking complete plumbing facilities (%)
Housing units lacking complete kitchen facilities (%)
Density of houses
Urban houses (%)
Rural houses (%)
Households with people 60 years and over (%)
Households with people 65 years and over (%)
Households with people 75 years and over (%)
Households with one or more nonrelatives (%)
Households with no nonrelatives (%)
Population in households (%)
Family households (%)
Nonfamily households (%)
Population in families (%)
Family households with own children (%)
Median number of bedrooms in owner occupied houses
Mean number of bedrooms in owner occupied houses
Median number of bedrooms in renter occupied houses
Mean number of bedrooms in renter occupied houses
Median number of vehichles in owner occupied houses
Mean number of vehichles in owner occupied houses
Median number of vehichles in renter occupied houses
Mean number of vehichles in renter occupied houses
Mortgage status - with mortgage (%)
Mortgage status - with second mortgage (%)
Mortgage status - with home equity loan (%)
Mortgage status - with both second mortgage and home equity loan (%)
Mortgage status - without a mortgage (%)
Average family size
Average family size - White
Average family size - Black or African American
Average family size - Asian
Average family size - Hispanic or Latino
Average family size - American Indian and Alaska Native
Average family size - Multirace
Average family size - Other Race
Geographical mobility - Same house 1 year ago (%)
Geographical mobility - Moved within same county (%)
Geographical mobility - Moved from different county within same state (%)
Geographical mobility - Moved from different state (%)
Geographical mobility - Moved from abroad (%)
Place of birth - Born in state of residence (%)
Place of birth - Born in other state (%)
Place of birth - Native, outside of US (%)
Place of birth - Foreign born (%)
Housing units in structures - 1, detached (%)
Housing units in structures - 1, attached (%)
Housing units in structures - 2 (%)
Housing units in structures - 3 or 4 (%)
Housing units in structures - 5 to 9 (%)
Housing units in structures - 10 to 19 (%)
Housing units in structures - 20 to 49 (%)
Housing units in structures - 50 or more (%)
Housing units in structures - Mobile home (%)
Housing units in structures - Boat, RV, van, etc. (%)
House/condo owner moved in on average (years ago)
Renter moved in on average (years ago)
Year householder moved into unit - Moved in 1999 to March 2000 (%)
Year householder moved into unit - Moved in 1995 to 1998 (%)
Year householder moved into unit - Moved in 1990 to 1994 (%)
Year householder moved into unit - Moved in 1980 to 1989 (%)
Year householder moved into unit - Moved in 1970 to 1979 (%)
Year householder moved into unit - Moved in 1969 or earlier (%)
Means of transportation to work - Drove car alone (%)
Means of transportation to work - Carpooled (%)
Means of transportation to work - Public transportation (%)
Means of transportation to work - Bus or trolley bus (%)
Means of transportation to work - Streetcar or trolley car (%)
Means of transportation to work - Subway or elevated (%)
Means of transportation to work - Railroad (%)
Means of transportation to work - Ferryboat (%)
Means of transportation to work - Taxicab (%)
Means of transportation to work - Motorcycle (%)
Means of transportation to work - Bicycle (%)
Means of transportation to work - Walked (%)
Means of transportation to work - Other means (%)
Working at home (%)
Industry diversity
Most Common Industries - Agriculture, forestry, fishing and hunting, and mining (%)
Most Common Industries - Agriculture, forestry, fishing and hunting (%)
Most Common Industries - Mining, quarrying, and oil and gas extraction (%)
Most Common Industries - Construction (%)
Most Common Industries - Manufacturing (%)
Most Common Industries - Wholesale trade (%)
Most Common Industries - Retail trade (%)
Most Common Industries - Transportation and warehousing, and utilities (%)
Most Common Industries - Transportation and warehousing (%)
Most Common Industries - Utilities (%)
Most Common Industries - Information (%)
Most Common Industries - Finance and insurance, and real estate and rental and leasing (%)
Most Common Industries - Finance and insurance (%)
Most Common Industries - Real estate and rental and leasing (%)
Most Common Industries - Professional, scientific, and management, and administrative and waste management services (%)
Most Common Industries - Professional, scientific, and technical services (%)
Most Common Industries - Management of companies and enterprises (%)
Most Common Industries - Administrative and support and waste management services (%)
Most Common Industries - Educational services, and health care and social assistance (%)
Most Common Industries - Educational services (%)
Most Common Industries - Health care and social assistance (%)
Most Common Industries - Arts, entertainment, and recreation, and accommodation and food services (%)
Most Common Industries - Arts, entertainment, and recreation (%)
Most Common Industries - Accommodation and food services (%)
Most Common Industries - Other services, except public administration (%)
Most Common Industries - Public administration (%)
Occupation diversity
Most Common Occupations - Management, business, science, and arts occupations (%)
Most Common Occupations - Management, business, and financial occupations (%)
Most Common Occupations - Management occupations (%)
Most Common Occupations - Business and financial operations occupations (%)
Most Common Occupations - Computer, engineering, and science occupations (%)
Most Common Occupations - Computer and mathematical occupations (%)
Most Common Occupations - Architecture and engineering occupations (%)
Most Common Occupations - Life, physical, and social science occupations (%)
Most Common Occupations - Education, legal, community service, arts, and media occupations (%)
Most Common Occupations - Community and social service occupations (%)
Most Common Occupations - Legal occupations (%)
Most Common Occupations - Education, training, and library occupations (%)
Most Common Occupations - Arts, design, entertainment, sports, and media occupations (%)
Most Common Occupations - Healthcare practitioners and technical occupations (%)
Most Common Occupations - Health diagnosing and treating practitioners and other technical occupations (%)
Most Common Occupations - Health technologists and technicians (%)
Most Common Occupations - Service occupations (%)
Most Common Occupations - Healthcare support occupations (%)
Most Common Occupations - Protective service occupations (%)
Most Common Occupations - Fire fighting and prevention, and other protective service workers including supervisors (%)
Most Common Occupations - Law enforcement workers including supervisors (%)
Most Common Occupations - Food preparation and serving related occupations (%)
Most Common Occupations - Building and grounds cleaning and maintenance occupations (%)
Most Common Occupations - Personal care and service occupations (%)
Most Common Occupations - Sales and office occupations (%)
Most Common Occupations - Sales and related occupations (%)
Most Common Occupations - Office and administrative support occupations (%)
Most Common Occupations - Natural resources, construction, and maintenance occupations (%)
Most Common Occupations - Farming, fishing, and forestry occupations (%)
Most Common Occupations - Construction and extraction occupations (%)
Most Common Occupations - Installation, maintenance, and repair occupations (%)
Most Common Occupations - Production, transportation, and material moving occupations (%)
Most Common Occupations - Production occupations (%)
Most Common Occupations - Transportation occupations (%)
Most Common Occupations - Material moving occupations (%)
People in Group quarters - Institutionalized population (%)
People in Group quarters - Correctional institutions (%)
People in Group quarters - Federal prisons and detention centers (%)
People in Group quarters - Halfway houses (%)
People in Group quarters - Local jails and other confinement facilities (including police lockups) (%)
People in Group quarters - Military disciplinary barracks (%)
People in Group quarters - State prisons (%)
People in Group quarters - Other types of correctional institutions (%)
People in Group quarters - Nursing homes (%)
People in Group quarters - Hospitals/wards, hospices, and schools for the handicapped (%)
People in Group quarters - Hospitals/wards and hospices for chronically ill (%)
People in Group quarters - Hospices or homes for chronically ill (%)
People in Group quarters - Military hospitals or wards for chronically ill (%)
People in Group quarters - Other hospitals or wards for chronically ill (%)
People in Group quarters - Hospitals or wards for drug/alcohol abuse (%)
People in Group quarters - Mental (Psychiatric) hospitals or wards (%)
People in Group quarters - Schools, hospitals, or wards for the mentally retarded (%)
People in Group quarters - Schools, hospitals, or wards for the physically handicapped (%)
People in Group quarters - Institutions for the deaf (%)
People in Group quarters - Institutions for the blind (%)
People in Group quarters - Orthopedic wards and institutions for the physically handicapped (%)
People in Group quarters - Wards in general hospitals for patients who have no usual home elsewhere (%)
People in Group quarters - Wards in military hospitals for patients who have no usual home elsewhere (%)
People in Group quarters - Juvenile institutions (%)
People in Group quarters - Long-term care (%)
People in Group quarters - Homes for abused, dependent, and neglected children (%)
People in Group quarters - Residential treatment centers for emotionally disturbed children (%)
People in Group quarters - Training schools for juvenile delinquents (%)
People in Group quarters - Short-term care, detention or diagnostic centers for delinquent children (%)
People in Group quarters - Type of juvenile institution unknown (%)
People in Group quarters - Noninstitutionalized population (%)
People in Group quarters - College dormitories (includes college quarters off campus) (%)
People in Group quarters - Military quarters (%)
People in Group quarters - On base (%)
People in Group quarters - Barracks, unaccompanied personnel housing (UPH), (Enlisted/Officer), ;and similar group living quarters for military personnel (%)
People in Group quarters - Transient quarters for temporary residents (%)
People in Group quarters - Military ships (%)
People in Group quarters - Group homes (%)
People in Group quarters - Homes or halfway houses for drug/alcohol abuse (%)
People in Group quarters - Homes for the mentally ill (%)
People in Group quarters - Homes for the mentally retarded (%)
People in Group quarters - Homes for the physically handicapped (%)
People in Group quarters - Other group homes (%)
People in Group quarters - Religious group quarters (%)
People in Group quarters - Dormitories (%)
People in Group quarters - Agriculture workers' dormitories on farms (%)
People in Group quarters - Job Corps and vocational training facilities (%)
People in Group quarters - Other workers' dormitories (%)
People in Group quarters - Crews of maritime vessels (%)
People in Group quarters - Other nonhousehold living situations (%)
People in Group quarters - Other noninstitutional group quarters (%)
Residents speaking English at home (%)
Residents speaking English at home - Born in the United States (%)
Residents speaking English at home - Native, born elsewhere (%)
Residents speaking English at home - Foreign born (%)
Residents speaking Spanish at home (%)
Residents speaking Spanish at home - Born in the United States (%)
Residents speaking Spanish at home - Native, born elsewhere (%)
Residents speaking Spanish at home - Foreign born (%)
Residents speaking other language at home (%)
Residents speaking other language at home - Born in the United States (%)
Residents speaking other language at home - Native, born elsewhere (%)
Residents speaking other language at home - Foreign born (%)
Class of Workers - Employee of private company (%)
Class of Workers - Self-employed in own incorporated business (%)
Class of Workers - Private not-for-profit wage and salary workers (%)
Class of Workers - Local government workers (%)
Class of Workers - State government workers (%)
Class of Workers - Federal government workers (%)
Class of Workers - Self-employed workers in own not incorporated business and Unpaid family workers (%)
House heating fuel used in houses and condos - Utility gas (%)
House heating fuel used in houses and condos - Bottled, tank, or LP gas (%)
House heating fuel used in houses and condos - Electricity (%)
House heating fuel used in houses and condos - Fuel oil, kerosene, etc. (%)
House heating fuel used in houses and condos - Coal or coke (%)
House heating fuel used in houses and condos - Wood (%)
House heating fuel used in houses and condos - Solar energy (%)
House heating fuel used in houses and condos - Other fuel (%)
House heating fuel used in houses and condos - No fuel used (%)
House heating fuel used in apartments - Utility gas (%)
House heating fuel used in apartments - Bottled, tank, or LP gas (%)
House heating fuel used in apartments - Electricity (%)
House heating fuel used in apartments - Fuel oil, kerosene, etc. (%)
House heating fuel used in apartments - Coal or coke (%)
House heating fuel used in apartments - Wood (%)
House heating fuel used in apartments - Solar energy (%)
House heating fuel used in apartments - Other fuel (%)
House heating fuel used in apartments - No fuel used (%)
Armed forces status - In Armed Forces (%)
Armed forces status - Civilian (%)
Armed forces status - Civilian - Veteran (%)
Armed forces status - Civilian - Nonveteran (%)
Fatal accidents locations in years 2005-2021
Fatal accidents locations in 2005
Fatal accidents locations in 2006
Fatal accidents locations in 2007
Fatal accidents locations in 2008
Fatal accidents locations in 2009
Fatal accidents locations in 2010
Fatal accidents locations in 2011
Fatal accidents locations in 2012
Fatal accidents locations in 2013
Fatal accidents locations in 2014
Fatal accidents locations in 2015
Fatal accidents locations in 2016
Fatal accidents locations in 2017
Fatal accidents locations in 2018
Fatal accidents locations in 2019
Fatal accidents locations in 2020
Fatal accidents locations in 2021
Alcohol use - People drinking some alcohol every month (%)
Alcohol use - People not drinking at all (%)
Alcohol use - Average days/month drinking alcohol
Alcohol use - Average drinks/week
Alcohol use - Average days/year people drink much
Audiometry - Average condition of hearing (%)
Audiometry - People that can hear a whisper from across a quiet room (%)
Audiometry - People that can hear normal voice from across a quiet room (%)
Audiometry - Ears ringing, roaring, buzzing (%)
Audiometry - Had a job exposure to loud noise (%)
Audiometry - Had off-work exposure to loud noise (%)
Blood Pressure & Cholesterol - Has high blood pressure (%)
Blood Pressure & Cholesterol - Checking blood pressure at home (%)
Blood Pressure & Cholesterol - Frequently checking blood cholesterol (%)
Blood Pressure & Cholesterol - Has high cholesterol level (%)
Consumer Behavior - Money monthly spent on food at supermarket/grocery store
Consumer Behavior - Money monthly spent on food at other stores
Consumer Behavior - Money monthly spent on eating out
Consumer Behavior - Money monthly spent on carryout/delivered foods
Consumer Behavior - Income spent on food at supermarket/grocery store (%)
Consumer Behavior - Income spent on food at other stores (%)
Consumer Behavior - Income spent on eating out (%)
Consumer Behavior - Income spent on carryout/delivered foods (%)
Current Health Status - General health condition (%)
Current Health Status - Blood donors (%)
Current Health Status - Has blood ever tested for HIV virus (%)
Current Health Status - Left-handed people (%)
Dermatology - People using sunscreen (%)
Diabetes - Diabetics (%)
Diabetes - Had a blood test for high blood sugar (%)
Diabetes - People taking insulin (%)
Diet Behavior & Nutrition - Diet health (%)
Diet Behavior & Nutrition - Milk product consumption (# of products/month)
Diet Behavior & Nutrition - Meals not home prepared (#/week)
Diet Behavior & Nutrition - Meals from fast food or pizza place (#/week)
Diet Behavior & Nutrition - Ready-to-eat foods (#/month)
Diet Behavior & Nutrition - Frozen meals/pizza (#/month)
Drug Use - People that ever used marijuana or hashish (%)
Drug Use - Ever used hard drugs (%)
Drug Use - Ever used any form of cocaine (%)
Drug Use - Ever used heroin (%)
Drug Use - Ever used methamphetamine (%)
Health Insurance - People covered by health insurance (%)
Kidney Conditions-Urology - Avg. # of times urinating at night
Medical Conditions - People with asthma (%)
Medical Conditions - People with anemia (%)
Medical Conditions - People with psoriasis (%)
Medical Conditions - People with overweight (%)
Medical Conditions - Elderly people having difficulties in thinking or remembering (%)
Medical Conditions - People who ever received blood transfusion (%)
Medical Conditions - People having trouble seeing even with glass/contacts (%)
Medical Conditions - People with arthritis (%)
Medical Conditions - People with gout (%)
Medical Conditions - People with congestive heart failure (%)
Medical Conditions - People with coronary heart disease (%)
Medical Conditions - People with angina pectoris (%)
Medical Conditions - People who ever had heart attack (%)
Medical Conditions - People who ever had stroke (%)
Medical Conditions - People with emphysema (%)
Medical Conditions - People with thyroid problem (%)
Medical Conditions - People with chronic bronchitis (%)
Medical Conditions - People with any liver condition (%)
Medical Conditions - People who ever had cancer or malignancy (%)
Mental Health - People who have little interest in doing things (%)
Mental Health - People feeling down, depressed, or hopeless (%)
Mental Health - People who have trouble sleeping or sleeping too much (%)
Mental Health - People feeling tired or having little energy (%)
Mental Health - People with poor appetite or overeating (%)
Mental Health - People feeling bad about themself (%)
Mental Health - People who have trouble concentrating on things (%)
Mental Health - People moving or speaking slowly or too fast (%)
Mental Health - People having thoughts they would be better off dead (%)
Oral Health - Average years since last visit a dentist
Oral Health - People embarrassed because of mouth (%)
Oral Health - People with gum disease (%)
Oral Health - General health of teeth and gums (%)
Oral Health - Average days a week using dental floss/device
Oral Health - Average days a week using mouthwash for dental problem
Oral Health - Average number of teeth
Pesticide Use - Households using pesticides to control insects (%)
Pesticide Use - Households using pesticides to kill weeds (%)
Physical Activity - People doing vigorous-intensity work activities (%)
Physical Activity - People doing moderate-intensity work activities (%)
Physical Activity - People walking or bicycling (%)
Physical Activity - People doing vigorous-intensity recreational activities (%)
Physical Activity - People doing moderate-intensity recreational activities (%)
Physical Activity - Average hours a day doing sedentary activities
Physical Activity - Average hours a day watching TV or videos
Physical Activity - Average hours a day using computer
Physical Functioning - People having limitations keeping them from working (%)
Physical Functioning - People limited in amount of work they can do (%)
Physical Functioning - People that need special equipment to walk (%)
Physical Functioning - People experiencing confusion/memory problems (%)
Physical Functioning - People requiring special healthcare equipment (%)
Prescription Medications - Average number of prescription medicines taking
Preventive Aspirin Use - Adults 40+ taking low-dose aspirin (%)
Reproductive Health - Vaginal deliveries (%)
Reproductive Health - Cesarean deliveries (%)
Reproductive Health - Deliveries resulted in a live birth (%)
Reproductive Health - Pregnancies resulted in a delivery (%)
Reproductive Health - Women breastfeeding newborns (%)
Reproductive Health - Women that had a hysterectomy (%)
Reproductive Health - Women that had both ovaries removed (%)
Reproductive Health - Women that have ever taken birth control pills (%)
Reproductive Health - Women taking birth control pills (%)
Reproductive Health - Women that have ever used Depo-Provera or injectables (%)
Reproductive Health - Women that have ever used female hormones (%)
Sexual Behavior - People 18+ that ever had sex (vaginal, anal, or oral) (%)
Sexual Behavior - Males 18+ that ever had vaginal sex with a woman (%)
Sexual Behavior - Males 18+ that ever performed oral sex on a woman (%)
Sexual Behavior - Males 18+ that ever had anal sex with a woman (%)
Sexual Behavior - Males 18+ that ever had any sex with a man (%)
Sexual Behavior - Females 18+ that ever had vaginal sex with a man (%)
Sexual Behavior - Females 18+ that ever performed oral sex on a man (%)
Sexual Behavior - Females 18+ that ever had anal sex with a man (%)
Sexual Behavior - Females 18+ that ever had any kind of sex with a woman (%)
Sexual Behavior - Average age people first had sex
Sexual Behavior - Average number of female sex partners in lifetime (males 18+)
Sexual Behavior - Average number of female vaginal sex partners in lifetime (males 18+)
Sexual Behavior - Average age people first performed oral sex on a woman (18+)
Sexual Behavior - Average number of woman performed oral sex on in lifetime (18+)
Sexual Behavior - Average number of male sex partners in lifetime (males 18+)
Sexual Behavior - Average number of male anal sex partners in lifetime (males 18+)
Sexual Behavior - Average age people first performed oral sex on a man (18+)
Sexual Behavior - Average number of male oral sex partners in lifetime (18+)
Sexual Behavior - People using protection when performing oral sex (%)
Sexual Behavior - Average number of times people have vaginal or anal sex a year
Sexual Behavior - People having sex without condom (%)
Sexual Behavior - Average number of male sex partners in lifetime (females 18+)
Sexual Behavior - Average number of male vaginal sex partners in lifetime (females 18+)
Sexual Behavior - Average number of female sex partners in lifetime (females 18+)
Sexual Behavior - Circumcised males 18+ (%)
Sleep Disorders - Average hours sleeping at night
Sleep Disorders - People that has trouble sleeping (%)
Smoking-Cigarette Use - People smoking cigarettes (%)
Taste & Smell - People 40+ having problems with smell (%)
Taste & Smell - People 40+ having problems with taste (%)
Taste & Smell - People 40+ that ever had wisdom teeth removed (%)
Taste & Smell - People 40+ that ever had tonsils teeth removed (%)
Taste & Smell - People 40+ that ever had a loss of consciousness because of a head injury (%)
Taste & Smell - People 40+ that ever had a broken nose or other serious injury to face or skull (%)
Taste & Smell - People 40+ that ever had two or more sinus infections (%)
Weight - Average height (inches)
Weight - Average weight (pounds)
Weight - Average BMI
Weight - People that are obese (%)
Weight - People that ever were obese (%)
Weight - People trying to lose weight (%)
Urban population: 25,976
Rural population: 3,115
Estimated median house/condo value in 2022: $259,431
78724:
$259,431Texas:
$275,400
According to our research of Texas and other state lists, there were 66 registered sex offenders living in 78724 zip code as of April 27, 2024 . The ratio of all residents to sex offenders in zip code 78724 is 377 to 1.The ratio of registered sex offenders to all residents in this zip code is near the state average.
Median resident age: This zip code:
31.7 yearsTexas median age:
35.6 years
Average household size: This zip code:
3.1 peopleTexas:
2.6 people
Averages for the 2020 tax year for zip code 78724, filed in 2021:
Average Adjusted Gross Income (AGI) in 2020: $46,189 (Individual Income Tax Returns) Here:
$46,189State:
$77,054
Salary/wage: $43,918 (reported on 84.9% of returns )Here:
$43,918State:
$62,766
(% of AGI for various income ranges: 1227.9% for AGIs below $25k , 3835.8% for AGIs $25k-50k , 7186.0% for AGIs $50k-75k , 11245.9% for AGIs $75k-100k , 18634.5% for AGIs $100k-200k , 89610.0% for AGIs over 200k ) Taxable interest for individuals: $589 (reported on 10.3% of returns )This zip code:
$589Texas:
$2,665
(% of AGI for various income ranges: 3.3% for AGIs below $25k , 1.6% for AGIs $25k-50k , 7.2% for AGIs $50k-75k , 13.9% for AGIs $75k-100k , 48.5% for AGIs $100k-200k , 350.0% for AGIs over 200k ) Ordinary dividends: $1,744 (reported on 5.8% of returns )(% of AGI for various income ranges: 0.9% for AGIs below $25k , 2.1% for AGIs $25k-50k , 7.1% for AGIs $50k-75k , 11.2% for AGIs $75k-100k , 57.7% for AGIs $100k-200k , 1474.0% for AGIs over 200k ) Net capital gain/loss in AGI: +$12,877 (reported on 6.4% of returns )Here:
+$12,877State:
+$39,590
(% of AGI for various income ranges: 0.8% for AGIs below $25k , 4.0% for AGIs $25k-50k , 26.4% for AGIs $50k-75k , 75.4% for AGIs $75k-100k , 388.9% for AGIs $100k-200k , 15344.0% for AGIs over 200k ) Profit/loss from business: +$12,381 (reported on 23.4% of returns )Here:
+$12,381State:
+$10,888
(% of AGI for various income ranges: 353.7% for AGIs below $25k , 331.4% for AGIs $25k-50k , 358.1% for AGIs $50k-75k , 293.0% for AGIs $75k-100k , 706.0% for AGIs $100k-200k , 5492.0% for AGIs over 200k ) Taxable individual retirement arrangement distribution: $12,300 (reported on 1.6% of returns )78724:
$12,300Texas:
$24,740
(% of AGI for various income ranges: 5.9% for AGIs below $25k , 11.9% for AGIs $25k-50k , 34.5% for AGIs $50k-75k , 85.2% for AGIs $75k-100k , 190.0% for AGIs $100k-200k ) Total itemized deductions: $23,804 (reported on 3.9% of returns )Here:
$23,804State:
$40,428
(% of AGI for various income ranges: 13.9% for AGIs below $25k , 53.0% for AGIs $25k-50k , 185.9% for AGIs $50k-75k , 285.5% for AGIs $75k-100k , 603.6% for AGIs $100k-200k , 4410.0% for AGIs over 200k ) Charity contributions: $7,062 (reported on 2.5% of returns )(% of AGI for various income ranges: 12.2% for AGIs $25k-50k , 36.2% for AGIs $50k-75k , 38.8% for AGIs $75k-100k , 111.1% for AGIs $100k-200k , 1072.0% for AGIs over 200k ) Taxes paid: $6,879 (reported on 3.6% of returns )(% of AGI for various income ranges: 3.6% for AGIs below $25k , 13.9% for AGIs $25k-50k , 43.5% for AGIs $50k-75k , 98.0% for AGIs $75k-100k , 190.9% for AGIs $100k-200k , 924.0% for AGIs over 200k ) Earned income credit: $2,721 (reported on 25.8% of returns )(% of AGI for various income ranges: 161.0% for AGIs below $25k , 93.2% for AGIs $25k-50k , 1.2% for AGIs $50k-75k ) Percentage of individuals using paid preparers for their 2020 taxes: 88.7%(% for various income ranges: 86.1% for AGIs below $25k , 89.7% for AGIs $25k-50k , 87.9% for AGIs $50k-75k , 92.6% for AGIs $75k-100k , 95.3% for AGIs $100k-200k , 94.4% for AGIs over 200k )
Averages for the 2012 tax year for zip code 78724, filed in 2013:
Average Adjusted Gross Income (AGI) in 2012: $30,320 (Individual Income Tax Returns) Here:
$30,320State:
$65,384
Salary/wage: $29,076 (reported on 88.0% of returns )Here:
$29,076State:
$52,524
(% of AGI for various income ranges: 78.7% for AGIs below $25k , 90.7% for AGIs $25k-50k , 87.9% for AGIs $50k-75k , 86.8% for AGIs $75k-100k , 81.9% for AGIs $100k-200k , 51.6% for AGIs over 200k ) Taxable interest for individuals: $570 (reported on 8.8% of returns )This zip code:
$570Texas:
$2,372
(% of AGI for various income ranges: 0.4% for AGIs below $25k , 0.2% for AGIs $100k-200k , 0.3% for AGIs over 200k ) Ordinary dividends: $3,452 (reported on 3.0% of returns )(% of AGI for various income ranges: 0.6% for AGIs below $25k , 0.2% for AGIs $25k-50k , 0.2% for AGIs $50k-75k , 0.9% for AGIs $100k-200k ) Net capital gain/loss in AGI: +$5,556 (reported on 2.1% of returns )Here:
+$5,556State:
+$35,319
(% of AGI for various income ranges: 5.1% for AGIs $100k-200k ) Profit/loss from business: +$10,136 (reported on 18.2% of returns )Here:
+$10,136State:
+$13,732
(% of AGI for various income ranges: 16.0% for AGIs below $25k , 3.7% for AGIs $25k-50k , 2.2% for AGIs $50k-75k , 1.0% for AGIs $75k-100k , 3.6% for AGIs $100k-200k ) Taxable individual retirement arrangement distribution: $7,500 (reported on 1.9% of returns )78724:
$7,500Texas:
$19,511
(% of AGI for various income ranges: 0.3% for AGIs below $25k , 0.4% for AGIs $25k-50k , 0.6% for AGIs $50k-75k , 1.6% for AGIs $75k-100k ) Total itemized deductions: $15,866 (23% of AGI, reported on 10.8% of returns )Here:
$15,866State:
$24,724
Here:
23.4% of AGIState:
15.9% of AGI
(% of AGI for various income ranges: 2.4% for AGIs below $25k , 4.7% for AGIs $25k-50k , 7.5% for AGIs $50k-75k , 9.5% for AGIs $75k-100k , 10.2% for AGIs $100k-200k , 8.9% for AGIs over 200k ) Charity contributions: $3,462 (reported on 7.1% of returns )(% of AGI for various income ranges: 0.3% for AGIs below $25k , 0.4% for AGIs $25k-50k , 1.2% for AGIs $50k-75k , 1.6% for AGIs $75k-100k , 1.7% for AGIs $100k-200k , 2.5% for AGIs over 200k ) Taxes paid: $4,445 (reported on 10.4% of returns )(% of AGI for various income ranges: 0.7% for AGIs below $25k , 1.1% for AGIs $25k-50k , 2.0% for AGIs $50k-75k , 2.6% for AGIs $75k-100k , 3.3% for AGIs $100k-200k , 2.6% for AGIs over 200k ) Earned income credit: $2,814 (reported on 36.2% of returns )(% of AGI for various income ranges: 10.8% for AGIs below $25k , 1.8% for AGIs $25k-50k ) Percentage of individuals using paid preparers for their 2012 taxes: 45.1%(% for various income ranges: 45.6% for AGIs below $25k , 45.8% for AGIs $25k-50k , 41.6% for AGIs $50k-75k , 37.5% for AGIs $75k-100k , 53.3% for AGIs $100k-200k )
Averages for the 2004 tax year for zip code 78724, filed in 2005:
Average Adjusted Gross Income (AGI) in 2004: $25,916 (Individual Income Tax Returns) Here:
$25,916State:
$47,881
Salary/wage: $24,838 (reported on 91.3% of returns )Here:
$24,838State:
$41,947
(% of AGI for various income ranges: 94.9% for AGIs below $10k , 88.5% for AGIs $10k-25k , 92.3% for AGIs $25k-50k , 85.1% for AGIs $50k-75k , 82.0% for AGIs $75k-100k , 56.7% for AGIs over 100k ) Taxable interest for individuals: $581 (reported on 11.9% of returns )This zip code:
$581Texas:
$2,255
(% of AGI for various income ranges: 0.5% for AGIs below $10k , 0.2% for AGIs $10k-25k , 0.2% for AGIs $25k-50k , 0.1% for AGIs $50k-75k , 0.2% for AGIs $75k-100k , 1.4% for AGIs over 100k ) Taxable dividends: $456 (reported on 3.7% of returns )(% of AGI for various income ranges: 0.0% for AGIs below $10k , 0.0% for AGIs $10k-25k , 0.0% for AGIs $25k-50k , 0.1% for AGIs $50k-75k , 0.0% for AGIs $75k-100k , 0.6% for AGIs over 100k ) Net capital gain/loss: +$1,022 (reported on 2.8% of returns )Here:
+$1,022State:
+$16,110
(% of AGI for various income ranges: 0.0% for AGIs $10k-25k , -0.0% for AGIs $25k-50k , 0.1% for AGIs $50k-75k , 1.3% for AGIs $75k-100k , 0.2% for AGIs over 100k ) Profit/loss from business: +$6,983 (reported on 11.9% of returns )Here:
+$6,983State:
+$11,013
(% of AGI for various income ranges: 9.4% for AGIs below $10k , 6.7% for AGIs $10k-25k , 2.2% for AGIs $25k-50k , 0.7% for AGIs $50k-75k , 1.7% for AGIs $75k-100k ) IRA payment deduction: $1,725 (reported on 0.8% of returns )Total itemized deductions: $12,241 (26% of AGI, reported on 12.7% of returns )Here:
$12,241State:
$19,631
Here:
26.3% of AGIState:
18.9% of AGI
(% of AGI for various income ranges: 4.2% for AGIs below $10k , 3.7% for AGIs $10k-25k , 6.5% for AGIs $25k-50k , 6.9% for AGIs $50k-75k , 9.7% for AGIs $75k-100k , 8.6% for AGIs over 100k ) Charity contributions deductions: $2,904 (6% of AGI, reported on 9.1% of returns )Here:
5.7% of AGIState:
4.2% of AGI
(% of AGI for various income ranges: 0.4% for AGIs $10k-25k , 0.9% for AGIs $25k-50k , 1.4% for AGIs $50k-75k , 3.0% for AGIs $75k-100k , 2.5% for AGIs over 100k ) Total tax: $2,944 (reported on 54.0% of returns )(% of AGI for various income ranges: 2.5% for AGIs below $10k , 2.8% for AGIs $10k-25k , 4.9% for AGIs $25k-50k , 8.4% for AGIs $50k-75k , 11.3% for AGIs $75k-100k , 21.8% for AGIs over 100k ) Earned income credit: $2,068 (reported on 38.8% of returns )Percentage of individuals using paid preparers for their 2004 taxes: 65.1%(% for various income ranges: 58.3% for AGIs below $10k , 72.3% for AGIs $10k-25k , 63.9% for AGIs $25k-50k , 53.4% for AGIs $50k-75k , 54.9% for AGIs $75k-100k , 46.3% for AGIs over 100k )
Estimated median household income in 2022: This zip code:
$69,206Texas:
$72,284
Nearest zip codes: 78754 ,
78725 ,
78723 ,
78742 ,
78721 ,
78752 .
Hornsby Bend Zip Code Map
Percentage of family households: This zip code:
60.2%Texas:
50.5%
Percentage of households with unmarried partners: This zip code:
6.1%Texas:
48.7%
Likely homosexual households (counted as self-reported same-sex unmarried-partner households)
Lesbian couples: 0.1% of all households Gay men: 0.2% of all households
Household received Food Stamps/SNAP in the past 12 months: 1,616Household did not receive Food Stamps/SNAP in the past 12 months: 7,335
Women who had a birth in the past 12 months: 532 (348 now married , 182 unmarried) Women who did not have a birth in the past 12 months: 7,005 (3,005 now married , 4,002 unmarried)
Housing units in zip code 78724 with a mortgage: 3,327 (55
second mortgage , 18
both second mortgage and home equity loan )
Median monthly owner costs for units with a mortgage: $1,605
Median monthly owner costs for units without a mortgage: $697
Residents with income below the poverty level in 2022:
This zip code:
16.4%Whole state:
14.0%
Residents with income below 50% of the poverty level in 2022:
This zip code:
8.2%Whole state:
7.4%
Median number of rooms in houses and condos: Median number of rooms in apartments: Notable locations in this zip code not listed on our city pages
Click to draw/clear zip code borders Notable locations in zip code 78724: (A) , Austin Fire Department Station 26 (B) , Austin / Travis County Emergency Medical Service (C) . Display/hide their locations on the map
Churches in zip code 78724 include: (A) , Decker United Methodist Church (B) , University Hills Church of Christ (C) , Gates of Deliverance Word Ministry (D) , God's Power in Christian Fellowship (E) , God's Power Ministry (F) , Open Door Bible Fellowship (G) . Display/hide their locations on the map
Cemeteries: (1) , Rogers Hill Cemetery (2) , Jones Cemeteries (3) . Display/hide their locations on the map
Reservoirs: (A) , Lake Walter E Long (B) . Display/hide their locations on the map
Streams, rivers, and creeks: (A) , Little Walnut Creek (B) . Display/hide their locations on the map
Parks in zip code 78724 include: (1) , Walnut Creek Nature Preserve (2) , Walter E Long Municipal Park (3) , Burr Field (4) , Dr Exalton and Wilhelmina Delco Activity Center (5) , Colony Park (6) . Display/hide their locations on the map
Tourist attraction (not listed on the city page) : (1) . Display/hide its approximate location on the map
Year house built (houses)
208 2020 or later2,249 2010 to 20193,041 2000 to 20091,126 1990 to 1999962 1980 to 19891,088 1970 to 1979212 1960 to 1969191 1950 to 195912 1940 to 194928 1939 or earlier
Zip code 78724 household income distribution in 2022 459 Less than $10,000171 $10,000 to $14,999335 $15,000 to $19,999308 $20,000 to $24,999463 $25,000 to $29,999276 $30,000 to $34,999157 $35,000 to $39,999285 $40,000 to $44,999491 $45,000 to $49,9991,200 $50,000 to $59,999583 $60,000 to $74,9991,780 $75,000 to $99,999887 $100,000 to $124,999315 $125,000 to $149,999576 $150,000 to $199,999618 $200,000 or moreEstimate of home value of owner-occupied houses/condos in 2022 in zip code 78724 539 Less than $10,000373 $10,000 to $14,99996 $20,000 to $24,999227 $25,000 to $29,999205 $35,000 to $39,99914 $40,000 to $49,99971 $50,000 to $59,9998 $60,000 to $69,999102 $70,000 to $79,99953 $80,000 to $89,99922 $90,000 to $99,999202 $100,000 to $124,999129 $125,000 to $149,999133 $150,000 to $174,999174 $175,000 to $199,999751 $200,000 to $249,999689 $250,000 to $299,999683 $300,000 to $399,999845 $400,000 to $499,999448 $500,000 to $749,999240 $750,000 to $999,99918 $1,000,000 to $1,499,999Rent paid by renters in 2022 in zip code 78724 4 Less than $10011 $250 to $29921 $350 to $39911 $400 to $44935 $450 to $49915 $500 to $549113 $600 to $649122 $650 to $69913 $750 to $799228 $800 to $899266 $900 to $999839 $1,000 to $1,249596 $1,250 to $1,499527 $1,500 to $1,999113 $2,000 to $2,49920 $3,500 or more73 No cash rent
Median gross rent in 2022: $1,440.
Median price asked for vacant for-sale houses and condos in 2022: $264,531.
Estimated median house (or condo) value in 2022 for: White Non-Hispanic householders: $298,197Black or African American householders: $306,290American Indian or Alaska Native householders: $276,897Asian householders: $362,096Some other race householders: $331,850Hispanic or Latino householders: $311,402Estimated median house or condo value in 2022: $259,431
78724:
$259,431Texas:
$275,400
Lower value quartile - upper value quartile: $66,009 - $412,884
Mean price in 2022: Detached houses: $737,673Here:
$737,673State:
$369,058
Townhouses or other attached units: $533,017Here:
$533,017State:
$327,631
In 2-unit structures: $1,093,219Here:
$1,093,219State:
$374,947
In 3-to-4-unit structures: $301,152Here:
$301,152State:
$209,652
In 5-or-more-unit structures: $800,345Here:
$800,345State:
$413,944
Mobile homes: $105,214Here:
$105,214State:
$124,413
Housing units in structures:
One, detached: 5,125One, attached: 131Two: 1943 or 4: 2405 to 9: 10110 to 19: 65720 to 49: 28550 or more: 34Mobile homes: 2,022Boats, RVs, vans, etc.: 212Unemployment : 5.3%
Means of transportation to work in zip code 78724 64.5% 9,165 Drove a car alone17.5% 2,479 Carpooled1.4% 192 Bus or trolley bus1.7% 235 Walked0.5% 72 Other means15.0% 2,127 Worked at homeTravel time to work (commute) in zip code 78724 23 Less than 5 minutes371 5 to 9 minutes792 10 to 14 minutes1,687 15 to 19 minutes2,174 20 to 24 minutes1,235 25 to 29 minutes1,868 30 to 34 minutes866 35 to 39 minutes446 40 to 44 minutes1,279 45 to 59 minutes1,266 60 to 89 minutes80 90 or more minutes
Percentage of zip code residents living and working in this county: 91.5%
Household type by relationship:
Households: 29,092
Male householders: 3,367 (680 living alone ), Female householders: 5,577 (1,130 living alone )4,107 spouses (4,012 opposite-sex spouses ), 910 unmarried partners , (904 opposite-sex unmarried partners ), 10,389 children (10,004 natural , 22 adopted , 359 stepchildren ), 817 grandchildren , 339 brothers or sisters , 339 parents , 72 foster children , 437 other relatives , 1,344 non-relatives In group quarters: 1,212 (-1 institutionalized population )
Size of family households: 1,515 2-persons , 1,501 3-persons , 1,393 4-persons , 1,185 5-persons , 499 6-persons , 307 7-or-more-persons
Size of nonfamily households: 1,810 1-person , 385 2-persons , 143 3-persons , 96 4-persons , 22 6-persons
4,417 married couples with children. single-parent households (493 men , 2,691 women ).
41.2% of residents of 78724 zip code speak English at home. of residents speak Spanish at home (50% very well, 22% well, 20% not well, 7% not at all ).of residents speak other Indo-European language at home (84% very well, 10% well, 6% not well ).of residents speak Asian or Pacific Island language at home (100% very well ).of residents speak other language at home (54% very well, 19% well, 14% not well, 13% not at all ).
Foreign born population: 8,099 (27.8%)
(21.2%
of them are naturalized citizens )
This zip code:
27.8%Whole state:
17.2%
69% Honduras 8% Guatemala 5% Costa Rica 3% Barbados 3% Bhutan 2% Uruguay 2% Liberia 2% American 1% Portuguese 1% German 1% Irish 1% Nigerian 1% Ethiopian 1% English
Year of entry for the foreign-born population
2,995 2010 or later 2,710 2000 to 2009 2,143 1990 to 1999 1,052 Before 1990
There are
8 Medical Specialists in Zip Code 78724 .
Facilities with environmental interests located in this zip code:
AUSTIN ISD (7309 LAZY CREEK in AUSTIN, TX)
(National Center for Education Statistics) - STATE ID-227901010 (Resource Conservation and Recovery Act (tracking hazardous waste)) Alternative names: AUSTIN ISD LYNDON BAINES JOHNSON HS, LBJ HIGH SCHOOL
A 1 AUTOMOTIVE (3418 DUKE RD in AUSTIN, TX)
(Resource Conservation and Recovery Act (tracking hazardous waste))
AMT INC (8107 ALTOGA DR in AUSTIN, TX)
(Resource Conservation and Recovery Act (tracking hazardous waste)) Business NAICS classification: OTHER PRESSED AND BLOWN GLASS AND GLASSWARE MANUFACTURING.Alternative names: CRYCO QUARTZ
APPLIED MATERIALS INCORPORATED (9700 U.S. HWY. 290 E. in AUSTIN, TX)
PERFORMANCE TRACK (National Environmental Performance Track) Conditionally Exempt Small Quantity Generators, less than 100 kg/month of hazardous waste (Resource Conservation and Recovery Act (tracking hazardous waste)) TRI REPORTER (Tracking of toxic chemicals releasing facilities) Business SIC classification: SPECIAL INDUSTRY MACHINERYBusiness NAICS classification: ALL OTHER INDUSTRIAL MACHINERY MANUFACTURING.Alternative names: APPLIED MATERIALS INC.
AZTEC MARKING COMPANY INC (5100 COMMERCIAL PARK DRIVE in AUSTIN, TX)
Small Quantity Generators, between 100 kg and 1000 kg of hazardous waste/month (Resource Conservation and Recovery Act (tracking hazardous waste)) - notification
Housing units lacking complete plumbing facilities: 2.3%
Housing units lacking complete kitchen facilities: 2.7%
56.5% Electricity 39.7% Utility gas 3.4% Bottled, tank, or LP gas
Population in 1990: 6,465. Population change in the 1990s: +8,963 (+138.6%).
Place of birth for U.S.-born residents:
This state: 16,078Northeast: 779Midwest: 720South: 1,099West: 1,539
45% of the 78724 zip code residents lived in the same house 5 years ago.
Out of people who lived in different houses, 72% lived in this county.
Out of people who lived in different counties, 50% lived in Texas.
88% of the 78724 zip code residents lived in the same house 1 year ago.
Out of people who lived in different houses, 38% moved from this county.
Out of people who lived in different houses, 35% moved from different county within same state.
Out of people who lived in different houses, 6% moved from different state.
Out of people who lived in different houses, 23% moved from abroad.
Private vs. public school enrollment:
Students in private schools in grades 1 to 8 (elementary and middle school): 484
Students in private schools in grades 9 to 12 (high school): 255
Students in private undergraduate colleges: 457
Occupation by median earnings in the past 12 months ($)
140,031 Architecture and engineering occupations 103,167 Legal occupations 82,046 Life, physical, and social science occupations 79,663 Health diagnosing and treating practitioners and other technical occupations 76,540 Computer and mathematical occupations 72,931 Business and financial operations occupations
Companies with federal contracts located in this zip code (AUSTIN, TX):
REDDY ICE CORP (LOC 301) (7901 SPRINGDALE ROAD) in 122 contracts from 2002 to 2006
Contracts for Beverages, Nonalcoholic, Water Distillation Equipment, Marine and Industrial, Condiments and Related Products, Food Services by ArmySigned by year: 2000: $0; 2001: $0; 2002: $408,498; 2003: $382,089; 2004: $199,740; 2005: $174,324; 2006: $789,987.
Biggest contracts: with Army for Beverages, Nonalcoholic. Signed on 2006-03-14. Completion date: 2003-03-31.
, same as above. Signed on 2003-06-03. Completion date: 2003-06-30.
, same as above. Signed on 2005-05-03. Completion date: 2005-06-30.
, same as above. Signed on 2002-06-27. Completion date: 2002-07-31.
AUSTIN SALES, INC (7803 FM 969; small business) in 14 contracts from 2001 to 2006
Contracts for Lease or Rental of Equipment -- Service and Trade Equipment, Maintenance, Repair or Alteration of Real Property -- Other Non-Building Facilities, Scaffolding Equipment and Concrete Forms, Recreational and Gymnastic Equipment, and more by ArmySigned by year: 2000: $0; 2001: $25,498; 2002: $0; 2003: $0; 2004: $5,700; 2005: $96,775; 2006: $10,250.
Biggest contracts: with Army for Lease or Rental of Equipment -- Service and Trade Equipment. Signed on 2005-04-01. Completion date: 2005-04-10.
with Army for Maintenance, Repair or Alteration of Real Property -- Other Non-Building Facilities. Signed on 2005-04-08. Completion date: 2005-04-11.
with Army for Scaffolding Equipment and Concrete Forms. Signed on 2001-09-19. Completion date: 2001-09-29.
with Army for Recreational and Gymnastic Equipment. Signed on 2005-05-19. Completion date: 2005-06-08.
GRINNELL CORPORATION (4901B COMMERCIAL PARK DR)
$39,397 with Army for Maintenance, Repair and Rebuilding of Equipment -- Special Industry Machinery. Signed on 2000-04-05. Completion date: 2000-05-12.
FLASH CUBES ICE SERVICE LLC (5005 COMMERCIAL PARK DR #; small business) in 3 contracts from 2005 to 2006
$6,400 with Army for Miscellaneous Items. Signed on 2005-06-01. Completion date: 2005-06-18.
with Army for Beverages, Nonalcoholic. Signed on 2006-06-30. Completion date: 2006-07-15.
with Army for Miscellaneous Items. Signed on 2005-07-14. Completion date: 2005-06-18.
Top industries in this zip code by the number of employees in 2005:
Wholesale Trade: Beer and Ale Merchant Wholesalers (250-499 employees: 1 establishment)Health Care and Social Assistance: Child and Youth Services (100-249: 1)Construction: Plumbing, Heating, and Air-Conditioning Contractors (50-99: 2, 5-9: 1, 1-4: 2)Construction: Painting and Wall Covering Contractors (50-99: 1, 20-49: 1)Other Services (except Public Administration): Religious Organizations (50-99: 1, 5-9: 1, 1-4: 1)Construction: Roofing Contractors (50-99: 1, 5-9: 1)
People in group quarters in 2010:
1,105 people in state prisons
62 people in nursing facilities/skilled-nursing facilities
9 people in workers' group living quarters and job corps centers
6 people in group homes intended for adults
People in group quarters in 2000:
988 people in state prisons
55 people in nursing homes
22 people in homes or halfway houses for drug/alcohol abuse
10 people in other noninstitutional group quarters
3 people in homes for the mentally retarded
Fatal accident statistics in 2014:
Fatal accident count: 5Vehicles involved in fatal accidents: 7Fatal accidents caused by drunken drivers: 1Fatalities: 5Persons involved in fatal accidents: 12Pedestrians involved in fatal accidents: 1
Fatal accident statistics in 2013:
Fatal accident count: 6Vehicles involved in fatal accidents: 10Fatal accidents caused by drunken drivers: 1Fatalities: 6Persons involved in fatal accidents: 12Pedestrians involved in fatal accidents: 2
Home Mortgage Disclosure Act Aggregated Statistics For Year 2009(Based on 4 full and 2 partial tracts) A) FHA, FSA/RHS & VA B) Conventional C) Refinancings D) Home Improvement Loans F) Non-occupant Loans on G) Loans On Manufactured Number Average Value Number Average Value Number Average Value Number Average Value Number Average Value Number Average Value
LOANS ORIGINATED 182 $144,707 107 $83,653 117 $130,931 11 $46,814 23 $111,056 53 $46,976 APPLICATIONS APPROVED, NOT ACCEPTED 4 $107,910 44 $46,008 12 $89,734 0 $0 4 $64,820 35 $34,142 APPLICATIONS DENIED 23 $128,216 25 $62,398 125 $104,343 80 $30,962 24 $88,524 30 $45,325 APPLICATIONS WITHDRAWN 34 $131,664 13 $98,803 36 $137,935 7 $35,477 6 $88,547 2 $52,000 FILES CLOSED FOR INCOMPLETENESS 3 $118,570 2 $75,430 15 $95,219 8 $53,396 0 $0 0 $0
Aggregated Statistics For Year 2008(Based on 4 full and 2 partial tracts) A) FHA, FSA/RHS & VA B) Conventional C) Refinancings D) Home Improvement Loans F) Non-occupant Loans on G) Loans On Manufactured Number Average Value Number Average Value Number Average Value Number Average Value Number Average Value Number Average Value
LOANS ORIGINATED 199 $145,478 162 $127,960 75 $103,631 33 $27,451 63 $117,477 28 $92,985 APPLICATIONS APPROVED, NOT ACCEPTED 12 $100,695 33 $83,671 12 $95,735 2 $11,000 4 $72,500 19 $43,221 APPLICATIONS DENIED 54 $134,794 43 $91,810 172 $91,903 98 $23,553 23 $78,913 24 $49,382 APPLICATIONS WITHDRAWN 34 $142,952 35 $124,674 77 $88,704 9 $38,364 22 $100,084 5 $40,560 FILES CLOSED FOR INCOMPLETENESS 4 $99,360 16 $103,199 19 $100,605 5 $17,786 0 $0 2 $24,615
Aggregated Statistics For Year 2007(Based on 4 full and 2 partial tracts) A) FHA, FSA/RHS & VA B) Conventional C) Refinancings D) Home Improvement Loans F) Non-occupant Loans on G) Loans On Manufactured Number Average Value Number Average Value Number Average Value Number Average Value Number Average Value Number Average Value
LOANS ORIGINATED 112 $140,031 480 $94,887 120 $104,322 35 $26,282 196 $95,518 32 $50,290 APPLICATIONS APPROVED, NOT ACCEPTED 8 $110,206 58 $111,324 32 $94,714 11 $24,415 25 $92,944 10 $77,904 APPLICATIONS DENIED 16 $119,993 115 $81,644 283 $113,843 95 $30,419 93 $109,609 26 $69,417 APPLICATIONS WITHDRAWN 14 $112,391 50 $116,360 129 $106,195 9 $21,763 35 $107,177 8 $73,500 FILES CLOSED FOR INCOMPLETENESS 3 $133,393 31 $126,775 41 $97,640 2 $23,820 4 $83,860 2 $23,820
Aggregated Statistics For Year 2006(Based on 4 full and 2 partial tracts) A) FHA, FSA/RHS & VA B) Conventional C) Refinancings D) Home Improvement Loans F) Non-occupant Loans on G) Loans On Manufactured Number Average Value Number Average Value Number Average Value Number Average Value Number Average Value Number Average Value
LOANS ORIGINATED 70 $116,368 503 $76,895 195 $78,772 29 $44,207 285 $76,685 11 $64,238 APPLICATIONS APPROVED, NOT ACCEPTED 0 $0 73 $83,799 28 $82,849 10 $49,326 37 $98,651 10 $39,065 APPLICATIONS DENIED 19 $105,322 206 $78,686 351 $80,745 111 $30,405 105 $85,676 52 $48,790 APPLICATIONS WITHDRAWN 24 $116,876 101 $77,804 222 $84,306 21 $41,190 68 $67,152 5 $59,924 FILES CLOSED FOR INCOMPLETENESS 0 $0 7 $97,854 52 $81,430 2 $7,940 6 $66,527 0 $0
Aggregated Statistics For Year 2005(Based on 4 full and 2 partial tracts) A) FHA, FSA/RHS & VA B) Conventional C) Refinancings D) Home Improvement Loans F) Non-occupant Loans on G) Loans On Manufactured Number Average Value Number Average Value Number Average Value Number Average Value Number Average Value Number Average Value
LOANS ORIGINATED 103 $108,024 550 $71,893 237 $80,589 31 $68,543 314 $69,065 13 $58,352 APPLICATIONS APPROVED, NOT ACCEPTED 17 $104,584 75 $58,789 47 $72,059 6 $10,057 17 $75,259 26 $43,793 APPLICATIONS DENIED 18 $99,759 159 $82,235 537 $78,008 82 $35,195 78 $85,912 63 $56,034 APPLICATIONS WITHDRAWN 35 $110,304 102 $60,720 242 $89,418 51 $120,015 46 $58,217 11 $63,498 FILES CLOSED FOR INCOMPLETENESS 2 $59,000 25 $104,009 69 $87,320 4 $24,620 10 $82,417 2 $74,000
Aggregated Statistics For Year 2004(Based on 4 full and 2 partial tracts) A) FHA, FSA/RHS & VA B) Conventional C) Refinancings D) Home Improvement Loans F) Non-occupant Loans on G) Loans On Manufactured Number Average Value Number Average Value Number Average Value Number Average Value Number Average Value Number Average Value
LOANS ORIGINATED 174 $109,751 322 $86,782 307 $76,858 17 $48,764 175 $85,237 45 $59,373 APPLICATIONS APPROVED, NOT ACCEPTED 31 $116,308 46 $84,698 70 $76,530 10 $24,640 15 $98,665 26 $70,270 APPLICATIONS DENIED 51 $101,201 163 $68,872 604 $73,591 78 $27,050 42 $67,110 107 $45,065 APPLICATIONS WITHDRAWN 31 $100,560 52 $81,278 380 $81,648 19 $42,827 30 $73,111 10 $70,800 FILES CLOSED FOR INCOMPLETENESS 12 $84,647 15 $88,076 64 $86,622 2 $29,400 10 $99,466 6 $81,953
Aggregated Statistics For Year 2003(Based on 4 full and 2 partial tracts) A) FHA, FSA/RHS & VA B) Conventional C) Refinancings D) Home Improvement Loans F) Non-occupant Loans on Number Average Value Number Average Value Number Average Value Number Average Value Number Average Value
LOANS ORIGINATED 69 $100,826 164 $77,017 421 $76,644 23 $16,696 122 $82,630 APPLICATIONS APPROVED, NOT ACCEPTED 9 $97,329 73 $73,279 97 $74,126 8 $27,790 27 $75,106 APPLICATIONS DENIED 21 $83,671 215 $58,168 499 $73,525 70 $22,853 69 $86,818 APPLICATIONS WITHDRAWN 23 $100,083 33 $112,635 332 $78,110 11 $42,189 38 $108,024 FILES CLOSED FOR INCOMPLETENESS 6 $90,477 16 $88,498 28 $68,778 0 $0 2 $32,340
Aggregated Statistics For Year 2002(Based on 4 full and 2 partial tracts) A) FHA, FSA/RHS & VA B) Conventional C) Refinancings D) Home Improvement Loans F) Non-occupant Loans on Number Average Value Number Average Value Number Average Value Number Average Value Number Average Value
LOANS ORIGINATED 80 $88,519 228 $67,824 353 $72,934 22 $11,582 168 $86,851 APPLICATIONS APPROVED, NOT ACCEPTED 4 $51,688 85 $53,863 82 $62,414 26 $36,227 20 $84,085 APPLICATIONS DENIED 18 $85,684 255 $55,542 330 $64,963 57 $15,499 41 $76,356 APPLICATIONS WITHDRAWN 19 $97,811 32 $105,769 274 $75,771 7 $8,654 19 $87,353 FILES CLOSED FOR INCOMPLETENESS 2 $75,430 14 $59,595 38 $77,690 0 $0 2 $66,000
Aggregated Statistics For Year 2001(Based on 4 full and 2 partial tracts) A) FHA, FSA/RHS & VA B) Conventional C) Refinancings D) Home Improvement Loans F) Non-occupant Loans on Number Average Value Number Average Value Number Average Value Number Average Value Number Average Value
LOANS ORIGINATED 144 $86,641 368 $60,485 301 $70,484 58 $12,490 163 $84,658 APPLICATIONS APPROVED, NOT ACCEPTED 6 $88,858 123 $52,526 56 $67,851 9 $18,493 21 $78,430 APPLICATIONS DENIED 22 $86,281 429 $47,509 251 $64,091 99 $14,802 27 $73,712 APPLICATIONS WITHDRAWN 18 $97,288 35 $80,416 204 $67,642 15 $14,704 10 $63,936 FILES CLOSED FOR INCOMPLETENESS 4 $91,480 6 $83,117 49 $65,934 0 $0 8 $87,216
Aggregated Statistics For Year 2000(Based on 4 full and 2 partial tracts) A) FHA, FSA/RHS & VA B) Conventional C) Refinancings D) Home Improvement Loans F) Non-occupant Loans on Number Average Value Number Average Value Number Average Value Number Average Value Number Average Value
LOANS ORIGINATED 224 $80,669 488 $51,570 125 $57,075 18 $15,093 100 $65,174 APPLICATIONS APPROVED, NOT ACCEPTED 37 $59,831 160 $51,912 31 $58,653 15 $24,188 26 $59,443 APPLICATIONS DENIED 61 $77,426 796 $47,954 108 $59,663 51 $13,009 39 $52,565 APPLICATIONS WITHDRAWN 25 $82,740 39 $55,461 51 $63,983 8 $10,780 14 $55,541 FILES CLOSED FOR INCOMPLETENESS 2 $88,000 7 $84,911 50 $68,971 2 $27,440 4 $67,000
Aggregated Statistics For Year 1999(Based on 3 full and 1 partial tracts) A) FHA, FSA/RHS & VA B) Conventional C) Refinancings D) Home Improvement Loans F) Non-occupant Loans on Number Average Value Number Average Value Number Average Value Number Average Value Number Average Value
LOANS ORIGINATED 113 $74,252 145 $46,523 76 $51,819 9 $8,710 33 $67,075 APPLICATIONS APPROVED, NOT ACCEPTED 3 $65,090 43 $46,867 23 $40,986 3 $8,853 6 $49,597 APPLICATIONS DENIED 29 $78,089 225 $48,915 56 $50,902 32 $10,592 26 $64,956 APPLICATIONS WITHDRAWN 16 $81,156 20 $61,638 34 $51,079 2 $36,410 4 $41,732 FILES CLOSED FOR INCOMPLETENESS 0 $0 6 $56,785 17 $51,386 1 $22,000 3 $41,637
Detailed HMDA statistics for the following Tracts:
0022.01
,
0022.02 ,
0022.05
Private Mortgage Insurance Companies Aggregated Statistics For Year 2009(Based on 4 full and 2 partial tracts) A) Conventional B) Refinancings Number Average Value Number Average Value
LOANS ORIGINATED 12 $161,165 6 $105,632 APPLICATIONS APPROVED, NOT ACCEPTED 8 $182,422 2 $127,835 APPLICATIONS DENIED 3 $153,507 0 $0 APPLICATIONS WITHDRAWN 3 $119,630 0 $0 FILES CLOSED FOR INCOMPLETENESS 0 $0 0 $0
Aggregated Statistics For Year 2008(Based on 4 full and 2 partial tracts) A) Conventional B) Refinancings C) Non-occupant Loans on Number Average Value Number Average Value Number Average Value
LOANS ORIGINATED 71 $147,462 11 $239,775 27 $158,062 APPLICATIONS APPROVED, NOT ACCEPTED 16 $154,631 2 $81,780 2 $75,430 APPLICATIONS DENIED 13 $189,748 0 $0 2 $101,630 APPLICATIONS WITHDRAWN 5 $109,572 0 $0 3 $118,570 FILES CLOSED FOR INCOMPLETENESS 3 $136,567 0 $0 3 $136,567
Aggregated Statistics For Year 2007(Based on 4 full and 2 partial tracts) A) Conventional B) Refinancings C) Non-occupant Loans on Number Average Value Number Average Value Number Average Value
LOANS ORIGINATED 126 $126,840 3 $107,453 27 $113,991 APPLICATIONS APPROVED, NOT ACCEPTED 8 $151,258 0 $0 2 $78,605 APPLICATIONS DENIED 0 $0 0 $0 0 $0 APPLICATIONS WITHDRAWN 6 $89,270 0 $0 0 $0 FILES CLOSED FOR INCOMPLETENESS 0 $0 0 $0 0 $0
Aggregated Statistics For Year 2006(Based on 4 full and 2 partial tracts) A) Conventional B) Refinancings C) Non-occupant Loans on Number Average Value Number Average Value Number Average Value
LOANS ORIGINATED 43 $103,600 6 $86,547 12 $88,160 APPLICATIONS APPROVED, NOT ACCEPTED 7 $86,090 0 $0 5 $99,726 APPLICATIONS DENIED 2 $69,080 0 $0 2 $69,080 APPLICATIONS WITHDRAWN 4 $120,435 0 $0 0 $0 FILES CLOSED FOR INCOMPLETENESS 0 $0 0 $0 0 $0
Aggregated Statistics For Year 2005(Based on 4 full and 2 partial tracts) A) Conventional B) Refinancings C) Non-occupant Loans on Number Average Value Number Average Value Number Average Value
LOANS ORIGINATED 40 $96,958 6 $105,333 22 $99,672 APPLICATIONS APPROVED, NOT ACCEPTED 6 $67,020 2 $159,000 2 $95,060 APPLICATIONS DENIED 3 $95,280 0 $0 2 $71,460 APPLICATIONS WITHDRAWN 2 $91,140 0 $0 0 $0 FILES CLOSED FOR INCOMPLETENESS 0 $0 0 $0 0 $0
Aggregated Statistics For Year 2004(Based on 4 full and 2 partial tracts) A) Conventional B) Refinancings C) Non-occupant Loans on Number Average Value Number Average Value Number Average Value
LOANS ORIGINATED 48 $98,846 7 $94,246 40 $102,768 APPLICATIONS APPROVED, NOT ACCEPTED 7 $109,557 8 $97,262 8 $110,558 APPLICATIONS DENIED 0 $0 0 $0 0 $0 APPLICATIONS WITHDRAWN 4 $106,938 0 $0 2 $101,920 FILES CLOSED FOR INCOMPLETENESS 0 $0 0 $0 0 $0
Aggregated Statistics For Year 2003(Based on 4 full and 2 partial tracts) A) Conventional B) Refinancings C) Non-occupant Loans on Number Average Value Number Average Value Number Average Value
LOANS ORIGINATED 36 $105,126 31 $111,138 20 $130,884 APPLICATIONS APPROVED, NOT ACCEPTED 6 $62,427 16 $82,164 2 $15,000 APPLICATIONS DENIED 4 $88,095 0 $0 4 $88,095 APPLICATIONS WITHDRAWN 6 $65,253 6 $99,458 6 $100,920 FILES CLOSED FOR INCOMPLETENESS 4 $81,642 0 $0 0 $0
Aggregated Statistics For Year 2002(Based on 4 full and 2 partial tracts) A) Conventional B) Refinancings C) Non-occupant Loans on Number Average Value Number Average Value Number Average Value
LOANS ORIGINATED 52 $107,901 22 $88,453 29 $94,231 APPLICATIONS APPROVED, NOT ACCEPTED 4 $65,820 9 $93,728 4 $65,820 APPLICATIONS DENIED 4 $61,672 4 $86,000 4 $61,672 APPLICATIONS WITHDRAWN 3 $65,637 10 $98,868 5 $74,318 FILES CLOSED FOR INCOMPLETENESS 2 $85,260 0 $0 0 $0
Aggregated Statistics For Year 2001(Based on 4 full and 2 partial tracts) A) Conventional B) Refinancings C) Non-occupant Loans on Number Average Value Number Average Value Number Average Value
LOANS ORIGINATED 82 $120,387 9 $101,918 40 $114,665 APPLICATIONS APPROVED, NOT ACCEPTED 10 $96,464 4 $84,980 10 $99,464 APPLICATIONS DENIED 2 $70,000 2 $67,490 4 $68,745 APPLICATIONS WITHDRAWN 4 $93,590 0 $0 4 $93,590 FILES CLOSED FOR INCOMPLETENESS 2 $77,810 0 $0 0 $0
Aggregated Statistics For Year 2000(Based on 4 full and 2 partial tracts) A) Conventional B) Refinancings C) Non-occupant Loans on Number Average Value Number Average Value Number Average Value
LOANS ORIGINATED 64 $77,954 10 $59,372 40 $76,438 APPLICATIONS APPROVED, NOT ACCEPTED 2 $41,290 2 $94,000 4 $67,645 APPLICATIONS DENIED 12 $73,430 0 $0 6 $83,600 APPLICATIONS WITHDRAWN 2 $70,000 2 $51,000 0 $0 FILES CLOSED FOR INCOMPLETENESS 2 $59,780 0 $0 2 $59,780
Aggregated Statistics For Year 1999(Based on 2 full and 1 partial tracts) A) Conventional B) Refinancings C) Non-occupant Loans on Number Average Value Number Average Value Number Average Value
LOANS ORIGINATED 14 $75,523 1 $193,000 6 $72,333 APPLICATIONS APPROVED, NOT ACCEPTED 1 $122,000 1 $95,000 2 $108,500 APPLICATIONS DENIED 1 $81,000 1 $49,260 2 $65,130 APPLICATIONS WITHDRAWN 0 $0 0 $0 0 $0 FILES CLOSED FOR INCOMPLETENESS 0 $0 0 $0 0 $0
Detailed PMIC statistics for the following Tracts:
0022.01
,
0022.02 ,
0022.05
2002 - 2018 National Fire Incident Reporting System (NFIRS) incidents See full 2006 National Fire Incident Reporting System statistics for zip code 78724, Texas
Most common first names in zip code 78724 among deceased individuals Name Count Lived (average)
James 25 62.4 years Mary 21 68.4 years John 17 64.5 years Willie 13 72.7 years William 13 62.5 years Robert 11 70.2 years Joe 10 57.7 years Fred 9 59.9 years Ruth 8 78.7 years Charles 8 61.8 years
Most common last names in zip code 78724 among deceased individuals Last name Count Lived (average)
Jones 19 66.9 years Jackson 14 58.2 years Williams 14 61.2 years Johnson 10 66.5 years Smith 9 73.4 years Rodriguez 8 57.5 years Martinez 8 64.3 years Meredith 7 78.2 years Fowler 6 76.0 years Brown 6 54.0 years
Businesses in zip code 78724
Name Count Name Count
FedEx 2 Penske 1 Jack In The Box 1 U-Haul 1 McDonald's 1
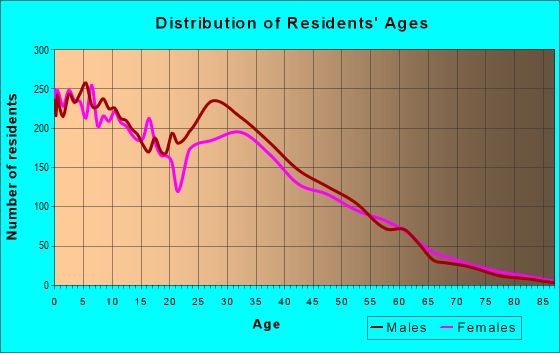
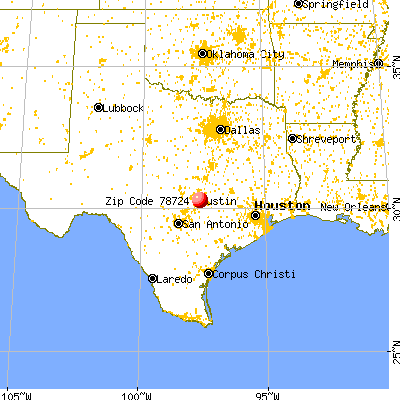


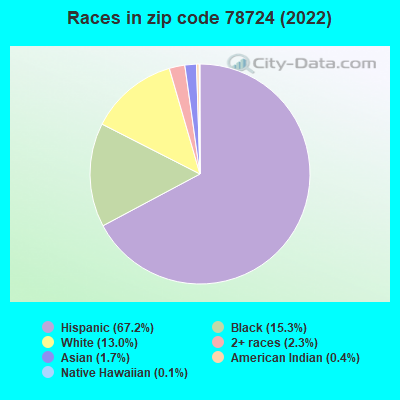


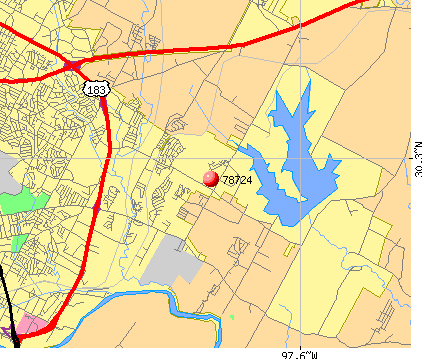 Nearest zip codes: 78754, 78725, 78723, 78742, 78721, 78752.
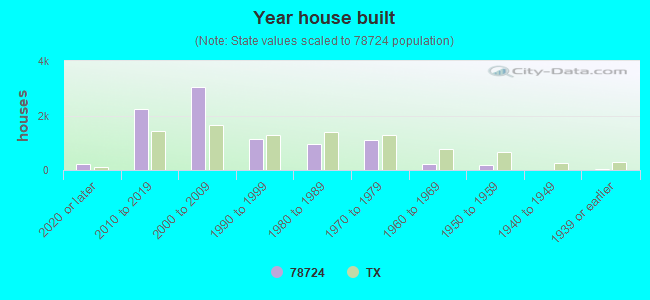

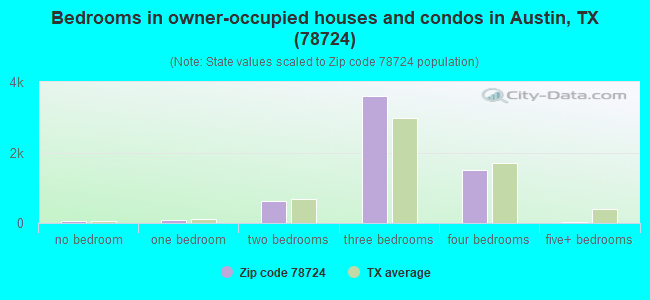
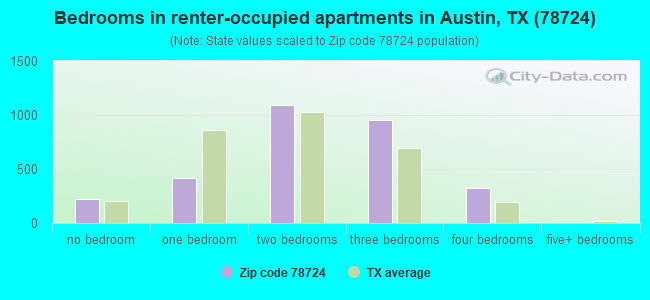
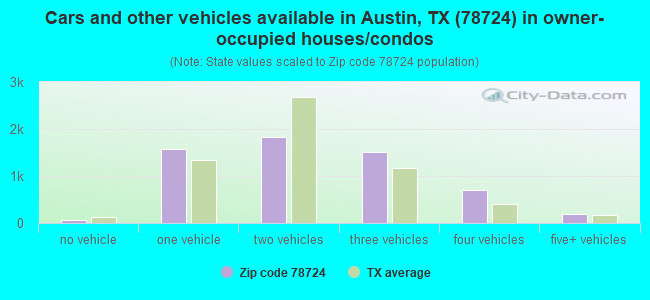
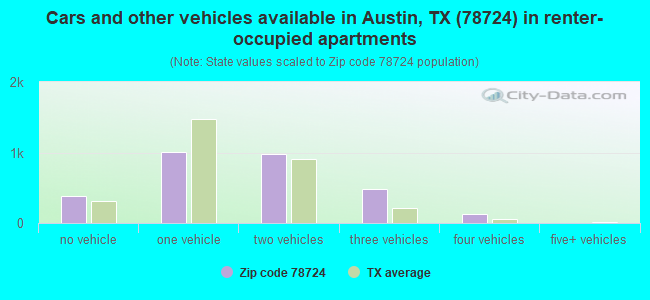


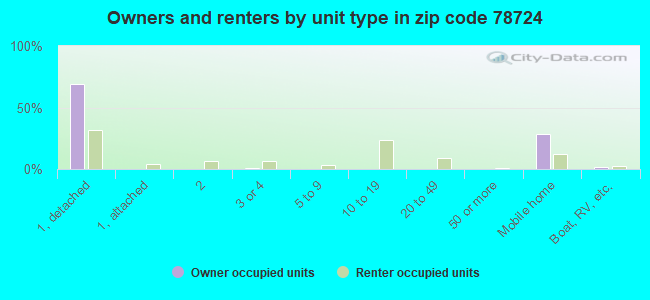
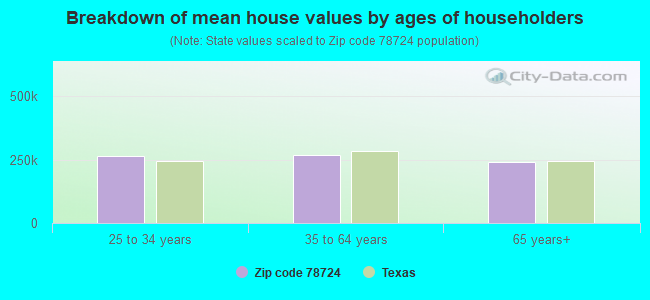


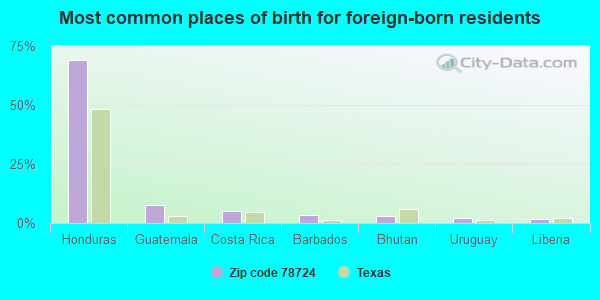
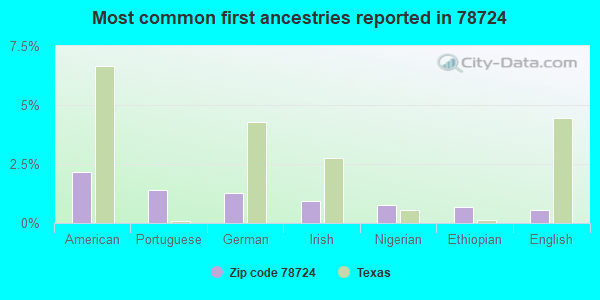
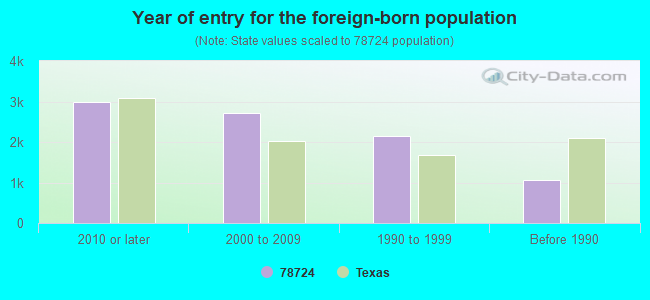


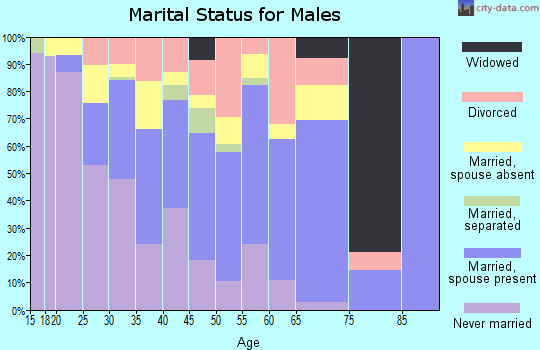
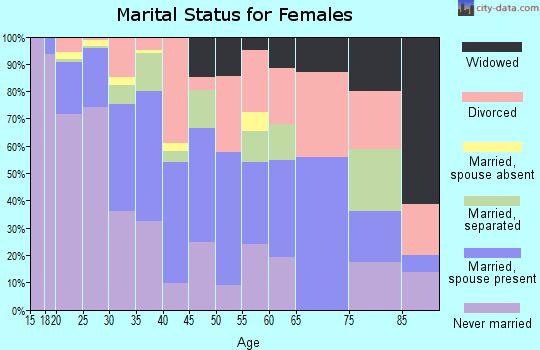
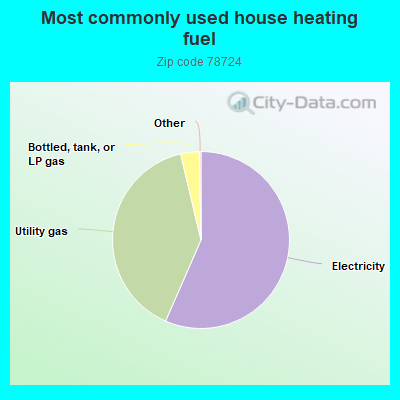
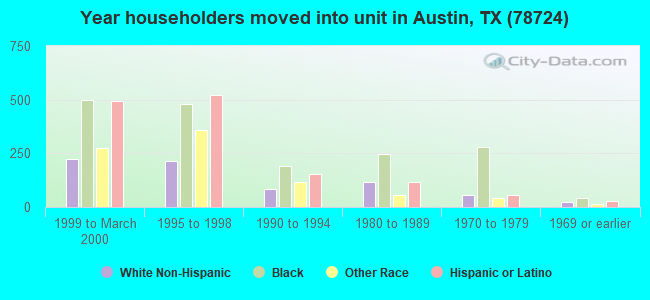
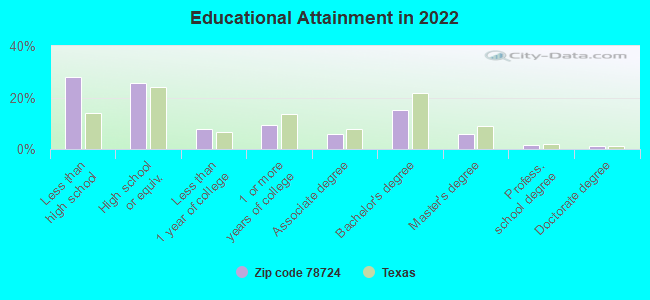
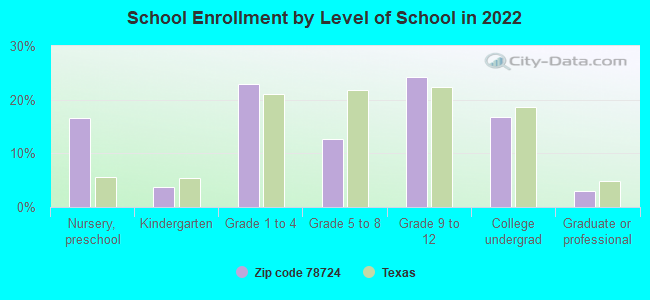
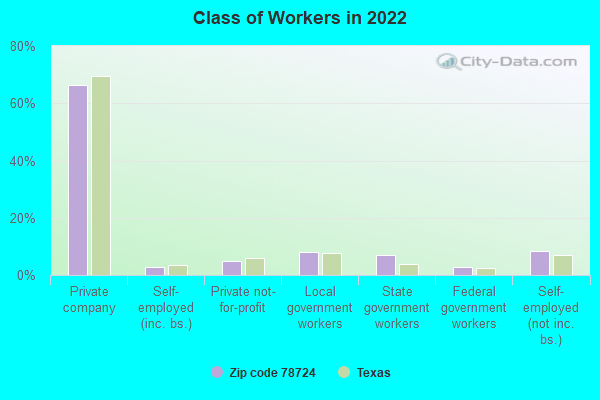
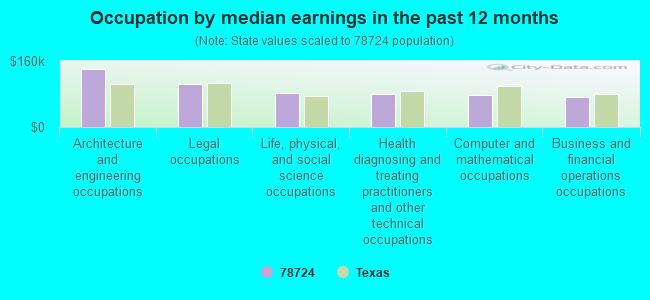
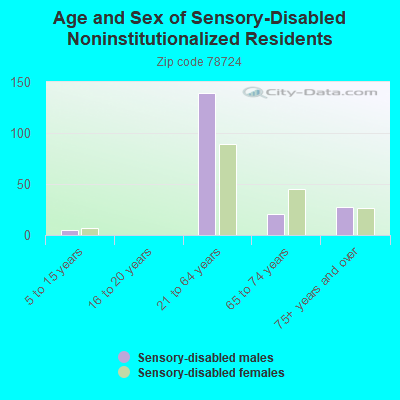
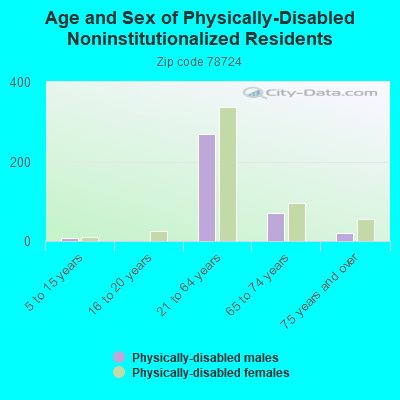
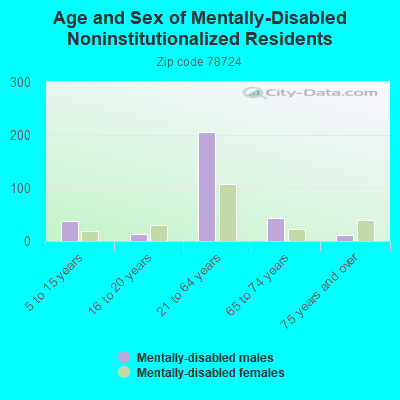
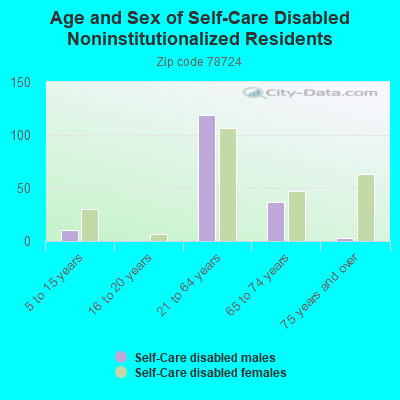
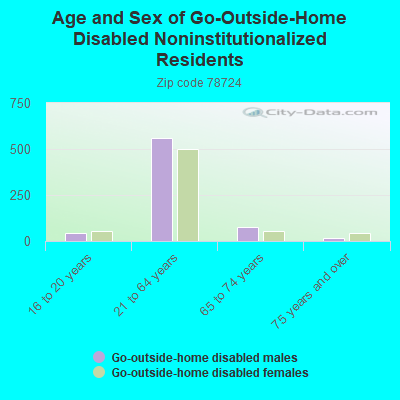
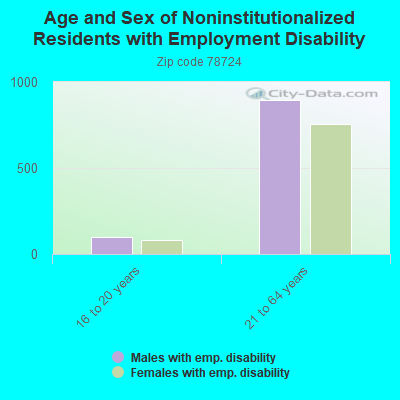
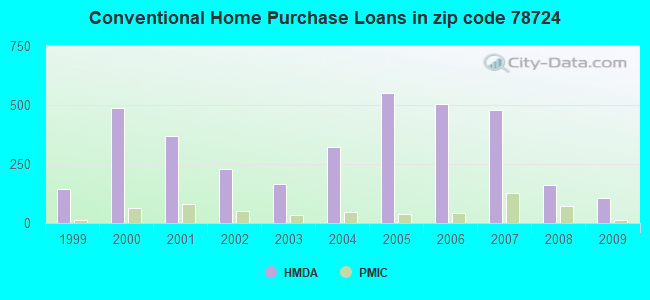
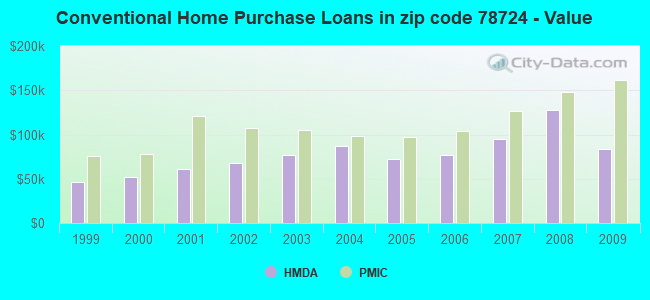
 According to the data from the years 2002 - 2018 the average number of fires per year is 65. The highest number of reported fires - 128 took place in 2014, and the least - 33 in 2003. The data has a growing trend.
 When looking into fire subcategories, the most incidents belonged to: Outside Fires (54.0%), and Structure Fires (24.2%).