Estimated zip code population in 2022: 31,946 Zip code population in 2010: 15,036 Zip code population in 2000: 5,422
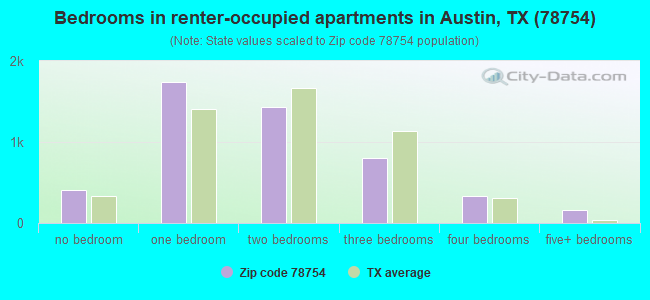
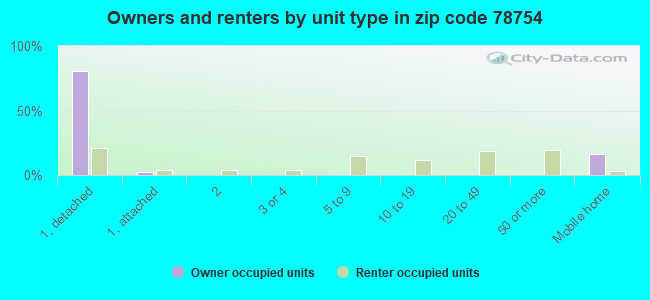
Houses and condos: 12,826 Renter-occupied apartments: 4,858
% of renters here:
39%
State:
38%
March 2022 cost of living index in zip code 78754: 93.2 (less than average, U.S. average is 100)
Land area: 13.2 sq. mi. Water area: 0.0 sq. mi.
Population density: 2,411 people per square mile
(low).
OSM Map
General Map
Google Map
MSN Map
OSM Map
General Map
Google Map
MSN Map
OSM Map
General Map
Google Map
MSN Map
OSM Map
General Map
Google Map
MSN Map
Please wait while loading the map...
Real estate property taxes paid for housing units in 2022:
This zip code:
1.8% ($5,978)
Texas:
1.5% ($4,050)
Median real estate property taxes paid for housing units with mortgages in 2022: $6,427 (1.9%) Median real estate property taxes paid for housing units with no mortgage in 2022: $3,716 (1.3%)
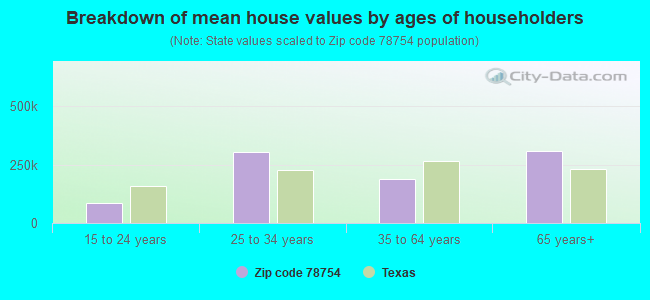
Estimated median house/condo value in 2022: $333,373
78754:
$333,373
Texas:
$275,400
According to our research of Texas and other state lists, there were 33 registered sex offenders living in 78754 zip code as of April 27, 2024. The ratio of all residents to sex offenders in zip code 78754 is 669 to 1. The ratio of registered sex offenders to all residents in this zip code is lower than the state average.
Median resident age:
This zip code:
34.5 years
Texas median age:
35.6 years
Average household size:
This zip code:
2.5 people
Texas:
2.6 people
Averages for the 2020 tax year for zip code 78754, filed in 2021:
Average Adjusted Gross Income (AGI) in 2020: $60,190 (Individual Income Tax Returns)
Here:
$60,190
State:
$77,054
Salary/wage: $57,240 (reported on 88.0% of returns)
Here:
$57,240
State:
$62,766
(% of AGI for various income ranges: 1248.9% for AGIs below $25k, 3904.7% for AGIs $25k-50k, 7149.8% for AGIs $50k-75k, 10770.4% for AGIs $75k-100k, 19518.7% for AGIs $100k-200k, 75356.0% for AGIs over 200k)
Taxable interest for individuals: $595 (reported on 18.2% of returns)
This zip code:
$595
Texas:
$2,665
(% of AGI for various income ranges: 3.9% for AGIs below $25k, 5.4% for AGIs $25k-50k, 12.9% for AGIs $50k-75k, 20.8% for AGIs $75k-100k, 47.2% for AGIs $100k-200k, 244.0% for AGIs over 200k)
Ordinary dividends: $1,690 (reported on 12.7% of returns)
Here:
$1,690
State:
$10,044
(% of AGI for various income ranges: 5.9% for AGIs below $25k, 7.7% for AGIs $25k-50k, 14.9% for AGIs $50k-75k, 45.6% for AGIs $75k-100k, 86.8% for AGIs $100k-200k, 855.0% for AGIs over 200k)
Net capital gain/loss in AGI: +$7,099 (reported on 13.5% of returns)
Here:
+$7,099
State:
+$39,590
(% of AGI for various income ranges: 5.7% for AGIs below $25k, 17.1% for AGIs $25k-50k, 39.2% for AGIs $50k-75k, 86.4% for AGIs $75k-100k, 322.4% for AGIs $100k-200k, 7470.0% for AGIs over 200k)
Profit/loss from business: +$9,784 (reported on 21.6% of returns)
Here:
+$9,784
State:
+$10,888
(% of AGI for various income ranges: 217.5% for AGIs below $25k, 246.3% for AGIs $25k-50k, 312.4% for AGIs $50k-75k, 250.8% for AGIs $75k-100k, 396.6% for AGIs $100k-200k, 2119.0% for AGIs over 200k)
Taxable individual retirement arrangement distribution: $17,750 (reported on 2.8% of returns)
78754:
$17,750
Texas:
$24,740
(% of AGI for various income ranges: 12.1% for AGIs below $25k, 22.0% for AGIs $25k-50k, 41.0% for AGIs $50k-75k, 77.3% for AGIs $75k-100k, 170.7% for AGIs $100k-200k, 2532.0% for AGIs over 200k)
Total itemized deductions: $23,090 (reported on 7.1% of returns)
Here:
$23,090
State:
$40,428
(% of AGI for various income ranges: 38.1% for AGIs below $25k, 89.5% for AGIs $25k-50k, 225.8% for AGIs $50k-75k, 398.2% for AGIs $75k-100k, 625.9% for AGIs $100k-200k, 3570.0% for AGIs over 200k)
Charity contributions: $7,355 (reported on 4.1% of returns)
Here:
$7,355
State:
$18,201
(% of AGI for various income ranges: 2.3% for AGIs below $25k, 11.1% for AGIs $25k-50k, 31.0% for AGIs $50k-75k, 65.6% for AGIs $75k-100k, 156.8% for AGIs $100k-200k, 817.0% for AGIs over 200k)
Taxes paid: $6,942 (reported on 7.0% of returns)
78754:
$6,942
State:
$7,821
(% of AGI for various income ranges: 8.6% for AGIs below $25k, 22.6% for AGIs $25k-50k, 74.0% for AGIs $50k-75k, 135.5% for AGIs $75k-100k, 201.2% for AGIs $100k-200k, 736.0% for AGIs over 200k)
Earned income credit: $2,231 (reported on 15.5% of returns)
Here:
$2,231
State:
$2,584
(% of AGI for various income ranges: 101.0% for AGIs below $25k, 57.3% for AGIs $25k-50k, 1.0% for AGIs $50k-75k)
Percentage of individuals using paid preparers for their 2020 taxes: 91.6%
Here:
92%
State:
92%
(% for various income ranges: 88.4% for AGIs below $25k, 92.4% for AGIs $25k-50k, 92.2% for AGIs $50k-75k, 94.6% for AGIs $75k-100k, 93.3% for AGIs $100k-200k, 90.9% for AGIs over 200k)
Averages for the 2012 tax year for zip code 78754, filed in 2013:
Average Adjusted Gross Income (AGI) in 2012: $46,897 (Individual Income Tax Returns)
Here:
$46,897
State:
$65,384
Salary/wage: $45,066 (reported on 89.8% of returns)
Here:
$45,066
State:
$52,524
(% of AGI for various income ranges: 81.7% for AGIs below $25k, 90.2% for AGIs $25k-50k, 88.8% for AGIs $50k-75k, 88.3% for AGIs $75k-100k, 86.6% for AGIs $100k-200k, 64.1% for AGIs over 200k)
Taxable interest for individuals: $627 (reported on 20.5% of returns)
This zip code:
$627
Texas:
$2,372
(% of AGI for various income ranges: 0.3% for AGIs below $25k, 0.1% for AGIs $25k-50k, 0.4% for AGIs $50k-75k, 0.2% for AGIs $75k-100k, 0.3% for AGIs $100k-200k, 0.2% for AGIs over 200k)
Ordinary dividends: $2,467 (reported on 10.1% of returns)
Here:
$2,467
State:
$9,721
(% of AGI for various income ranges: 1.2% for AGIs below $25k, 0.4% for AGIs $25k-50k, 0.4% for AGIs $50k-75k, 0.3% for AGIs $75k-100k, 0.5% for AGIs $100k-200k, 1.5% for AGIs over 200k)
Net capital gain/loss in AGI: +$4,271 (reported on 8.3% of returns)
Here:
+$4,271
State:
+$35,319
(% of AGI for various income ranges: 0.2% for AGIs $25k-50k, 0.3% for AGIs $50k-75k, 0.3% for AGIs $75k-100k, 1.0% for AGIs $100k-200k, 6.0% for AGIs over 200k)
Profit/loss from business: +$9,181 (reported on 16.0% of returns)
Here:
+$9,181
State:
+$13,732
(% of AGI for various income ranges: 11.5% for AGIs below $25k, 3.6% for AGIs $25k-50k, 2.0% for AGIs $50k-75k, 2.3% for AGIs $75k-100k, 1.4% for AGIs $100k-200k)
Taxable individual retirement arrangement distribution: $12,315 (reported on 3.9% of returns)
78754:
$12,315
Texas:
$19,511
(% of AGI for various income ranges: 1.1% for AGIs below $25k, 0.7% for AGIs $25k-50k, 1.1% for AGIs $50k-75k, 1.2% for AGIs $75k-100k, 1.4% for AGIs $100k-200k)
Total itemized deductions: $16,529 (21% of AGI, reported on 24.4% of returns)
Here:
$16,529
State:
$24,724
Here:
21.1% of AGI
State:
15.9% of AGI
(% of AGI for various income ranges: 6.9% for AGIs below $25k, 7.1% for AGIs $25k-50k, 9.9% for AGIs $50k-75k, 10.7% for AGIs $75k-100k, 9.3% for AGIs $100k-200k, 5.0% for AGIs over 200k)
Charity contributions: $3,224 (reported on 16.2% of returns)
Here:
$3,224
State:
$6,808
(% of AGI for various income ranges: 0.3% for AGIs below $25k, 0.6% for AGIs $25k-50k, 1.1% for AGIs $50k-75k, 1.6% for AGIs $75k-100k, 1.7% for AGIs $100k-200k, 1.1% for AGIs over 200k)
Taxes paid: $4,748 (reported on 23.7% of returns)
78754:
$4,748
State:
$6,921
(% of AGI for various income ranges: 1.3% for AGIs below $25k, 1.8% for AGIs $25k-50k, 2.8% for AGIs $50k-75k, 2.9% for AGIs $75k-100k, 2.9% for AGIs $100k-200k, 1.9% for AGIs over 200k)
Earned income credit: $2,171 (reported on 20.4% of returns)
Here:
$2,171
State:
$2,570
(% of AGI for various income ranges: 6.9% for AGIs below $25k, 1.0% for AGIs $25k-50k)
Percentage of individuals using paid preparers for their 2012 taxes: 36.7%
Here:
37%
State:
51%
(% for various income ranges: 40.1% for AGIs below $25k, 32.5% for AGIs $25k-50k, 36.8% for AGIs $50k-75k, 34.7% for AGIs $75k-100k, 38.8% for AGIs $100k-200k, 66.7% for AGIs over 200k)
Averages for the 2004 tax year for zip code 78754, filed in 2005:
Average Adjusted Gross Income (AGI) in 2004: $43,008 (Individual Income Tax Returns)
Here:
$43,008
State:
$47,881
Salary/wage: $41,091 (reported on 91.0% of returns)
Here:
$41,091
State:
$41,947
(% of AGI for various income ranges: 106.3% for AGIs below $10k, 85.3% for AGIs $10k-25k, 91.2% for AGIs $25k-50k, 87.7% for AGIs $50k-75k, 84.7% for AGIs $75k-100k, 81.8% for AGIs over 100k)
Taxable interest for individuals: $888 (reported on 31.9% of returns)
This zip code:
$888
Texas:
$2,255
(% of AGI for various income ranges: 3.0% for AGIs below $10k, 1.1% for AGIs $10k-25k, 0.3% for AGIs $25k-50k, 0.6% for AGIs $50k-75k, 0.6% for AGIs $75k-100k, 0.8% for AGIs over 100k)
Taxable dividends: $919 (reported on 13.7% of returns)
Here:
$919
State:
$4,261
(% of AGI for various income ranges: 1.6% for AGIs below $10k, 0.4% for AGIs $10k-25k, 0.2% for AGIs $25k-50k, 0.2% for AGIs $50k-75k, 0.3% for AGIs $75k-100k, 0.4% for AGIs over 100k)
Net capital gain/loss: +$3,195 (reported on 13.6% of returns)
Here:
+$3,195
State:
+$16,110
(% of AGI for various income ranges: -1.4% for AGIs below $10k, -0.2% for AGIs $10k-25k, 0.0% for AGIs $25k-50k, 0.4% for AGIs $50k-75k, 1.2% for AGIs $75k-100k, 3.5% for AGIs over 100k)
Profit/loss from business: +$8,007 (reported on 14.9% of returns)
Here:
+$8,007
State:
+$11,013
(% of AGI for various income ranges: 3.5% for AGIs below $10k, 5.7% for AGIs $10k-25k, 2.8% for AGIs $25k-50k, 2.3% for AGIs $50k-75k, 2.5% for AGIs $75k-100k, 2.2% for AGIs over 100k)
IRA payment deduction: $2,587 (reported on 1.9% of returns)
78754:
$2,587
Texas:
$3,120
Self-employed pension: $3,300 (reported on 0.3% of returns)
Here:
$3,300
Texas:
$16,401
Total itemized deductions: $16,022 (22% of AGI, reported on 27.9% of returns)
Here:
$16,022
State:
$19,631
Here:
22.2% of AGI
State:
18.9% of AGI
(% of AGI for various income ranges: 11.1% for AGIs below $10k, 5.9% for AGIs $10k-25k, 7.9% for AGIs $25k-50k, 10.9% for AGIs $50k-75k, 13.2% for AGIs $75k-100k, 12.7% for AGIs over 100k)
Charity contributions deductions: $2,998 (4% of AGI, reported on 22.2% of returns)
Here:
$2,998
State:
$4,753
Here:
4.1% of AGI
State:
4.2% of AGI
(% of AGI for various income ranges: 0.6% for AGIs below $10k, 0.6% for AGIs $10k-25k, 1.1% for AGIs $25k-50k, 1.6% for AGIs $50k-75k, 2.1% for AGIs $75k-100k, 2.1% for AGIs over 100k)
Total tax: $5,738 (reported on 80.9% of returns)
78754:
$5,738
State:
$9,058
(% of AGI for various income ranges: 3.4% for AGIs below $10k, 4.6% for AGIs $10k-25k, 8.1% for AGIs $25k-50k, 10.7% for AGIs $50k-75k, 11.6% for AGIs $75k-100k, 16.9% for AGIs over 100k)
Earned income credit: $1,692 (reported on 13.4% of returns)
Here:
$1,692
State:
$2,024
Percentage of individuals using paid preparers for their 2004 taxes: 38.6%
Here:
39%
State:
57%
(% for various income ranges: 38.1% for AGIs below $10k, 45.1% for AGIs $10k-25k, 37.1% for AGIs $25k-50k, 36.1% for AGIs $50k-75k, 31.8% for AGIs $75k-100k, 40.2% for AGIs over 100k)
Likely homosexual households (counted as self-reported same-sex unmarried-partner households)
Lesbian couples: 0.5% of all households
Gay men: 0.1% of all households
Household received Food Stamps/SNAP in the past 12 months: 1,432 Household did not receive Food Stamps/SNAP in the past 12 months: 11,125
Women who had a birth in the past 12 months: 486 (496 now married, 0 unmarried) Women who did not have a birth in the past 12 months: 8,462 (3,610 now married, 4,856 unmarried)
Housing units in zip code 78754 with a mortgage: 5,512 (105 second mortgage, 47 home equity loan, 58 both second mortgage and home equity loan) Median monthly owner costs for units with a mortgage: $2,076 Median monthly owner costs for units without a mortgage: $807
Residents with income below the poverty level in 2022:
This zip code:
15.8%
Whole state:
14.0%
Residents with income below 50% of the poverty level in 2022:
This zip code:
11.9%
Whole state:
7.4%
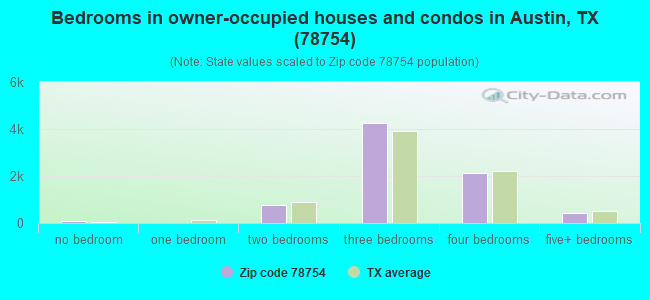
Median number of rooms in houses and condos:
Here:
5.8
State:
6.3
Median number of rooms in apartments:
Here:
3.7
State:
4.0
Notable locations in this zip code not listed on our city pages
Notable locations in zip code 78754: Sprinkle (A), Harris Branch Wastewater Treatment Plant (B), Austin Recovery Center (C), Jourdan- Bachman Pioneer Farm (D), Austin Fire Department Station 41 (E), Austin / Travis County Emergency Medical Service - Medic 23 (F), William Braxton Barr House (G). Display/hide their locations on the map
Churches in zip code 78754 include: Cornerstone Baptist Church (A), Woodcliff Baptist Church (B), High Pointe Fellowship Church (C), Good Korean Church of the Nazarene (D), High Pointe Baptist Church (E), Noah's Ark Learing Center (F), Unity Center (G), Aquarian Foundation (H). Display/hide their locations on the map
Tourist attraction (not listed on the city page) : Barr Mansion (Arcades & Amusements; 10463 Sprinkle Rd).
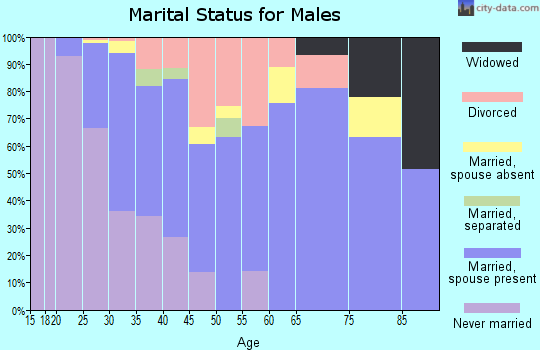
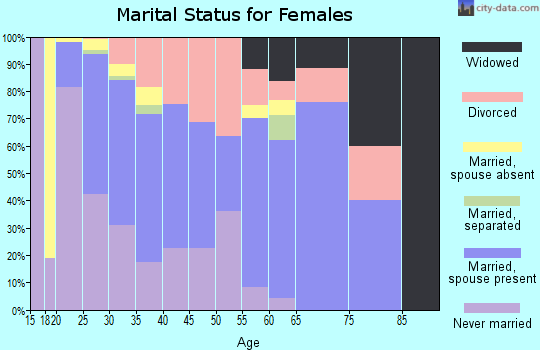
5,621 married couples with children.
1,819 single-parent households (390 men, 1,429 women).
50.7% of residents of 78754 zip code speak English at home.
30.1% of residents speak Spanish at home (63% very well, 13% well, 18% not well, 6% not at all).
3.8% of residents speak other Indo-European language at home (71% very well, 22% well, 3% not well, 4% not at all).
10.0% of residents speak Asian or Pacific Island language at home (42% very well, 37% well, 17% not well, 5% not at all).
4.8% of residents speak other language at home (80% very well, 10% well, 6% not well, 5% not at all).
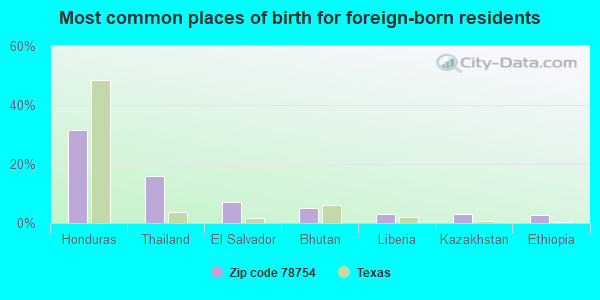
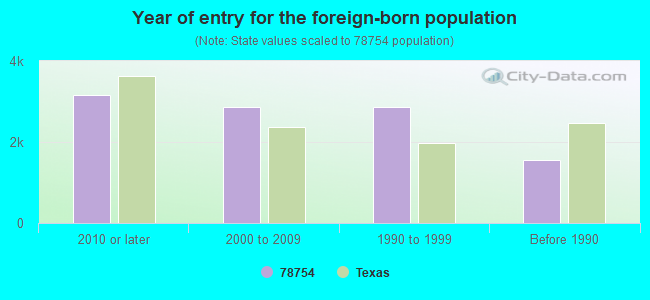
Foreign born population: 9,799 (30.7%) (44.4% of them are naturalized citizens)
Facilities with environmental interests located in this zip code:
AERA INC (8601 CROSS PARK DR STE 100 in AUSTIN, TX)
(Resource Conservation and Recovery Act (tracking hazardous waste)) Business NAICS classification: INSTRUMENTS AND RELATED PRODUCTS MANUFACTURING FOR MEASURING, DISPLAYING, AND CONTROLLING INDUSTRIAL PROCESS VARIABLES.
AMERICAN MICROELECTRONICS INC (1611 HEADWAY CIR BLDG 3 in AUSTIN, TX)
(Resource Conservation and Recovery Act (tracking hazardous waste)) Business NAICS classification: BARE PRINTED CIRCUIT BOARD MANUFACTURING.
APPLIED MATERIALS INC (9101 WALL ST in AUSTIN, TX)
Large Quantity Generators, more that 1000 kg of hazardous waste/month (Resource Conservation and Recovery Act (tracking hazardous waste)) - notification
ACCELERATED TECHNOLOGIES INC (1611 HEADWAY CIRCLE BLDG 1 STE A in AUSTIN, TX)
Small Quantity Generators, between 100 kg and 1000 kg of hazardous waste/month (Resource Conservation and Recovery Act (tracking hazardous waste)) Business NAICS classification: SEMICONDUCTOR AND RELATED DEVICE MANUFACTURING. Alternative names: VEECO INSTRUMENTS
AUSTEX PRINTING & MAILING (2431 FORBES DR in AUSTIN, TX)
Small Quantity Generators, between 100 kg and 1000 kg of hazardous waste/month (Resource Conservation and Recovery Act (tracking hazardous waste)) Business NAICS classification: OTHER COMMERCIAL PRINTING. Alternative names: AUS EX PRINTING AND MAILING
AUSTIN COMMUNITY RECYCLING AND DISPOSA FACILITY (9900 GILES LANE in AUSTIN, TX)
CRITERIA AND HAZARDOUS AIR POLLUTANT INVENTORY (Inventory of air pollution sources) Business SIC classification: REFUSE SYSTEMS
Housing units lacking complete plumbing facilities: 0.5% Housing units lacking complete kitchen facilities: 0.5%
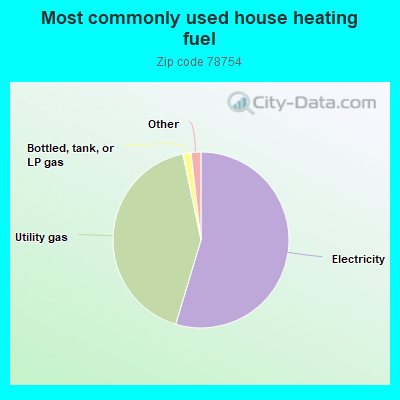
54.7%Electricity
42.1%Utility gas
1.5%Bottled, tank, or LP gas
0.9%Solar energy
0.6%Other fuel
Population in 1990: 2,328. Population change in the 1990s: +3,094 (+132.9%).
Place of birth for U.S.-born residents:
This state: 14,958
Northeast: 953
Midwest: 1,411
South: 1,866
West: 2,372
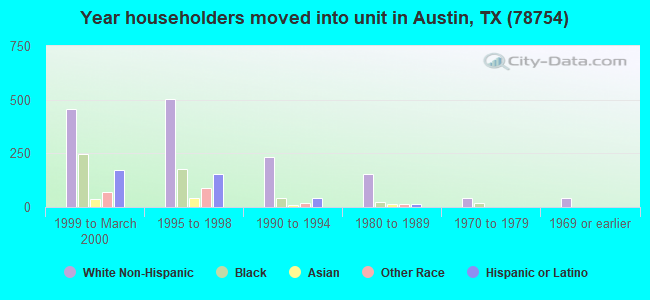
35% of the 78754 zip code residents lived in the same house 5 years ago. Out of people who lived in different houses, 58% lived in this county. Out of people who lived in different counties, 50% lived in Texas.
79% of the 78754 zip code residents lived in the same house 1 year ago. Out of people who lived in different houses, 67% moved from this county. Out of people who lived in different houses, 18% moved from different county within same state. Out of people who lived in different houses, 10% moved from different state. Out of people who lived in different houses, 1% moved from abroad.
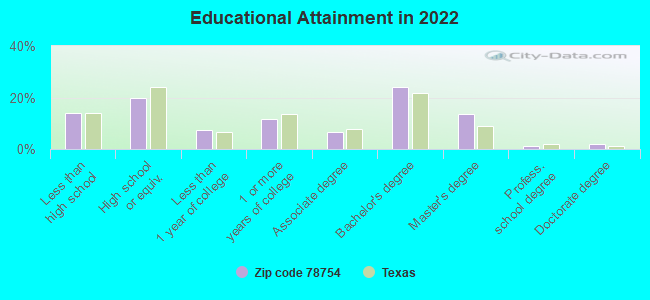
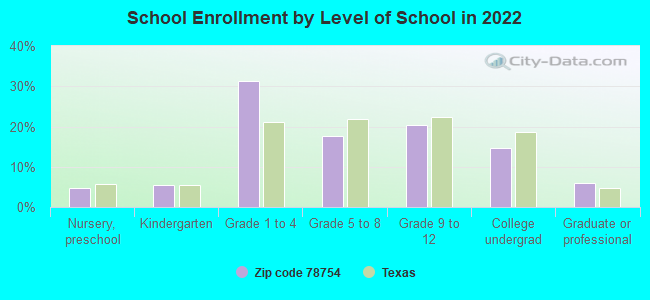
Private vs. public school enrollment:
Students in private schools in grades 1 to 8 (elementary and middle school): 130
Here:
3.9%
Texas:
8.8%
Students in private schools in grades 9 to 12 (high school): 59
Here:
4.3%
Texas:
8.0%
Students in private undergraduate colleges: 238
Here:
23.8%
Texas:
16.2%
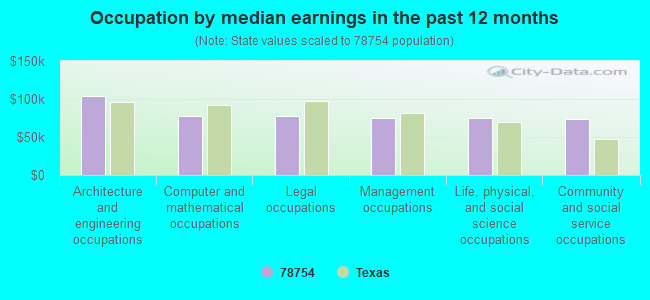
Occupation by median earnings in the past 12 months ($)
104,133Architecture and engineering occupations
78,022Computer and mathematical occupations
77,292Legal occupations
74,966Management occupations
74,688Life, physical, and social science occupations
74,334Community and social service occupations
Companies with biggest federal contracts located in this zip code (AUSTIN, TX):
HENSEL PHELPS CONSTRUCTION CO (8322 CROSS PARK DRIVE) : $66,013,407 in 134 contractsfrom 2000 to 2004
Contracts for Construction of Structures and Facilities -- Troop Housing Facilities, Construction of Structures and Facilities -- Miscellaneous Buildings by Army Signed by year:2000: $26,387; 2001: $35,949,441; 2002: $26,092,447; 2003: $3,490,704; 2004: $454,428; 2005: $0; 2006: $0.
Biggest contracts:
$35,897,000 with Army for Construction of Structures and Facilities -- Troop Housing Facilities. Taking place in MO. Signed on 2001-09-29. Completion date: 2003-10-01.
$25,738,000, same as above.Signed on 2002-02-08. Completion date: 2003-10-01.
$2,150,000, same as above.Signed on 2003-03-17. Completion date: 2003-10-01.
$543,191, same as above.Signed on 2003-06-02. Completion date: 2003-10-01.
PARSONS ENGINEERING SCIENCE IN (8000 CENTRE PARK DR # 200) : $44,907,805 in 225 contractsfrom 1999 to 2006
Contracts for Architect - Engineer Services (including landscaping, interior layout, and designing), Airfield, Communication and Missile Facilities, A&E Management Engineering Services, Other Architect and Engineering Services, and moreby Air Force Signed by year:2000: $6,107,757; 2001: $27,612,040; 2002: $6,525,179; 2003: $2,534,926; 2004: $1,639,068; 2005: $505,032; 2006: -$10,562.
Biggest contracts:
$18,734,252 with Air Force for Architect - Engineer Services (including landscaping, interior layout, and designing). Taking place in OK. Signed on 2001-09-25. Completion date: 2002-05-15.
$2,295,379 with Air Force for Airfield, Communication and Missile Facilities. Signed on 2001-09-25. Completion date: 2003-05-31.
$1,507,139 with Air Force for Architect - Engineer Services (including landscaping, interior layout, and designing). Taking place in OK. Signed on 2001-06-11. Completion date: 2002-09-12.
$1,151,054 with Air Force for Architect - Engineer Services (including landscaping, interior layout, and designing). Signed on 2002-04-11. Completion date: 2003-09-30.
FRESHPOINT - CITY PRODUCE LP (10300 SPRINGDALE RD; small business) : $2,627,010 in 156 contractsfrom 2002 to 2006
Contracts for Fruits and Vegetables by Defense Logistics Agency Signed by year:2000: $0; 2001: $0; 2002: $54,514; 2003: $0; 2004: $673,056; 2005: $1,283,039; 2006: $616,401.
Biggest contracts:
$48,078 with Defense Logistics Agency for Fruits and Vegetables. Signed on 2004-08-21. Completion date: 2004-08-21.
$46,133, same as above.Signed on 2005-01-07. Completion date: 2005-01-07.
$42,910, same as above.Signed on 2006-01-03. Completion date: 2006-01-03.
$41,429, same as above.Signed on 2004-12-03. Completion date: 2004-12-03.
XIDEX CORPORATION (8906 WALL STREET; small business) : $975,000 in 5 contractsfrom 2002 to 2004
Contracts for Physical Sciences -- Advanced Development (R&D), Other Research and Development -- Basic Research (R&D) by National Institute of Standards and Technology, Army Signed by year:2000: $0; 2001: $0; 2002: $100,000; 2003: $337,402; 2004: $537,598; 2005: $0; 2006: $0.
Biggest contracts:
$300,000 with National Institute of Standards and Technology for Physical Sciences -- Advanced Development (R&D). Signed on 2004-09-15. Completion date: 2006-09-15.
$262,402 with Army for Other Research and Development -- Basic Research (R&D). Signed on 2003-07-09. Completion date: 2004-07-13.
$237,598, same as above.Signed on 2004-07-07. Completion date: 2004-07-13.
$100,000, same as above.Signed on 2002-07-23. Completion date: 2003-01-31.
W K JENNINGS ELECTRIC CO (1707 DUNGAN LN) : $850,386 in 74 contractsfrom 1999 to 2001
Contracts for Construction of Structures and Facilities -- Highways, Roads, Streets, Bridges, and Railways (includes resurfacing), Maintenance, Repair or Alteration of Real Property -- Office Buildings, Construction of Structures and Facilities -- Other Utilities, Construction of Structures and Facilities -- Tunnels and Subsurface Structures by Army Signed by year:2000: $682,371; 2001: $122,362; 2002: $0; 2003: $0; 2004: $0; 2005: $0; 2006: $0.
Biggest contracts:
$182,320 with Army for Construction of Structures and Facilities -- Highways, Roads, Streets, Bridges, and Railways (includes resurfacing). Signed on 2000-02-25. Completion date: 2000-05-09.
$38,480, same as above.Signed on 2000-05-09. Completion date: 2000-05-10.
$34,800 with Army for Maintenance, Repair or Alteration of Real Property -- Office Buildings. Signed on 2001-05-03. Completion date: 2001-08-17.
$30,598 with Army for Construction of Structures and Facilities -- Highways, Roads, Streets, Bridges, and Railways (includes resurfacing). Signed on 2000-06-15. Completion date: 2000-09-21.
DTM CORPORATION (1611 HEADWAY CIRCLE BULD 2; small business)
$350,000 with Army for ADP Input/Output and Storage Devices. Signed on 2000-10-05. Completion date: 2003-11-29.
AUSTIN COMMUNITY COLLEGE DISTR (9101 TUSCANY WAY) : $114,595 in 3 contractsfrom 2000 to 2005
$69,000 with Bureau of Prisoners/Federal Prison System for Vocational/Technical. Signed on 2000-11-15. Completion date: 2001-09-15.
$42,000, same as above.Signed on 2000-11-15. Completion date: 2001-09-15.
$3,595 with Army for Communication Training Devices. Signed on 2005-08-11. Completion date: 2006-04-26.
ARTHUR FLUID SYSTEM TECHNOLOGI (8341 CROSS PARK DR; small business)
$37,925 with Air Force for Cable, Cord, and Wire Assemblies: Communications Equipment. Signed on 2004-05-01. Completion date: 2004-06-25.
AUSTIN SEMICONDUCTOR INTERNATI (8701 CROSS PARK DR; small business)
$29,503 with Department of Defense for Engineering and Technical Services. Signed on 2000-09-19. Completion date: 2000-11-30.
MEDICAL CARBON RESEARCH INSTIT (8200 CAMERON RD STE 196; small business) : $27,500 in 4 contractsfrom 2003 to 2004
$11,000 with Army for Medical and Surgical Instruments, Equipment, and Supplies. Signed on 2004-10-29. Completion date: 2004-10-22.
$5,500, same as above.Signed on 2004-09-14. Completion date: 2004-09-03.
$5,500, same as above.Signed on 2004-08-20. Completion date: 2004-08-12.
$5,500, same as above.Signed on 2003-01-09. Completion date: 2003-01-09.
Top industries in this zip code by the number of employees in 2005:
Administrative and Support and Waste Management and Remediation Services: Janitorial Services (500-999 employees: 1 establishment, 250-499 employees: 1 establishment, 10-19 employees: 1 establishment, 1-4 employees: 1 establishment)
Other Services (except Public Administration): Voluntary Health Organizations (250-499: 1, 50-99: 1)
Health Care and Social Assistance: Medical Laboratories (250-499: 1)
Construction: Site Preparation Contractors (250-499: 1)
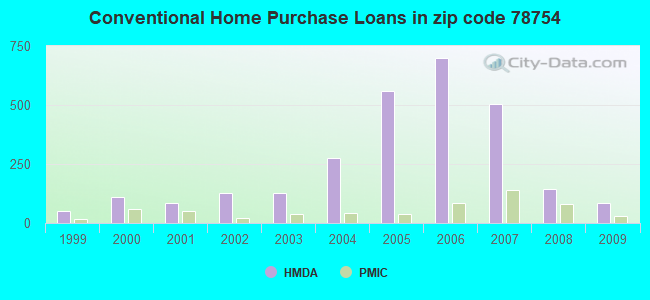
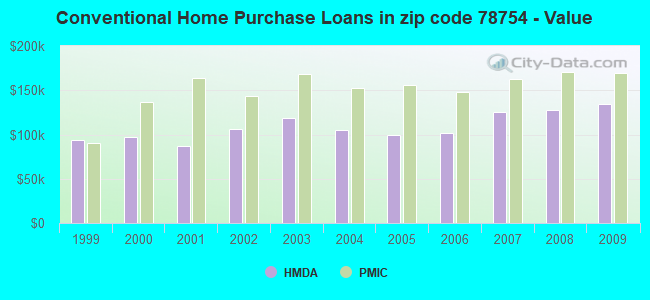
Detailed PMIC statistics for the following Tracts:0018.34
2002 - 2018 National Fire Incident Reporting System (NFIRS) incidents
According to the data from the years 2002 - 2018 the average number of fires per year is 21. The highest number of fire incidents - 41 took place in 2016, and the least - 6 in 2002. The data has an increasing trend.
When looking into fire subcategories, the most incidents belonged to: Outside Fires (52.4%), and Mobile Property/Vehicle Fires (24.6%).
Fire incident types reported to NFIRS in Zip Code 78754

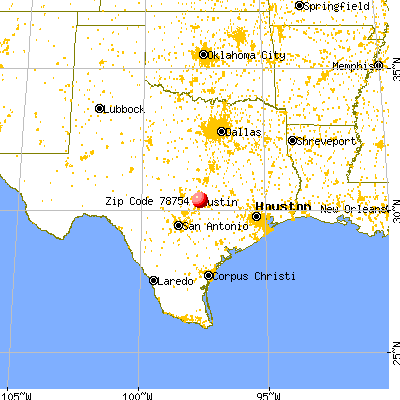


 Nearest zip codes: 78753, 78752, 78724, 78723, 78758, 78757.


 According to the data from the years 2002 - 2018 the average number of fires per year is 21. The highest number of fire incidents - 41 took place in 2016, and the least - 6 in 2002. The data has an increasing trend.
 When looking into fire subcategories, the most incidents belonged to: Outside Fires (52.4%), and Mobile Property/Vehicle Fires (24.6%).