Estimated zip code population in 2022: 116,434 Zip code population in 2010: 68,789 Zip code population in 2000: 34,428
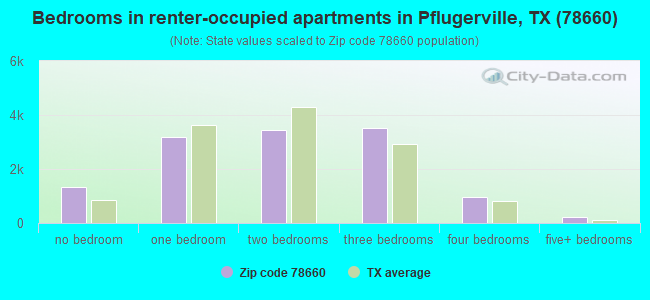
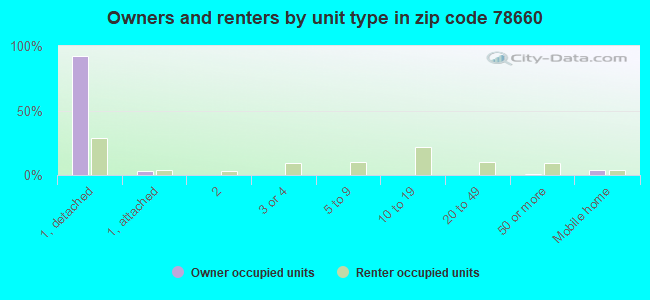
Houses and condos: 43,022 Renter-occupied apartments: 12,549
% of renters here:
30%
State:
38%
March 2022 cost of living index in zip code 78660: 93.4 (less than average, U.S. average is 100)
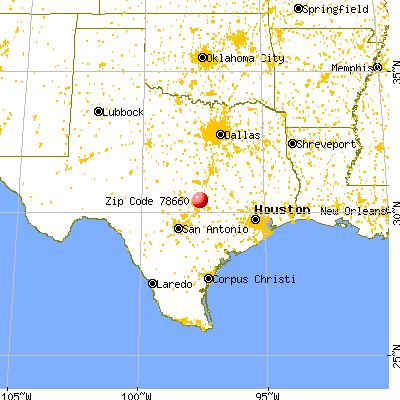
Land area: 45.3 sq. mi. Water area: 0.0 sq. mi.
Population density: 2,569 people per square mile
(average).
OSM Map
General Map
Google Map
MSN Map
OSM Map
General Map
Google Map
MSN Map
OSM Map
General Map
Google Map
MSN Map
OSM Map
General Map
Google Map
MSN Map
Please wait while loading the map...
Real estate property taxes paid for housing units in 2022:
This zip code:
1.8% ($6,867)
Texas:
1.5% ($4,050)
Median real estate property taxes paid for housing units with mortgages in 2022: $7,183 (1.8%) Median real estate property taxes paid for housing units with no mortgage in 2022: $6,128 (1.8%)
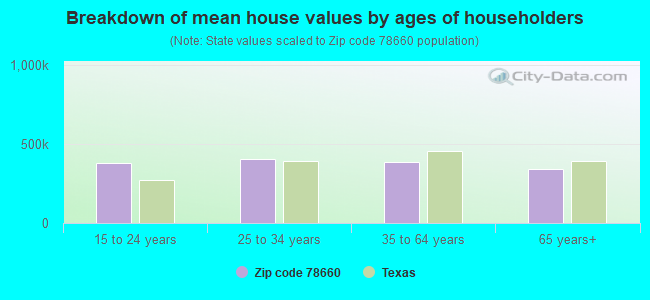
Estimated median house/condo value in 2022: $388,221
78660:
$388,221
Texas:
$275,400
According to our research of Texas and other state lists, there were 57 registered sex offenders living in 78660 zip code as of April 27, 2024. The ratio of all residents to sex offenders in zip code 78660 is 1,454 to 1. The ratio of registered sex offenders to all residents in this zip code is much lower than the state average.
Median resident age:
This zip code:
35.2 years
Texas median age:
35.6 years
Average household size:
This zip code:
2.8 people
Texas:
2.6 people
Averages for the 2020 tax year for zip code 78660, filed in 2021:
Average Adjusted Gross Income (AGI) in 2020: $72,282 (Individual Income Tax Returns)
Here:
$72,282
State:
$77,054
Salary/wage: $68,123 (reported on 87.9% of returns)
Here:
$68,123
State:
$62,766
(% of AGI for various income ranges: 1180.3% for AGIs below $25k, 3787.5% for AGIs $25k-50k, 6830.5% for AGIs $50k-75k, 10310.1% for AGIs $75k-100k, 19211.6% for AGIs $100k-200k, 68386.3% for AGIs over 200k)
Taxable interest for individuals: $759 (reported on 22.7% of returns)
This zip code:
$759
Texas:
$2,665
(% of AGI for various income ranges: 7.4% for AGIs below $25k, 8.4% for AGIs $25k-50k, 13.5% for AGIs $50k-75k, 30.2% for AGIs $75k-100k, 44.2% for AGIs $100k-200k, 299.5% for AGIs over 200k)
Ordinary dividends: $2,231 (reported on 15.2% of returns)
Here:
$2,231
State:
$10,044
(% of AGI for various income ranges: 7.4% for AGIs below $25k, 12.2% for AGIs $25k-50k, 26.6% for AGIs $50k-75k, 51.4% for AGIs $75k-100k, 88.9% for AGIs $100k-200k, 751.2% for AGIs over 200k)
Net capital gain/loss in AGI: +$11,996 (reported on 15.8% of returns)
Here:
+$11,996
State:
+$39,590
(% of AGI for various income ranges: 4.9% for AGIs below $25k, 15.7% for AGIs $25k-50k, 46.2% for AGIs $50k-75k, 106.0% for AGIs $75k-100k, 317.9% for AGIs $100k-200k, 8073.8% for AGIs over 200k)
Profit/loss from business: +$10,496 (reported on 20.0% of returns)
Here:
+$10,496
State:
+$10,888
(% of AGI for various income ranges: 173.2% for AGIs below $25k, 209.8% for AGIs $25k-50k, 224.8% for AGIs $50k-75k, 311.2% for AGIs $75k-100k, 415.5% for AGIs $100k-200k, 2060.4% for AGIs over 200k)
Taxable individual retirement arrangement distribution: $18,319 (reported on 4.3% of returns)
78660:
$18,319
Texas:
$24,740
(% of AGI for various income ranges: 21.9% for AGIs below $25k, 37.5% for AGIs $25k-50k, 73.4% for AGIs $50k-75k, 137.8% for AGIs $75k-100k, 261.9% for AGIs $100k-200k, 1033.0% for AGIs over 200k)
Self-employed (Keogh) retirement plans: $18,742 (reported on 0.2% of returns)
78660:
$18,742
Texas:
$29,298
(% of AGI for various income ranges: 3.1% for AGIs $50k-75k, 12.2% for AGIs $100k-200k, 138.1% for AGIs over 200k)
Total itemized deductions: $26,402 (reported on 8.8% of returns)
Here:
$26,402
State:
$40,428
(% of AGI for various income ranges: 30.3% for AGIs below $25k, 110.0% for AGIs $25k-50k, 294.5% for AGIs $50k-75k, 493.6% for AGIs $75k-100k, 729.3% for AGIs $100k-200k, 2743.7% for AGIs over 200k)
Charity contributions: $8,527 (reported on 6.4% of returns)
Here:
$8,527
State:
$18,201
(% of AGI for various income ranges: 2.5% for AGIs below $25k, 14.6% for AGIs $25k-50k, 44.6% for AGIs $50k-75k, 85.4% for AGIs $75k-100k, 188.1% for AGIs $100k-200k, 1024.0% for AGIs over 200k)
Taxes paid: $7,784 (reported on 8.6% of returns)
78660:
$7,784
State:
$7,821
(% of AGI for various income ranges: 8.3% for AGIs below $25k, 30.4% for AGIs $25k-50k, 92.5% for AGIs $50k-75k, 155.8% for AGIs $75k-100k, 214.8% for AGIs $100k-200k, 667.0% for AGIs over 200k)
Earned income credit: $2,183 (reported on 13.5% of returns)
Here:
$2,183
State:
$2,584
(% of AGI for various income ranges: 88.2% for AGIs below $25k, 62.0% for AGIs $25k-50k, 0.9% for AGIs $50k-75k)
Percentage of individuals using paid preparers for their 2020 taxes: 92.5%
Here:
93%
State:
92%
(% for various income ranges: 90.8% for AGIs below $25k, 92.8% for AGIs $25k-50k, 92.7% for AGIs $50k-75k, 92.6% for AGIs $75k-100k, 94.0% for AGIs $100k-200k, 93.5% for AGIs over 200k)
Averages for the 2012 tax year for zip code 78660, filed in 2013:
Average Adjusted Gross Income (AGI) in 2012: $56,553 (Individual Income Tax Returns)
Here:
$56,553
State:
$65,384
Salary/wage: $53,166 (reported on 90.7% of returns)
Here:
$53,166
State:
$52,524
(% of AGI for various income ranges: 80.9% for AGIs below $25k, 88.6% for AGIs $25k-50k, 86.9% for AGIs $50k-75k, 88.2% for AGIs $75k-100k, 88.5% for AGIs $100k-200k, 62.7% for AGIs over 200k)
Taxable interest for individuals: $592 (reported on 24.9% of returns)
This zip code:
$592
Texas:
$2,372
(% of AGI for various income ranges: 0.4% for AGIs below $25k, 0.2% for AGIs $25k-50k, 0.2% for AGIs $50k-75k, 0.3% for AGIs $75k-100k, 0.2% for AGIs $100k-200k, 0.5% for AGIs over 200k)
Ordinary dividends: $1,926 (reported on 13.1% of returns)
Here:
$1,926
State:
$9,721
(% of AGI for various income ranges: 0.6% for AGIs below $25k, 0.2% for AGIs $25k-50k, 0.3% for AGIs $50k-75k, 0.3% for AGIs $75k-100k, 0.4% for AGIs $100k-200k, 1.2% for AGIs over 200k)
Net capital gain/loss in AGI: +$6,125 (reported on 10.9% of returns)
Here:
+$6,125
State:
+$35,319
(% of AGI for various income ranges: 0.1% for AGIs $50k-75k, 0.2% for AGIs $75k-100k, 0.5% for AGIs $100k-200k, 10.3% for AGIs over 200k)
Profit/loss from business: +$11,184 (reported on 16.7% of returns)
Here:
+$11,184
State:
+$13,732
(% of AGI for various income ranges: 10.7% for AGIs below $25k, 4.1% for AGIs $25k-50k, 2.8% for AGIs $50k-75k, 1.9% for AGIs $75k-100k, 1.8% for AGIs $100k-200k, 5.1% for AGIs over 200k)
Taxable individual retirement arrangement distribution: $13,618 (reported on 5.0% of returns)
78660:
$13,618
Texas:
$19,511
(% of AGI for various income ranges: 1.2% for AGIs below $25k, 0.9% for AGIs $25k-50k, 1.3% for AGIs $50k-75k, 1.1% for AGIs $75k-100k, 1.5% for AGIs $100k-200k, 1.1% for AGIs over 200k)
Self-employment retirement plans: $14,400 (reported on 0.2% of returns)
78660:
$14,400
Texas:
$23,938
Total itemized deductions: $17,570 (20% of AGI, reported on 35.3% of returns)
Here:
$17,570
State:
$24,724
Here:
19.6% of AGI
State:
15.9% of AGI
(% of AGI for various income ranges: 8.0% for AGIs below $25k, 10.2% for AGIs $25k-50k, 12.6% for AGIs $50k-75k, 12.0% for AGIs $75k-100k, 11.4% for AGIs $100k-200k, 8.0% for AGIs over 200k)
Charity contributions: $3,415 (reported on 25.9% of returns)
Here:
$3,415
State:
$6,808
(% of AGI for various income ranges: 0.5% for AGIs below $25k, 0.9% for AGIs $25k-50k, 1.3% for AGIs $50k-75k, 1.6% for AGIs $75k-100k, 1.9% for AGIs $100k-200k, 2.5% for AGIs over 200k)
Taxes paid: $5,778 (reported on 34.9% of returns)
78660:
$5,778
State:
$6,921
(% of AGI for various income ranges: 2.1% for AGIs below $25k, 3.1% for AGIs $25k-50k, 4.0% for AGIs $50k-75k, 4.0% for AGIs $75k-100k, 3.9% for AGIs $100k-200k, 2.7% for AGIs over 200k)
Earned income credit: $2,267 (reported on 17.0% of returns)
Here:
$2,267
State:
$2,570
(% of AGI for various income ranges: 6.8% for AGIs below $25k, 1.2% for AGIs $25k-50k)
Percentage of individuals using paid preparers for their 2012 taxes: 33.8%
Here:
34%
State:
51%
(% for various income ranges: 33.9% for AGIs below $25k, 32.9% for AGIs $25k-50k, 33.9% for AGIs $50k-75k, 31.8% for AGIs $75k-100k, 34.4% for AGIs $100k-200k, 52.7% for AGIs over 200k)
Averages for the 2004 tax year for zip code 78660, filed in 2005:
Average Adjusted Gross Income (AGI) in 2004: $50,473 (Individual Income Tax Returns)
Here:
$50,473
State:
$47,881
Salary/wage: $48,717 (reported on 92.8% of returns)
Here:
$48,717
State:
$41,947
(% of AGI for various income ranges: 123.7% for AGIs below $10k, 85.4% for AGIs $10k-25k, 90.8% for AGIs $25k-50k, 91.0% for AGIs $50k-75k, 92.4% for AGIs $75k-100k, 85.4% for AGIs over 100k)
Taxable interest for individuals: $640 (reported on 36.3% of returns)
This zip code:
$640
Texas:
$2,255
(% of AGI for various income ranges: 2.6% for AGIs below $10k, 0.9% for AGIs $10k-25k, 0.5% for AGIs $25k-50k, 0.4% for AGIs $50k-75k, 0.3% for AGIs $75k-100k, 0.4% for AGIs over 100k)
Taxable dividends: $1,006 (reported on 16.5% of returns)
Here:
$1,006
State:
$4,261
(% of AGI for various income ranges: 1.2% for AGIs below $10k, 0.3% for AGIs $10k-25k, 0.2% for AGIs $25k-50k, 0.2% for AGIs $50k-75k, 0.3% for AGIs $75k-100k, 0.5% for AGIs over 100k)
Net capital gain/loss: +$3,451 (reported on 17.3% of returns)
Here:
+$3,451
State:
+$16,110
(% of AGI for various income ranges: -0.8% for AGIs below $10k, 0.0% for AGIs $10k-25k, 0.3% for AGIs $25k-50k, 0.5% for AGIs $50k-75k, 0.5% for AGIs $75k-100k, 3.1% for AGIs over 100k)
Profit/loss from business: +$8,297 (reported on 16.0% of returns)
Here:
+$8,297
State:
+$11,013
(% of AGI for various income ranges: -0.9% for AGIs below $10k, 6.5% for AGIs $10k-25k, 3.1% for AGIs $25k-50k, 1.9% for AGIs $50k-75k, 1.7% for AGIs $75k-100k, 2.9% for AGIs over 100k)
IRA payment deduction: $2,649 (reported on 1.6% of returns)
78660:
$2,649
Texas:
$3,120
(% of AGI for various income ranges: 0.2% for AGIs $10k-25k, 0.1% for AGIs $25k-50k, 0.1% for AGIs $50k-75k, 0.1% for AGIs $75k-100k, 0.1% for AGIs over 100k)
Self-employed pension: $8,351 (reported on 0.4% of returns)
Here:
$8,351
Texas:
$16,401
Total itemized deductions: $15,888 (22% of AGI, reported on 47.2% of returns)
Here:
$15,888
State:
$19,631
Here:
21.6% of AGI
State:
18.9% of AGI
(% of AGI for various income ranges: 12.7% for AGIs below $10k, 10.8% for AGIs $10k-25k, 16.1% for AGIs $25k-50k, 16.7% for AGIs $50k-75k, 15.9% for AGIs $75k-100k, 13.0% for AGIs over 100k)
Charity contributions deductions: $2,557 (3% of AGI, reported on 37.2% of returns)
Here:
$2,557
State:
$4,753
Here:
3.3% of AGI
State:
4.2% of AGI
(% of AGI for various income ranges: 0.7% for AGIs below $10k, 0.9% for AGIs $10k-25k, 1.5% for AGIs $25k-50k, 1.9% for AGIs $50k-75k, 2.1% for AGIs $75k-100k, 2.2% for AGIs over 100k)
Total tax: $6,569 (reported on 79.0% of returns)
78660:
$6,569
State:
$9,058
(% of AGI for various income ranges: 2.9% for AGIs below $10k, 4.2% for AGIs $10k-25k, 6.6% for AGIs $25k-50k, 8.6% for AGIs $50k-75k, 10.1% for AGIs $75k-100k, 15.5% for AGIs over 100k)
Earned income credit: $1,863 (reported on 13.6% of returns)
Here:
$1,863
State:
$2,024
Percentage of individuals using paid preparers for their 2004 taxes: 40.0%
Here:
40%
State:
57%
(% for various income ranges: 35.3% for AGIs below $10k, 49.0% for AGIs $10k-25k, 42.0% for AGIs $25k-50k, 37.3% for AGIs $50k-75k, 34.3% for AGIs $75k-100k, 37.0% for AGIs over 100k)
Likely homosexual households (counted as self-reported same-sex unmarried-partner households)
Lesbian couples: 0.2% of all households
Gay men: 0.1% of all households
Household received Food Stamps/SNAP in the past 12 months: 2,741 Household did not receive Food Stamps/SNAP in the past 12 months: 39,240
Women who had a birth in the past 12 months: 1,687 (1,252 now married, 439 unmarried) Women who did not have a birth in the past 12 months: 30,404 (16,029 now married, 14,291 unmarried)
Housing units in zip code 78660 with a mortgage: 22,389 (636 second mortgage, 558 both second mortgage and home equity loan) Houses without a mortgage: 360
Median monthly owner costs for units with a mortgage: $2,156 Median monthly owner costs for units without a mortgage: $872
Residents with income below the poverty level in 2022:
This zip code:
6.3%
Whole state:
14.0%
Residents with income below 50% of the poverty level in 2022:
This zip code:
3.1%
Whole state:
7.4%
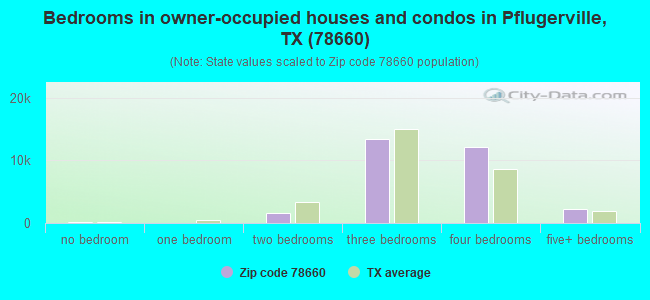
Median number of rooms in houses and condos:
Here:
6.5
State:
6.3
Median number of rooms in apartments:
Here:
4.0
State:
4.0
Notable locations in this zip code not listed on our city pages
Notable locations in zip code 78660: Pflugerville Wastewater Treatment Facility (A), Upper Gilleland Creek Wastewater Treatment Facility (B), Wilke Lane Wastewater Treatment Facility (C), Pflugerville Volunteer Fire Department (D), Travis County Emergency Services District 2 Station 1 (E), Travis County Emergency Services District 2 Station 3 (F), Travis County Emergency Services District 2 Station 4 (G), Travis County Emergency Services District 2 Station 1 (H), Austin / Travis County Emergency Medical Service - Medic 20 (I). Display/hide their locations on the map
Churches in zip code 78660 include: Richland Church (A), Grace Baptist Church (B), First Baptist Church - Pflugerville (C), Shield of Faith Assembly of God Church (D), Greater Life Apostolic Church (E), Saint Augustines Anglican Church (F), Saint Pauls Episcopal Church (G), Prison Fellowship Church (H). Display/hide their locations on the map
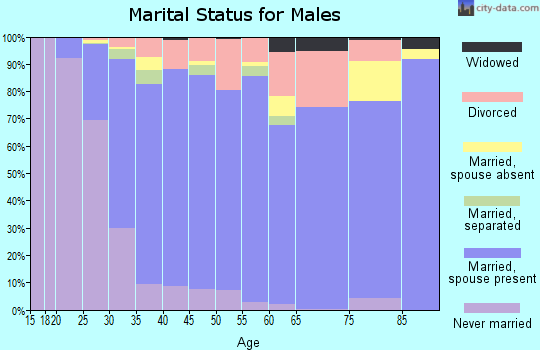
24,036 married couples with children.
5,092 single-parent households (1,782 men, 3,310 women).
69.6% of residents of 78660 zip code speak English at home.
18.9% of residents speak Spanish at home (67% very well, 19% well, 13% not well, 2% not at all).
3.3% of residents speak other Indo-European language at home (76% very well, 12% well, 3% not well, 9% not at all).
5.1% of residents speak Asian or Pacific Island language at home (54% very well, 29% well, 15% not well, 2% not at all).
2.9% of residents speak other language at home (83% very well, 11% well, 5% not well).
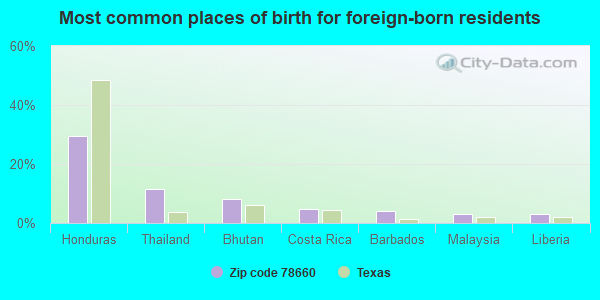
Foreign born population: 20,166 (17.3%) (55.5% of them are naturalized citizens)
This zip code:
17.3%
Whole state:
17.2%
29%Honduras
11%Thailand
8%Bhutan
5%Costa Rica
4%Barbados
3%Malaysia
3%Liberia
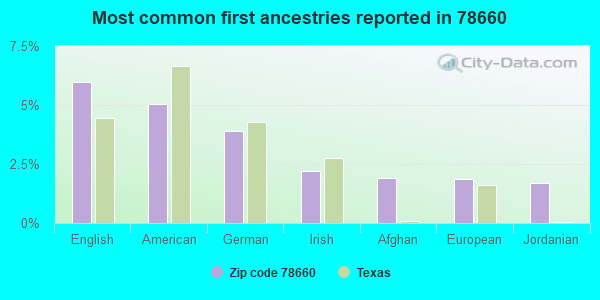
6%English
5%American
4%German
2%Irish
2%Afghan
2%European
2%Jordanian
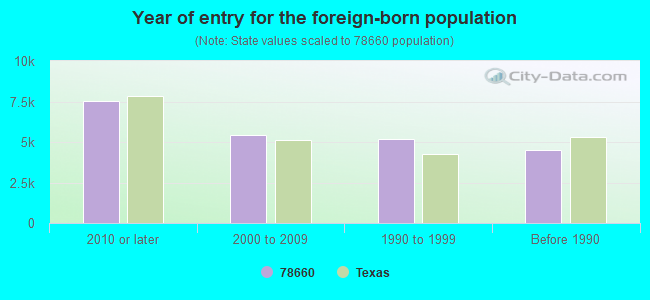
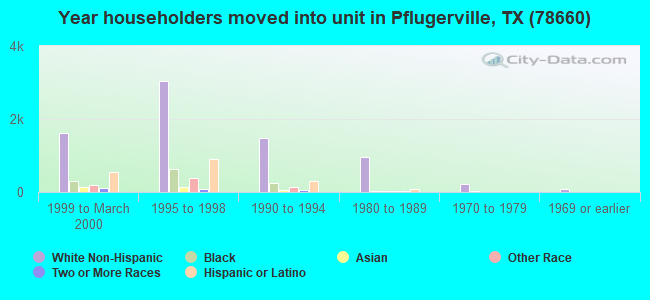
Year of entry for the foreign-born population
7,5162010 or later
5,4042000 to 2009
5,1571990 to 1999
4,506Before 1990
Facilities with environmental interests located in this zip code:
AMERICAN TELEPHONE AND TELEGRAPH CORPORA (HWY 1825 E OF I-36 in PFLUGERVILLE, TX)
(Resource Conservation and Recovery Act (tracking hazardous waste)) Alternative names: AMERICAN TEL & TEL CO LONG LINES
AUSTRON INC (15811 VISION DR in PFLUGERVILLE, TX)
(Resource Conservation and Recovery Act (tracking hazardous waste)) Business NAICS classification: COMPUTER TERMINAL MANUFACTURING.
Housing units lacking complete plumbing facilities: 0.5% Housing units lacking complete kitchen facilities: 0.7%
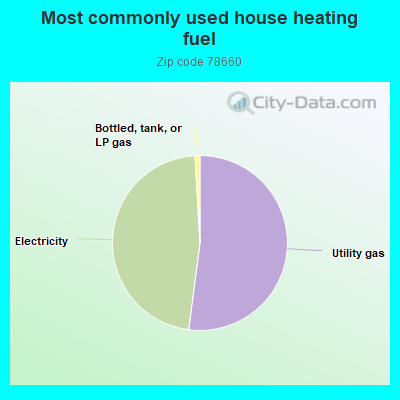
51.7%Utility gas
46.7%Electricity
0.9%Bottled, tank, or LP gas
Population in 1990: 12,297. Population change in the 1990s: +22,131 (+180.0%).
Place of birth for U.S.-born residents:
This state: 59,623
Northeast: 4,327
Midwest: 8,364
South: 9,600
West: 12,394
38% of the 78660 zip code residents lived in the same house 5 years ago. Out of people who lived in different houses, 56% lived in this county. Out of people who lived in different counties, 50% lived in Texas.
87% of the 78660 zip code residents lived in the same house 1 year ago. Out of people who lived in different houses, 55% moved from this county. Out of people who lived in different houses, 25% moved from different county within same state. Out of people who lived in different houses, 17% moved from different state. Out of people who lived in different houses, 3% moved from abroad.
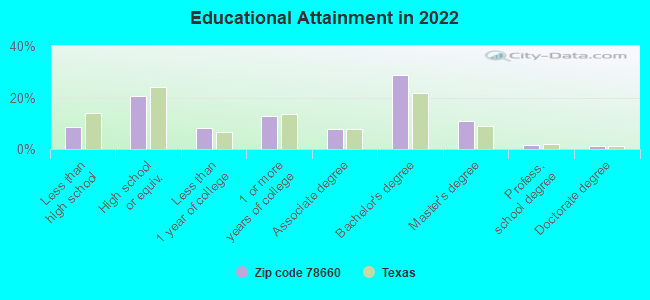
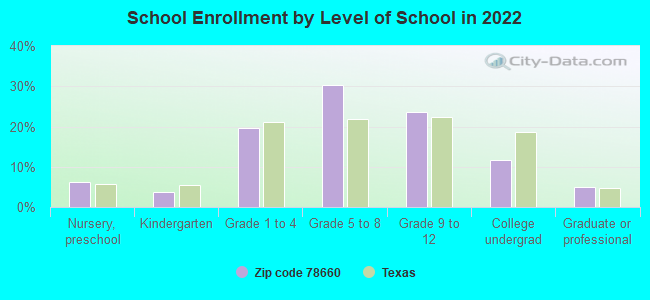
Private vs. public school enrollment:
Students in private schools in grades 1 to 8 (elementary and middle school): 1,294
Here:
8.1%
Texas:
8.8%
Students in private schools in grades 9 to 12 (high school): 875
Here:
11.6%
Texas:
8.0%
Students in private undergraduate colleges: 755
Here:
20.3%
Texas:
16.2%
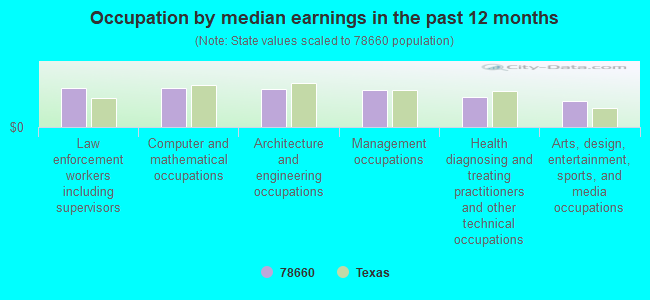
Occupation by median earnings in the past 12 months ($)
102,193Law enforcement workers including supervisors
101,198Computer and mathematical occupations
98,154Architecture and engineering occupations
95,853Management occupations
78,432Health diagnosing and treating practitioners and other technical occupations
66,669Arts, design, entertainment, sports, and media occupations
Companies with federal contracts located in this zip code (PFLUGERVILLE, TX):
LASER MANUFACTURING INC (1801 ROWE LN; small business) : $4,375,198 in 18 contractsfrom 2002 to 2005
Contracts for Aircraft Launching Equipment, Nuts and Washers, Studs, Miscellaneous Vehicular Components, and moreby Navy, Defense Logistics Agency Signed by year:2000: $0; 2001: $0; 2002: $131,704; 2003: $1,202,070; 2004: $2,179,694; 2005: $861,730; 2006: $0.
Biggest contracts:
$883,783 with Navy for Aircraft Launching Equipment. Signed on 2004-02-04. Completion date: 2004-12-10.
$800,375, same as above.Signed on 2004-03-24. Completion date: 2005-02-24.
$657,150, same as above.Signed on 2003-06-04. Completion date: 2004-05-20.
$544,920 with Navy for Nuts and Washers. Signed on 2003-10-30. Completion date: 2004-02-23.
HENSEL PHELPS CONSTRUCTION CO (16021 N IH 35) : $1,215,056 in 24 contractsfrom 1999 to 2001
Contracts for Construction of Structures and Facilities -- Other Airfield Structures by Army Signed by year:2000: $894,102; 2001: $220,954; 2002: $0; 2003: $0; 2004: $0; 2005: $0; 2006: $0.
Biggest contracts:
$313,802 with Army for Construction of Structures and Facilities -- Other Airfield Structures. Taking place in NM. Signed on 2000-03-31. Completion date: 2000-08-30.
$230,053, same as above.Signed on 2000-11-14. Completion date: 2000-08-30.
$159,822, same as above.Signed on 2000-04-25. Completion date: 2000-08-30.
$104,604, same as above.Signed on 2001-04-03. Completion date: 2000-08-30.
DATUM, INC /AUSTRON DIV (15811 VISION DRIVE; small business) : $351,400 in 2 contractsfrom 2001 to 2002
$262,000 with Federal Technology Service for ADP Software. Signed on 2001-12-15. Completion date: 2002-12-15.
$89,400 with Navy for Fiber Optic Conductors. Signed on 2002-12-12. Completion date: 2003-01-10.
CUERNILARGO ELECTRIC SUPPLY (209 CAMILLE CT.; small business)
$59,220 with Navy for Wire and Cable, Electrical. Taking place in VA. Signed on 1999-10-01. Completion date: 1999-10-05.
RSI INC (1701 DALSHANK STREET; small business) : $43,276 in 4 contractsfrom 2002 to 2005
$26,963 with Defense Logistics Agency for Connectors, Electrical. Signed on 2002-09-20. Completion date: 2003-02-07.
$8,618, same as above.Signed on 2005-10-14. Completion date: 2006-04-16.
$7,695, same as above.Signed on 2005-08-15. Completion date: 2006-02-13.
$0, same as above.Signed on 2002-09-19. Completion date: 2003-09-20.
PRINCESS CRAFT MANUFACTURING, (102 N 1ST; small business)
$31,280 with Army for Trailers. Signed on 2001-08-23. Completion date: 2001-10-31.
SALLAND (USA), INC (1202 FM 685 STE C-10; small business) : $18,485 in 3 contractsfrom 2004 to 2005
$8,985 with Army for ADP Software. Signed on 2004-01-28. Completion date: 2004-02-10.
$5,000, same as above.Signed on 2004-12-02. Completion date: 2005-01-26.
$4,500, same as above.Signed on 2005-01-26. Completion date: 2006-01-31.
ALL-TEX CABLING, L L C (1412 DEMARET STREET; small business)
$8,732 with Army for Installation of Equipment -- Fiber Optics Materials, Components, Assemblies, and Accessories. Signed on 2002-09-30. Completion date: 2002-05-09.
EXTREME K-9 (4617 PRIEM LANE; small business)
$2,500 with Air Force for Live Animals, Not Raised for Food. Signed on 2004-11-24. Completion date: 2004-12-02.
COMPLETE COMMUNICATION SERVICE (16021 I H 35; small business)
$1,993 with Army for Fittings for Rope, Cable, and Chain. Signed on 2004-10-27. Completion date: 2004-11-10.
Top industries in this zip code by the number of employees in 2005:
Construction: Other Heavy and Civil Engineering Construction (500-999 employees: 1 establishment)
2003 - 2018 National Fire Incident Reporting System (NFIRS) incidents
Based on the data from the years 2003 - 2018 the average number of fire incidents per year is 164. The highest number of fire incidents - 215 took place in 2008, and the least - 105 in 2004. The data has a dropping trend.
When looking into fire subcategories, the most reports belonged to: Outside Fires (50.9%), and Structure Fires (27.8%).
Fire incident types reported to NFIRS in Zip Code 78660


 Nearest zip codes: 78664, 78753, 78754, 78728, 78665, 78653.


 Based on the data from the years 2003 - 2018 the average number of fire incidents per year is 164. The highest number of fire incidents - 215 took place in 2008, and the least - 105 in 2004. The data has a dropping trend.
 When looking into fire subcategories, the most reports belonged to: Outside Fires (50.9%), and Structure Fires (27.8%).