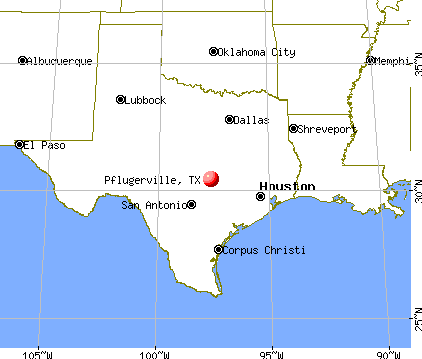
Pflugerville, Texas

Pflugerville: Lake Pflugerville at sunset
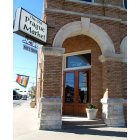
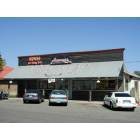
Pflugerville: The Old Prague Market
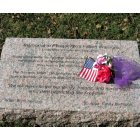
Pflugerville: War Memorial
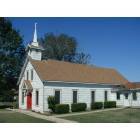
Pflugerville: St. Augustine's Orthodox Pro-Cathedral, Pflugerville TX
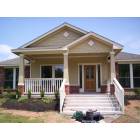
Pflugerville: House in Highland Park Neighborhood
Pflugerville: Hanovers Smokehouse, Pflugerville TX
- add
your
Submit your own pictures of this city and show them to the world
- OSM Map
- General Map
- Google Map
- MSN Map
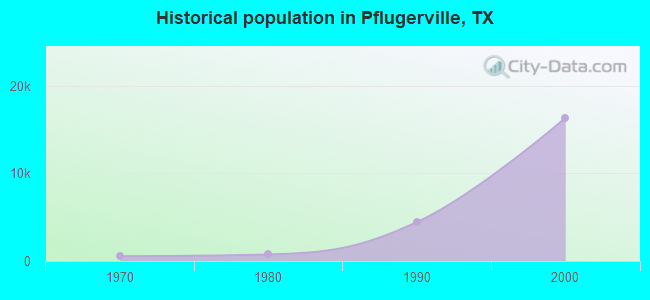
Population change since 2000: +301.3%
| Males: 32,178 | |
| Females: 33,378 |
| Median resident age: | 36.9 years |
| Texas median age: | 35.6 years |
Zip codes: 78660.
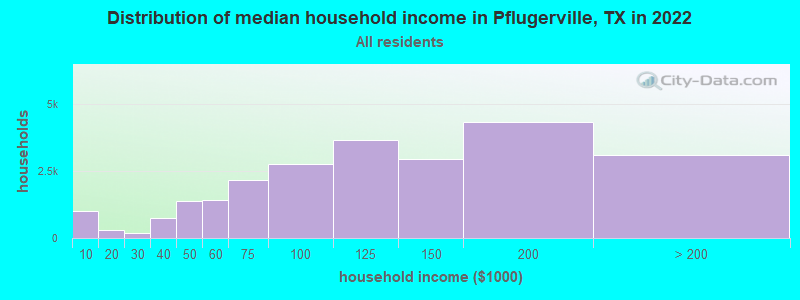
| Pflugerville: | $111,956 |
| TX: | $72,284 |
Estimated per capita income in 2022: $46,563 (it was $26,226 in 2000)
Pflugerville city income, earnings, and wages data
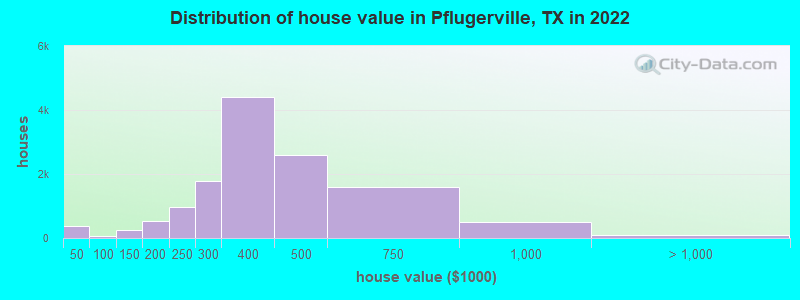
Estimated median house or condo value in 2022: $408,300 (it was $132,200 in 2000)
| Pflugerville: | $408,300 |
| TX: | $275,400 |
Mean prices in 2022: all housing units: $326,945; detached houses: $331,016; townhouses or other attached units: $156,298; mobile homes: $100,121
Median gross rent in 2022: $2,033.
(4.5% for White Non-Hispanic residents, 4.1% for Black residents, 9.3% for Hispanic or Latino residents, 14.5% for other race residents, 4.1% for two or more races residents)
Detailed information about poverty and poor residents in Pflugerville, TX


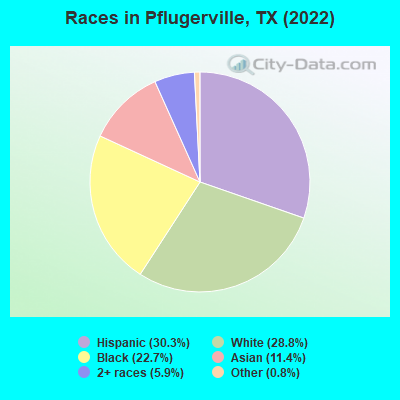
- 19,79530.3%Hispanic
- 18,79928.8%White alone
- 14,86622.7%Black alone
- 7,46511.4%Asian alone
- 3,8365.9%Two or more races
- 5490.8%Other race alone
- 540.08%Native Hawaiian and Other
Pacific Islander alone - 100.02%American Indian alone
Races in Pflugerville detailed stats: ancestries, foreign born residents, place of birth
According to our research of Texas and other state lists, there were 56 registered sex offenders living in Pflugerville, Texas as of April 27, 2024.
The ratio of all residents to sex offenders in Pflugerville is 1,039 to 1.
The ratio of registered sex offenders to all residents in this city is lower than the state average.
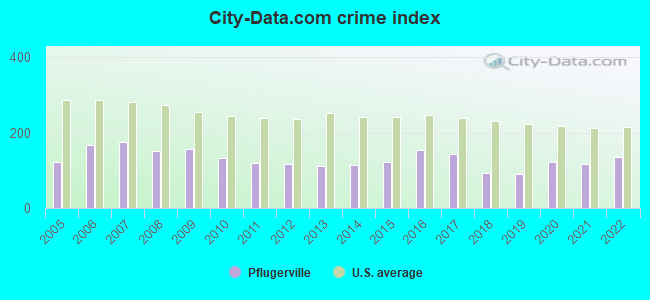
The City-Data.com crime index weighs serious crimes and violent crimes more heavily. Higher means more crime, U.S. average is 246.1. It adjusts for the number of visitors and daily workers commuting into cities.
- means the value is smaller than the state average.- means the value is about the same as the state average.
Crime rate in Pflugerville detailed stats: murders, rapes, robberies, assaults, burglaries, thefts, arson
Full-time law enforcement employees in 2021, including police officers: 127 (86 officers - 78 male; 8 female).
| Officers per 1,000 residents here: | 1.25 |
| Texas average: | 2.07 |
 Recent articles from our blog. Our writers, many of them Ph.D. graduates or candidates, create easy-to-read articles on a wide variety of topics.


Latest news from Pflugerville, TX collected exclusively by city-data.com from local newspapers, TV, and radio stations
Ancestries: American (5.7%), English (5.4%), German (3.3%), Jordanian (3.1%), European (2.8%), Irish (1.6%).
Current Local Time: CST time zone
Elevation: 704 feet
Land area: 11.3 square miles.
Population density: 5,781 people per square mile (average).
10,603 residents are foreign born (8.5% Latin America, 4.8% Asia).
| This city: | 16.0% |
| Texas: | 17.1% |
Median real estate property taxes paid for housing units with mortgages in 2022: $6,476 (1.5%)
Median real estate property taxes paid for housing units with no mortgage in 2022: $6,010 (1.7%)
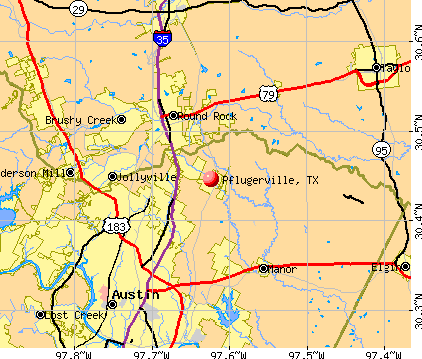
Nearest city with pop. 50,000+: Round Rock, TX  (5.6 miles , pop. 61,136).
Nearest city with pop. 200,000+: Austin, TX (12.5 miles , pop. 656,562).
Nearest city with pop. 1,000,000+: San Antonio, TX (87.0 miles , pop. 1,144,646).
Nearest cities:
), ), ), )Latitude: 30.45 N, Longitude: 97.62 W
Daytime population change due to commuting: -11,676 (-17.9%)
Workers who live and work in this city: 12,752 (36.1%)
Area code commonly used in this area: 512
Property values in Pflugerville, TX
Pflugerville, Texas accommodation & food services, waste management - Economy and Business Data
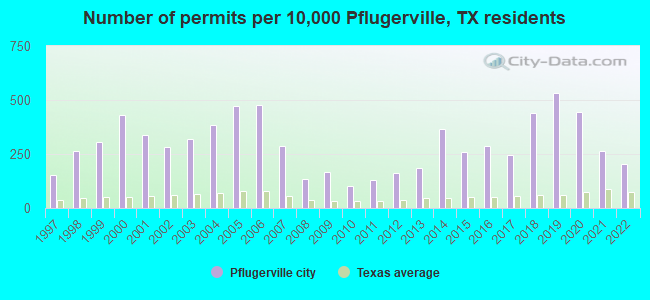
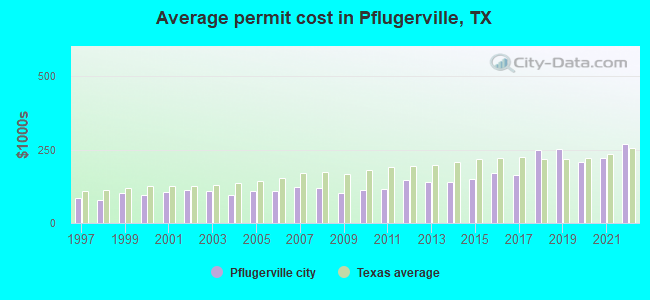
Single-family new house construction building permits:
- 2022: 330 buildings, average cost: $268,400
- 2021: 433 buildings, average cost: $223,000
- 2020: 725 buildings, average cost: $208,300
- 2019: 867 buildings, average cost: $252,100
- 2018: 716 buildings, average cost: $250,000
- 2017: 403 buildings, average cost: $163,000
- 2016: 466 buildings, average cost: $172,100
- 2015: 427 buildings, average cost: $150,500
- 2014: 597 buildings, average cost: $139,700
- 2013: 306 buildings, average cost: $140,700
- 2012: 264 buildings, average cost: $145,500
- 2011: 209 buildings, average cost: $116,000
- 2010: 164 buildings, average cost: $112,600
- 2009: 269 buildings, average cost: $102,600
- 2008: 222 buildings, average cost: $117,800
- 2007: 469 buildings, average cost: $121,300
- 2006: 781 buildings, average cost: $109,100
- 2005: 767 buildings, average cost: $107,600
- 2004: 630 buildings, average cost: $97,400
- 2003: 520 buildings, average cost: $108,100
- 2002: 461 buildings, average cost: $114,200
- 2001: 549 buildings, average cost: $104,500
- 2000: 704 buildings, average cost: $95,500
- 1999: 496 buildings, average cost: $102,600
- 1998: 435 buildings, average cost: $78,300
- 1997: 254 buildings, average cost: $85,300
| Here: | 3.1% |
| Texas: | 3.5% |
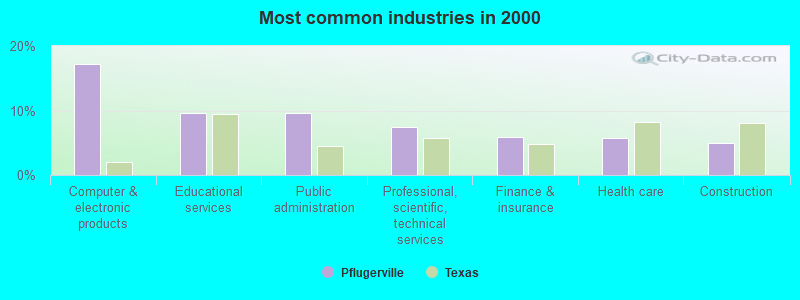
- Computer & electronic products (17.2%)
- Educational services (9.6%)
- Public administration (9.6%)
- Professional, scientific, technical services (7.5%)
- Finance & insurance (6.0%)
- Health care (5.8%)
- Construction (5.0%)
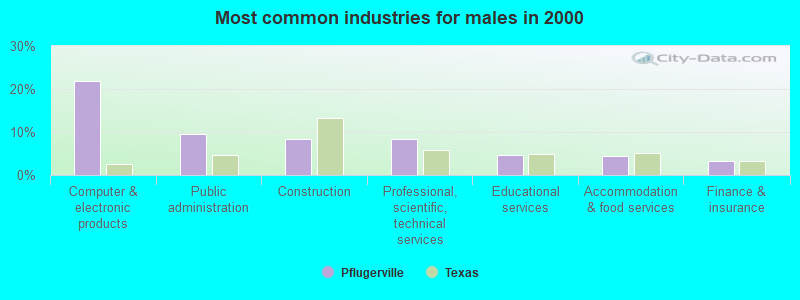
- Computer & electronic products (21.8%)
- Public administration (9.6%)
- Construction (8.5%)
- Professional, scientific, technical services (8.4%)
- Educational services (4.7%)
- Accommodation & food services (4.5%)
- Finance & insurance (3.2%)
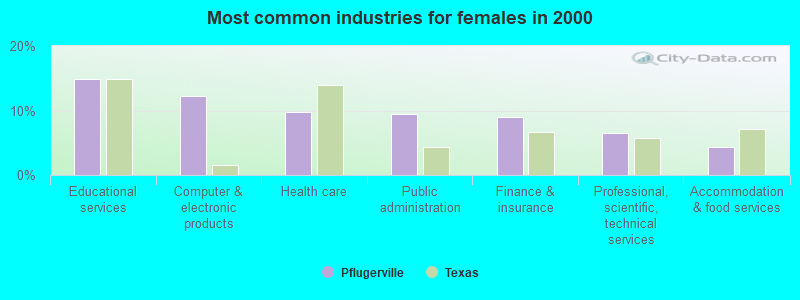
- Educational services (14.9%)
- Computer & electronic products (12.3%)
- Health care (9.7%)
- Public administration (9.5%)
- Finance & insurance (8.9%)
- Professional, scientific, technical services (6.5%)
- Accommodation & food services (4.4%)

- Computer specialists (5.5%)
- Other office and administrative support workers, including supervisors (5.3%)
- Other management occupations, except farmers and farm managers (5.3%)
- Engineers (4.5%)
- Other sales and related occupations, including supervisors (4.4%)
- Preschool, kindergarten, elementary, and middle school teachers (3.9%)
- Secretaries and administrative assistants (3.4%)
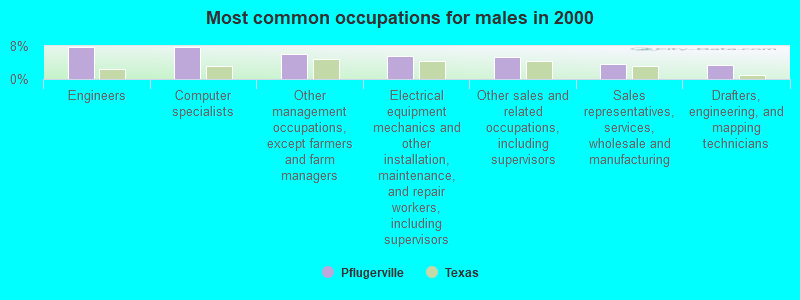
- Engineers (7.8%)
- Computer specialists (7.7%)
- Other management occupations, except farmers and farm managers (6.2%)
- Electrical equipment mechanics and other installation, maintenance, and repair workers, including supervisors (5.6%)
- Other sales and related occupations, including supervisors (5.2%)
- Sales representatives, services, wholesale and manufacturing (3.6%)
- Drafters, engineering, and mapping technicians (3.5%)

- Other office and administrative support workers, including supervisors (8.7%)
- Secretaries and administrative assistants (7.0%)
- Preschool, kindergarten, elementary, and middle school teachers (6.8%)
- Other management occupations, except farmers and farm managers (4.3%)
- Customer service representatives (3.9%)
- Registered nurses (3.8%)
- Other sales and related occupations, including supervisors (3.4%)
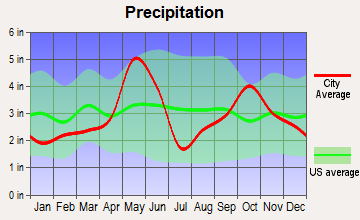
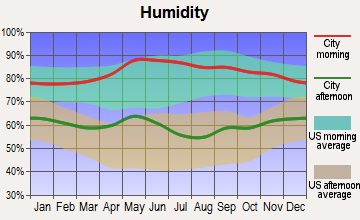
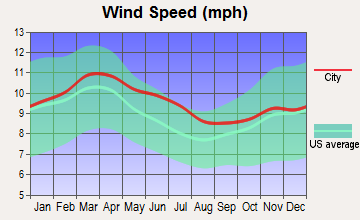
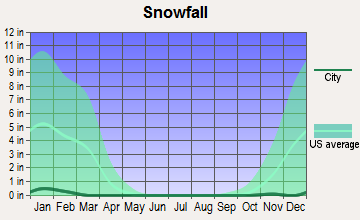
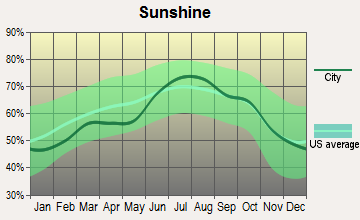
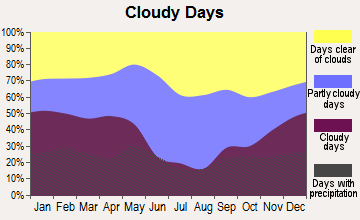
Average climate in Pflugerville, Texas
Based on data reported by over 4,000 weather stations

|
|

(lower is better)
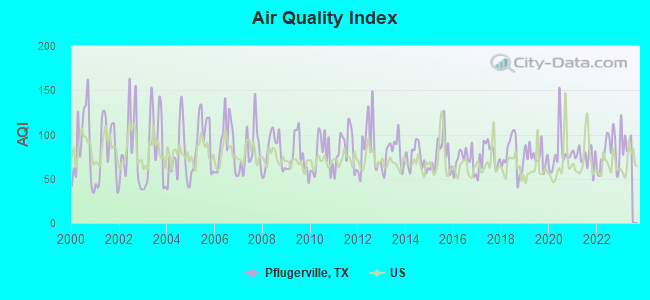
Air Quality Index (AQI) level in 2022 was 78.6. This is about average.
| City: | 78.6 |
| U.S.: | 72.6 |
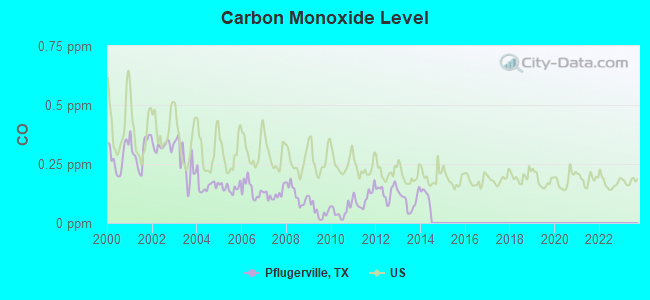
Carbon Monoxide (CO) [ppm] level in 2013 was 0.0938. This is significantly better than average. Closest monitor was 8.4 miles away from the city center.
| City: | 0.0938 |
| U.S.: | 0.2513 |
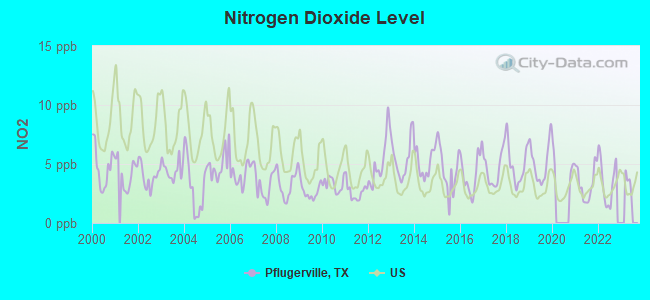
Nitrogen Dioxide (NO2) [ppb] level in 2022 was 3.48. This is significantly better than average. Closest monitor was 2.3 miles away from the city center.
| City: | 3.48 |
| U.S.: | 5.11 |
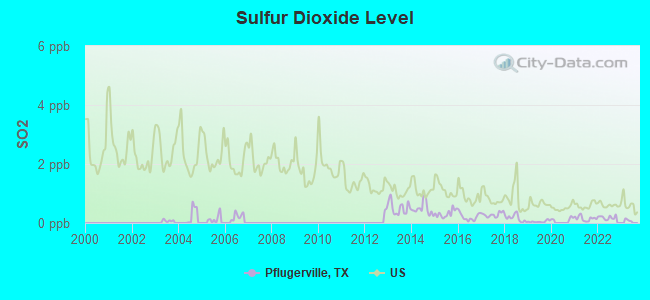
Sulfur Dioxide (SO2) [ppb] level in 2022 was 0.186. This is significantly better than average. Closest monitor was 2.3 miles away from the city center.
| City: | 0.186 |
| U.S.: | 1.515 |
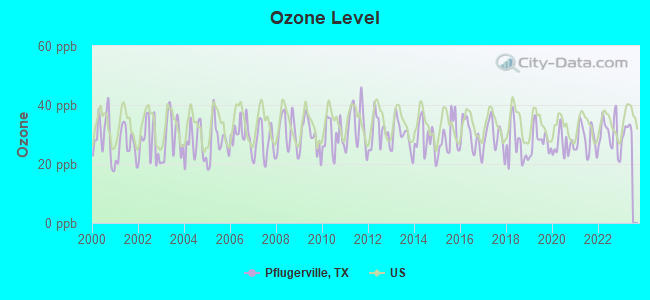
Ozone [ppb] level in 2022 was 30.1. This is about average. Closest monitor was 2.3 miles away from the city center.
| City: | 30.1 |
| U.S.: | 33.3 |
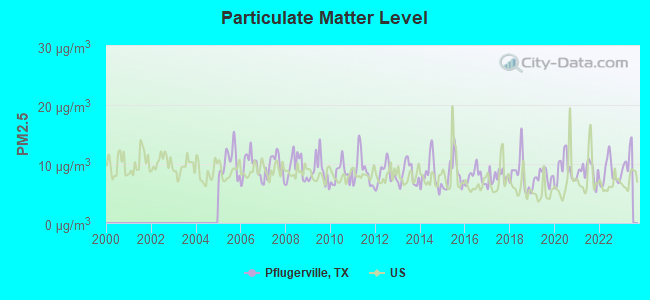
Particulate Matter (PM2.5) [µg/m3] level in 2022 was 8.34. This is about average. Closest monitor was 10.4 miles away from the city center.
| City: | 8.34 |
| U.S.: | 8.11 |
Tornado activity:
Pflugerville-area historical tornado activity is near Texas state average. It is 43% greater than the overall U.S. average.
On 5/27/1997, a category F5 (max. wind speeds 261-318 mph) tornado 22.6 miles away from the Pflugerville city center killed 27 people and injured 12 people and caused $40 million in damages.
On 5/27/1997, a category F4 (max. wind speeds 207-260 mph) tornado 22.7 miles away from the city center killed one person and injured 5 people and caused $15 million in damages.
Earthquake activity:
Pflugerville-area historical earthquake activity is significantly above Texas state average. It is 18% smaller than the overall U.S. average.On 10/20/2011 at 12:24:41, a magnitude 4.8 (4.8 MW, Depth: 3.1 mi, Class: Light, Intensity: IV - V) earthquake occurred 112.7 miles away from the city center
On 6/16/1978 at 11:46:54, a magnitude 5.3 (4.4 MB, 4.6 UK, 5.3 ML, Class: Moderate, Intensity: VI - VII) earthquake occurred 257.1 miles away from Pflugerville center
On 4/14/1995 at 00:32:56, a magnitude 5.7 (5.6 MB, 5.7 MS, 5.7 MW, Depth: 11.1 mi) earthquake occurred 342.9 miles away from Pflugerville center
On 4/9/1993 at 12:29:19, a magnitude 4.3 (4.1 MB, 4.3 LG, Depth: 3.1 mi) earthquake occurred 117.0 miles away from the city center
On 5/17/2012 at 08:12:00, a magnitude 4.8 (4.8 MW, Depth: 3.1 mi) earthquake occurred 218.1 miles away from Pflugerville center
On 5/1/2018 at 16:28:56, a magnitude 4.0 (4.0 MW, Depth: 3.1 mi) earthquake occurred 106.1 miles away from the city center
Magnitude types: regional Lg-wave magnitude (LG), body-wave magnitude (MB), local magnitude (ML), surface-wave magnitude (MS), moment magnitude (MW)
Natural disasters:
The number of natural disasters in Travis County (29) is a lot greater than the US average (15).Major Disasters (Presidential) Declared: 11
Emergencies Declared: 9
Causes of natural disasters: Fires: 11, Storms: 10, Floods: 9, Hurricanes: 7, Tornadoes: 4, Winds: 2, Other: 1 (Note: some incidents may be assigned to more than one category).

Hospitals and medical centers in Pflugerville:
- PFLUGERVILLE COMMUNITY HOME (514 OAT MEADOW DRIVE)
- ADVENTIST HOME HEALTH (2401 PECAN STREET SUITE 202)
- FIRST CARE HOME HEALTH SERVICES (1317 PICADILLY DRIVE SUITE B-201)
- P N HOME HEALTH SERVICES (1107 STATLER BEND DRIVE)
- PFLUGERVILLE CARE CENTER (521 S HEATHERWILDE BLVD)
- PFLUGERVILLE NURSING AND REHABILITATION CENTER (104 REX KERWIN COURT)
Amtrak stations near Pflugerville:
- 15 miles: AUSTIN (250 N. LAMAR BLVD.) . Services: ticket office, fully wheelchair accessible, enclosed waiting area, public restrooms, public payphones, vending machines, free short-term parking, free long-term parking, call for taxi service, public transit connection.
- 16 miles: TAYLOR (118 E. 1ST ST.) . Services: free short-term parking, free long-term parking.
Colleges/universities with over 2000 students nearest to Pflugerville:
- Austin Community College District (about 9 miles; Austin, TX; Full-time enrollment: 25,957)
- Concordia University-Texas (about 13 miles; Austin, TX; FT enrollment: 2,192)
- The University of Texas at Austin (about 14 miles; Austin, TX; FT enrollment: 45,500)
- Saint Edward's University (about 17 miles; Austin, TX; FT enrollment: 4,308)
- Texas State University (about 43 miles; San Marcos, TX; FT enrollment: 29,202)
- University of Mary Hardin-Baylor (about 44 miles; Belton, TX; FT enrollment: 2,885)
- Temple College (about 47 miles; Temple, TX; FT enrollment: 3,796)
Public high schools in Pflugerville:
- PFLUGERVILLE H S (Students: 2,309, Location: 1301 W PECAN ST, Grades: 9-12)
- HENDRICKSON H S (Students: 1,950, Location: 2905 FM 685, Grades: 9-12)
- HARMONY SCIENCE ACADEMY NORTH AUSTIN (Students: 382, Location: 1421 WELLS BRANCH PKWY W, Grades: 8-12, Charter school)
- TRAVIS CO J J A E P (Location: 1401 W PECAN ST, Grades: 11)
Biggest public elementary/middle schools in Pflugerville:
- PFLUGERVILLE MIDDLE (Students: 1,074, Location: 1600 W SETTLERS VLY DR, Grades: 6-8)
- KELLY LANE MIDDLE (Students: 1,021, Location: 18900 FALCON POINTE, Grades: 6-8)
- PARK CREST MIDDLE (Students: 862, Location: 1500 N RAILROAD AVE, Grades: 6-8)
- MURCHISON EL (Students: 861, Location: 2215 KELLY LN, Grades: PK-5)
- HIGHLAND PARK EL (Students: 847, Location: 528 KINGSTON LACY, Grades: PK-5)
- SPRINGHILL EL (Students: 762, Location: 600 S HEATHERWILDE BLVD, Grades: PK-5)
- ROWE LANE EL (Students: 701, Location: 3112 SPEIDEL DR, Grades: PK-5)
- WIELAND EL (Students: 687, Location: 900 TUDOR HOUSE RD, Grades: PK-5)
- WINDERMERE PRI (Students: 646, Location: 429 GRAND AVE, Grades: PK-2)
- BROOKHOLLOW EL (Students: 571, Location: 1200 RAILROAD AVE, Grades: PK-5)
User-submitted facts and corrections:
- there are now two(2) high schools : conally high, and hendrickson high, and there is also new middle schools,: dessau middle.
Points of interest:
Notable locations in Pflugerville: Pflugerville Wastewater Treatment Facility (A), Wilke Lane Wastewater Treatment Facility (B), Pflugerville Volunteer Fire Department (C), Travis County Emergency Services District 2 Station 1 (D), Travis County Emergency Services District 2 Station 3 (E), Travis County Emergency Services District 2 Station 1 (F). Display/hide their locations on the map
Churches in Pflugerville include: First Baptist Church - Pflugerville (A), Saint Augustines Anglican Church (B), Saint Pauls Episcopal Church (C), Prison Fellowship Church (D). Display/hide their locations on the map
Parks in Pflugerville include: Pfluger Park (1), Kuempel Stadium (2). Display/hide their locations on the map
Tourist attraction: Austin's Park and Pizza (Amusement & Theme Parks; 16231 I H 35) (1). Display/hide its approximate location on the map
Court: Pflugerville City - Police Department- Municipal Court (100 East Main Street) (1). Display/hide its approximate location on the map
Birthplace of: Oscar Draguicevich - Soccer player, Brent Murphy - College basketball player (UTEP Miners).
Drinking water stations with addresses in Pflugerville and their reported violations in the past:
AUSTINS COLONY (Population served: 5,496, Groundwater):Past monitoring violations:CAROLYNN ESTATES (Population served: 3,579, Surface water):
- 37 regular monitoring violations
Past health violations:CHEROKEE SHORES WATER SUPPLY (Population served: 2,199, Surface water):Past monitoring violations:
- MCL, Average - Between JUL-2013 and SEP-2013, Contaminant: TTHM. Follow-up actions: St Public Notif requested (DEC-03-2013), St Violation/Reminder Notice (DEC-03-2013), St Formal NOV issued (JAN-10-2014), St Public Notif received (FEB-20-2014), St AO (w/penalty) issued (JUN-05-2014)
- MCL, Average - Between APR-2013 and JUN-2013, Contaminant: TTHM. Follow-up actions: St Public Notif requested (NOV-15-2013), St Violation/Reminder Notice (NOV-15-2013), St Formal NOV issued (JAN-10-2014), St Public Notif received (JAN-16-2014), St AO (w/penalty) issued (JUN-05-2014)
- MCL, Average - Between JAN-2009 and MAR-2009, Contaminant: TTHM. Follow-up actions: St Public Notif requested (MAR-30-2009), St Violation/Reminder Notice (MAR-30-2009), St Public Notif received (MAY-06-2009), St Compliance achieved (JUL-08-2010)
- MCL, Average - Between OCT-2008 and DEC-2008, Contaminant: TTHM. Follow-up actions: St Violation/Reminder Notice (JAN-23-2009), St Public Notif requested (JAN-23-2009), St Public Notif received (FEB-03-2009), St Compliance achieved (JUL-08-2010)
- MCL, Average - Between JUL-2008 and SEP-2008, Contaminant: TTHM. Follow-up actions: St Public Notif requested (OCT-24-2008), St Formal NOV issued (OCT-24-2008), St Public Notif requested (JAN-17-2009), St Public Notif received (FEB-03-2009), St Compliance achieved (JUL-08-2010)
- Lead Consumer Notice - In DEC-30-2013, Contaminant: Lead and Copper Rule. Follow-up actions: St Compliance achieved (FEB-13-2014)
- Follow-up Or Routine LCR Tap M/R - In OCT-01-2013, Contaminant: Lead and Copper Rule. Follow-up actions: St Formal NOV issued (JAN-10-2014), St AO (w/penalty) issued (JUN-05-2014), St Compliance achieved (JUL-09-2014)
- Monthly Turbidity Exceed (Enhanced SWTR) - In SEP-2005, Contaminant: IESWTR. Follow-up actions: St Public Notif requested (NOV-14-2005), St Violation/Reminder Notice (NOV-14-2005), St Compliance achieved (AUG-09-2010)
Past health violations:CALLENDER LAKE (Population served: 1,929, Groundwater):
- MCL, Average - Between JUL-2008 and SEP-2008, Contaminant: TTHM. Follow-up actions: St Public Notif requested (NOV-03-2008), St Violation/Reminder Notice (NOV-03-2008), St Public Notif received (DEC-03-2008), St Compliance achieved (MAR-30-2009)
- MCL, Average - Between APR-2008 and JUN-2008, Contaminant: TTHM. Follow-up actions: St Public Notif requested (AUG-28-2008), St Violation/Reminder Notice (AUG-28-2008), St Compliance achieved (JUL-09-2010)
- MCL, Average - Between JAN-2008 and MAR-2008, Contaminant: Total Haloacetic Acids (HAA5). Follow-up actions: St Public Notif requested (JUL-30-2008), St Violation/Reminder Notice (JUL-30-2008), St Compliance achieved (JUL-09-2010)
- MCL, Average - Between JAN-2008 and MAR-2008, Contaminant: TTHM. Follow-up actions: St Public Notif requested (JUL-30-2008), St Violation/Reminder Notice (JUL-30-2008), St Compliance achieved (JUL-09-2010)
- MCL, Average - Between OCT-2007 and DEC-2007, Contaminant: Total Haloacetic Acids (HAA5). Follow-up actions: St Violation/Reminder Notice (2 times from FEB-08-2008 to FEB-08-2008), St Public Notif requested (2 times from FEB-08-2008 to FEB-08-2008), St Public Notif received (MAR-07-2008), St Compliance achieved (JUL-09-2010)
- MCL, Average - Between OCT-2007 and DEC-2007, Contaminant: TTHM. Follow-up actions: St Violation/Reminder Notice (2 times from FEB-08-2008 to FEB-08-2008), St Public Notif requested (2 times from FEB-08-2008 to FEB-08-2008), St Public Notif received (MAR-07-2008), St Compliance achieved (JUL-09-2010)
- 8 other older health violations
Past monitoring violations:BEACHWOOD ESTATES & NORTH TRINIDAD (Population served: 1,368, Surface water):
- Follow-up Or Routine LCR Tap M/R - In OCT-01-2010, Contaminant: Lead and Copper Rule. Follow-up actions: St Compliance achieved (NOV-01-2013)
Past health violations:AURORA VISTA (Population served: 381, Groundwater):Past monitoring violations:
- MCL, Average - Between APR-2008 and JUN-2008, Contaminant: Total Haloacetic Acids (HAA5). Follow-up actions: St Public Notif requested (AUG-28-2008), St Violation/Reminder Notice (AUG-28-2008), St Compliance achieved (JUL-06-2010)
- MCL, Average - Between APR-2008 and JUN-2008, Contaminant: TTHM. Follow-up actions: St Public Notif requested (AUG-28-2008), St Violation/Reminder Notice (AUG-28-2008), St Compliance achieved (JUL-06-2010)
- MCL, Average - Between JAN-2008 and MAR-2008, Contaminant: Total Haloacetic Acids (HAA5). Follow-up actions: St Public Notif requested (JUL-30-2008), St Violation/Reminder Notice (JUL-30-2008), St Compliance achieved (JUL-06-2010)
- MCL, Average - Between JAN-2008 and MAR-2008, Contaminant: TTHM. Follow-up actions: St Public Notif requested (JUL-30-2008), St Violation/Reminder Notice (JUL-30-2008), St Compliance achieved (JUL-06-2010)
- MCL, Average - Between OCT-2007 and DEC-2007, Contaminant: TTHM. Follow-up actions: St Violation/Reminder Notice (2 times from FEB-08-2008 to FEB-08-2008), St Public Notif requested (2 times from FEB-08-2008 to FEB-08-2008), St Public Notif received (MAR-20-2008), St Compliance achieved (JUL-06-2010)
- MCL, Average - Between OCT-2007 and DEC-2007, Contaminant: Total Haloacetic Acids (HAA5). Follow-up actions: St Violation/Reminder Notice (2 times from FEB-08-2008 to FEB-08-2008), St Public Notif requested (2 times from FEB-08-2008 to FEB-08-2008), St Compliance achieved (JUL-06-2010)
- 4 other older health violations
- Follow-up Or Routine LCR Tap M/R - In OCT-01-2011, Contaminant: Lead and Copper Rule
- Single Turbidity Exceed (Enhanced SWTR) - In JUN-2006, Contaminant: IESWTR. Follow-up actions: St Public Notif received (JUL-17-2006), St Public Notif requested (AUG-11-2006), St Violation/Reminder Notice (AUG-11-2006), St Compliance achieved (AUG-06-2010)
- Monthly Turbidity Exceed (Enhanced SWTR) - In SEP-2005, Contaminant: IESWTR. Follow-up actions: St Public Notif requested (NOV-14-2005), St Violation/Reminder Notice (NOV-14-2005), St Compliance achieved (AUG-06-2010)
Past health violations:CAMELOT FOREST WATER SYSTEM (Population served: 241, Groundwater):
- MCL, Average - Between OCT-2006 and DEC-2006, Contaminant: TTHM. Follow-up actions: St Public Notif requested (JAN-30-2007), St Violation/Reminder Notice (JAN-30-2007), St Public Notif received (FEB-20-2007), St Compliance achieved (AUG-14-2007)
- MCL, Average - Between JUL-2006 and SEP-2006, Contaminant: TTHM. Follow-up actions: St Public Notif requested (DEC-29-2006), St Formal NOV issued (DEC-29-2006), St Public Notif received (JAN-25-2007), St Compliance achieved (AUG-14-2007)
Past health violations:BAVARIAN HILLS (Population served: 189, Groundwater):
- MCL, Average - Between APR-2007 and JUN-2007, Contaminant: TTHM. Follow-up actions: St Public Notif requested (AUG-10-2007), St Violation/Reminder Notice (AUG-10-2007), St Public Notif received (SEP-14-2007), St Compliance achieved (2 times from JAN-16-2008 to JAN-16-2008)
- MCL, Average - Between JAN-2007 and MAR-2007, Contaminant: TTHM. Follow-up actions: St Public Notif requested (MAY-18-2007), St Violation/Reminder Notice (MAY-18-2007), St Public Notif received (JUN-27-2007), St Compliance achieved (2 times from JAN-16-2008 to JAN-16-2008)
- MCL, Average - Between OCT-2006 and DEC-2006, Contaminant: TTHM. Follow-up actions: St Violation/Reminder Notice (JAN-30-2007), St Public Notif requested (JAN-30-2007), St Public Notif received (FEB-20-2007), St Compliance achieved (2 times from JAN-16-2008 to JAN-16-2008)
- MCL, Average - Between JUL-2006 and SEP-2006, Contaminant: TTHM. Follow-up actions: St Violation/Reminder Notice (JAN-02-2007), St Public Notif requested (JAN-02-2007), St Public Notif received (FEB-02-2007), St Compliance achieved (2 times from JAN-16-2008 to JAN-16-2008)
- MCL, Average - Between APR-2006 and JUN-2006, Contaminant: TTHM. Follow-up actions: St Public Notif requested (JUL-12-2006), St Formal NOV issued (JUL-12-2006), St Public Notif received (AUG-04-2006), St Compliance achieved (2 times from JAN-16-2008 to JAN-16-2008)
Past monitoring violations:
- One routine major monitoring violation
Drinking water stations with addresses in Pflugerville that have no violations reported:
- BLUE MOUND (Population served: 2,283, Primary Water Source Type: Groundwater)
- CASCADE MOBILE HOME PARK (Population served: 300, Primary Water Source Type: Groundwater)
- ACTON WATER ROYAL OAKS (Population served: 216, Primary Water Source Type: Purch surface water)
- BRIARWOOD HARBOR (Population served: 99, Primary Water Source Type: Groundwater)
- BLUE WATER COVE (Population served: 89, Primary Water Source Type: Groundwater)
- BENBROOK HILLS (Population served: 33, Primary Water Source Type: Groundwater)
| This city: | 3.0 people |
| Texas: | 2.8 people |
| This city: | 77.6% |
| Whole state: | 69.9% |
| This city: | 6.0% |
| Whole state: | 6.0% |
Likely homosexual households (counted as self-reported same-sex unmarried-partner households)
- Lesbian couples: 0.8% of all households
- Gay men: 0.5% of all households
51 people in group homes intended for adults in 2010
102 people in nursing homes in 2000
16 people in other noninstitutional group quarters in 2000
Banks with branches in Pflugerville (2011 data):
- JPMorgan Chase Bank, National Association: Pfennig & 685 Banking Center Branch at 1714 Easat Pfennig Lane, branch established on 2007/05/08; Heb Pflugerville Fsc Branch at 201 North Fm 685, branch established on 2000/11/08. Info updated 2011/11/10: Bank assets: $1,811,678.0 mil, Deposits: $1,190,738.0 mil, headquarters in Columbus, OH, positive income, International Specialization, 5577 total offices, Holding Company: Jpmorgan Chase & Co.
- First Texas Bank: Pflugerville Branch at 1600 West Pecan Blvd., branch established on 1998/05/11. Info updated 2008/08/04: Bank assets: $180.6 mil, Deposits: $162.9 mil, headquarters in Round Rock, TX, positive income, Commercial Lending Specialization, 4 total offices, Holding Company: First Texas Bancorp, Inc.
- First State Bank Central Texas: Pflugerville Branch at 1620 Grand Avenue Parkway, Suite 100, branch established on 2009/04/21. Info updated 2010/06/14: Bank assets: $1,112.8 mil, Deposits: $884.8 mil, headquarters in Austin, TX, positive income, Commercial Lending Specialization, 31 total offices, Holding Company: Central Community Corporation
- Bank of America, National Association: Pfluger Crossing Branch at 1544 Fm 685, branch established on 2007/11/28. Info updated 2009/11/18: Bank assets: $1,451,969.3 mil, Deposits: $1,077,176.8 mil, headquarters in Charlotte, NC, positive income, 5782 total offices, Holding Company: Bank Of America Corporation
- Citizens National Bank: Pflugerville Branch at 601 Fm 685, branch established on 2007/03/19. Info updated 2006/11/03: Bank assets: $322.3 mil, Deposits: $286.6 mil, headquarters in Cameron, TX, positive income, 8 total offices, Holding Company: Central Texas Financial Corp.
- Comerica Bank: Pflugerville Branch at 100 West Main, branch established on 1992/12/31. Info updated 2011/07/29: Bank assets: $60,970.5 mil, Deposits: $48,300.9 mil, headquarters in Dallas, TX, positive income, Commercial Lending Specialization, 497 total offices, Holding Company: Comerica Incorporated
- Woodforest National Bank: Pflugerville Tx Branch at 1548 Fm 685, branch established on 2007/02/05. Info updated 2011/05/10: Bank assets: $3,488.9 mil, Deposits: $3,097.6 mil, headquarters in Houston, TX, positive income, Commercial Lending Specialization, 766 total offices, Holding Company: Woodforest Financial Group Employee Stock Ownership Plan (With 401(K) Provisions)
For population 15 years and over in Pflugerville:
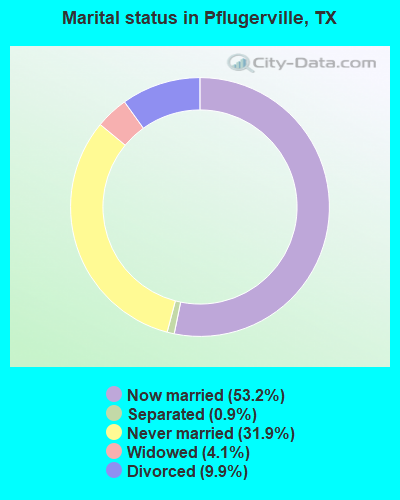
- Never married: 31.9%
- Now married: 53.2%
- Separated: 0.9%
- Widowed: 4.1%
- Divorced: 9.9%
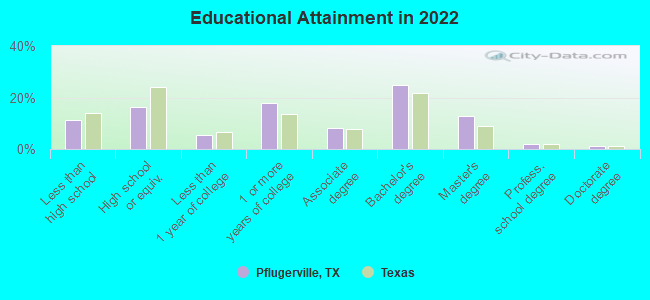
For population 25 years and over in Pflugerville:
- High school or higher: 88.9%
- Bachelor's degree or higher: 40.7%
- Graduate or professional degree: 15.9%
- Unemployed: 2.4%
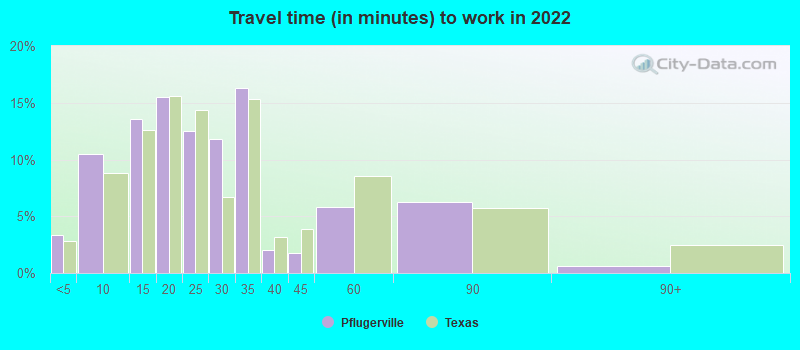
- Mean travel time to work (commute): 16.7 minutes
| Here: | 12.5 |
| Texas average: | 14.0 |
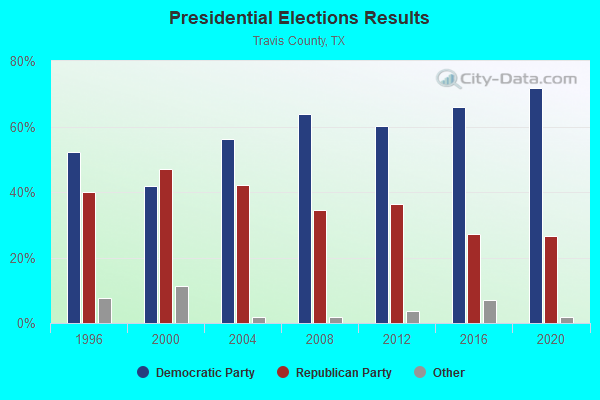
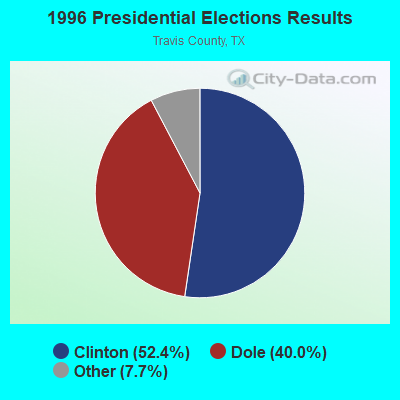
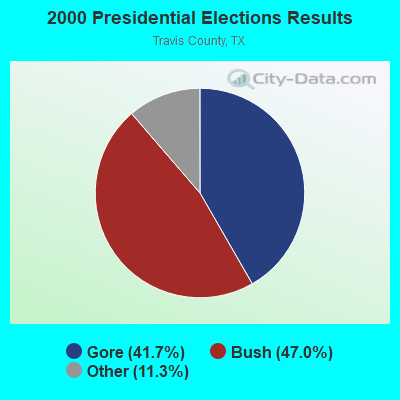


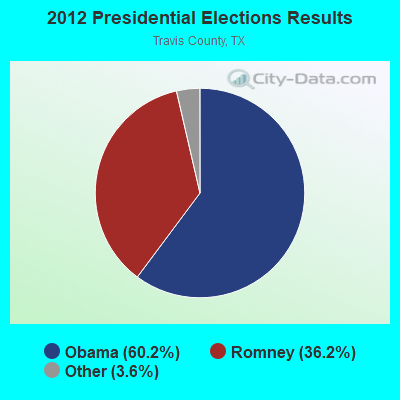


Graphs represent county-level data. Detailed 2008 Election Results
Neighborhoods in Pflugerville:
(Pflugerville, Texas Neighborhood Map)- 685 Business Centre neighborhood
- Alma Pfluger neighborhood
- Arrington neighborhood
- Bohl's Place neighborhood
- Bohls Place neighborhood
- Bratcher neighborhood
- Brookhollow neighborhood
- Cambridge Estates neighborhood
- Club At Wells Point neighborhood
- Cnb Commercial neighborhood
- Colored neighborhood
- Creekside neighborhood
- Dobias Acres neighborhood
- E. W. Pfluger neighborhood
- Emerald Heights neighborhood
- F.H. Plfuger neighborhood
- Fairways Of Blackhawk neighborhood
- Falcon Pointe neighborhood
- Foot Hills neighborhood
- Foothills neighborhood
- Gatlinburg neighborhood
- Gilleland Center neighborhood
- Gilleland Plaza neighborhood
- Green Meadows neighborhood
- Hankins neighborhood
- Heatherwilde neighborhood
- Heatherwilde Commercial neighborhood
- Heatherwilde Villas neighborhood
- Heb / Pflugerville neighborhood
- Highland Park neighborhood
- Highland Park North neighborhood
- Hillside Springs neighborhood
- Hodde neighborhood
- Jim Moore neighborhood
- Julie's Walk At Katymead neighborhood
- Katymead neighborhood
- Kaytmead neighborhood
- Kelly Lane neighborhood
- Kruger's Korner neighborhood
- Kuempel neighborhood
- Kuempel Storage Tract neighborhood
- Kuempel Tract neighborhood
- Lakeside At Blackhawk neighborhood
- Leon Plfuger neighborhood
- Lisso neighborhood
- Lively neighborhood
- Meadow Park Plaza neighborhood
- Meadow Park South neighborhood
- Meadows Of Blackhawk neighborhood
- Mountain Creek neighborhood
- Mountain Creek East neighborhood
- Mouser neighborhood
- Noonan's Hillside Spring neighborhood
- North Hillside Springs neighborhood
- North Park neighborhood
- North Pflugerville Estates neighborhood
- P P neighborhood
- Parco Estates neighborhood
- Park View Estates neighborhood
- Parkcrest neighborhood
- Pfairway Office Park neighborhood
- Pflugerville Acres neighborhood
- Pflugerville Estates neighborhood
- Pflugerville Heights neighborhood
- Pflugerville Northwest neighborhood
- Pflugerville Project neighborhood
- Pflugerville West neighborhood
- Picadilly Ridge neighborhood
- Providence neighborhood
- R J neighborhood
- Ridge At Steeds Crossing neighborhood
- Rolling Hills neighborhood
- Rolling Meadows neighborhood
- Rowe Valley neighborhood
- Royal Pointe neighborhood
- Royal Pointe Commercial neighborhood
- Sahd neighborhood
- Sahd-Heatherwilde Plaza neighborhood
- Samuelson Gardens neighborhood
- Saxony neighborhood
- Settler's Meadow neighborhood
- Settlers Ridge neighborhood
- Settlers Ridge Commercial neighborhood
- Shallow Creek neighborhood
- Skyview Manor neighborhood
- Spring Trails neighborhood
- Springbrook neighborhood
- Springbrook Business Park neighborhood
- Springbrook Commercial neighborhood
- Springbrook Enclave neighborhood
- Springbrook Glen neighborhood
- Springbrook Industrial Park neighborhood
- Steeds Crossing neighborhood
- Swenson Famrs neighborhood
- Swenson Farms neighborhood
- The Estates Of Rowe Lane neighborhood
- The Meadows neighborhood
- The Park At Blackhawk neighborhood
- Village Of Hidden Lake neighborhood
- Villages Of Hidden Lake neighborhood
- Walters Meadow neighborhood
- Warner Heights neighborhood
- Watson Park neighborhood
- Wells Point neighborhood
- Wells Point Commercial neighborhood
- Wellspoint neighborhood
- Wildflower Estates neighborhood
- Wilke Ridge neighborhood
- Willow Creek neighborhood
- Windermere neighborhood
- Windermere Centre neighborhood
- Windermere Terrace neighborhood
- Wrenbar neighborhood
- Wuthrich neighborhood
- Wuthrich Hill Farms neighborhood
- Yellow Sage neighborhood
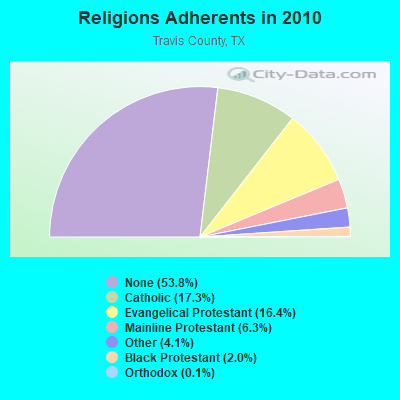
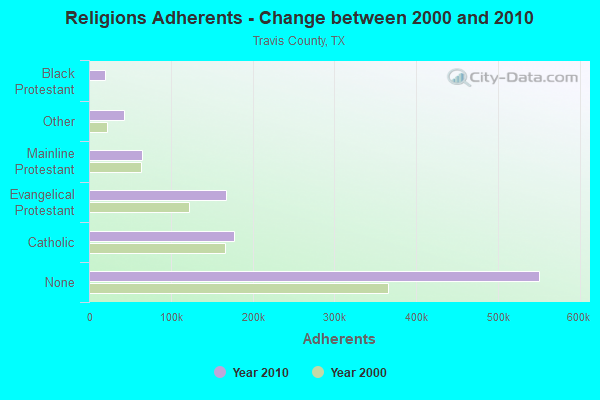
Religion statistics for Pflugerville, TX (based on Travis County data)
| Religion | Adherents | Congregations |
|---|---|---|
| Catholic | 177,192 | 30 |
| Evangelical Protestant | 167,792 | 406 |
| Mainline Protestant | 64,364 | 114 |
| Other | 42,336 | 86 |
| Black Protestant | 20,156 | 28 |
| Orthodox | 1,524 | 6 |
| None | 550,902 | - |
Food Environment Statistics:
| Travis County: | 1.37 / 10,000 pop. |
| State: | 1.47 / 10,000 pop. |
| This county: | 0.08 / 10,000 pop. |
| Texas: | 0.14 / 10,000 pop. |
| Travis County: | 1.45 / 10,000 pop. |
| Texas: | 1.11 / 10,000 pop. |
| Travis County: | 3.10 / 10,000 pop. |
| State: | 3.95 / 10,000 pop. |
| Travis County: | 7.96 / 10,000 pop. |
| State: | 6.13 / 10,000 pop. |
| This county: | 6.7% |
| Texas: | 8.9% |
| This county: | 21.7% |
| Texas: | 26.6% |
| Travis County: | 15.3% |
| Texas: | 15.7% |
Health and Nutrition:
| Pflugerville: | 49.8% |
| Texas: | 48.6% |
| Pflugerville: | 49.5% |
| State: | 47.4% |
| Here: | 28.7 |
| Texas: | 28.5 |
| This city: | 20.6% |
| Texas: | 20.6% |
| This city: | 9.9% |
| Texas: | 10.3% |
| Here: | 6.8 |
| Texas: | 6.8 |
| Here: | 33.8% |
| Texas: | 33.1% |
| Pflugerville: | 58.5% |
| Texas: | 56.2% |
| Here: | 82.5% |
| Texas: | 80.7% |
More about Health and Nutrition of Pflugerville, TX Residents
| Local government employment and payroll (March 2022) | |||||
| Function | Full-time employees | Monthly full-time payroll | Average yearly full-time wage | Part-time employees | Monthly part-time payroll |
|---|---|---|---|---|---|
| Police Protection - Officers | 90 | $577,764 | $77,035 | 0 | $0 |
| Other and Unallocable | 67 | $364,289 | $65,246 | 0 | $0 |
| Police - Other | 41 | $247,613 | $72,472 | 0 | $0 |
| Parks and Recreation | 38 | $135,707 | $42,855 | 10 | $2,031 |
| Streets and Highways | 35 | $183,025 | $62,751 | 0 | $0 |
| Water Supply | 27 | $127,739 | $56,773 | 0 | $0 |
| Local Libraries | 25 | $86,732 | $41,631 | 0 | $0 |
| Other Government Administration | 24 | $162,524 | $81,262 | 0 | $0 |
| Sewerage | 21 | $116,434 | $66,534 | 0 | $0 |
| Financial Administration | 12 | $67,253 | $67,253 | 0 | $0 |
| Health | 12 | $39,700 | $39,700 | 0 | $0 |
| Judicial and Legal | 6 | $25,479 | $50,958 | 0 | $0 |
| Solid Waste Management | 0 | $0 | 1 | $1,607 | |
| Totals for Government | 398 | $2,134,259 | $64,350 | 11 | $3,638 |
Pflugerville government finances - Expenditure in 2021 (per resident):
- Construction - Regular Highways: $10,216,000 ($155.84)
Water Utilities: $7,083,000 ($108.05)
Sewerage: $3,319,000 ($50.63)
Parks and Recreation: $1,696,000 ($25.87)
Health - Other: $42,000 ($0.64)
- Current Operations - Police Protection: $15,402,000 ($234.94)
Water Utilities: $9,265,000 ($141.33)
Solid Waste Management: $5,262,000 ($80.27)
Central Staff Services: $5,084,000 ($77.55)
Sewerage: $5,048,000 ($77.00)
Regular Highways: $3,859,000 ($58.87)
Parks and Recreation: $3,488,000 ($53.21)
Protective Inspection and Regulation - Other: $1,745,000 ($26.62)
Libraries: $1,524,000 ($23.25)
Financial Administration: $985,000 ($15.03)
Health - Other: $703,000 ($10.72)
Judicial and Legal Services: $599,000 ($9.14)
General - Other: $563,000 ($8.59)
General Public Buildings: $379,000 ($5.78)
Housing and Community Development: $103,000 ($1.57)
- Intergovernmental to Local - Other - Local Fire Protection: $116,000 ($1.77)
Other - Central Staff Services: $82,000 ($1.25)
- Intergovernmental to State - Regular Highways: $50,000 ($0.76)
- Other Capital Outlay - General - Other: $6,400,000 ($97.63)
Parks and Recreation: $4,620,000 ($70.47)
Police Protection: $1,776,000 ($27.09)
Water Utilities: $624,000 ($9.52)
Central Staff Services: $313,000 ($4.77)
Regular Highways: $230,000 ($3.51)
Protective Inspection and Regulation - Other: $68,000 ($1.04)
Sewerage: $41,000 ($0.63)
- Total Salaries and Wages: $19,172,000 ($292.45)
- Water Utilities - Interest on Debt: $6,761,000 ($103.13)
Pflugerville government finances - Revenue in 2021 (per resident):
- Charges - Sewerage: $7,338,000 ($111.93)
Solid Waste Management: $4,887,000 ($74.55)
Parks and Recreation: $781,000 ($11.91)
- Federal Intergovernmental - Housing and Community Development: $85,000 ($1.30)
Other: $10,000 ($0.15)
- Local Intergovernmental - Other: $2,519,000 ($38.43)
General Local Government Support: $182,000 ($2.78)
- Miscellaneous - Special Assessments: $11,706,000 ($178.56)
Fines and Forfeits: $1,528,000 ($23.31)
Interest Earnings: $550,000 ($8.39)
General Revenue - Other: $103,000 ($1.57)
Rents: $68,000 ($1.04)
Sale of Property: $66,000 ($1.01)
Donations From Private Sources: $48,000 ($0.73)
- Revenue - Water Utilities: $17,670,000 ($269.54)
- State Intergovernmental - General Local Government Support: $78,000 ($1.19)
Other: $29,000 ($0.44)
- Tax - Property: $25,216,000 ($384.65)
General Sales and Gross Receipts: $9,089,000 ($138.64)
Public Utilities Sales: $4,287,000 ($65.39)
Other License: $1,917,000 ($29.24)
Motor Vehicle License: $74,000 ($1.13)
Other Selective Sales: $24,000 ($0.37)
Alcoholic Beverage License: $5,000 ($0.08)
Amusements License: $1,000 ($0.02)
Pflugerville government finances - Debt in 2021 (per resident):
- Long Term Debt - Beginning Outstanding - Unspecified Public Purpose: $133,290,000 ($2033.22)
Outstanding Unspecified Public Purpose: $103,465,000 ($1578.27)
Retired Unspecified Public Purpose: $29,825,000 ($454.95)
Pflugerville government finances - Cash and Securities in 2021 (per resident):
- Bond Funds - Cash and Securities: $70,833,000 ($1080.50)
- Other Funds - Cash and Securities: $64,645,000 ($986.10)
- Sinking Funds - Cash and Securities: $3,921,000 ($59.81)
10.48% of this county's 2021 resident taxpayers lived in other counties in 2020 ($119,731 average adjusted gross income)
| Here: | 10.48% |
| Texas average: | 8.12% |
0.01% of residents moved from foreign countries ($116 average AGI)
Travis County: 0.01% Texas average: 0.04%
Top counties from which taxpayers relocated into this county between 2020 and 2021:
| from Williamson County, TX | |
| from Harris County, TX | |
| from Hays County, TX |
10.53% of this county's 2020 resident taxpayers moved to other counties in 2021 ($85,650 average adjusted gross income)
| Here: | 10.53% |
| Texas average: | 7.40% |
0.02% of residents moved to foreign countries ($136 average AGI)
Travis County: 0.02% Texas average: 0.03%
Top counties to which taxpayers relocated from this county between 2020 and 2021:
| to Williamson County, TX | |
| to Hays County, TX | |
| to Harris County, TX |
| Businesses in Pflugerville, TX | ||||
| Name | Count | Name | Count | |
|---|---|---|---|---|
| 24 Hour Fitness | 1 | Little Caesars Pizza | 1 | |
| 7-Eleven | 1 | Maurices | 1 | |
| AT&T | 1 | McDonald's | 3 | |
| Advance Auto Parts | 1 | Nike | 2 | |
| Ashley Furniture | 1 | Office Depot | 1 | |
| AutoZone | 2 | Panda Express | 1 | |
| Baskin-Robbins | 1 | Papa John's Pizza | 1 | |
| Blockbuster | 1 | Pizza Hut | 1 | |
| CVS | 1 | Popeyes | 1 | |
| Chick-Fil-A | 1 | RadioShack | 1 | |
| Cricket Wireless | 3 | Rue21 | 1 | |
| Curves | 1 | SONIC Drive-In | 2 | |
| Domino's Pizza | 1 | Starbucks | 3 | |
| FedEx | 4 | Subway | 1 | |
| Firestone Complete Auto Care | 2 | T-Mobile | 2 | |
| GNC | 1 | Taco Bell | 2 | |
| GameStop | 1 | Target | 1 | |
| Goodwill | 1 | U-Haul | 1 | |
| H&R Block | 1 | UPS | 1 | |
| Home Depot | 1 | Verizon Wireless | 2 | |
| Jack In The Box | 2 | Walgreens | 2 | |
| Jones New York | 1 | Walmart | 1 | |
| La-Z-Boy | 1 | Wendy's | 1 | |
Strongest AM radio stations in Pflugerville:
- WMOP (900 AM; 5 kW; OCALA, FL; Owner: FLORIDA SPORTSTALK, INC.)
- KVET (1300 AM; 5 kW; AUSTIN, TX; Owner: CAPSTAR TX LIMITED PARTNERSHIP)
- KOKE (1600 AM; 5 kW; PFLUGERVILLE, TX; Owner: AMIGO RADIO, LTD.)
- KTXZ (1560 AM; 2 kW; WEST LAKE HILLS, TX; Owner: NOGALES BROADCASTING, L.C.)
- KLBJ (590 AM; 5 kW; AUSTIN, TX; Owner: EMMIS AUSTIN RADIO BROADCASTING COMPANY, L.P.)
- KJCE (1370 AM; 5 kW; ROLLINGWOOD, TX; Owner: TEXAS INFINITY RADIO L.P.)
- KFIT (1060 AM; daytime; 2 kW; LOCKHART, TX; Owner: KFIT, INC..)
- KIXL (970 AM; 1 kW; DEL VALLE, TX; Owner: KIXL BROADCASTING, CORPORATION)
- KQQA (1530 AM; 10 kW; CREEDMOOR, TX; Owner: YELLOW ROSE COMMUNICATIONS, INC.)
- KTKR (760 AM; 50 kW; SAN ANTONIO, TX; Owner: CCB TEXAS LICENSES, L.P.)
- WOAI (1200 AM; 50 kW; SAN ANTONIO, TX; Owner: CCB TEXAS LICENSES, L.P.)
- KKYX (680 AM; 50 kW; SAN ANTONIO, TX; Owner: CXR HOLDINGS, INC.)
- KELG (1440 AM; 1 kW; MANOR, TX; Owner: DYNAMIC RADIO BROADCASTING CORP.)
Strongest FM radio stations in Pflugerville:
- KNLE-FM (88.1 FM; ROUND ROCK, TX; Owner: IXOYE PRODUCTIONS, INC.)
- KAMX (94.7 FM; LULING, TX; Owner: TEXAS INFINITY RADIO L.P.)
- KKMJ-FM (95.5 FM; AUSTIN, TX; Owner: TEXAS INFINITY RADIO L.P.)
- KMFA (89.5 FM; AUSTIN, TX; Owner: CAPITOL BROADCASTING ASSOCIATION, INC)
- KASE-FM (100.7 FM; AUSTIN, TX; Owner: CAPSTAR TX LIMITED PARTNERSHIP)
- KQJZ (92.1 FM; HUTTO, TX; Owner: CENTRAL TEXAS RADIO, INC.)
- KFMK (105.9 FM; ROUND ROCK, TX; Owner: CAPSTAR TX LIMITED PARTNERSHIP)
- KLBJ-FM (93.7 FM; AUSTIN, TX; Owner: EMMIS AUSTIN RADIO BROADCASTING COMPANY, L.P.)
- KVET-FM (98.1 FM; AUSTIN, TX; Owner: CAPSTAR TX LIMITED PARTNERSHIP)
- KHFI-FM (96.7 FM; GEORGETOWN, TX; Owner: CCB TEXAS LICENSES, L.P.)
- KQBT (104.3 FM; TAYLOR, TX; Owner: INFINITY RADIO OPERATIONS INC.)
- KDHT (93.3 FM; CEDAR PARK, TX; Owner: EMMIS AUSTIN RADIO BROADCASTING COMPANY, L.P.)
- KHHL (98.9 FM; LEANDER, TX; Owner: AMIGO RADIO, LTD.)
- KINV (107.7 FM; GEORGETOWN, TX; Owner: SIMMONS LONE STAR MEDIA, LTD.)
- KUT (90.5 FM; AUSTIN, TX; Owner: THE UNIVERSITY OF TEXAS AT AUSTIN)
- KEYI-FM (103.5 FM; SAN MARCOS, TX; Owner: EMMIS AUSTIN RADIO BROADCASTING COMPANY, L.P.)
- KPEZ (102.3 FM; AUSTIN, TX; Owner: CCB TEXAS LICENSES, L.P.)
- KNCT-FM (91.3 FM; KILLEEN, TX; Owner: CENTRAL TEXAS COLLEGE)
- KKLB (92.5 FM; ELGIN, TX; Owner: ELGIN FM LIMITED PARTNERSHIP)
- KAZI (88.7 FM; AUSTIN, TX; Owner: AUSTIN COMMUNITY RADIO)
TV broadcast stations around Pflugerville:
- KTBC (Channel 7; AUSTIN, TX; Owner: KTBC LICENSE, INC.)
- KEYE-TV (Channel 42; AUSTIN, TX; Owner: CBS STATIONS GROUP OF TEXAS L.P.)
- KXAN-TV (Channel 36; AUSTIN, TX; Owner: KXAN, INC.)
- KNVA (Channel 54; AUSTIN, TX; Owner: 54 BROADCASTING, INC.)
- KVUE (Channel 24; AUSTIN, TX; Owner: KVUE TELEVISION, INC.)
- KLRU (Channel 18; AUSTIN, TX; Owner: CAPITAL OF TEXAS PUBLIC TELECOMMUNICATIONS COUNCIL)
- KQUX-CA (Channel 11; AUSTIN, TX; Owner: LOUIS MARTINEZ FAMILY GROUP, LLC)
- KBVO-CA (Channel 49; AUSTIN, TX; Owner: KXAN, INC.)
- K34FM (Channel 34; AUSTIN, TX; Owner: TRINITY BROADCASTING NETWORK)
- K63AY (Channel 63; MULLIN, TX; Owner: MAKO COMMUNICATIONS, LLC)
- KAKW (Channel 62; KILLEEN, TX; Owner: KAKW LICENSE PARTNERSHIP, L.P.)
- KHPX-CA (Channel 48; GEORGETOWN, TX; Owner: KXAN, INC.)
- KHPZ-CA (Channel 64; ROUND ROCK, TX; Owner: KXAN, INC.)
- KGBS-CA (Channel 65; AUSTIN, TX; Owner: CABALLERO TELEVISION AUSTIN, INC.)
- KADF-LP (Channel 20; AUSTIN, TX; Owner: JOSEPH W. SHAFFER)
- K09VR (Channel 9; AUSTIN, TX; Owner: THE UNIVERSITY OF TEXAS AT AUSTIN)
- KXLK-CA (Channel 67; AUSTIN, TX; Owner: CASA OF AUSTIN, A CALIFORNIA LIMITED PARTNERSHIP)
- KDAS-CA (Channel 31; AUSTIN, TX; Owner: KWEX LICENSE PARTNERSHIP, L.P.)
- KNCT (Channel 46; BELTON, TX; Owner: CENTRAL TEXAS COLLEGE)
- National Bridge Inventory (NBI) Statistics
- 136Number of bridges
- 2,280ft / 695mTotal length
- $911,000Total costs
- 763,261Total average daily traffic
- 61,119Total average daily truck traffic
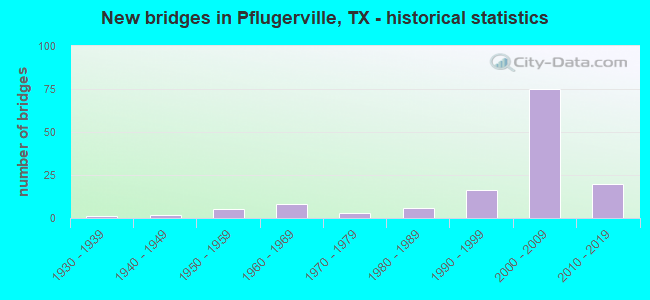
- New bridges - historical statistics
- 11930-1939
- 21940-1949
- 51950-1959
- 81960-1969
- 31970-1979
- 61980-1989
- 161990-1999
- 752000-2009
- 202010-2019
FCC Registered Private Land Mobile Towers: 4 (See the full list of FCC Registered Private Land Mobile Towers in Pflugerville, TX)
FCC Registered Broadcast Land Mobile Towers: 23 (See the full list of FCC Registered Broadcast Land Mobile Towers)
FCC Registered Microwave Towers: 24 (See the full list of FCC Registered Microwave Towers in this town)
FCC Registered Paging Towers: 10 (See the full list of FCC Registered Paging Towers)
FCC Registered Maritime Coast & Aviation Ground Towers: 2 (See the full list of FCC Registered Maritime Coast & Aviation Ground Towers)
FCC Registered Amateur Radio Licenses: 374 (See the full list of FCC Registered Amateur Radio Licenses in Pflugerville)
FAA Registered Aircraft: 42 (See the full list of FAA Registered Aircraft in Pflugerville)
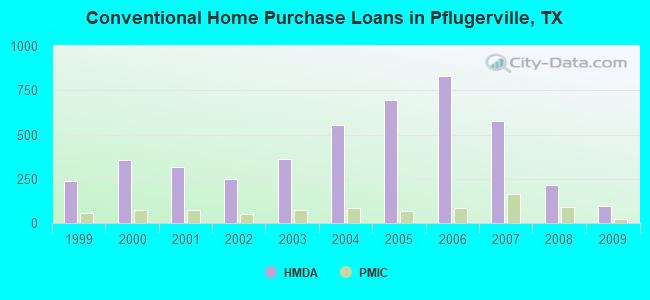
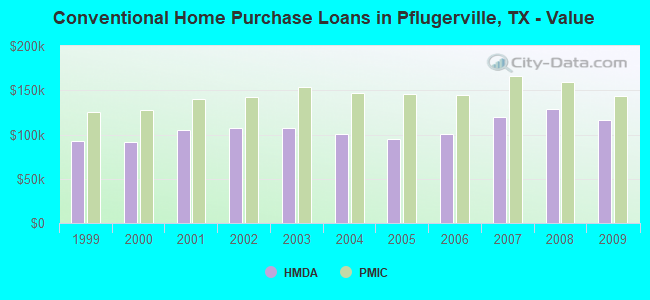
| Home Mortgage Disclosure Act Aggregated Statistics For Year 2009 (Based on 2 partial tracts) | ||||||||||||
| A) FHA, FSA/RHS & VA Home Purchase Loans | B) Conventional Home Purchase Loans | C) Refinancings | D) Home Improvement Loans | F) Non-occupant Loans on < 5 Family Dwellings (A B C & D) | G) Loans On Manufactured Home Dwelling (A B C & D) | |||||||
|---|---|---|---|---|---|---|---|---|---|---|---|---|
| Number | Average Value | Number | Average Value | Number | Average Value | Number | Average Value | Number | Average Value | Number | Average Value | |
| LOANS ORIGINATED | 231 | $155,184 | 95 | $116,208 | 355 | $135,845 | 18 | $41,910 | 19 | $107,950 | 8 | $26,174 |
| APPLICATIONS APPROVED, NOT ACCEPTED | 11 | $149,849 | 14 | $58,860 | 46 | $139,872 | 6 | $27,930 | 3 | $114,940 | 11 | $33,863 |
| APPLICATIONS DENIED | 67 | $155,024 | 19 | $108,506 | 148 | $136,138 | 33 | $43,714 | 11 | $110,353 | 4 | $41,342 |
| APPLICATIONS WITHDRAWN | 29 | $166,287 | 11 | $132,630 | 107 | $143,479 | 6 | $85,710 | 7 | $115,279 | 0 | $0 |
| FILES CLOSED FOR INCOMPLETENESS | 4 | $136,198 | 1 | $266,030 | 26 | $149,739 | 1 | $77,620 | 1 | $232,300 | 0 | $0 |
Detailed HMDA statistics for the following Tracts: 0018.36 , 0018.41
| Private Mortgage Insurance Companies Aggregated Statistics For Year 2009 (Based on 2 partial tracts) | ||||
| A) Conventional Home Purchase Loans | B) Refinancings | |||
|---|---|---|---|---|
| Number | Average Value | Number | Average Value | |
| LOANS ORIGINATED | 21 | $143,870 | 24 | $156,502 |
| APPLICATIONS APPROVED, NOT ACCEPTED | 4 | $169,242 | 10 | $154,670 |
| APPLICATIONS DENIED | 3 | $184,503 | 2 | $126,220 |
| APPLICATIONS WITHDRAWN | 1 | $163,920 | 3 | $132,180 |
| FILES CLOSED FOR INCOMPLETENESS | 0 | $0 | 0 | $0 |
Detailed PMIC statistics for the following Tracts: 0018.36 , 0018.41
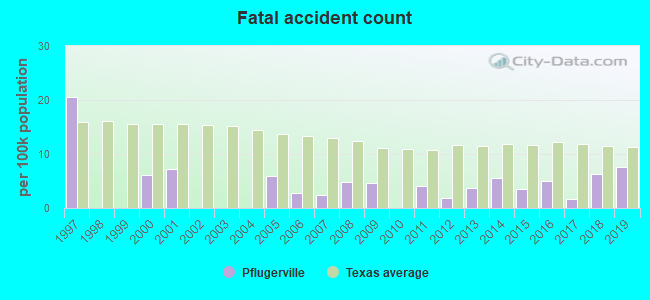
2003 - 2018 National Fire Incident Reporting System (NFIRS) incidents
- Fire incident types reported to NFIRS in Pflugerville, TX
- 1,22251.1%Outside Fires
- 67028.0%Structure Fires
- 36115.1%Mobile Property/Vehicle Fires
- 1375.7%Other
 Based on the data from the years 2003 - 2018 the average number of fires per year is 149. The highest number of fires - 210 took place in 2013, and the least - 103 in 2017. The data has a dropping trend.
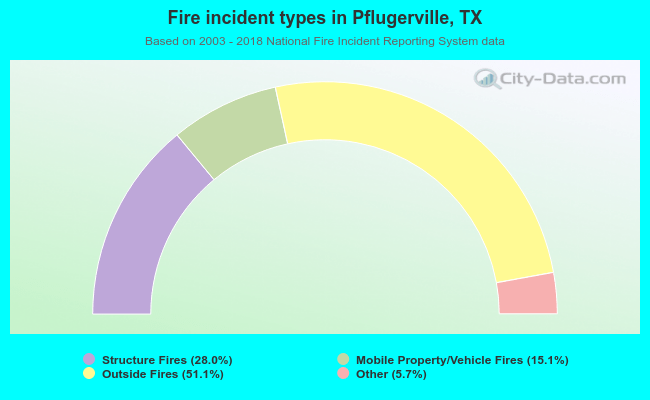 When looking into fire subcategories, the most incidents belonged to: Outside Fires (51.1%), and Structure Fires (28.0%).
Fire-safe hotels and motels in Pflugerville, Texas:
- Best Western Plus Inns & Suites Pflugerville, 16101 Impact Way, Pflugerville, Texas 78660 , Phone: (512) 600-3300, Fax: (512) 600-1961
- Courtyard by Marriott Austin/Pflugerville, 16100 Impact Way, Pflugerville, Texas 78660 , Phone: (844) 781-7382, Fax: (512) 220-2526
| Most common first names in Pflugerville, TX among deceased individuals | ||
| Name | Count | Lived (average) |
|---|---|---|
| Robert | 29 | 74.7 years |
| Mary | 27 | 73.8 years |
| William | 20 | 81.1 years |
| John | 19 | 76.5 years |
| James | 18 | 66.4 years |
| Charles | 17 | 72.1 years |
| Richard | 16 | 66.8 years |
| Margaret | 12 | 81.4 years |
| Alice | 12 | 80.6 years |
| Betty | 12 | 73.6 years |
| Most common last names in Pflugerville, TX among deceased individuals | ||
| Last name | Count | Lived (average) |
|---|---|---|
| Pfluger | 27 | 85.4 years |
| Smith | 16 | 69.8 years |
| Bohls | 12 | 88.8 years |
| Johnson | 12 | 73.1 years |
| Davis | 11 | 75.0 years |
| Jones | 11 | 76.8 years |
| Kuempel | 10 | 82.9 years |
| Priem | 9 | 69.9 years |
| Moore | 9 | 76.8 years |
| Taylor | 8 | 82.8 years |
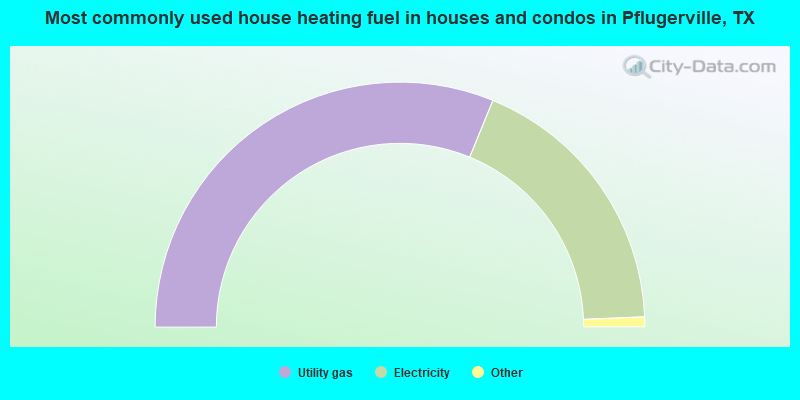
- 62.4%Utility gas
- 36.3%Electricity
- 0.7%Bottled, tank, or LP gas
- 0.5%Fuel oil, kerosene, etc.
- 0.1%Solar energy
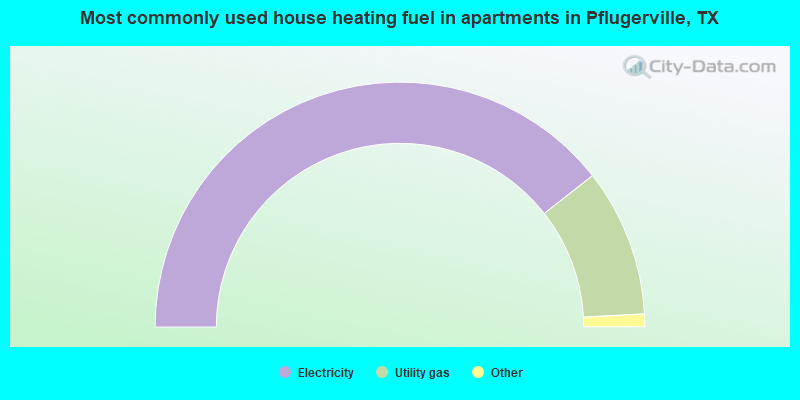
- 78.8%Electricity
- 19.5%Utility gas
- 0.6%Bottled, tank, or LP gas
- 0.5%Other fuel
- 0.4%Wood
- 0.2%No fuel used
Pflugerville compared to Texas state average:
- Median household income above state average.
- Unemployed percentage significantly below state average.
- Black race population percentage significantly above state average.
- Hispanic race population percentage significantly above state average.
- Foreign-born population percentage significantly above state average.
- Renting percentage below state average.
- Length of stay since moving in below state average.
- House age significantly below state average.
- Percentage of population with a bachelor's degree or higher above state average.
Pflugerville on our top lists:
- #2 on the list of "Top 101 cities with the least people below 50% of the poverty level (population 50,000+)"
- #4 on the list of "Top 101 cities with the largest percentage population increase from 2000 (population 50,000+)"
- #6 on the list of "Top 101 cities with largest percentage population increases in the 1990s) (population 50,000+)"
- #6 on the list of "Top 101 cities with the smallest household incomes disparities (population 50,000+)"
- #9 on the list of "Top 100 fastest growing cities from 2000 to 2014 (pop. 50,000+)"
- #15 on the list of "Top 100 cities with newest houses (pop. 50,000+)"
- #17 on the list of "Top 101 cities with most building permits per 10,000 residents (population 50,000+)"
- #20 on the list of "Top 101 cities with the largest percentage of likely lesbian couples (counted as self-reported female-female unmarried-partner households) (population 50,000+)"
- #21 on the list of "Top 101 cities with the lowest number of robberies per 100,000 residents (population 50,000+)"
- #23 on the list of "Top 100 cities with highest median household income and median resident age less than 35 (pop. 50,000+)"
- #24 on the list of "Top 101 cities with largest percentage of females in industries: public administration (population 50,000+)"
- #25 on the list of "Top 101 cities with largest percentage of males in occupations: computer and mathematical occupations (population 50,000+)"
- #39 on the list of "Top 101 cities with largest percentage of males in occupations: law enforcement workers including supervisors (population 50,000+)"
- #42 on the list of "Top 101 cities that people commute from (largest negative percentage daily daytime population change due to commuting) (population 50,000+)"
- #43 on the list of "Top 101 cities with largest percentage of workers with very short commute times (9 minutes or less) (population 50,000+)"
- #43 on the list of "Top 100 cities with lowest ratio of median house value to median household income (pop. 50,000+)"
- #44 on the list of "Top 101 cities with the largest percentage of likely homosexual households (counted as self-reported same-sex unmarried-partner households) (population 50,000+)"
- #49 on the list of "Top 101 cities with the least people having professional degrees (population 50,000+)"
- #54 on the list of "Top 101 cities with the lowest number of burglaries per 100,000 residents (population 50,000+)"
- #54 on the list of "Top 101 cities with the smallest house values disparities (population 50,000+)"
- #78 (78660) on the list of "Top 101 zip codes with the smallest percentage of taxpayers using paid preparers for 2012 taxes (pop 5,000+)"
- #11 on the list of "Top 101 counties with highest percentage of residents voting for 3rd party candidates in the 2012 Presidential Election (pop. 50,000+)"
- #18 on the list of "Top 101 counties with the largest number of people moving in compared to moving out (pop. 50,000+)"
- #20 on the list of "Top 101 counties with the lowest number of deaths per 1000 residents 2007-2013 (pop. 50,000+)"
- #34 on the list of "Top 101 counties with the most Evangelical Protestant adherents"
- #43 on the list of "Top 101 counties with the most Evangelical Protestant congregations (pop. 50,000+)"

|
|
Total of 1665 patent applications in 2008-2024.