Cities: Elgin, TX (3.08%) ,
Webberville, TX (0.30%) ,
Manor, TX (0.00%) Counties: Bastrop County, TX (59.84%) ,
Travis County, TX (16.76%) ,
Williamson County, TX (12.60%) ,
Lee County, TX (10.80%) Estimated zip code population in 2022: 26,835
Zip code population in 2010: 21,659
Zip code population in 2000: 16,299
Houses and condos: 9,948
Renter-occupied apartments: 1,876
% of renters here:
20%State:
38%
March 2022 cost of living index in zip code 78621: 80.4
(low, U.S. average is 100)
Land area: 187.0
sq. mi.
Water area: 1.0
sq. mi.
Population density: 143 people per square mile (very low).
OSM Map
General Map
Google Map
MSN Map
OSM Map
General Map
Google Map
MSN Map
OSM Map
General Map
Google Map
MSN Map
OSM Map
General Map
Google Map
MSN Map
Please wait while loading the map...
Real estate property taxes paid for housing units in 2022:
This zip code:
1.6% ($4,477)Texas:
1.5% ($4,050)
Median real estate property taxes paid for housing units with mortgages in 2022: $5,305 (1.7%)
Median real estate property taxes paid for housing units with no mortgage in 2022: $3,085 (1.1%)
Profiles of local businesses
Business Search - 14 Million verified businesses
Males: 12,799 Females: 14,035
For population 25 years and over in 78621:
High school or higher: 81.6%Bachelor's degree or higher: 23.3%Graduate or professional degree: 8.5%Unemployed: 3.8%Mean travel time to work (commute): 35.9 minutes
For population 15 years and over in 78621:
Never married: 28.6%Now married: 53.5%Separated: 1.7%Widowed: 4.9%Divorced: 11.3%
Zip code 78621 compared to state average:
Renting percentage below state average. Length of stay since moving in significantly above state average. Number of college students below state average. 12,006 44.7% Hispanic or Latino 11,210 41.8% White 2,373 8.8% Black 1,065 4.0% Two or more races 88 0.3% Asian 56 0.2% Some other race 34 0.1% American Indian
Data:
Median household income ($)
Median household income (% change since 2000)
Household income diversity
Ratio of average income to average house value (%)
Ratio of average income to average rent
Median household income ($) - White
Median household income ($) - Black or African American
Median household income ($) - Asian
Median household income ($) - Hispanic or Latino
Median household income ($) - American Indian and Alaska Native
Median household income ($) - Multirace
Median household income ($) - Other Race
Median household income for houses/condos with a mortgage ($)
Median household income for apartments without a mortgage ($)
Races - White alone (%)
Races - White alone (% change since 2000)
Races - Black alone (%)
Races - Black alone (% change since 2000)
Races - American Indian alone (%)
Races - American Indian alone (% change since 2000)
Races - Asian alone (%)
Races - Asian alone (% change since 2000)
Races - Hispanic (%)
Races - Hispanic (% change since 2000)
Races - Native Hawaiian and Other Pacific Islander alone (%)
Races - Native Hawaiian and Other Pacific Islander alone (% change since 2000)
Races - Two or more races (%)
Races - Two or more races (% change since 2000)
Races - Other race alone (%)
Races - Other race alone (% change since 2000)
Racial diversity
Unemployment (%)
Unemployment (% change since 2000)
Unemployment (%) - White
Unemployment (%) - Black or African American
Unemployment (%) - Asian
Unemployment (%) - Hispanic or Latino
Unemployment (%) - American Indian and Alaska Native
Unemployment (%) - Multirace
Unemployment (%) - Other Race
Population density (people per square mile)
Population - Males (%)
Population - Females (%)
Population - Males (%) - White
Population - Males (%) - Black or African American
Population - Males (%) - Asian
Population - Males (%) - Hispanic or Latino
Population - Males (%) - American Indian and Alaska Native
Population - Males (%) - Multirace
Population - Males (%) - Other Race
Population - Females (%) - White
Population - Females (%) - Black or African American
Population - Females (%) - Asian
Population - Females (%) - Hispanic or Latino
Population - Females (%) - American Indian and Alaska Native
Population - Females (%) - Multirace
Population - Females (%) - Other Race
Coronavirus confirmed cases (Apr 26, 2024)
Deaths caused by coronavirus (Apr 26, 2024)
Coronavirus confirmed cases (per 100k population) (Apr 26, 2024)
Deaths caused by coronavirus (per 100k population) (Apr 26, 2024)
Daily increase in number of cases (Apr 26, 2024)
Weekly increase in number of cases (Apr 26, 2024)
Cases doubled (in days) (Apr 26, 2024)
Hospitalized patients (Apr 18, 2022)
Negative test results (Apr 18, 2022)
Total test results (Apr 18, 2022)
COVID Vaccine doses distributed (per 100k population) (Sep 19, 2023)
COVID Vaccine doses administered (per 100k population) (Sep 19, 2023)
COVID Vaccine doses distributed (Sep 19, 2023)
COVID Vaccine doses administered (Sep 19, 2023)
Likely homosexual households (%)
Likely homosexual households (% change since 2000)
Likely homosexual households - Lesbian couples (%)
Likely homosexual households - Lesbian couples (% change since 2000)
Likely homosexual households - Gay men (%)
Likely homosexual households - Gay men (% change since 2000)
Cost of living index
Median gross rent ($)
Median contract rent ($)
Median monthly housing costs ($)
Median house or condo value ($)
Median house or condo value ($ change since 2000)
Mean house or condo value by units in structure - 1, detached ($)
Mean house or condo value by units in structure - 1, attached ($)
Mean house or condo value by units in structure - 2 ($)
Mean house or condo value by units in structure by units in structure - 3 or 4 ($)
Mean house or condo value by units in structure - 5 or more ($)
Mean house or condo value by units in structure - Boat, RV, van, etc. ($)
Mean house or condo value by units in structure - Mobile home ($)
Median house or condo value ($) - White
Median house or condo value ($) - Black or African American
Median house or condo value ($) - Asian
Median house or condo value ($) - Hispanic or Latino
Median house or condo value ($) - American Indian and Alaska Native
Median house or condo value ($) - Multirace
Median house or condo value ($) - Other Race
Median resident age
Resident age diversity
Median resident age - Males
Median resident age - Females
Median resident age - White
Median resident age - Black or African American
Median resident age - Asian
Median resident age - Hispanic or Latino
Median resident age - American Indian and Alaska Native
Median resident age - Multirace
Median resident age - Other Race
Median resident age - Males - White
Median resident age - Males - Black or African American
Median resident age - Males - Asian
Median resident age - Males - Hispanic or Latino
Median resident age - Males - American Indian and Alaska Native
Median resident age - Males - Multirace
Median resident age - Males - Other Race
Median resident age - Females - White
Median resident age - Females - Black or African American
Median resident age - Females - Asian
Median resident age - Females - Hispanic or Latino
Median resident age - Females - American Indian and Alaska Native
Median resident age - Females - Multirace
Median resident age - Females - Other Race
Commute - mean travel time to work (minutes)
Travel time to work - Less than 5 minutes (%)
Travel time to work - Less than 5 minutes (% change since 2000)
Travel time to work - 5 to 9 minutes (%)
Travel time to work - 5 to 9 minutes (% change since 2000)
Travel time to work - 10 to 19 minutes (%)
Travel time to work - 10 to 19 minutes (% change since 2000)
Travel time to work - 20 to 29 minutes (%)
Travel time to work - 20 to 29 minutes (% change since 2000)
Travel time to work - 30 to 39 minutes (%)
Travel time to work - 30 to 39 minutes (% change since 2000)
Travel time to work - 40 to 59 minutes (%)
Travel time to work - 40 to 59 minutes (% change since 2000)
Travel time to work - 60 to 89 minutes (%)
Travel time to work - 60 to 89 minutes (% change since 2000)
Travel time to work - 90 or more minutes (%)
Travel time to work - 90 or more minutes (% change since 2000)
Marital status - Never married (%)
Marital status - Now married (%)
Marital status - Separated (%)
Marital status - Widowed (%)
Marital status - Divorced (%)
Median family income ($)
Median family income (% change since 2000)
Median non-family income ($)
Median non-family income (% change since 2000)
Median per capita income ($)
Median per capita income (% change since 2000)
Median family income ($) - White
Median family income ($) - Black or African American
Median family income ($) - Asian
Median family income ($) - Hispanic or Latino
Median family income ($) - American Indian and Alaska Native
Median family income ($) - Multirace
Median family income ($) - Other Race
Median year house/condo built
Median year apartment built
Year house built - Built 2005 or later (%)
Year house built - Built 2000 to 2004 (%)
Year house built - Built 1990 to 1999 (%)
Year house built - Built 1980 to 1989 (%)
Year house built - Built 1970 to 1979 (%)
Year house built - Built 1960 to 1969 (%)
Year house built - Built 1950 to 1959 (%)
Year house built - Built 1940 to 1949 (%)
Year house built - Built 1939 or earlier (%)
Average household size
Household density (households per square mile)
Average household size - White
Average household size - Black or African American
Average household size - Asian
Average household size - Hispanic or Latino
Average household size - American Indian and Alaska Native
Average household size - Multirace
Average household size - Other Race
Occupied housing units (%)
Vacant housing units (%)
Owner occupied housing units (%)
Renter occupied housing units (%)
Vacancy status - For rent (%)
Vacancy status - For sale only (%)
Vacancy status - Rented or sold, not occupied (%)
Vacancy status - For seasonal, recreational, or occasional use (%)
Vacancy status - For migrant workers (%)
Vacancy status - Other vacant (%)
Residents with income below the poverty level (%)
Residents with income below 50% of the poverty level (%)
Children below poverty level (%)
Poor families by family type - Married-couple family (%)
Poor families by family type - Male, no wife present (%)
Poor families by family type - Female, no husband present (%)
Poverty status for native-born residents (%)
Poverty status for foreign-born residents (%)
Poverty among high school graduates not in families (%)
Poverty among people who did not graduate high school not in families (%)
Residents with income below the poverty level (%) - White
Residents with income below the poverty level (%) - Black or African American
Residents with income below the poverty level (%) - Asian
Residents with income below the poverty level (%) - Hispanic or Latino
Residents with income below the poverty level (%) - American Indian and Alaska Native
Residents with income below the poverty level (%) - Multirace
Residents with income below the poverty level (%) - Other Race
Air pollution - Air Quality Index (AQI)
Air pollution - CO
Air pollution - NO2
Air pollution - SO2
Air pollution - Ozone
Air pollution - PM10
Air pollution - PM25
Air pollution - Pb
Crime - Murders per 100,000 population
Crime - Rapes per 100,000 population
Crime - Robberies per 100,000 population
Crime - Assaults per 100,000 population
Crime - Burglaries per 100,000 population
Crime - Thefts per 100,000 population
Crime - Auto thefts per 100,000 population
Crime - Arson per 100,000 population
Crime - City-data.com crime index
Crime - Violent crime index
Crime - Property crime index
Crime - Murders per 100,000 population (5 year average)
Crime - Rapes per 100,000 population (5 year average)
Crime - Robberies per 100,000 population (5 year average)
Crime - Assaults per 100,000 population (5 year average)
Crime - Burglaries per 100,000 population (5 year average)
Crime - Thefts per 100,000 population (5 year average)
Crime - Auto thefts per 100,000 population (5 year average)
Crime - Arson per 100,000 population (5 year average)
Crime - City-data.com crime index (5 year average)
Crime - Violent crime index (5 year average)
Crime - Property crime index (5 year average)
1996 Presidential Elections Results (%) - Democratic Party (Clinton)
1996 Presidential Elections Results (%) - Republican Party (Dole)
1996 Presidential Elections Results (%) - Other
2000 Presidential Elections Results (%) - Democratic Party (Gore)
2000 Presidential Elections Results (%) - Republican Party (Bush)
2000 Presidential Elections Results (%) - Other
2004 Presidential Elections Results (%) - Democratic Party (Kerry)
2004 Presidential Elections Results (%) - Republican Party (Bush)
2004 Presidential Elections Results (%) - Other
2008 Presidential Elections Results (%) - Democratic Party (Obama)
2008 Presidential Elections Results (%) - Republican Party (McCain)
2008 Presidential Elections Results (%) - Other
2012 Presidential Elections Results (%) - Democratic Party (Obama)
2012 Presidential Elections Results (%) - Republican Party (Romney)
2012 Presidential Elections Results (%) - Other
2016 Presidential Elections Results (%) - Democratic Party (Clinton)
2016 Presidential Elections Results (%) - Republican Party (Trump)
2016 Presidential Elections Results (%) - Other
2020 Presidential Elections Results (%) - Democratic Party (Biden)
2020 Presidential Elections Results (%) - Republican Party (Trump)
2020 Presidential Elections Results (%) - Other
Ancestries Reported - Arab (%)
Ancestries Reported - Czech (%)
Ancestries Reported - Danish (%)
Ancestries Reported - Dutch (%)
Ancestries Reported - English (%)
Ancestries Reported - French (%)
Ancestries Reported - French Canadian (%)
Ancestries Reported - German (%)
Ancestries Reported - Greek (%)
Ancestries Reported - Hungarian (%)
Ancestries Reported - Irish (%)
Ancestries Reported - Italian (%)
Ancestries Reported - Lithuanian (%)
Ancestries Reported - Norwegian (%)
Ancestries Reported - Polish (%)
Ancestries Reported - Portuguese (%)
Ancestries Reported - Russian (%)
Ancestries Reported - Scotch-Irish (%)
Ancestries Reported - Scottish (%)
Ancestries Reported - Slovak (%)
Ancestries Reported - Subsaharan African (%)
Ancestries Reported - Swedish (%)
Ancestries Reported - Swiss (%)
Ancestries Reported - Ukrainian (%)
Ancestries Reported - United States (%)
Ancestries Reported - Welsh (%)
Ancestries Reported - West Indian (%)
Ancestries Reported - Other (%)
Educational Attainment - No schooling completed (%)
Educational Attainment - Less than high school (%)
Educational Attainment - High school or equivalent (%)
Educational Attainment - Less than 1 year of college (%)
Educational Attainment - 1 or more years of college (%)
Educational Attainment - Associate degree (%)
Educational Attainment - Bachelor's degree (%)
Educational Attainment - Master's degree (%)
Educational Attainment - Professional school degree (%)
Educational Attainment - Doctorate degree (%)
School Enrollment - Nursery, preschool (%)
School Enrollment - Kindergarten (%)
School Enrollment - Grade 1 to 4 (%)
School Enrollment - Grade 5 to 8 (%)
School Enrollment - Grade 9 to 12 (%)
School Enrollment - College undergrad (%)
School Enrollment - Graduate or professional (%)
School Enrollment - Not enrolled in school (%)
School enrollment - Public schools (%)
School enrollment - Private schools (%)
School enrollment - Not enrolled (%)
Median number of rooms in houses and condos
Median number of rooms in apartments
Housing units lacking complete plumbing facilities (%)
Housing units lacking complete kitchen facilities (%)
Density of houses
Urban houses (%)
Rural houses (%)
Households with people 60 years and over (%)
Households with people 65 years and over (%)
Households with people 75 years and over (%)
Households with one or more nonrelatives (%)
Households with no nonrelatives (%)
Population in households (%)
Family households (%)
Nonfamily households (%)
Population in families (%)
Family households with own children (%)
Median number of bedrooms in owner occupied houses
Mean number of bedrooms in owner occupied houses
Median number of bedrooms in renter occupied houses
Mean number of bedrooms in renter occupied houses
Median number of vehichles in owner occupied houses
Mean number of vehichles in owner occupied houses
Median number of vehichles in renter occupied houses
Mean number of vehichles in renter occupied houses
Mortgage status - with mortgage (%)
Mortgage status - with second mortgage (%)
Mortgage status - with home equity loan (%)
Mortgage status - with both second mortgage and home equity loan (%)
Mortgage status - without a mortgage (%)
Average family size
Average family size - White
Average family size - Black or African American
Average family size - Asian
Average family size - Hispanic or Latino
Average family size - American Indian and Alaska Native
Average family size - Multirace
Average family size - Other Race
Geographical mobility - Same house 1 year ago (%)
Geographical mobility - Moved within same county (%)
Geographical mobility - Moved from different county within same state (%)
Geographical mobility - Moved from different state (%)
Geographical mobility - Moved from abroad (%)
Place of birth - Born in state of residence (%)
Place of birth - Born in other state (%)
Place of birth - Native, outside of US (%)
Place of birth - Foreign born (%)
Housing units in structures - 1, detached (%)
Housing units in structures - 1, attached (%)
Housing units in structures - 2 (%)
Housing units in structures - 3 or 4 (%)
Housing units in structures - 5 to 9 (%)
Housing units in structures - 10 to 19 (%)
Housing units in structures - 20 to 49 (%)
Housing units in structures - 50 or more (%)
Housing units in structures - Mobile home (%)
Housing units in structures - Boat, RV, van, etc. (%)
House/condo owner moved in on average (years ago)
Renter moved in on average (years ago)
Year householder moved into unit - Moved in 1999 to March 2000 (%)
Year householder moved into unit - Moved in 1995 to 1998 (%)
Year householder moved into unit - Moved in 1990 to 1994 (%)
Year householder moved into unit - Moved in 1980 to 1989 (%)
Year householder moved into unit - Moved in 1970 to 1979 (%)
Year householder moved into unit - Moved in 1969 or earlier (%)
Means of transportation to work - Drove car alone (%)
Means of transportation to work - Carpooled (%)
Means of transportation to work - Public transportation (%)
Means of transportation to work - Bus or trolley bus (%)
Means of transportation to work - Streetcar or trolley car (%)
Means of transportation to work - Subway or elevated (%)
Means of transportation to work - Railroad (%)
Means of transportation to work - Ferryboat (%)
Means of transportation to work - Taxicab (%)
Means of transportation to work - Motorcycle (%)
Means of transportation to work - Bicycle (%)
Means of transportation to work - Walked (%)
Means of transportation to work - Other means (%)
Working at home (%)
Industry diversity
Most Common Industries - Agriculture, forestry, fishing and hunting, and mining (%)
Most Common Industries - Agriculture, forestry, fishing and hunting (%)
Most Common Industries - Mining, quarrying, and oil and gas extraction (%)
Most Common Industries - Construction (%)
Most Common Industries - Manufacturing (%)
Most Common Industries - Wholesale trade (%)
Most Common Industries - Retail trade (%)
Most Common Industries - Transportation and warehousing, and utilities (%)
Most Common Industries - Transportation and warehousing (%)
Most Common Industries - Utilities (%)
Most Common Industries - Information (%)
Most Common Industries - Finance and insurance, and real estate and rental and leasing (%)
Most Common Industries - Finance and insurance (%)
Most Common Industries - Real estate and rental and leasing (%)
Most Common Industries - Professional, scientific, and management, and administrative and waste management services (%)
Most Common Industries - Professional, scientific, and technical services (%)
Most Common Industries - Management of companies and enterprises (%)
Most Common Industries - Administrative and support and waste management services (%)
Most Common Industries - Educational services, and health care and social assistance (%)
Most Common Industries - Educational services (%)
Most Common Industries - Health care and social assistance (%)
Most Common Industries - Arts, entertainment, and recreation, and accommodation and food services (%)
Most Common Industries - Arts, entertainment, and recreation (%)
Most Common Industries - Accommodation and food services (%)
Most Common Industries - Other services, except public administration (%)
Most Common Industries - Public administration (%)
Occupation diversity
Most Common Occupations - Management, business, science, and arts occupations (%)
Most Common Occupations - Management, business, and financial occupations (%)
Most Common Occupations - Management occupations (%)
Most Common Occupations - Business and financial operations occupations (%)
Most Common Occupations - Computer, engineering, and science occupations (%)
Most Common Occupations - Computer and mathematical occupations (%)
Most Common Occupations - Architecture and engineering occupations (%)
Most Common Occupations - Life, physical, and social science occupations (%)
Most Common Occupations - Education, legal, community service, arts, and media occupations (%)
Most Common Occupations - Community and social service occupations (%)
Most Common Occupations - Legal occupations (%)
Most Common Occupations - Education, training, and library occupations (%)
Most Common Occupations - Arts, design, entertainment, sports, and media occupations (%)
Most Common Occupations - Healthcare practitioners and technical occupations (%)
Most Common Occupations - Health diagnosing and treating practitioners and other technical occupations (%)
Most Common Occupations - Health technologists and technicians (%)
Most Common Occupations - Service occupations (%)
Most Common Occupations - Healthcare support occupations (%)
Most Common Occupations - Protective service occupations (%)
Most Common Occupations - Fire fighting and prevention, and other protective service workers including supervisors (%)
Most Common Occupations - Law enforcement workers including supervisors (%)
Most Common Occupations - Food preparation and serving related occupations (%)
Most Common Occupations - Building and grounds cleaning and maintenance occupations (%)
Most Common Occupations - Personal care and service occupations (%)
Most Common Occupations - Sales and office occupations (%)
Most Common Occupations - Sales and related occupations (%)
Most Common Occupations - Office and administrative support occupations (%)
Most Common Occupations - Natural resources, construction, and maintenance occupations (%)
Most Common Occupations - Farming, fishing, and forestry occupations (%)
Most Common Occupations - Construction and extraction occupations (%)
Most Common Occupations - Installation, maintenance, and repair occupations (%)
Most Common Occupations - Production, transportation, and material moving occupations (%)
Most Common Occupations - Production occupations (%)
Most Common Occupations - Transportation occupations (%)
Most Common Occupations - Material moving occupations (%)
People in Group quarters - Institutionalized population (%)
People in Group quarters - Correctional institutions (%)
People in Group quarters - Federal prisons and detention centers (%)
People in Group quarters - Halfway houses (%)
People in Group quarters - Local jails and other confinement facilities (including police lockups) (%)
People in Group quarters - Military disciplinary barracks (%)
People in Group quarters - State prisons (%)
People in Group quarters - Other types of correctional institutions (%)
People in Group quarters - Nursing homes (%)
People in Group quarters - Hospitals/wards, hospices, and schools for the handicapped (%)
People in Group quarters - Hospitals/wards and hospices for chronically ill (%)
People in Group quarters - Hospices or homes for chronically ill (%)
People in Group quarters - Military hospitals or wards for chronically ill (%)
People in Group quarters - Other hospitals or wards for chronically ill (%)
People in Group quarters - Hospitals or wards for drug/alcohol abuse (%)
People in Group quarters - Mental (Psychiatric) hospitals or wards (%)
People in Group quarters - Schools, hospitals, or wards for the mentally retarded (%)
People in Group quarters - Schools, hospitals, or wards for the physically handicapped (%)
People in Group quarters - Institutions for the deaf (%)
People in Group quarters - Institutions for the blind (%)
People in Group quarters - Orthopedic wards and institutions for the physically handicapped (%)
People in Group quarters - Wards in general hospitals for patients who have no usual home elsewhere (%)
People in Group quarters - Wards in military hospitals for patients who have no usual home elsewhere (%)
People in Group quarters - Juvenile institutions (%)
People in Group quarters - Long-term care (%)
People in Group quarters - Homes for abused, dependent, and neglected children (%)
People in Group quarters - Residential treatment centers for emotionally disturbed children (%)
People in Group quarters - Training schools for juvenile delinquents (%)
People in Group quarters - Short-term care, detention or diagnostic centers for delinquent children (%)
People in Group quarters - Type of juvenile institution unknown (%)
People in Group quarters - Noninstitutionalized population (%)
People in Group quarters - College dormitories (includes college quarters off campus) (%)
People in Group quarters - Military quarters (%)
People in Group quarters - On base (%)
People in Group quarters - Barracks, unaccompanied personnel housing (UPH), (Enlisted/Officer), ;and similar group living quarters for military personnel (%)
People in Group quarters - Transient quarters for temporary residents (%)
People in Group quarters - Military ships (%)
People in Group quarters - Group homes (%)
People in Group quarters - Homes or halfway houses for drug/alcohol abuse (%)
People in Group quarters - Homes for the mentally ill (%)
People in Group quarters - Homes for the mentally retarded (%)
People in Group quarters - Homes for the physically handicapped (%)
People in Group quarters - Other group homes (%)
People in Group quarters - Religious group quarters (%)
People in Group quarters - Dormitories (%)
People in Group quarters - Agriculture workers' dormitories on farms (%)
People in Group quarters - Job Corps and vocational training facilities (%)
People in Group quarters - Other workers' dormitories (%)
People in Group quarters - Crews of maritime vessels (%)
People in Group quarters - Other nonhousehold living situations (%)
People in Group quarters - Other noninstitutional group quarters (%)
Residents speaking English at home (%)
Residents speaking English at home - Born in the United States (%)
Residents speaking English at home - Native, born elsewhere (%)
Residents speaking English at home - Foreign born (%)
Residents speaking Spanish at home (%)
Residents speaking Spanish at home - Born in the United States (%)
Residents speaking Spanish at home - Native, born elsewhere (%)
Residents speaking Spanish at home - Foreign born (%)
Residents speaking other language at home (%)
Residents speaking other language at home - Born in the United States (%)
Residents speaking other language at home - Native, born elsewhere (%)
Residents speaking other language at home - Foreign born (%)
Class of Workers - Employee of private company (%)
Class of Workers - Self-employed in own incorporated business (%)
Class of Workers - Private not-for-profit wage and salary workers (%)
Class of Workers - Local government workers (%)
Class of Workers - State government workers (%)
Class of Workers - Federal government workers (%)
Class of Workers - Self-employed workers in own not incorporated business and Unpaid family workers (%)
House heating fuel used in houses and condos - Utility gas (%)
House heating fuel used in houses and condos - Bottled, tank, or LP gas (%)
House heating fuel used in houses and condos - Electricity (%)
House heating fuel used in houses and condos - Fuel oil, kerosene, etc. (%)
House heating fuel used in houses and condos - Coal or coke (%)
House heating fuel used in houses and condos - Wood (%)
House heating fuel used in houses and condos - Solar energy (%)
House heating fuel used in houses and condos - Other fuel (%)
House heating fuel used in houses and condos - No fuel used (%)
House heating fuel used in apartments - Utility gas (%)
House heating fuel used in apartments - Bottled, tank, or LP gas (%)
House heating fuel used in apartments - Electricity (%)
House heating fuel used in apartments - Fuel oil, kerosene, etc. (%)
House heating fuel used in apartments - Coal or coke (%)
House heating fuel used in apartments - Wood (%)
House heating fuel used in apartments - Solar energy (%)
House heating fuel used in apartments - Other fuel (%)
House heating fuel used in apartments - No fuel used (%)
Armed forces status - In Armed Forces (%)
Armed forces status - Civilian (%)
Armed forces status - Civilian - Veteran (%)
Armed forces status - Civilian - Nonveteran (%)
Fatal accidents locations in years 2005-2021
Fatal accidents locations in 2005
Fatal accidents locations in 2006
Fatal accidents locations in 2007
Fatal accidents locations in 2008
Fatal accidents locations in 2009
Fatal accidents locations in 2010
Fatal accidents locations in 2011
Fatal accidents locations in 2012
Fatal accidents locations in 2013
Fatal accidents locations in 2014
Fatal accidents locations in 2015
Fatal accidents locations in 2016
Fatal accidents locations in 2017
Fatal accidents locations in 2018
Fatal accidents locations in 2019
Fatal accidents locations in 2020
Fatal accidents locations in 2021
Alcohol use - People drinking some alcohol every month (%)
Alcohol use - People not drinking at all (%)
Alcohol use - Average days/month drinking alcohol
Alcohol use - Average drinks/week
Alcohol use - Average days/year people drink much
Audiometry - Average condition of hearing (%)
Audiometry - People that can hear a whisper from across a quiet room (%)
Audiometry - People that can hear normal voice from across a quiet room (%)
Audiometry - Ears ringing, roaring, buzzing (%)
Audiometry - Had a job exposure to loud noise (%)
Audiometry - Had off-work exposure to loud noise (%)
Blood Pressure & Cholesterol - Has high blood pressure (%)
Blood Pressure & Cholesterol - Checking blood pressure at home (%)
Blood Pressure & Cholesterol - Frequently checking blood cholesterol (%)
Blood Pressure & Cholesterol - Has high cholesterol level (%)
Consumer Behavior - Money monthly spent on food at supermarket/grocery store
Consumer Behavior - Money monthly spent on food at other stores
Consumer Behavior - Money monthly spent on eating out
Consumer Behavior - Money monthly spent on carryout/delivered foods
Consumer Behavior - Income spent on food at supermarket/grocery store (%)
Consumer Behavior - Income spent on food at other stores (%)
Consumer Behavior - Income spent on eating out (%)
Consumer Behavior - Income spent on carryout/delivered foods (%)
Current Health Status - General health condition (%)
Current Health Status - Blood donors (%)
Current Health Status - Has blood ever tested for HIV virus (%)
Current Health Status - Left-handed people (%)
Dermatology - People using sunscreen (%)
Diabetes - Diabetics (%)
Diabetes - Had a blood test for high blood sugar (%)
Diabetes - People taking insulin (%)
Diet Behavior & Nutrition - Diet health (%)
Diet Behavior & Nutrition - Milk product consumption (# of products/month)
Diet Behavior & Nutrition - Meals not home prepared (#/week)
Diet Behavior & Nutrition - Meals from fast food or pizza place (#/week)
Diet Behavior & Nutrition - Ready-to-eat foods (#/month)
Diet Behavior & Nutrition - Frozen meals/pizza (#/month)
Drug Use - People that ever used marijuana or hashish (%)
Drug Use - Ever used hard drugs (%)
Drug Use - Ever used any form of cocaine (%)
Drug Use - Ever used heroin (%)
Drug Use - Ever used methamphetamine (%)
Health Insurance - People covered by health insurance (%)
Kidney Conditions-Urology - Avg. # of times urinating at night
Medical Conditions - People with asthma (%)
Medical Conditions - People with anemia (%)
Medical Conditions - People with psoriasis (%)
Medical Conditions - People with overweight (%)
Medical Conditions - Elderly people having difficulties in thinking or remembering (%)
Medical Conditions - People who ever received blood transfusion (%)
Medical Conditions - People having trouble seeing even with glass/contacts (%)
Medical Conditions - People with arthritis (%)
Medical Conditions - People with gout (%)
Medical Conditions - People with congestive heart failure (%)
Medical Conditions - People with coronary heart disease (%)
Medical Conditions - People with angina pectoris (%)
Medical Conditions - People who ever had heart attack (%)
Medical Conditions - People who ever had stroke (%)
Medical Conditions - People with emphysema (%)
Medical Conditions - People with thyroid problem (%)
Medical Conditions - People with chronic bronchitis (%)
Medical Conditions - People with any liver condition (%)
Medical Conditions - People who ever had cancer or malignancy (%)
Mental Health - People who have little interest in doing things (%)
Mental Health - People feeling down, depressed, or hopeless (%)
Mental Health - People who have trouble sleeping or sleeping too much (%)
Mental Health - People feeling tired or having little energy (%)
Mental Health - People with poor appetite or overeating (%)
Mental Health - People feeling bad about themself (%)
Mental Health - People who have trouble concentrating on things (%)
Mental Health - People moving or speaking slowly or too fast (%)
Mental Health - People having thoughts they would be better off dead (%)
Oral Health - Average years since last visit a dentist
Oral Health - People embarrassed because of mouth (%)
Oral Health - People with gum disease (%)
Oral Health - General health of teeth and gums (%)
Oral Health - Average days a week using dental floss/device
Oral Health - Average days a week using mouthwash for dental problem
Oral Health - Average number of teeth
Pesticide Use - Households using pesticides to control insects (%)
Pesticide Use - Households using pesticides to kill weeds (%)
Physical Activity - People doing vigorous-intensity work activities (%)
Physical Activity - People doing moderate-intensity work activities (%)
Physical Activity - People walking or bicycling (%)
Physical Activity - People doing vigorous-intensity recreational activities (%)
Physical Activity - People doing moderate-intensity recreational activities (%)
Physical Activity - Average hours a day doing sedentary activities
Physical Activity - Average hours a day watching TV or videos
Physical Activity - Average hours a day using computer
Physical Functioning - People having limitations keeping them from working (%)
Physical Functioning - People limited in amount of work they can do (%)
Physical Functioning - People that need special equipment to walk (%)
Physical Functioning - People experiencing confusion/memory problems (%)
Physical Functioning - People requiring special healthcare equipment (%)
Prescription Medications - Average number of prescription medicines taking
Preventive Aspirin Use - Adults 40+ taking low-dose aspirin (%)
Reproductive Health - Vaginal deliveries (%)
Reproductive Health - Cesarean deliveries (%)
Reproductive Health - Deliveries resulted in a live birth (%)
Reproductive Health - Pregnancies resulted in a delivery (%)
Reproductive Health - Women breastfeeding newborns (%)
Reproductive Health - Women that had a hysterectomy (%)
Reproductive Health - Women that had both ovaries removed (%)
Reproductive Health - Women that have ever taken birth control pills (%)
Reproductive Health - Women taking birth control pills (%)
Reproductive Health - Women that have ever used Depo-Provera or injectables (%)
Reproductive Health - Women that have ever used female hormones (%)
Sexual Behavior - People 18+ that ever had sex (vaginal, anal, or oral) (%)
Sexual Behavior - Males 18+ that ever had vaginal sex with a woman (%)
Sexual Behavior - Males 18+ that ever performed oral sex on a woman (%)
Sexual Behavior - Males 18+ that ever had anal sex with a woman (%)
Sexual Behavior - Males 18+ that ever had any sex with a man (%)
Sexual Behavior - Females 18+ that ever had vaginal sex with a man (%)
Sexual Behavior - Females 18+ that ever performed oral sex on a man (%)
Sexual Behavior - Females 18+ that ever had anal sex with a man (%)
Sexual Behavior - Females 18+ that ever had any kind of sex with a woman (%)
Sexual Behavior - Average age people first had sex
Sexual Behavior - Average number of female sex partners in lifetime (males 18+)
Sexual Behavior - Average number of female vaginal sex partners in lifetime (males 18+)
Sexual Behavior - Average age people first performed oral sex on a woman (18+)
Sexual Behavior - Average number of woman performed oral sex on in lifetime (18+)
Sexual Behavior - Average number of male sex partners in lifetime (males 18+)
Sexual Behavior - Average number of male anal sex partners in lifetime (males 18+)
Sexual Behavior - Average age people first performed oral sex on a man (18+)
Sexual Behavior - Average number of male oral sex partners in lifetime (18+)
Sexual Behavior - People using protection when performing oral sex (%)
Sexual Behavior - Average number of times people have vaginal or anal sex a year
Sexual Behavior - People having sex without condom (%)
Sexual Behavior - Average number of male sex partners in lifetime (females 18+)
Sexual Behavior - Average number of male vaginal sex partners in lifetime (females 18+)
Sexual Behavior - Average number of female sex partners in lifetime (females 18+)
Sexual Behavior - Circumcised males 18+ (%)
Sleep Disorders - Average hours sleeping at night
Sleep Disorders - People that has trouble sleeping (%)
Smoking-Cigarette Use - People smoking cigarettes (%)
Taste & Smell - People 40+ having problems with smell (%)
Taste & Smell - People 40+ having problems with taste (%)
Taste & Smell - People 40+ that ever had wisdom teeth removed (%)
Taste & Smell - People 40+ that ever had tonsils teeth removed (%)
Taste & Smell - People 40+ that ever had a loss of consciousness because of a head injury (%)
Taste & Smell - People 40+ that ever had a broken nose or other serious injury to face or skull (%)
Taste & Smell - People 40+ that ever had two or more sinus infections (%)
Weight - Average height (inches)
Weight - Average weight (pounds)
Weight - Average BMI
Weight - People that are obese (%)
Weight - People that ever were obese (%)
Weight - People trying to lose weight (%)
Urban population: 10,069
Rural population: 16,765
Estimated median house/condo value in 2022: $286,856
78621:
$286,856Texas:
$275,400
Median resident age: This zip code:
38.6 yearsTexas median age:
35.6 years
Average household size: This zip code:
2.9 peopleTexas:
2.6 people
Averages for the 2020 tax year for zip code 78621, filed in 2021:
Average Adjusted Gross Income (AGI) in 2020: $54,700 (Individual Income Tax Returns) Here:
$54,700State:
$77,054
Salary/wage: $48,815 (reported on 82.6% of returns )Here:
$48,815State:
$62,766
(% of AGI for various income ranges: 1282.3% for AGIs below $25k , 3776.0% for AGIs $25k-50k , 6799.2% for AGIs $50k-75k , 9619.0% for AGIs $75k-100k , 17616.5% for AGIs $100k-200k , 61021.2% for AGIs over 200k ) Taxable interest for individuals: $1,078 (reported on 19.0% of returns )This zip code:
$1,078Texas:
$2,665
(% of AGI for various income ranges: 8.2% for AGIs below $25k , 9.3% for AGIs $25k-50k , 27.4% for AGIs $50k-75k , 43.9% for AGIs $75k-100k , 83.6% for AGIs $100k-200k , 871.2% for AGIs over 200k ) Ordinary dividends: $4,032 (reported on 9.1% of returns )(% of AGI for various income ranges: 8.4% for AGIs below $25k , 16.3% for AGIs $25k-50k , 34.0% for AGIs $50k-75k , 44.5% for AGIs $75k-100k , 183.9% for AGIs $100k-200k , 2153.8% for AGIs over 200k ) Net capital gain/loss in AGI: +$24,093 (reported on 8.8% of returns )Here:
+$24,093State:
+$39,590
(% of AGI for various income ranges: 6.0% for AGIs below $25k , 12.1% for AGIs $25k-50k , 49.7% for AGIs $50k-75k , 127.0% for AGIs $75k-100k , 545.6% for AGIs $100k-200k , 26241.3% for AGIs over 200k ) Profit/loss from business: +$13,918 (reported on 20.5% of returns )Here:
+$13,918State:
+$10,888
(% of AGI for various income ranges: 260.1% for AGIs below $25k , 362.4% for AGIs $25k-50k , 378.9% for AGIs $50k-75k , 362.6% for AGIs $75k-100k , 662.9% for AGIs $100k-200k , 5155.0% for AGIs over 200k ) Taxable individual retirement arrangement distribution: $19,855 (reported on 4.3% of returns )78621:
$19,855Texas:
$24,740
(% of AGI for various income ranges: 23.9% for AGIs below $25k , 29.3% for AGIs $25k-50k , 78.2% for AGIs $50k-75k , 182.0% for AGIs $75k-100k , 570.5% for AGIs $100k-200k , 3108.8% for AGIs over 200k ) Total itemized deductions: $30,318 (reported on 4.7% of returns )Here:
$30,318State:
$40,428
(% of AGI for various income ranges: 45.8% for AGIs below $25k , 84.8% for AGIs $25k-50k , 172.8% for AGIs $50k-75k , 247.3% for AGIs $75k-100k , 631.2% for AGIs $100k-200k , 6258.8% for AGIs over 200k ) Charity contributions: $12,513 (reported on 3.5% of returns )Here:
$12,513State:
$18,201
(% of AGI for various income ranges: 2.7% for AGIs below $25k , 11.8% for AGIs $25k-50k , 25.6% for AGIs $50k-75k , 57.0% for AGIs $75k-100k , 186.3% for AGIs $100k-200k , 3646.2% for AGIs over 200k ) Taxes paid: $7,319 (reported on 4.4% of returns )(% of AGI for various income ranges: 9.2% for AGIs below $25k , 19.8% for AGIs $25k-50k , 43.8% for AGIs $50k-75k , 73.8% for AGIs $75k-100k , 166.0% for AGIs $100k-200k , 926.2% for AGIs over 200k ) Earned income credit: $2,529 (reported on 18.9% of returns )(% of AGI for various income ranges: 123.6% for AGIs below $25k , 80.1% for AGIs $25k-50k , 1.9% for AGIs $50k-75k ) Percentage of individuals using paid preparers for their 2020 taxes: 86.3%(% for various income ranges: 83.3% for AGIs below $25k , 86.4% for AGIs $25k-50k , 86.6% for AGIs $50k-75k , 88.7% for AGIs $75k-100k , 90.9% for AGIs $100k-200k , 92.6% for AGIs over 200k )
Averages for the 2012 tax year for zip code 78621, filed in 2013:
Average Adjusted Gross Income (AGI) in 2012: $46,622 (Individual Income Tax Returns) Here:
$46,622State:
$65,384
Salary/wage: $40,963 (reported on 86.0% of returns )Here:
$40,963State:
$52,524
(% of AGI for various income ranges: 77.1% for AGIs below $25k , 84.0% for AGIs $25k-50k , 81.0% for AGIs $50k-75k , 79.0% for AGIs $75k-100k , 77.3% for AGIs $100k-200k , 35.5% for AGIs over 200k ) Taxable interest for individuals: $1,009 (reported on 23.8% of returns )This zip code:
$1,009Texas:
$2,372
(% of AGI for various income ranges: 0.7% for AGIs below $25k , 0.5% for AGIs $25k-50k , 0.4% for AGIs $50k-75k , 0.5% for AGIs $75k-100k , 0.3% for AGIs $100k-200k , 1.0% for AGIs over 200k ) Ordinary dividends: $3,894 (reported on 10.6% of returns )(% of AGI for various income ranges: 0.6% for AGIs below $25k , 0.6% for AGIs $25k-50k , 0.6% for AGIs $50k-75k , 0.6% for AGIs $75k-100k , 0.7% for AGIs $100k-200k , 3.1% for AGIs over 200k ) Net capital gain/loss in AGI: +$10,901 (reported on 9.0% of returns )Here:
+$10,901State:
+$35,319
(% of AGI for various income ranges: 0.2% for AGIs below $25k , 0.2% for AGIs $25k-50k , 0.7% for AGIs $50k-75k , 0.8% for AGIs $75k-100k , 1.4% for AGIs $100k-200k , 14.4% for AGIs over 200k ) Profit/loss from business: +$11,934 (reported on 17.0% of returns )Here:
+$11,934State:
+$13,732
(% of AGI for various income ranges: 10.4% for AGIs below $25k , 4.0% for AGIs $25k-50k , 3.1% for AGIs $50k-75k , 2.7% for AGIs $75k-100k , 3.0% for AGIs $100k-200k , 6.9% for AGIs over 200k ) Taxable individual retirement arrangement distribution: $13,186 (reported on 6.1% of returns )78621:
$13,186Texas:
$19,511
(% of AGI for various income ranges: 1.5% for AGIs below $25k , 1.1% for AGIs $25k-50k , 1.2% for AGIs $50k-75k , 2.2% for AGIs $75k-100k , 2.8% for AGIs $100k-200k , 1.2% for AGIs over 200k ) Self-employment retirement plans: $17,500 (reported on 0.2% of returns )78621:
$17,500Texas:
$23,938
Total itemized deductions: $18,620 (21% of AGI, reported on 21.4% of returns )Here:
$18,620State:
$24,724
Here:
21.2% of AGIState:
15.9% of AGI
(% of AGI for various income ranges: 5.7% for AGIs below $25k , 8.7% for AGIs $25k-50k , 8.3% for AGIs $50k-75k , 9.5% for AGIs $75k-100k , 10.0% for AGIs $100k-200k , 7.3% for AGIs over 200k ) Charity contributions: $4,012 (reported on 14.8% of returns )(% of AGI for various income ranges: 0.4% for AGIs below $25k , 0.7% for AGIs $25k-50k , 1.2% for AGIs $50k-75k , 1.3% for AGIs $75k-100k , 1.8% for AGIs $100k-200k , 2.5% for AGIs over 200k ) Taxes paid: $5,271 (reported on 21.1% of returns )(% of AGI for various income ranges: 1.4% for AGIs below $25k , 1.8% for AGIs $25k-50k , 2.3% for AGIs $50k-75k , 2.8% for AGIs $75k-100k , 3.3% for AGIs $100k-200k , 2.3% for AGIs over 200k ) Earned income credit: $2,516 (reported on 23.2% of returns )(% of AGI for various income ranges: 8.3% for AGIs below $25k , 1.6% for AGIs $25k-50k ) Percentage of individuals using paid preparers for their 2012 taxes: 43.2%(% for various income ranges: 42.6% for AGIs below $25k , 39.9% for AGIs $25k-50k , 44.8% for AGIs $50k-75k , 44.9% for AGIs $75k-100k , 47.9% for AGIs $100k-200k , 81.8% for AGIs over 200k )
Averages for the 2004 tax year for zip code 78621, filed in 2005:
Average Adjusted Gross Income (AGI) in 2004: $39,544 (Individual Income Tax Returns) Here:
$39,544State:
$47,881
Salary/wage: $37,459 (reported on 87.4% of returns )Here:
$37,459State:
$41,947
(% of AGI for various income ranges: 120.6% for AGIs below $10k , 83.2% for AGIs $10k-25k , 87.0% for AGIs $25k-50k , 85.5% for AGIs $50k-75k , 83.9% for AGIs $75k-100k , 71.5% for AGIs over 100k ) Taxable interest for individuals: $1,091 (reported on 33.3% of returns )This zip code:
$1,091Texas:
$2,255
(% of AGI for various income ranges: 5.0% for AGIs below $10k , 1.2% for AGIs $10k-25k , 0.9% for AGIs $25k-50k , 0.5% for AGIs $50k-75k , 0.5% for AGIs $75k-100k , 1.3% for AGIs over 100k ) Taxable dividends: $2,058 (reported on 13.2% of returns )(% of AGI for various income ranges: 3.2% for AGIs below $10k , 0.5% for AGIs $10k-25k , 0.3% for AGIs $25k-50k , 0.4% for AGIs $50k-75k , 0.5% for AGIs $75k-100k , 1.5% for AGIs over 100k ) Net capital gain/loss: +$6,513 (reported on 12.5% of returns )Here:
+$6,513State:
+$16,110
(% of AGI for various income ranges: -1.5% for AGIs below $10k , 0.5% for AGIs $10k-25k , 0.3% for AGIs $25k-50k , 0.4% for AGIs $50k-75k , 1.1% for AGIs $75k-100k , 7.5% for AGIs over 100k ) Profit/loss from business: +$7,901 (reported on 16.6% of returns )Here:
+$7,901State:
+$11,013
(% of AGI for various income ranges: 2.8% for AGIs below $10k , 5.7% for AGIs $10k-25k , 3.0% for AGIs $25k-50k , 2.6% for AGIs $50k-75k , 3.0% for AGIs $75k-100k , 3.4% for AGIs over 100k ) IRA payment deduction: $3,008 (reported on 1.8% of returns )(% of AGI for various income ranges: 0.1% for AGIs $10k-25k , 0.2% for AGIs $25k-50k , 0.1% for AGIs $50k-75k , 0.1% for AGIs $75k-100k , 0.1% for AGIs over 100k ) Self-employed pension: $8,667 (reported on 0.3% of returns )Total itemized deductions: $16,396 (23% of AGI, reported on 24.8% of returns )Here:
$16,396State:
$19,631
Here:
23.4% of AGIState:
18.9% of AGI
(% of AGI for various income ranges: 13.1% for AGIs below $10k , 5.9% for AGIs $10k-25k , 9.1% for AGIs $25k-50k , 12.5% for AGIs $50k-75k , 11.5% for AGIs $75k-100k , 10.5% for AGIs over 100k ) Charity contributions deductions: $2,770 (4% of AGI, reported on 18.2% of returns )Here:
3.6% of AGIState:
4.2% of AGI
(% of AGI for various income ranges: 0.7% for AGIs below $10k , 0.5% for AGIs $10k-25k , 0.7% for AGIs $25k-50k , 1.4% for AGIs $50k-75k , 1.5% for AGIs $75k-100k , 2.1% for AGIs over 100k ) Total tax: $5,246 (reported on 71.5% of returns )(% of AGI for various income ranges: 3.9% for AGIs below $10k , 3.7% for AGIs $10k-25k , 6.2% for AGIs $25k-50k , 8.5% for AGIs $50k-75k , 10.5% for AGIs $75k-100k , 17.0% for AGIs over 100k ) Earned income credit: $1,901 (reported on 19.2% of returns )Percentage of individuals using paid preparers for their 2004 taxes: 53.1%(% for various income ranges: 51.0% for AGIs below $10k , 56.9% for AGIs $10k-25k , 52.0% for AGIs $25k-50k , 53.7% for AGIs $50k-75k , 45.1% for AGIs $75k-100k , 57.2% for AGIs over 100k )
Estimated median household income in 2022: This zip code:
$91,156Texas:
$72,284
Nearest zip codes: 78615 ,
78650 ,
78653 ,
78602 ,
76578 ,
76574 .
Webberville Zip Code Map
Percentage of family households: This zip code:
53.7%Texas:
50.5%
Percentage of households with unmarried partners: This zip code:
4.1%Texas:
48.7%
Likely homosexual households (counted as self-reported same-sex unmarried-partner households)
Lesbian couples: 0.7% of all households Gay men: 0.0% of all households
Household received Food Stamps/SNAP in the past 12 months: 474Household did not receive Food Stamps/SNAP in the past 12 months: 8,739
Women who had a birth in the past 12 months: 210 (86 now married , 121 unmarried) Women who did not have a birth in the past 12 months: 6,117 (3,095 now married , 3,009 unmarried)
Housing units in zip code 78621 with a mortgage: 4,371 (377
second mortgage , 143
home equity loan , 201
both second mortgage and home equity loan )
Houses without a mortgage: 374
Median monthly owner costs for units with a mortgage: $1,787
Median monthly owner costs for units without a mortgage: $692
Residents with income below the poverty level in 2022:
This zip code:
9.3%Whole state:
14.0%
Residents with income below 50% of the poverty level in 2022:
This zip code:
3.3%Whole state:
7.4%
Median number of rooms in houses and condos: Median number of rooms in apartments: Notable locations in this zip code not listed on our city pages
Click to draw/clear zip code borders Notable locations in zip code 78621: (A) , Elgin Volunteer Fire Department (B) , Bluebonnet Volunteer Fire Department 969 Station (C) , MetroCare Services Elgin Station (D) . Display/hide their locations on the map
Churches in zip code 78621 include: (A) , First Presbyterian Church (B) , Evangelical Free Church (C) , Church of Christ (D) , Winns Memorial Baptist Church (E) , Primera Iglesia Bautista Church (F) , Mount Moriah Baptist Church (G) , First Baptist Church (H) , Cornerstone Baptist Church (I) . Display/hide their locations on the map
Cemeteries: (1) , Schiller Cemetery (2) , Morgan Chapel Cemetery (3) , Mount Moriah Cemetery (4) , Speir Cemetery (5) , Lawhon Springs Cemetery (6) , Youngs Prairie Cemetery (7) . Display/hide their locations on the map
Reservoirs: (A) , Soil Conservation Service Site 12 Reservoir (B) . Display/hide their locations on the map
Streams, rivers, and creeks: (A) , Little Sandy Creek (B) , Elm Creek (C) , Dry Creek (D) , Coleman Branch (E) , Burlson Creek (F) , Houghton Branch (G) . Display/hide their locations on the map
Year house built (houses)
111 2020 or later1,424 2010 to 20192,510 2000 to 20091,554 1990 to 19991,476 1980 to 1989839 1970 to 1979461 1960 to 1969448 1950 to 1959255 1940 to 1949579 1939 or earlier
Zip code 78621 household income distribution in 2022 581 Less than $10,000287 $10,000 to $14,999137 $15,000 to $19,999170 $20,000 to $24,999382 $25,000 to $29,999352 $30,000 to $34,999124 $35,000 to $39,999152 $40,000 to $44,999254 $45,000 to $49,999698 $50,000 to $59,999621 $60,000 to $74,9991,684 $75,000 to $99,999971 $100,000 to $124,999865 $125,000 to $149,9991,168 $150,000 to $199,999778 $200,000 or moreEstimate of home value of owner-occupied houses/condos in 2022 in zip code 78621 164 Less than $10,0005 $10,000 to $14,99946 $15,000 to $19,99987 $20,000 to $24,99991 $25,000 to $29,999243 $30,000 to $34,9999 $40,000 to $49,99911 $50,000 to $59,999109 $60,000 to $69,99924 $70,000 to $79,99926 $80,000 to $89,999141 $90,000 to $99,999371 $100,000 to $124,999159 $125,000 to $149,999213 $150,000 to $174,999381 $175,000 to $199,9991,077 $200,000 to $249,999742 $250,000 to $299,9991,318 $300,000 to $399,999924 $400,000 to $499,9991,006 $500,000 to $749,99936 $750,000 to $999,999159 $1,000,000 to $1,499,99960 $1,500,000 to $1,999,99930 $2,000,000 or moreRent paid by renters in 2022 in zip code 78621 26 $100 to $14917 $200 to $24936 $300 to $34910 $350 to $39995 $400 to $44922 $450 to $49955 $500 to $5495 $550 to $599280 $600 to $64918 $650 to $69997 $700 to $74921 $750 to $799124 $800 to $899211 $900 to $999431 $1,000 to $1,249116 $1,250 to $1,499195 $1,500 to $1,99921 $2,000 to $2,49998 No cash rent
Median gross rent in 2022: $1,199.
Median price asked for vacant for-sale houses and condos in 2022: $244,068.
Estimated median house (or condo) value in 2022 for: White Non-Hispanic householders: $326,913Black or African American householders: $170,416American Indian or Alaska Native householders: $186,710Some other race householders: $195,537Two or more races householders: $287,874Hispanic or Latino householders: $210,474Estimated median house or condo value in 2022: $286,856
78621:
$286,856Texas:
$275,400
Lower value quartile - upper value quartile: $180,676 - $449,435
Mean price in 2022: Detached houses: $292,261Here:
$292,261State:
$369,058
Townhouses or other attached units: $126,174Here:
$126,174State:
$327,631
Mobile homes: $148,647Here:
$148,647State:
$124,413
Occupied boats, RVs, vans, etc.: $82,142Here:
$82,142State:
$73,921
Housing units in structures:
One, detached: 6,707One, attached: 184Two: 663 or 4: 3355 to 9: 8310 to 19: 2320 to 49: 3650 or more: 37Mobile homes: 2,235Boats, RVs, vans, etc.: 146Unemployment : 3.8%
Means of transportation to work in zip code 78621 71.8% 9,416 Drove a car alone11.4% 1,492 Carpooled0.3% 35 Walked0.6% 79 Other means16.5% 2,159 Worked at homeTravel time to work (commute) in zip code 78621 232 Less than 5 minutes555 5 to 9 minutes819 10 to 14 minutes648 15 to 19 minutes880 20 to 24 minutes373 25 to 29 minutes1,605 30 to 34 minutes451 35 to 39 minutes1,085 40 to 44 minutes2,465 45 to 59 minutes1,787 60 to 89 minutes122 90 or more minutes
Percentage of zip code residents living and working in this county: 50.7%
Household type by relationship:
Households: 26,835
Male householders: 4,369 (511 living alone ), Female householders: 4,880 (1,436 living alone )5,136 spouses (4,995 opposite-sex spouses ), 350 unmarried partners , (274 opposite-sex unmarried partners ), 8,652 children (8,020 natural , 165 adopted , 468 stepchildren ), 905 grandchildren , 256 brothers or sisters , 539 parents , 51 foster children , 623 other relatives , 782 non-relatives In group quarters: 206 (-1 institutionalized population )
Size of family households: 2,713 2-persons , 1,295 3-persons , 1,534 4-persons , 773 5-persons , 337 6-persons , 222 7-or-more-persons
Size of nonfamily households: 1,945 1-person , 327 2-persons , 57 3-persons
4,364 married couples with children. single-parent households (283 men , 1,294 women ).
65.5% of residents of 78621 zip code speak English at home. of residents speak Spanish at home (59% very well, 19% well, 14% not well, 8% not at all ).of residents speak other Indo-European language at home (92% very well, 1% well, 7% not well ).of residents speak Asian or Pacific Island language at home (46% very well, 44% well, 9% not well ).of residents speak other language at home (47% very well, 53% not well ).
Foreign born population: 4,399 (16.4%)
(36.1%
of them are naturalized citizens )
This zip code:
16.4%Whole state:
17.2%
74% Honduras 7% Guatemala 3% North Macedonia (Macedonia) 3% Barbados 2% El Salvador 2% France 1% Costa Rica 6% German 6% English 4% American 3% Irish 1% Czech 1% Italian 1% European
Year of entry for the foreign-born population
836 2010 or later 1,526 2000 to 2009 1,264 1990 to 1999 1,017 Before 1990
Facilities with environmental interests located in this zip code:
AQUA WSC (PUMP STATION RD in ELGIN, TX)
National Pollutant Discharge Elimination System NON-MAJOR (Tracking pollutant discharge elimination systems) - permit COMMUNITY WATER SYSTEM (SDWIS) - SDWIS-TX0110013 22942, WATER TREATMENT PLANT, SDWIS-TX0110013 22945, SDWIS-TX0110013 22952, SDWIS-TX0110013 22939, SDWIS-TX0110013 22902, SDWIS-TX0110013 22905, SDWIS-TX0110013 22918, SDWIS-TX0110013 22925, SDWIS-TX0110013 22934,
B T WASHINGTON MIDDLE (902 W 2ND ST in ELGIN, TX)
(National Center for Education Statistics) - STATE ID-011902041 Organizations: ELGIN ISD (SCHOOL DISTRICT)
AE JOHNSON & SONS INC (205 S MAIN in ELGIN, TX)
(Resource Conservation and Recovery Act (tracking hazardous waste)) Business NAICS classification: MACHINE TOOL (METAL FORMING TYPES) MANUFACTURING.Alternative names: A E JOHNSON & SONS
ACME BRICK CO ELGIN PLANT (1 MI N OF HWY 290 ON FM 696 in ELGIN, TX)
AIR MAJOR (AIRS/AFS) CRITERIA AND HAZARDOUS AIR POLLUTANT INVENTORY (Inventory of air pollution sources) TRI REPORTER (Tracking of toxic chemicals releasing facilities) Business SIC classification: BRICK AND STRUCTURAL CLAY TILE; WATER SUPPLYBusiness NAICS classification: BRICK AND STRUCTURAL CLAY TILE MANUFACTURING.Alternative names: ACME BRICK CO., ACME BRICK COMPANY (BUTLER), ACME BRICK CO. - ELGIN WWTP, ACME BRICK CO., ACME BRICK CO. ELGIN PLANT
Housing units lacking complete plumbing facilities: 3.2%
Housing units lacking complete kitchen facilities: 3.3%
67.3% Electricity 21.8% Utility gas 8.2% Bottled, tank, or LP gas 1.4% Wood 1.0% No fuel used
Population in 1990: 9,852. Population change in the 1990s: +6,447 (+65.4%).
Place of birth for U.S.-born residents:
This state: 17,332Northeast: 727Midwest: 1,203South: 1,304West: 1,387
57% of the 78621 zip code residents lived in the same house 5 years ago.
Out of people who lived in different houses, 41% lived in this county.
Out of people who lived in different counties, 50% lived in Texas.
88% of the 78621 zip code residents lived in the same house 1 year ago.
Out of people who lived in different houses, 36% moved from this county.
Out of people who lived in different houses, 63% moved from different county within same state.
Out of people who lived in different houses, 1% moved from different state.
Private vs. public school enrollment:
Students in private schools in grades 1 to 8 (elementary and middle school): 243
Students in private schools in grades 9 to 12 (high school): 92
Students in private undergraduate colleges: 121
Occupation by median earnings in the past 12 months ($)
87,223 Computer and mathematical occupations 82,519 Law enforcement workers including supervisors 81,982 Architecture and engineering occupations 79,628 Management occupations 70,501 Business and financial operations occupations 70,426 Transportation occupations
Companies with federal contracts located in this zip code:
CITY CAFE (19 NORTH MAIN in ELGIN, TX; small business) in 23 contracts from 2002 to 2006
Contracts for Condiments and Related Products, Food Services, Fuel Oils, Meat, Poultry, and Fish by ArmySigned by year: 2000: $0; 2001: $0; 2002: $18,909; 2003: $15,175; 2004: $15,030; 2005: $182,452; 2006: $7,464.
Biggest contracts: with Army for Condiments and Related Products. Signed on 2005-04-28. Completion date: 2005-05-21.
, same as above. Signed on 2005-03-01. Completion date: 2005-03-23.
, same as above. Signed on 2005-04-01. Completion date: 2005-04-10.
, same as above. Signed on 2005-01-11. Completion date: 2005-01-15.
HARKINS, JAY CO INC (1 MILE OFF 290 in ELGIN, TX; small business)
$17,500 with Army for Air Conditioning Equipment. Signed on 2003-05-21. Completion date: 2003-06-06.
MEYERS SAUSAGE CO , INC (600 S MAIN in ELGIN, TX; small business) in 6 contracts from 2004 to 2006
Contracts for Food Items For Resale, Non-Food Items For Resale by Defense Commissary AgencySigned by year: 2000: $0; 2001: $0; 2002: $0; 2003: $0; 2004: $3,587; 2005: $9,110; 2006: $3,291.
Biggest contracts: with Defense Commissary Agency for Food Items For Resale. Signed on 2005-04-01. Completion date: 2005-08-31.
, same as above. Signed on 2004-10-01. Completion date: 2005-02-28.
with Defense Commissary Agency for Non-Food Items For Resale. Signed on 2006-01-01. Completion date: 2006-03-31.
, same as above. Signed on 2005-10-01. Completion date: 2005-12-31.
Top industries in this zip code by the number of employees in 2005:
Accommodation and Food Services: Limited-Service Restaurants (50-99 employees: 1 establishment, 20-49 employees: 3 establishments, 10-19 employees: 3 establishments, 5-9 employees: 1 establishment, 1-4 employees: 2 establishments)Accommodation and Food Services: Full-Service Restaurants (20-49: 3, 10-19: 1, 5-9: 2, 1-4: 2)Construction: Oil and Gas Pipeline and Related Structures Construction (50-99: 1)Health Care and Social Assistance: Nursing Care Facilities (50-99: 1)Finance and Insurance: Commercial Banking (20-49: 1, 10-19: 1, 5-9: 2, 1-4: 1)Other Services (except Public Administration): Religious Organizations (10-19: 2, 5-9: 1, 1-4: 7)
People in group quarters in 2010:
108 people in nursing facilities/skilled-nursing facilities
44 people in other noninstitutional facilities
21 people in residential treatment centers for adults
13 people in workers' group living quarters and job corps centers
People in group quarters in 2000:
73 people in nursing homes
43 people in local jails and other confinement facilities (including police lockups)
18 people in other noninstitutional group quarters
Fatal accident statistics in 2014:
Fatal accident count: 3Vehicles involved in fatal accidents: 4Fatal accidents caused by drunken drivers: 2Fatalities: 3Persons involved in fatal accidents: 6Pedestrians involved in fatal accidents: 0
Fatal accident statistics in 2013:
Fatal accident count: 5Vehicles involved in fatal accidents: 8Fatal accidents caused by drunken drivers: 4Fatalities: 5Persons involved in fatal accidents: 10Pedestrians involved in fatal accidents: 0
Home Mortgage Disclosure Act Aggregated Statistics For Year 2009(Based on 1 full and 6 partial tracts) A) FHA, FSA/RHS & VA B) Conventional C) Refinancings D) Home Improvement Loans F) Non-occupant Loans on G) Loans On Manufactured Number Average Value Number Average Value Number Average Value Number Average Value Number Average Value Number Average Value
LOANS ORIGINATED 414 $141,402 182 $125,446 468 $138,782 44 $38,334 46 $101,529 37 $62,532 APPLICATIONS APPROVED, NOT ACCEPTED 25 $132,538 15 $98,375 67 $146,114 12 $44,316 5 $121,774 7 $75,119 APPLICATIONS DENIED 131 $126,493 46 $100,432 230 $143,200 65 $25,441 21 $104,816 20 $58,682 APPLICATIONS WITHDRAWN 61 $133,734 33 $131,295 159 $146,055 12 $52,836 10 $110,459 7 $54,706 FILES CLOSED FOR INCOMPLETENESS 8 $118,289 8 $90,114 33 $154,758 8 $89,814 3 $67,263 3 $83,847
Aggregated Statistics For Year 2008(Based on 1 full and 6 partial tracts) A) FHA, FSA/RHS & VA B) Conventional C) Refinancings D) Home Improvement Loans F) Non-occupant Loans on G) Loans On Manufactured Number Average Value Number Average Value Number Average Value Number Average Value Number Average Value Number Average Value
LOANS ORIGINATED 329 $140,662 340 $133,653 228 $136,679 60 $42,015 76 $102,591 43 $81,803 APPLICATIONS APPROVED, NOT ACCEPTED 28 $125,869 57 $127,882 43 $124,239 12 $48,743 8 $101,961 18 $90,490 APPLICATIONS DENIED 95 $129,295 94 $117,979 286 $139,181 118 $50,290 30 $108,965 46 $63,990 APPLICATIONS WITHDRAWN 54 $142,214 70 $124,892 120 $131,481 14 $65,504 20 $87,996 7 $61,660 FILES CLOSED FOR INCOMPLETENESS 8 $136,742 18 $111,209 28 $177,254 4 $36,500 8 $110,464 3 $90,670
Aggregated Statistics For Year 2007(Based on 1 full and 6 partial tracts) A) FHA, FSA/RHS & VA B) Conventional C) Refinancings D) Home Improvement Loans F) Non-occupant Loans on G) Loans On Manufactured Number Average Value Number Average Value Number Average Value Number Average Value Number Average Value Number Average Value
LOANS ORIGINATED 265 $140,727 774 $122,065 222 $129,453 72 $33,512 159 $117,628 52 $61,802 APPLICATIONS APPROVED, NOT ACCEPTED 14 $120,707 138 $104,226 50 $111,953 9 $47,921 38 $97,123 28 $55,910 APPLICATIONS DENIED 48 $131,374 199 $105,003 402 $125,166 121 $38,932 68 $92,630 68 $65,135 APPLICATIONS WITHDRAWN 57 $138,596 118 $142,323 198 $119,964 17 $57,279 34 $105,910 12 $92,663 FILES CLOSED FOR INCOMPLETENESS 2 $154,055 29 $115,601 44 $143,088 3 $24,243 6 $96,547 1 $180,510
Aggregated Statistics For Year 2006(Based on 1 full and 6 partial tracts) A) FHA, FSA/RHS & VA B) Conventional C) Refinancings D) Home Improvement Loans F) Non-occupant Loans on G) Loans On Manufactured Number Average Value Number Average Value Number Average Value Number Average Value Number Average Value Number Average Value
LOANS ORIGINATED 274 $133,631 1,229 $97,030 280 $119,276 64 $32,294 297 $86,110 49 $79,968 APPLICATIONS APPROVED, NOT ACCEPTED 10 $136,207 178 $88,913 55 $133,576 18 $26,059 36 $90,243 24 $53,975 APPLICATIONS DENIED 75 $124,828 272 $100,036 436 $114,051 156 $36,979 85 $96,874 84 $66,617 APPLICATIONS WITHDRAWN 80 $131,899 217 $106,465 266 $117,131 27 $66,080 45 $106,966 13 $88,672 FILES CLOSED FOR INCOMPLETENESS 6 $121,205 39 $92,112 61 $120,815 4 $59,052 8 $104,014 0 $0
Aggregated Statistics For Year 2005(Based on 1 full and 6 partial tracts) A) FHA, FSA/RHS & VA B) Conventional C) Refinancings D) Home Improvement Loans F) Non-occupant Loans on G) Loans On Manufactured Number Average Value Number Average Value Number Average Value Number Average Value Number Average Value Number Average Value
LOANS ORIGINATED 341 $123,790 1,101 $90,063 355 $113,127 72 $65,001 327 $80,746 69 $67,826 APPLICATIONS APPROVED, NOT ACCEPTED 14 $101,741 148 $74,792 72 $115,120 17 $42,908 24 $80,445 39 $57,535 APPLICATIONS DENIED 53 $119,993 285 $93,018 481 $105,512 102 $42,227 72 $91,496 95 $58,279 APPLICATIONS WITHDRAWN 40 $131,407 196 $93,755 259 $136,532 55 $160,535 67 $94,358 12 $79,215 FILES CLOSED FOR INCOMPLETENESS 3 $118,633 32 $139,265 87 $147,276 2 $55,250 8 $302,016 3 $47,453
Aggregated Statistics For Year 2004(Based on 1 full and 6 partial tracts) A) FHA, FSA/RHS & VA B) Conventional C) Refinancings D) Home Improvement Loans E) Loans on Dwellings For 5+ Families F) Non-occupant Loans on G) Loans On Manufactured Number Average Value Number Average Value Number Average Value Number Average Value Number Average Value Number Average Value Number Average Value
LOANS ORIGINATED 376 $119,331 655 $94,190 447 $113,150 50 $44,903 1 $627,280 133 $81,312 69 $60,959 APPLICATIONS APPROVED, NOT ACCEPTED 22 $125,820 124 $76,660 97 $109,566 8 $18,758 0 $0 21 $76,044 41 $60,230 APPLICATIONS DENIED 74 $120,557 226 $75,799 463 $105,623 89 $27,286 0 $0 42 $72,619 121 $56,662 APPLICATIONS WITHDRAWN 57 $121,405 98 $102,139 285 $112,691 15 $49,379 0 $0 16 $90,268 13 $78,613 FILES CLOSED FOR INCOMPLETENESS 4 $125,508 19 $108,452 83 $126,318 2 $68,980 0 $0 3 $142,627 1 $41,850
Aggregated Statistics For Year 2003(Based on 1 full and 6 partial tracts) A) FHA, FSA/RHS & VA B) Conventional C) Refinancings D) Home Improvement Loans F) Non-occupant Loans on Number Average Value Number Average Value Number Average Value Number Average Value Number Average Value
LOANS ORIGINATED 354 $121,916 428 $101,088 911 $116,251 44 $47,793 65 $93,888 APPLICATIONS APPROVED, NOT ACCEPTED 10 $120,063 54 $98,312 122 $110,562 16 $55,255 9 $120,676 APPLICATIONS DENIED 71 $124,868 160 $75,285 461 $99,465 58 $27,673 18 $99,271 APPLICATIONS WITHDRAWN 71 $128,997 76 $104,525 397 $103,698 5 $56,538 17 $76,728 FILES CLOSED FOR INCOMPLETENESS 15 $114,293 11 $121,978 44 $113,211 1 $60,000 1 $198,920
Aggregated Statistics For Year 2002(Based on 1 full and 4 partial tracts) A) FHA, FSA/RHS & VA B) Conventional C) Refinancings D) Home Improvement Loans E) Loans on Dwellings For 5+ Families F) Non-occupant Loans on Number Average Value Number Average Value Number Average Value Number Average Value Number Average Value Number Average Value
LOANS ORIGINATED 242 $117,687 210 $101,695 381 $110,322 63 $26,100 2 $191,000 33 $84,352 APPLICATIONS APPROVED, NOT ACCEPTED 15 $113,894 52 $79,420 81 $92,397 5 $42,662 0 $0 7 $122,920 APPLICATIONS DENIED 36 $117,299 114 $76,037 174 $86,963 66 $17,311 0 $0 19 $113,464 APPLICATIONS WITHDRAWN 50 $126,673 28 $111,215 201 $94,203 11 $16,000 0 $0 8 $104,054 FILES CLOSED FOR INCOMPLETENESS 4 $109,662 14 $74,061 21 $105,120 1 $9,700 0 $0 1 $41,850
Aggregated Statistics For Year 2001(Based on 1 full and 4 partial tracts) A) FHA, FSA/RHS & VA B) Conventional C) Refinancings D) Home Improvement Loans F) Non-occupant Loans on Number Average Value Number Average Value Number Average Value Number Average Value Number Average Value
LOANS ORIGINATED 157 $106,397 333 $102,531 321 $110,624 66 $35,097 40 $78,400 APPLICATIONS APPROVED, NOT ACCEPTED 9 $105,057 80 $70,834 60 $103,377 9 $40,090 9 $45,890 APPLICATIONS DENIED 11 $92,669 156 $59,518 134 $77,174 51 $12,902 12 $63,706 APPLICATIONS WITHDRAWN 12 $106,280 31 $100,091 120 $87,343 14 $19,392 4 $88,708 FILES CLOSED FOR INCOMPLETENESS 3 $100,150 3 $84,613 39 $87,004 0 $0 1 $75,000
Aggregated Statistics For Year 2000(Based on 1 full and 4 partial tracts) A) FHA, FSA/RHS & VA B) Conventional C) Refinancings D) Home Improvement Loans F) Non-occupant Loans on Number Average Value Number Average Value Number Average Value Number Average Value Number Average Value
LOANS ORIGINATED 155 $101,410 347 $90,134 110 $94,270 51 $21,407 40 $74,710 APPLICATIONS APPROVED, NOT ACCEPTED 17 $90,264 91 $58,825 28 $74,609 14 $25,609 6 $54,712 APPLICATIONS DENIED 28 $88,733 295 $55,090 75 $87,336 42 $13,667 20 $61,233 APPLICATIONS WITHDRAWN 18 $100,682 37 $105,839 28 $77,606 3 $22,737 1 $38,280 FILES CLOSED FOR INCOMPLETENESS 3 $149,577 14 $93,001 27 $123,253 1 $35,730 1 $176,000
Aggregated Statistics For Year 1999(Based on 1 full and 3 partial tracts) A) FHA, FSA/RHS & VA B) Conventional C) Refinancings D) Home Improvement Loans F) Non-occupant Loans on Number Average Value Number Average Value Number Average Value Number Average Value Number Average Value
LOANS ORIGINATED 86 $96,961 259 $78,602 122 $88,837 29 $27,386 32 $96,913 APPLICATIONS APPROVED, NOT ACCEPTED 4 $92,765 81 $58,510 38 $62,320 9 $25,629 11 $82,255 APPLICATIONS DENIED 9 $87,541 261 $51,983 63 $91,029 26 $13,960 22 $50,315 APPLICATIONS WITHDRAWN 15 $95,602 28 $70,202 39 $64,545 5 $23,254 3 $42,097 FILES CLOSED FOR INCOMPLETENESS 3 $90,273 5 $60,212 24 $65,189 1 $48,910 2 $21,000
Detailed HMDA statistics for the following Tracts:
0018.37
,
0022.06 ,
9501.00 ,
9502.00
Private Mortgage Insurance Companies Aggregated Statistics For Year 2009(Based on 1 full and 6 partial tracts) A) Conventional B) Refinancings C) Non-occupant Loans on Number Average Value Number Average Value Number Average Value
LOANS ORIGINATED 25 $184,819 26 $176,724 1 $261,890 APPLICATIONS APPROVED, NOT ACCEPTED 7 $177,273 11 $162,170 1 $132,020 APPLICATIONS DENIED 3 $122,427 4 $197,315 0 $0 APPLICATIONS WITHDRAWN 1 $184,020 4 $198,625 0 $0 FILES CLOSED FOR INCOMPLETENESS 2 $286,875 0 $0 0 $0
Aggregated Statistics For Year 2008(Based on 1 full and 6 partial tracts) A) Conventional B) Refinancings C) Non-occupant Loans on D) Loans On Manufactured Number Average Value Number Average Value Number Average Value Number Average Value
LOANS ORIGINATED 155 $160,290 22 $187,721 18 $110,796 1 $110,760 APPLICATIONS APPROVED, NOT ACCEPTED 52 $161,285 10 $172,146 8 $114,310 0 $0 APPLICATIONS DENIED 14 $147,634 0 $0 5 $155,438 0 $0 APPLICATIONS WITHDRAWN 4 $131,920 3 $234,813 3 $245,230 0 $0 FILES CLOSED FOR INCOMPLETENESS 3 $177,350 1 $118,240 0 $0 0 $0
Aggregated Statistics For Year 2007(Based on 1 full and 6 partial tracts) A) Conventional B) Refinancings C) Non-occupant Loans on D) Loans On Manufactured Number Average Value Number Average Value Number Average Value Number Average Value
LOANS ORIGINATED 239 $144,645 13 $168,445 34 $122,850 4 $84,755 APPLICATIONS APPROVED, NOT ACCEPTED 29 $174,715 4 $273,560 5 $278,024 0 $0 APPLICATIONS DENIED 5 $179,582 1 $55,120 1 $99,020 1 $43,890 APPLICATIONS WITHDRAWN 6 $146,975 1 $121,810 1 $173,800 0 $0 FILES CLOSED FOR INCOMPLETENESS 2 $113,925 1 $131,450 0 $0 0 $0
Aggregated Statistics For Year 2006(Based on 1 full and 6 partial tracts) A) Conventional B) Refinancings C) Non-occupant Loans on D) Loans On Manufactured Number Average Value Number Average Value Number Average Value Number Average Value
LOANS ORIGINATED 125 $136,105 17 $183,685 20 $120,907 1 $80,710 APPLICATIONS APPROVED, NOT ACCEPTED 13 $146,958 7 $143,277 4 $129,985 0 $0 APPLICATIONS DENIED 1 $213,500 2 $314,300 0 $0 0 $0 APPLICATIONS WITHDRAWN 8 $198,735 6 $187,502 1 $47,470 0 $0 FILES CLOSED FOR INCOMPLETENESS 0 $0 0 $0 0 $0 0 $0
Aggregated Statistics For Year 2005(Based on 1 full and 6 partial tracts) A) Conventional B) Refinancings C) Non-occupant Loans on D) Loans On Manufactured Number Average Value Number Average Value Number Average Value Number Average Value
LOANS ORIGINATED 110 $136,471 19 $143,883 30 $118,596 8 $85,142 APPLICATIONS APPROVED, NOT ACCEPTED 14 $122,579 7 $145,621 4 $111,610 0 $0 APPLICATIONS DENIED 3 $148,970 0 $0 2 $129,240 1 $86,770 APPLICATIONS WITHDRAWN 5 $105,404 1 $528,340 2 $129,810 1 $21,950 FILES CLOSED FOR INCOMPLETENESS 1 $40,830 1 $66,350 0 $0 1 $66,350
Aggregated Statistics For Year 2004(Based on 1 full and 6 partial tracts) A) Conventional B) Refinancings C) Non-occupant Loans on D) Loans On Manufactured Number Average Value Number Average Value Number Average Value Number Average Value
LOANS ORIGINATED 85 $123,982 28 $160,110 20 $98,564 3 $107,590 APPLICATIONS APPROVED, NOT ACCEPTED 13 $145,432 14 $157,757 4 $141,578 2 $113,575 APPLICATIONS DENIED 5 $102,120 1 $51,040 1 $55,120 0 $0 APPLICATIONS WITHDRAWN 6 $152,657 6 $253,108 1 $55,120 0 $0 FILES CLOSED FOR INCOMPLETENESS 1 $86,260 1 $189,730 1 $64,830 0 $0
Aggregated Statistics For Year 2003(Based on 1 full and 6 partial tracts) A) Conventional B) Refinancings C) Non-occupant Loans on Number Average Value Number Average Value Number Average Value
LOANS ORIGINATED 89 $131,173 96 $145,208 17 $146,602 APPLICATIONS APPROVED, NOT ACCEPTED 16 $150,632 39 $165,528 3 $123,047 APPLICATIONS DENIED 5 $98,274 2 $164,115 1 $180,000 APPLICATIONS WITHDRAWN 4 $153,778 9 $178,173 1 $116,880 FILES CLOSED FOR INCOMPLETENESS 1 $29,600 0 $0 0 $0
Aggregated Statistics For Year 2002(Based on 1 full and 4 partial tracts) A) Conventional B) Refinancings C) Non-occupant Loans on Number Average Value Number Average Value Number Average Value
LOANS ORIGINATED 48 $103,761 25 $136,958 8 $89,405 APPLICATIONS APPROVED, NOT ACCEPTED 10 $96,037 13 $175,761 0 $0 APPLICATIONS DENIED 0 $0 1 $47,470 0 $0 APPLICATIONS WITHDRAWN 9 $116,548 5 $190,324 2 $57,745 FILES CLOSED FOR INCOMPLETENESS 0 $0 0 $0 0 $0
Aggregated Statistics For Year 2001(Based on 1 full and 4 partial tracts) A) Conventional B) Refinancings C) Non-occupant Loans on Number Average Value Number Average Value Number Average Value
LOANS ORIGINATED 61 $113,136 23 $163,614 5 $57,496 APPLICATIONS APPROVED, NOT ACCEPTED 11 $154,476 14 $146,176 3 $68,667 APPLICATIONS DENIED 2 $119,435 1 $58,700 0 $0 APPLICATIONS WITHDRAWN 2 $82,175 2 $94,425 0 $0 FILES CLOSED FOR INCOMPLETENESS 0 $0 1 $91,000 0 $0
Aggregated Statistics For Year 2000(Based on 1 full and 4 partial tracts) A) Conventional B) Refinancings C) Non-occupant Loans on Number Average Value Number Average Value Number Average Value
LOANS ORIGINATED 78 $109,349 14 $128,842 8 $77,791 APPLICATIONS APPROVED, NOT ACCEPTED 13 $95,728 8 $111,094 1 $46,000 APPLICATIONS DENIED 7 $111,850 2 $129,080 2 $79,000 APPLICATIONS WITHDRAWN 2 $65,015 1 $123,280 2 $34,645 FILES CLOSED FOR INCOMPLETENESS 4 $98,940 3 $163,667 1 $264,170
Aggregated Statistics For Year 1999(Based on 1 full and 3 partial tracts) A) Conventional B) Refinancings C) Non-occupant Loans on Number Average Value Number Average Value Number Average Value
LOANS ORIGINATED 48 $101,507 9 $123,703 4 $59,068 APPLICATIONS APPROVED, NOT ACCEPTED 6 $126,803 4 $141,635 0 $0 APPLICATIONS DENIED 3 $100,937 0 $0 0 $0 APPLICATIONS WITHDRAWN 1 $58,000 2 $92,625 1 $58,000 FILES CLOSED FOR INCOMPLETENESS 0 $0 0 $0 0 $0
Detailed PMIC statistics for the following Tracts:
0018.37
,
0022.06 ,
9501.00 ,
9502.00
2002 - 2018 National Fire Incident Reporting System (NFIRS) incidents See full 2006 National Fire Incident Reporting System statistics for zip code 78621, Texas
Most common first names in zip code 78621 among deceased individuals Name Count Lived (average)
Mary 59 80.2 years John 59 77.7 years William 54 75.3 years James 46 73.2 years Willie 32 78.4 years George 31 74.1 years Charles 31 73.3 years Robert 29 69.5 years Annie 28 84.6 years Ruth 23 79.2 years
Most common last names in zip code 78621 among deceased individuals Last name Count Lived (average)
Smith 42 76.9 years Johnson 32 79.0 years Jones 32 78.9 years Wilson 31 74.2 years Carter 24 79.9 years Scott 23 78.1 years Davis 21 77.8 years Moore 20 76.7 years Brown 20 78.3 years Lundgren 20 77.5 years
Businesses in zip code 78621
Name Count Name Count
AT&T 1 Long John Silver's 1 AutoZone 1 McDonald's 1 Chevrolet 1 Nike 1 Cricket Wireless 1 Pizza Hut 1 Curves 1 RadioShack 1 FedEx 2 SONIC Drive-In 1 H&R Block 1 Subway 1 Holiday Inn 1 True Value 1 KFC 1 U-Haul 2 Little Caesars Pizza 1 UPS 1


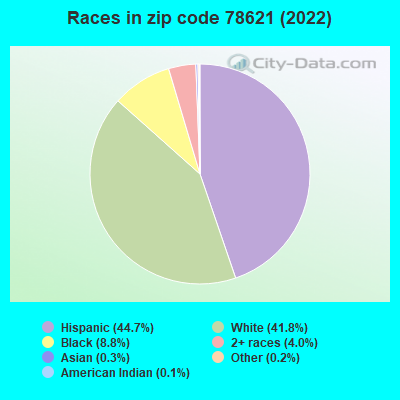


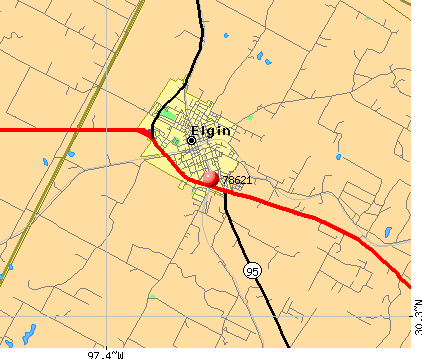 Nearest zip codes: 78615, 78650, 78653, 78602, 76578, 76574.
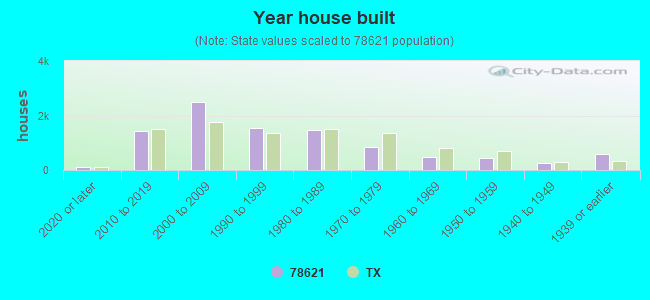

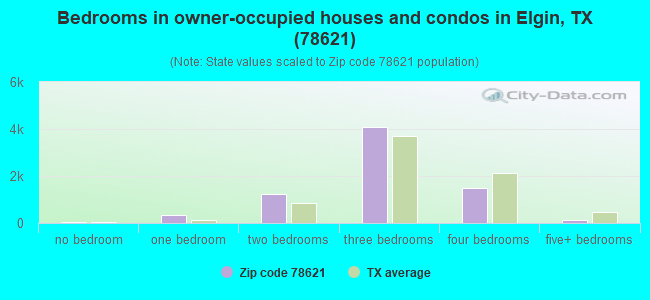

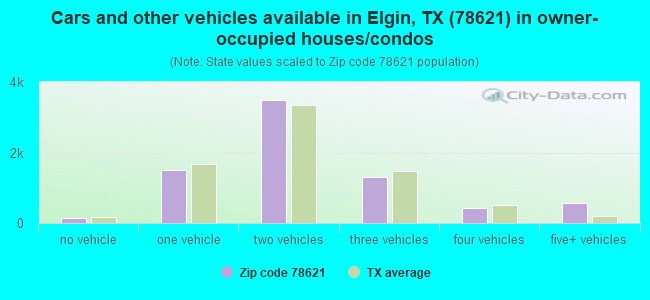
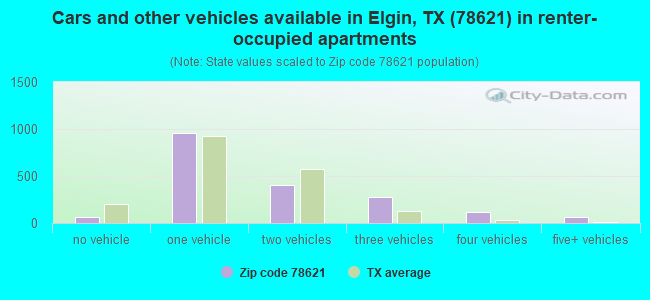


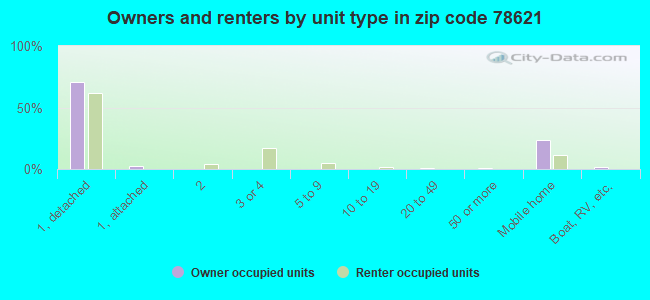
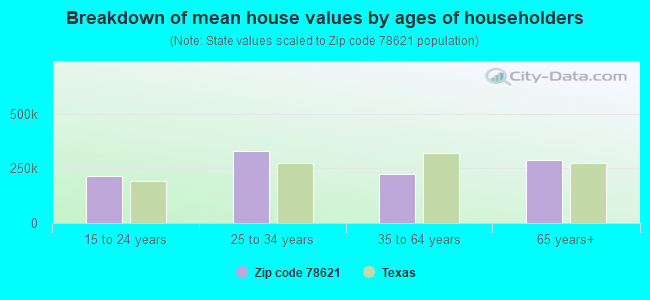


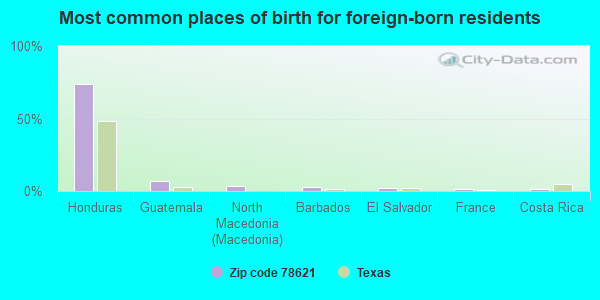
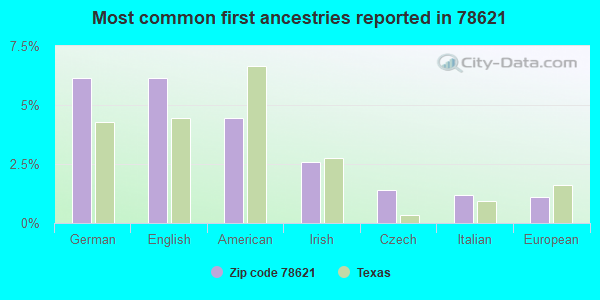
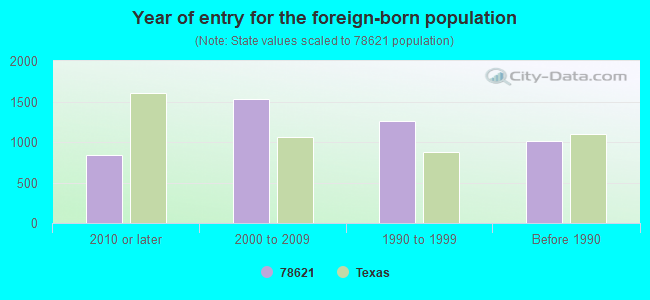


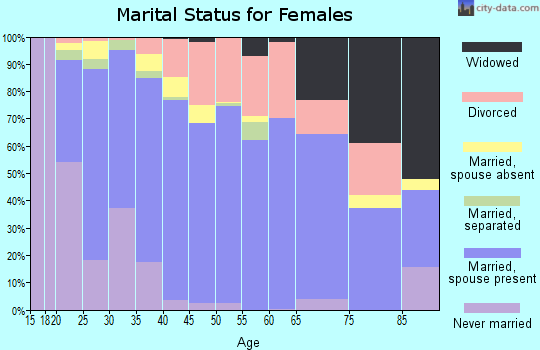
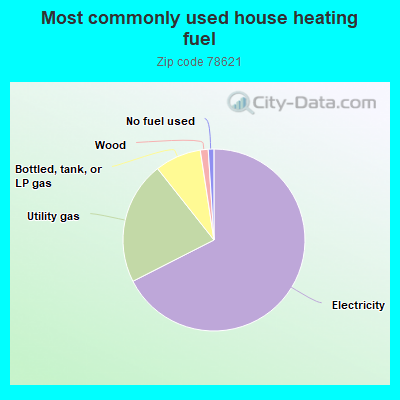
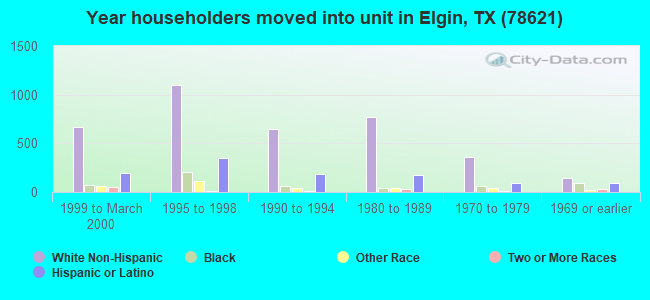
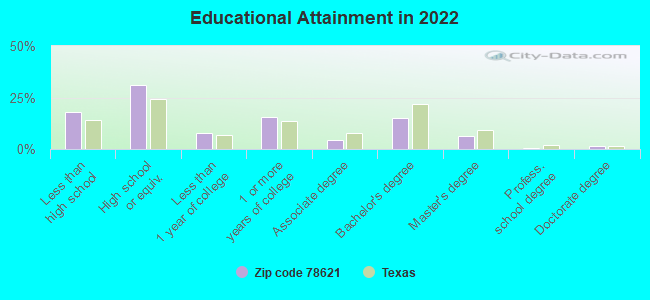
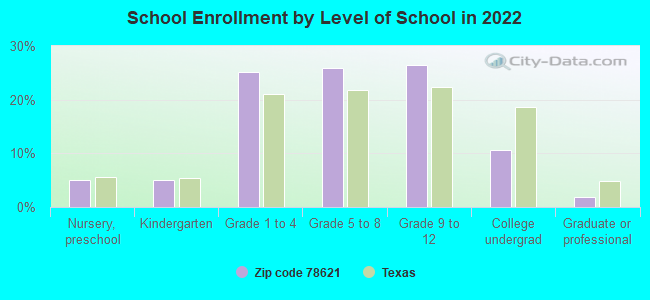
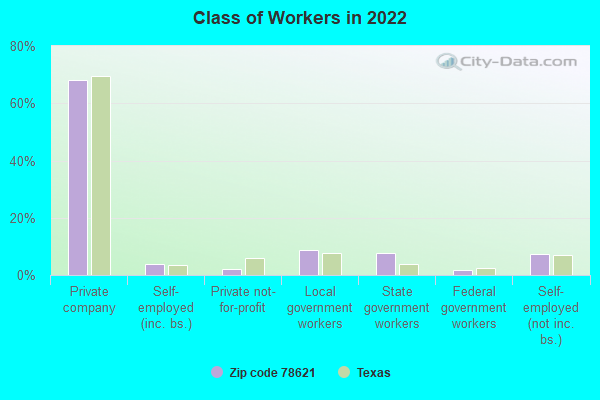
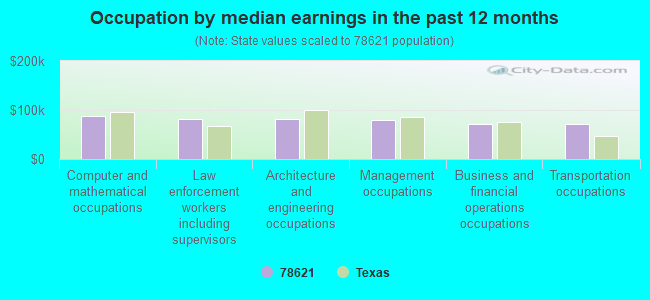
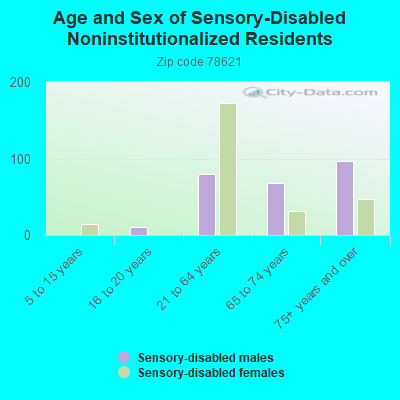
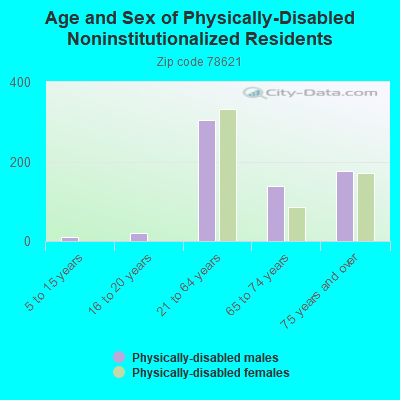
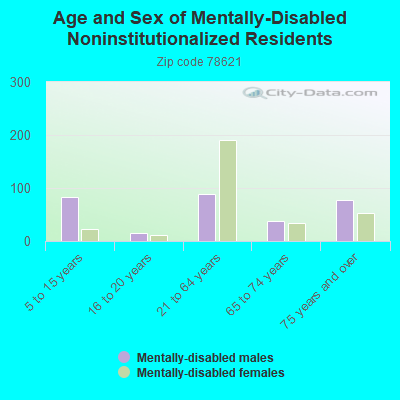
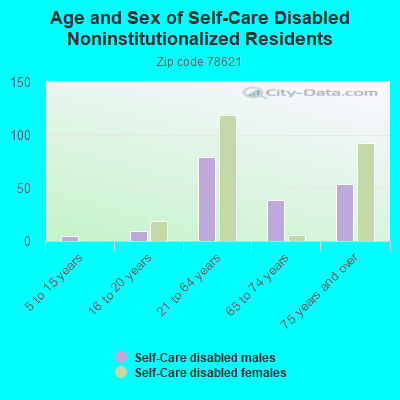
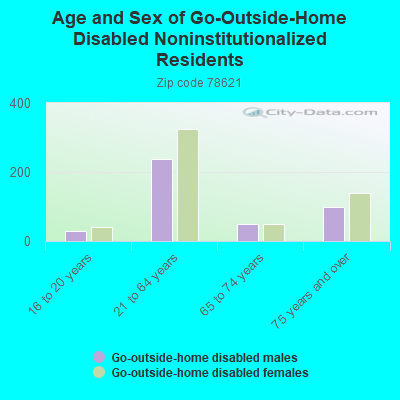
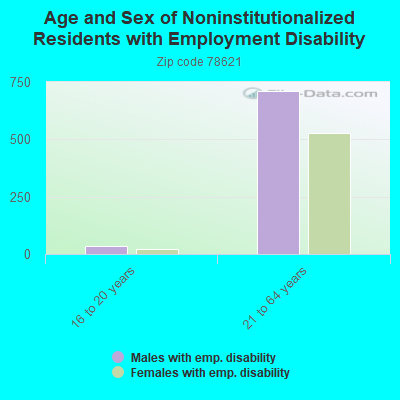
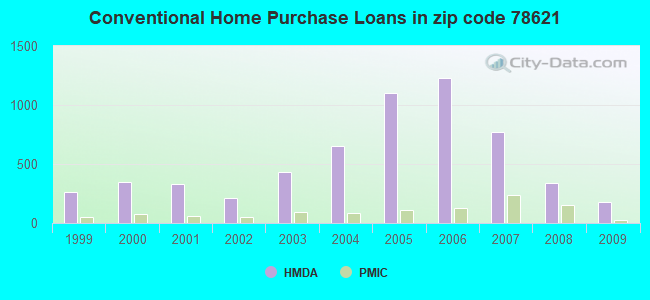
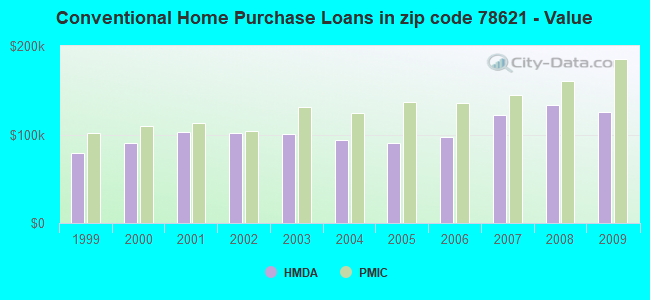
 Based on the data from the years 2002 - 2018 the average number of fires per year is 27. The highest number of fires - 98 took place in 2005, and the least - 1 in 2010. The data has a rising trend.
 When looking into fire subcategories, the most reports belonged to: Outside Fires (60.0%), and Structure Fires (21.1%).