Lee County, Texas (TX)
County owner-occupied free and clear houses and condos in 2010: 2,558
County owner-occupied houses and condos in 2000: 4,498
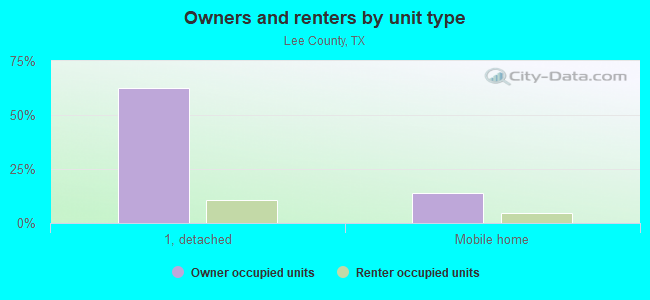
Renter-occupied apartments: 1,341 (it was 1,165 in 2000)
| % of renters here: | 21% |
| State: | 36% |
Land area: 629 sq. mi.
Water area: 5.5 sq. mi.
Population density: 29 people per square mile (low).
Industries providing employment: Educational, health and social services (17.0%), Construction (16.4%), Retail trade (11.1%), Transportation and warehousing,and utilities (10.9%).
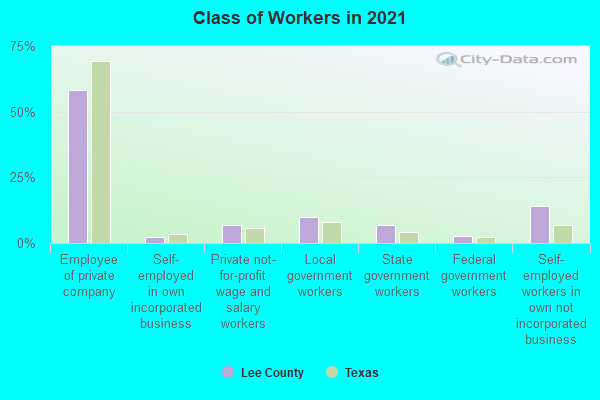
Type of workers:
- Private wage or salary: 71%
- Government: 20%
- Self-employed, not incorporated: 9%
- Unpaid family work: 0%
- OSM Map
- General Map
- Google Map
- MSN Map

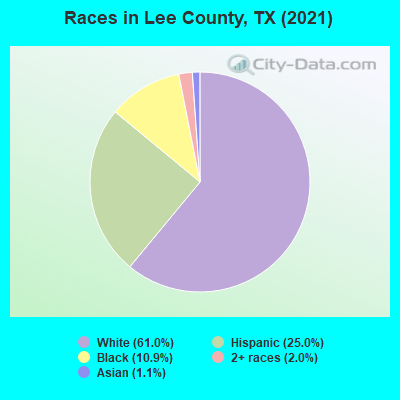
- 10,82360.8%White Non-Hispanic Alone
- 4,49725.3%Hispanic or Latino
- 1,86310.5%Black Non-Hispanic Alone
- 5102.9%Two or more races
- 720.4%Asian alone
- 270.2%American Indian and Alaska Native alone
| Median resident age: | 42.4 years |
| Texas median age: | 35.6 years |
| Males: 8,899 | |
| Females: 9,115 |


| Lee County: | 2.0 people |
| Texas: | 3 people |
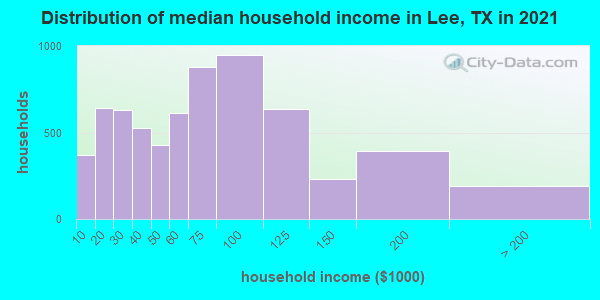
Estimated median household income in 2022: $65,764 ($36,280 in 1999)
| This county: | $65,764 |
| Texas: | $72,284 |
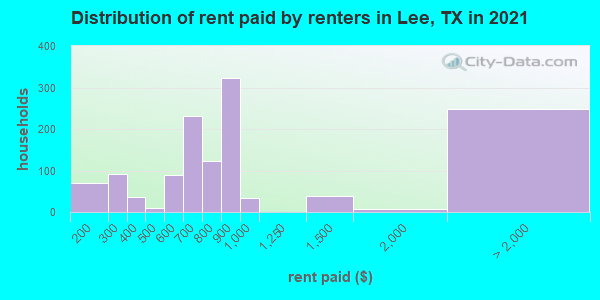
Median contract rent in 2022 for apartments: $797 (lower quartile is $537, upper quartile is $981)
| This county: | $797 |
| State: | $1117 |
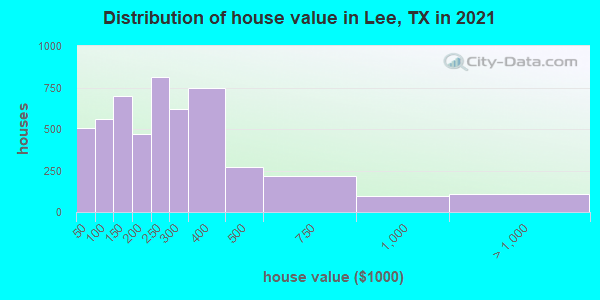
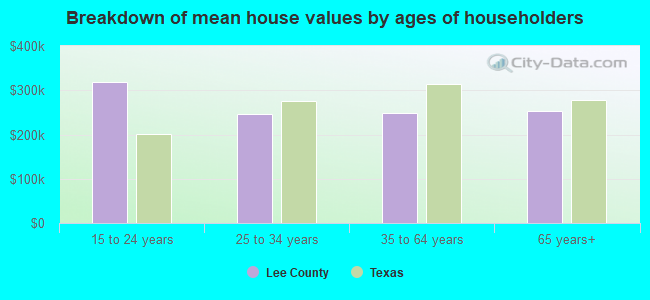
Estimated median house or condo value in 2022: $240,801 (it was $70,900 in 2000)
| Lee: | $240,801 |
| Texas: | $275,400 |
Median monthly housing costs for homes and condos with a mortgage: $1,696
Median monthly housing costs for units without a mortgage: $515
Institutionalized population: 492
Crime in 2021 (reported by the sheriff's office or county police, not the county total):
- Murders: 1
- Rapes: 6
- Robberies: 2
- Assaults: 11
- Burglaries: 32
- Thefts: 58
- Auto thefts: 13
Crime in 2020 (reported by the sheriff's office or county police, not the county total):
- Murders: 0
- Rapes: 5
- Robberies: 0
- Assaults: 9
- Burglaries: 35
- Thefts: 38
- Auto thefts: 12
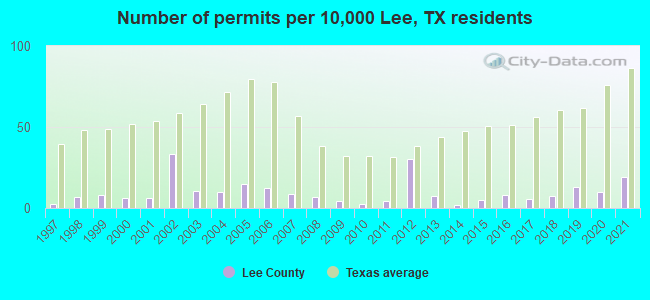
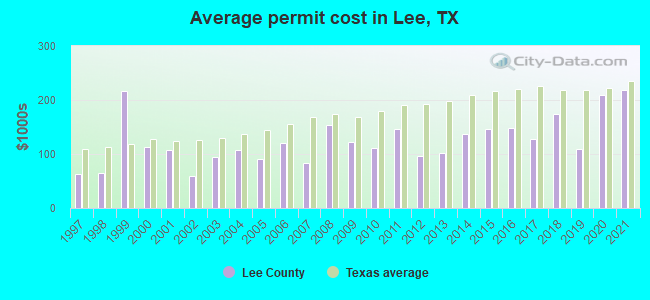
Single-family new house construction building permits:
- 2022: 37 buildings, average cost: $240,800
- 2021: 30 buildings, average cost: $217,500
- 2020: 15 buildings, average cost: $209,100
- 2019: 20 buildings, average cost: $109,000
- 2018: 12 buildings, average cost: $175,000
- 2017: 9 buildings, average cost: $128,400
- 2016: 13 buildings, average cost: $149,100
- 2015: 8 buildings, average cost: $146,100
- 2014: 3 buildings, average cost: $136,700
- 2013: 12 buildings, average cost: $101,000
- 2012: 47 buildings, average cost: $96,100
- 2011: 7 buildings, average cost: $147,300
- 2010: 4 buildings, average cost: $111,300
- 2009: 7 buildings, average cost: $122,800
- 2008: 11 buildings, average cost: $152,900
- 2007: 14 buildings, average cost: $83,600
- 2006: 19 buildings, average cost: $120,900
- 2005: 23 buildings, average cost: $89,900
- 2004: 15 buildings, average cost: $108,000
- 2003: 16 buildings, average cost: $95,400
- 2002: 52 buildings, average cost: $58,700
- 2001: 10 buildings, average cost: $106,700
- 2000: 10 buildings, average cost: $112,700
- 1999: 13 buildings, average cost: $217,000
- 1998: 11 buildings, average cost: $63,900
- 1997: 4 buildings, average cost: $63,200
Median real estate property taxes paid for housing units with mortgages in 2022: $3,002 (1.0%)
Median real estate property taxes paid for housing units with no mortgage in 2022: $1,593 (1.0%)
| Lee County: | 13.2% |
| Texas: | 14.0% |
Median age of residents in 2022: 42.4 years old
(Males: 42.5 years old, Females: 42.4 years old)
(Median age for: White residents: 49.5 years old, Black residents: 41.9 years old, American Indian residents: 24.4 years old, Asian residents: 21.3 years old, Hispanic or Latino residents: 28.9 years old, Other race residents: 24.7 years old)
Fair market rent in 2006 for a 1-bedroom apartment in Lee County is $441 a month.
Fair market rent for a 2-bedroom apartment is $489 a month.
Fair market rent for a 3-bedroom apartment is $669 a month.
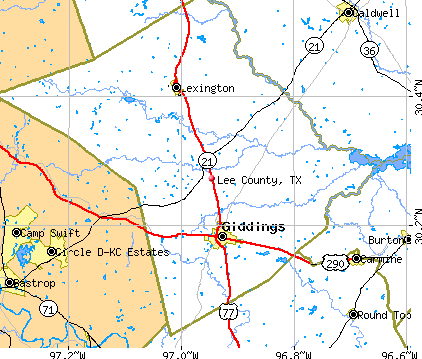
Cities in this county include: Giddings, Lincoln-Dime Box, Lexington.
Notable locations in this county outside city limits:
Notable locations in Lee County: Thicket Siding (A), Seth (B), Lost Dog Cabin (C), Taylor Camp (D), The Forks (E), Camp Matigwa (F), Batson Volunteer Fire Department (G), Saratoga Volunteer Fire Department (H), Hardin County Justice of the Peace 5 (I), Wildwood Heritage Society Museum (J), Big Thicket Museum (K), Kountze Volunteer Fire Department Station 3 (L), Kountze Volunteer Fire Department Station 2 (M), Pine Ridge Volunteer Fire Department (N), Votaw - Thicket Volunteer Fire Department (O), Texas Forest Service Kountze Office (P). Display/hide their locations on the map
Churches in Lee County include: Batson Prairie Baptist Church (A), Woodcrest Church (B), All Faith Tabernacle (C), Anchor Church (D), Providence Church (E), Cunningham Chapel (F), Good Shepherd Church (G), Little Rock Church (H), First Baptist Church of Loeb (I). Display/hide their locations on the map
Cemeteries: Loeb Cemetery (1), William W. Hart Cemetery (2), McNeely Cemetery (3), Grayburg Cemetery (4), Olive Cemetery (5), Hooks Cravey Cemetery (6), Holland Cemetery (7). Display/hide their locations on the map
Lakes, reservoirs, and swamps: Alligator Lake (A), Willard Lake (B), Ward Lake (C), Black Creek Lake (D), Twin Lakes (E), Jinks Pond (F), Fish Lake (G), Gore Lake (H). Display/hide their locations on the map
Streams, rivers, and creeks: Beech Creek (A), Beaver Creek (B), Beaumont Creek (C), Yearling Tick Branch (D), Walton Creek (E), Union Well Creek (F), Six-Ten Slough (G), Shinglemill Slough (H), Bad Luck Creek (I). Display/hide their locations on the map
Parks in Lee County include: Village Creek State Park (1), Big Thicket National Preserve (2). Display/hide their locations on the map
Neighboring counties: Clay County, Florida  , Camden County, Georgia , Iberville Parish, Louisiana , Jasper County , Seminole County, Georgia , Waller County
  .
.
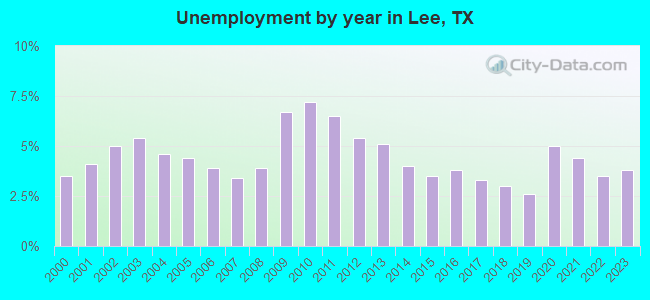
| Here: | 3.3% |
| Texas: | 3.5% |
Current college students: 323
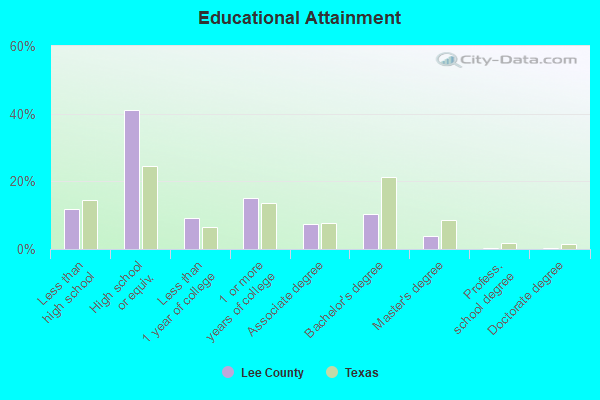
People 25 years of age or older with a high school degree or higher: 86.5%
People 25 years of age or older with a bachelor's degree or higher: 16.6%
Number of foreign born residents: 1,265 (47.4% naturalized citizens)
| Lee County: | 7.0% |
| Whole state: | 17.2% |
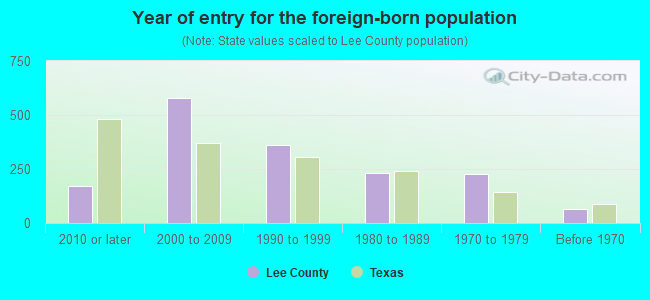
- Year of entry for the foreign-born population
- 1912010 or later
- 2922000 to 2009
- 3931990 to 1999
- 2301980 to 1989
- 2251970 to 1979
- 66Before 1970
Mean travel time to work (commute): minutes
Percentage of county residents living and working in this county: 99.2%
Housing units in structures:
- One, detached: 5,661
- One, attached: 81
- Two: 59
- 3 or 4: 189
- 5 to 9: 53
- 10 to 19: 28
- 20 to 49: 128
- 50 or more: 10
- Mobile homes: 1,768
- Boats, RVs, vans, etc.: 158
Housing units in Lee County with a mortgage: 2,250 (56 second mortgage, 0 home equity loan, 57 both second mortgage and home equity loan)
Houses without a mortgage: 46
| Here: | 4.2% with mortgage |
| State: | 98.4% with mortgage |
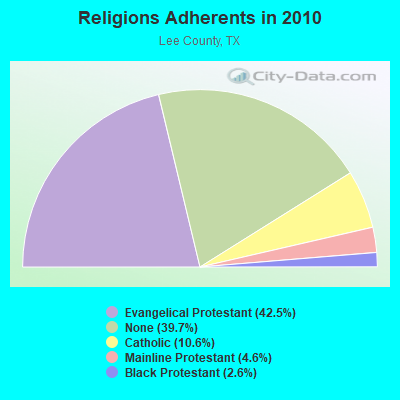
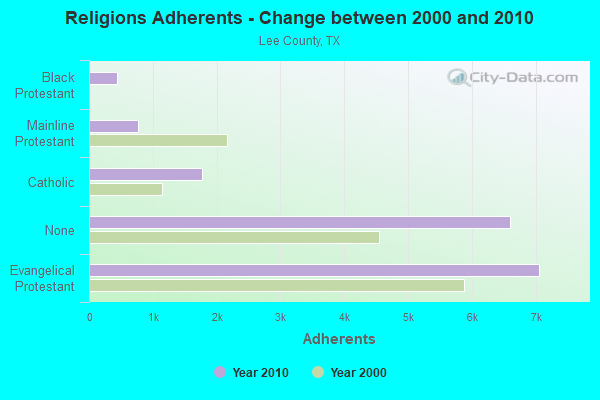
Religion statistics for Lee County
| Religion | Adherents | Congregations |
|---|---|---|
| Evangelical Protestant | 7,058 | 24 |
| Catholic | 1,764 | 3 |
| Mainline Protestant | 766 | 5 |
| Black Protestant | 432 | 3 |
| Other | 1 | - |
| None | 6,591 | - |
Source: Clifford Grammich, Kirk Hadaway, Richard Houseal, Dale E.Jones, Alexei Krindatch, Richie Stanley and Richard H.Taylor. 2012. 2010 U.S.Religion Census: Religious Congregations & Membership Study. Association of Statisticians of American Religious Bodies. Jones, Dale E., et al. 2002. Congregations and Membership in the United States 2000. Nashville, TN: Glenmary Research Center.
Food Environment Statistics:
| Lee County: | 3.07 / 10,000 pop. |
| State: | 1.47 / 10,000 pop. |
| This county: | 1.23 / 10,000 pop. |
| Texas: | 1.11 / 10,000 pop. |
| Lee County: | 9.21 / 10,000 pop. |
| Texas: | 3.95 / 10,000 pop. |
| This county: | 7.37 / 10,000 pop. |
| State: | 6.13 / 10,000 pop. |
| Lee County: | 10.2% |
| Texas: | 8.9% |
| Lee County: | 26.2% |
| State: | 26.6% |
| Here: | 16.0% |
| State: | 15.7% |
Agriculture in Lee County:
Average size of farms: 198 acresAverage value of agricultural products sold per farm: $12,417
Average value of crops sold per acre for harvested cropland: $124.51
The value of livestock, poultry, and their products as a percentage of the total market value of agricultural products sold: 81.39%
Average total farm production expenses per farm: $15,356
Harvested cropland as a percentage of land in farms: 9.36%
Irrigated harvested cropland as a percentage of land in farms: 3.39%
Average market value of all machinery and equipment per farm: $23,006
The percentage of farms operated by a family or individual: 93.94%
Average age of principal farm operators: 58 years
Average number of cattle and calves per 100 acres of all land in farms: 25.00
Corn for grain: 2129 harvested acres
All wheat for grain: 223 harvested acres
Vegetables: 112 harvested acres
Land in orchards: 844 acres
Tornado activity:
Lee County historical area-adjusted tornado activity is significantly below Texas state average. It is 3304889.3 times below overall U.S. average.Tornadoes in this county have caused one fatality and 4 injuries recorded between 1950 and 2004.
On 11/23/2004, a category 2 (max. wind speeds 113-157 mph) tornado killed one person and caused $600,000 in damages.
Earthquake activity:
Lee County-area historical earthquake activity is significantly above Texas state average. It is 23% smaller than the overall U.S. average.On 10/20/2011 at 12:24:41, a magnitude 4.8 (4.8 MW, Depth: 3.1 mi, Class: Light, Intensity: IV - V) earthquake occurred 118.8 miles away from Lee County center
On 5/17/2012 at 08:12:00, a magnitude 4.8 (4.8 MW, Depth: 3.1 mi) earthquake occurred 190.8 miles away from the county center
On 6/16/1978 at 11:46:54, a magnitude 5.3 (4.4 MB, 4.6 UK, 5.3 ML, Class: Moderate, Intensity: VI - VII) earthquake occurred 294.8 miles away from the county center
On 4/14/1995 at 00:32:56, a magnitude 5.7 (5.6 MB, 5.7 MS, 5.7 MW, Depth: 11.1 mi) earthquake occurred 383.4 miles away from the county center
On 4/9/1993 at 12:29:19, a magnitude 4.3 (4.1 MB, 4.3 LG, Depth: 3.1 mi) earthquake occurred 123.4 miles away from Lee County center
On 5/1/2018 at 16:28:56, a magnitude 4.0 (4.0 MW, Depth: 3.1 mi) earthquake occurred 111.4 miles away from the county center
Magnitude types: regional Lg-wave magnitude (LG), body-wave magnitude (MB), local magnitude (ML), surface-wave magnitude (MS), moment magnitude (MW)
Most recent natural disasters:
- Texas Covid-19 Pandemic, Incident Period: January 20, 2020, FEMA Id: 4485, Natural disaster type: Other
- Texas Hurricane Harvey, Incident Period: August 23, 2017 - September 15, 2017, FEMA Id: 4332, Natural disaster type: Hurricane
- Texas Severe Storms and Flooding, Incident Period: May 22, 2016 to June 24, 2016, Major Disaster (Presidential) Declared DR-4272: June 11, 2016, FEMA Id: 4272, Natural disaster type: Storm, Flood
- Texas Severe Storms, Tornadoes, Straight-line Winds, and Flooding, Incident Period: May 04, 2015 to June 23, 2015, Major Disaster (Presidential) Declared DR-4223: May 29, 2015, FEMA Id: 4223, Natural disaster type: Storm, Tornado, Flood, Wind
- Texas Wildfires, Incident Period: March 14, 2008 to September 01, 2008, Emergency Declared EM-3284: March 14, 2008, FEMA Id: 3284, Natural disaster type: Fire
- Texas Hurricane Rita, Incident Period: September 23, 2005 to October 14, 2005, Major Disaster (Presidential) Declared DR-1606: September 24, 2005, FEMA Id: 1606, Natural disaster type: Hurricane
- Texas Hurricane Rita, Incident Period: September 20, 2005 to October 14, 2005, Emergency Declared EM-3261: September 21, 2005, FEMA Id: 3261, Natural disaster type: Hurricane
- Texas Hurricane Katrina, Incident Period: August 29, 2005 to October 01, 2005, Emergency Declared EM-3216: September 02, 2005, FEMA Id: 3216, Natural disaster type: Hurricane
- Texas Extreme Fire Hazards, Incident Period: August 01, 1999 to December 10, 1999, Emergency Declared EM-3142: September 01, 1999, FEMA Id: 3142, Natural disaster type: Fire
- Texas Severe Storm,Thunderstorms, Flooding, Incident Period: October 14, 1994 to November 08, 1994, Major Disaster (Presidential) Declared DR-1041: October 18, 1994, FEMA Id: 1041, Natural disaster type: Storm, Flood
- 2 other natural disasters have been reported since 1953.
The number of natural disasters in Lee County (12) is smaller than the US average (15).
Major Disasters (Presidential) Declared: 5
Emergencies Declared: 5
Causes of natural disasters: Hurricanes: 4, Storms: 4, Fires: 3, Floods: 3, Tornadoes: 2, Wind: 1, Other: 1 (Note: some incidents may be assigned to more than one category).
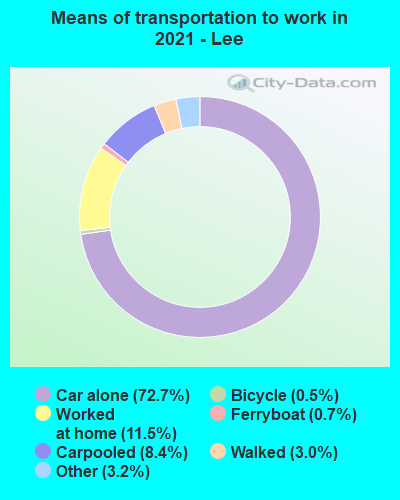
Means of transportation to work:
- Drove a car alone: 4,921 (70.8%)
- Carpooled: 538 (7.7%)
- Ferryboat: 12 (0.2%)
- Taxicab, motorcycle, or other means: 346 (5.0%)
- Bicycle: 37 (0.5%)
- Walked: 225 (3.2%)
- Worked at home: 884 (12.7%)
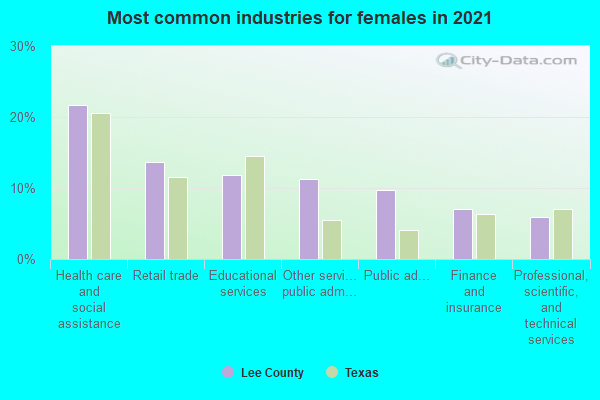
- Health care and social assistance (13%)
- Retail trade (13%)
- Educational services (11%)
- Professional, scientific, and technical services (7%)
- Public administration (7%)
- Construction (6%)
- Finance and insurance (5%)
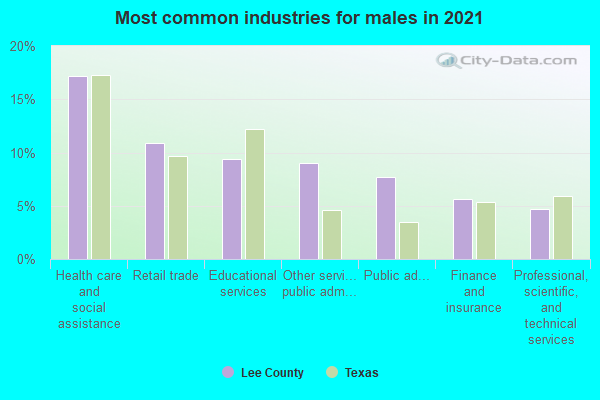
- Health care and social assistance (18%)
- Retail trade (17%)
- Educational services (15%)
- Professional, scientific, and technical services (10%)
- Public administration (9%)
- Construction (7%)
- Finance and insurance (7%)
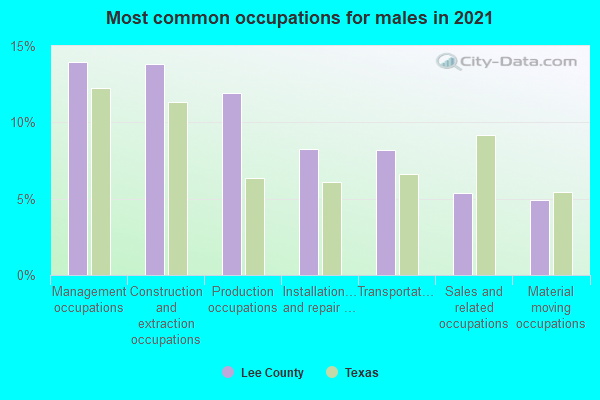
- Construction and extraction occupations (15%)
- Management occupations (13%)
- Production occupations (11%)
- Transportation occupations (9%)
- Installation, maintenance, and repair occupations (8%)
- Food preparation and serving related occupations (6%)
- Sales and related occupations (6%)
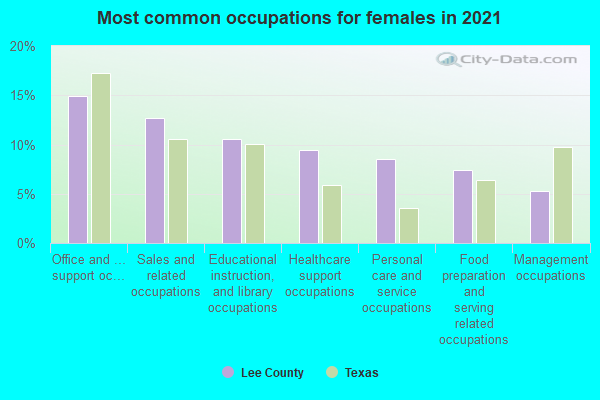
- Office and administrative support occupations (17%)
- Sales and related occupations (15%)
- Educational instruction, and library occupations (11%)
- Business and financial operations occupations (7%)
- Food preparation and serving related occupations (7%)
- Health technologists and technicians (6%)
- Health diagnosing and treating practitioners and other technical occupations (6%)
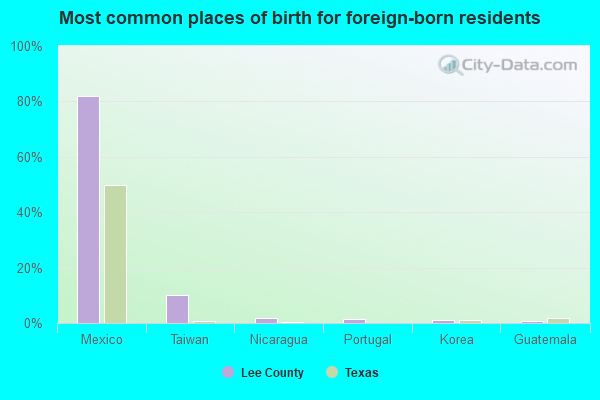
- Mexico (84%)
- Taiwan (5%)
- Honduras (2%)
- Nicaragua (2%)
- Guatemala (1%)
- Portugal (1%)
- El Salvador (0%)
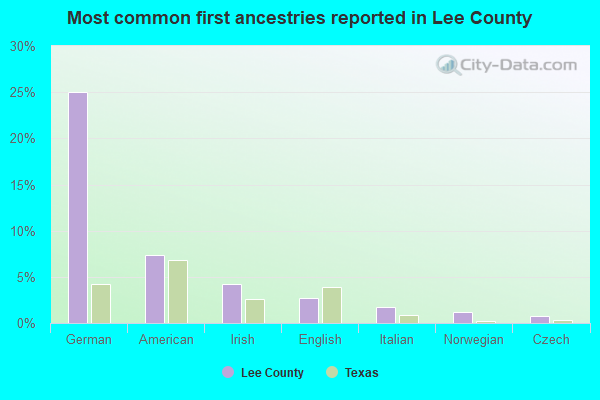
- German (26%)
- American (7%)
- Irish (6%)
- English (3%)
- Italian (2%)
- Norwegian (1%)
- Czech (1%)
People in group quarters in Lee County, Texas in 2010:
- 293 people in correctional facilities intended for juveniles
- 161 people in nursing facilities/skilled-nursing facilities
- 38 people in local jails and other municipal confinement facilities
- 29 people in group homes intended for adults
- 3 people in college/university student housing
People in group quarters in Lee County, Texas in 2000:
- 387 people in state prisons
- 204 people in nursing homes
- 16 people in other noninstitutional group quarters
- 13 people in local jails and other confinement facilities (including police lockups)
- 2 people in homes for the mentally retarded
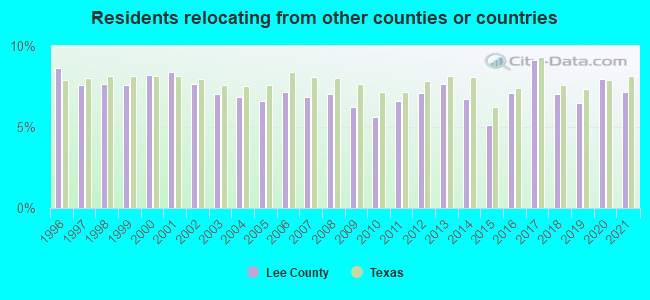
7.14% of this county's 2021 resident taxpayers lived in other counties in 2020 ($63,476 average adjusted gross income)
| Here: | 7.14% |
| Texas average: | 8.12% |
10 or fewer of this county's residents moved from foreign countries.
6.32% relocated from other counties in Texas ($55,961 average AGI)
0.82% relocated from other states ($7,515 average AGI)
Lee County: 0.82% Texas average: 2.83%
Top counties from which taxpayers relocated into this county between 2020 and 2021:
| from Travis County, TX | |
| from Bastrop County, TX | |
| from Williamson County, TX | |
| from Harris County, TX |
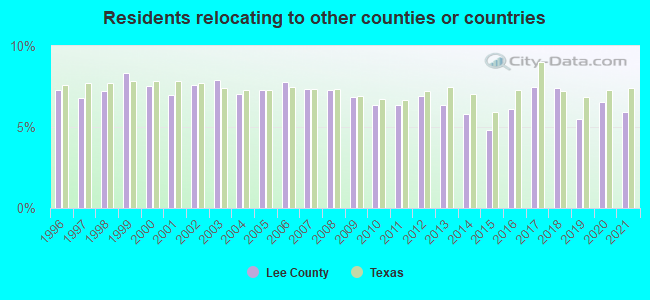
5.92% of this county's 2020 resident taxpayers moved to other counties in 2021 ($49,380 average adjusted gross income)
| Here: | 5.92% |
| Texas average: | 7.40% |
10 or fewer of this county's residents moved to foreign countries.
5.53% relocated to other counties in Texas ($46,106 average AGI)
0.39% relocated to other states ($3,277 average AGI)
Lee County: 0.39% Texas average: 2.08%
Top counties to which taxpayers relocated from this county between 2020 and 2021:
| to Bastrop County, TX | |
| to Travis County, TX | |
| to Harris County, TX | |
| to Brazos County, TX | |
| to Fayette County, TX | |
| to Williamson County, TX | |
| to Burleson County, TX |
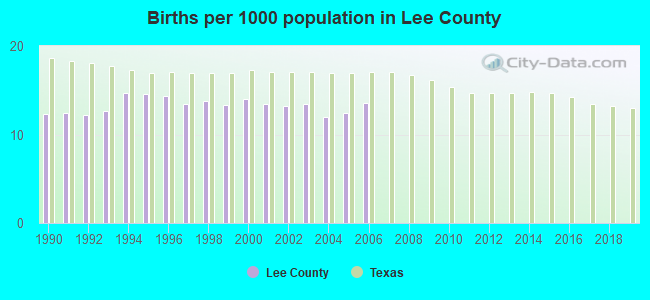
Births per 1000 population from 1990 to 1999: 13.4
Births per 1000 population from 2000 to 2006: 13.2
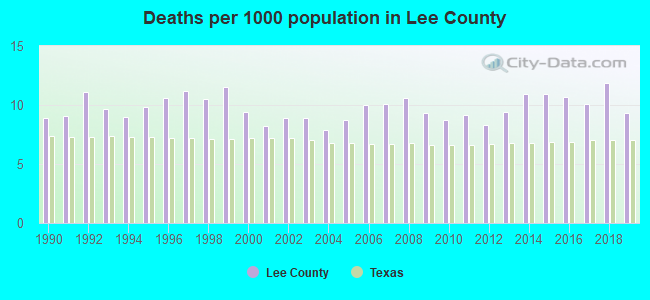
Deaths per 1000 population from 1990 to 1999: 10.1
Deaths per 1000 population from 2000 to 2009: 9.2
Deaths per 1000 population from 2010 to 2020: 10.2
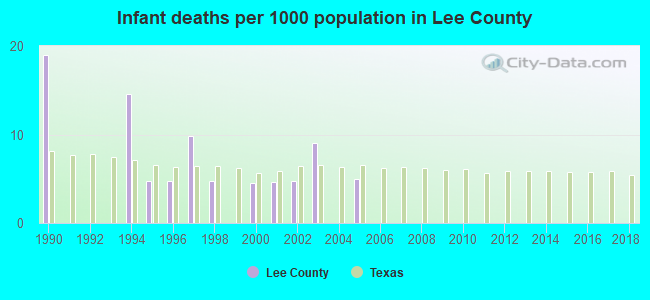
Infant deaths per 1000 live births from 1990 to 1999: 5.8
Infant deaths per 1000 live births from 2000 to 2006: 4.0
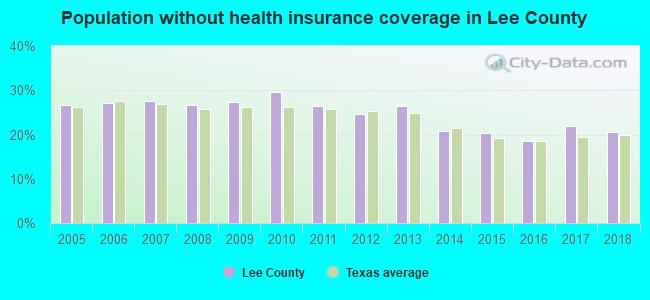
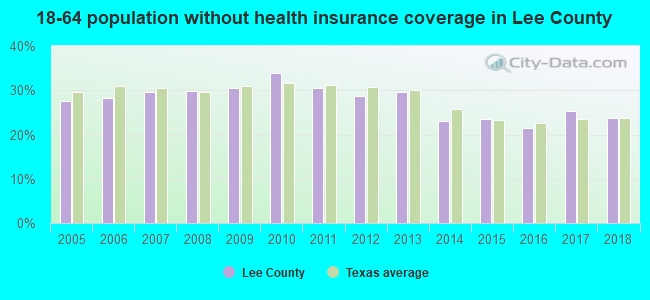
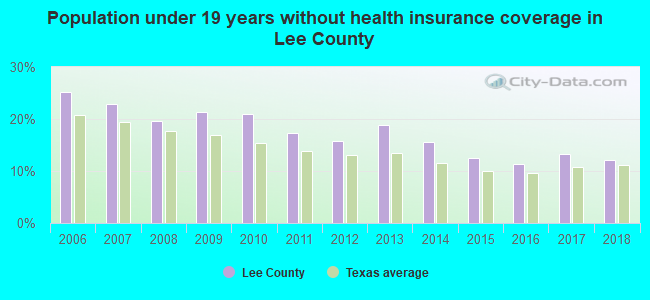
Persons under 19 years old without health insurance coverage in 2018: 12.1%
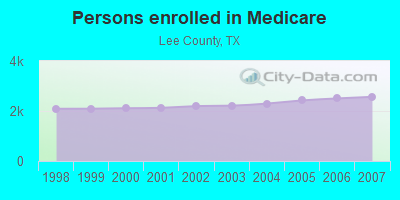
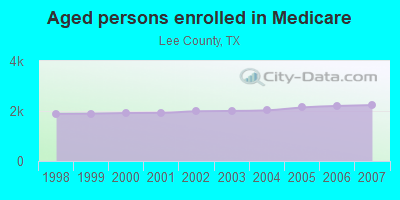
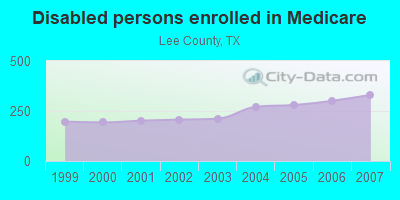
Persons enrolled in hospital insurance and/or supplemental medical insurance (Medicare) in July 1, 2007: 2,567 (2,236 aged, 331 disabled)
Children under 18 without health insurance coverage in 2007: 877 (22%)
Most common underlying causes of death in Lee County, Texas in 1999 - 2019:
- Acute myocardial infarction, unspecified (237)
- Bronchus or lung, unspecified - Malignant neoplasms (116)
- Congestive heart failure (33)
- Alzheimer disease, unspecified (22)
- Atherosclerotic cardiovascular disease, so described (22)
- Unspecified dementia (12)
- Atherosclerotic heart disease (11)
- Stroke, not specified as haemorrhage or infarction (11)
Population without health insurance coverage in 2000: 16%
Children under 18 without health insurance coverage in 2000: 16%
Medical specialist MDs per 100,000 population in 2005: 890
Dentists per 100,000 population in 1998: 12
Total births per 100,000 population, July 2005 - July 2006 : 20
Total deaths per 100,000 population, July 2005 - July 2006: 67
Limited-service eating places per 100,000 population in 2005 : 18
Household type by relationship:
Households: 18,014- Male householders: 3,221 (837 living alone), Female householders: 3,453 (897 living alone)
3,656 spouses (3,656 opposite-sex spouses), 391 unmarried partners, (391 opposite-sex unmarried partners), 5,283 children (4,792 natural, 45 adopted, 447 stepchildren), 403 grandchildren, 236 brothers or sisters, 207 parents, 0 foster children, 266 other relatives, 461 non-relatives
- In group quarters: 434
Size of family households: 2,179 2-persons, 1,171 3-persons, 802 4-persons, 474 5-persons, 95 6-persons, 89 7-or-more-persons.
Size of nonfamily households: 1,734 1-person, 116 2-persons, 5 3-persons.
2,248 married couples with children.
1,088 single-parent households (427 men, 661 women).
82.5% of residents of Lee speak English at home.
15.6% of residents speak Spanish at home (66% speak English very well, 18% speak English well, 6% speak English not well, 10% don't speak English at all).
1.5% of residents speak other Indo-European language at home (96% speak English very well, 3% speak English well, 1% speak English not well).
0.4% of residents speak Asian or Pacific Island language at home (64% speak English very well, 6% speak English well, 15% speak English not well, 15% don't speak English at all).
In fiscal year 2004:
Federal Government expenditure: $67,128,000 ($4,060 per capita)
Department of Defense expenditure: $1,377,000
Federal direct payments to individuals for retirement and disability: $31,999,000
Federal other direct payments to individuals: $14,738,000
Federal direct payments not to individuals: $520,000
Federal grants: $17,823,000
Federal procurement contracts: $430,000 ($6,000 Department of Defense)
Federal salaries and wages: $1,617,000 ($0,000 Department of Defense)
Federal Government direct loans: $1,428,000
Federal guaranteed/insured loans: $3,315,000
Federal Government insurance: $1,943,000
Population change from April 1, 2000 to July 1, 2005:
Births: 1,157| Here: | 70 per 1000 residents |
| State: | 85 per 1000 residents |
Deaths: 741
| Here: | 45 per 1000 residents |
| State: | 35 per 1000 residents |
Net international migration: +146
| Here: | +9 per 1000 residents |
| State: | +29 per 1000 residents |
Net internal migration: +325
| Here: | +20 per 1000 residents |
| State: | +10 per 1000 residents |
Total withdrawal of fresh water for public supply: 2.24 millions of gallons per day (all from ground)
| Here: | 6.1 |
| State: | 6.3 |
| Here: | 5.0 |
| State: | 4.0 |
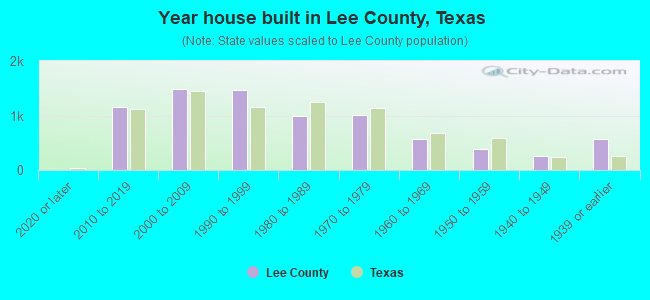
- Year house built in Lee County, Texas
- 312020 or later
- 1,0372010 to 2019
- 1,5712000 to 2009
- 1,5601990 to 1999
- 9251980 to 1989
- 9791970 to 1979
- 5211960 to 1969
- 3551950 to 1959
- 1981940 to 1949
- 7101939 or earlier
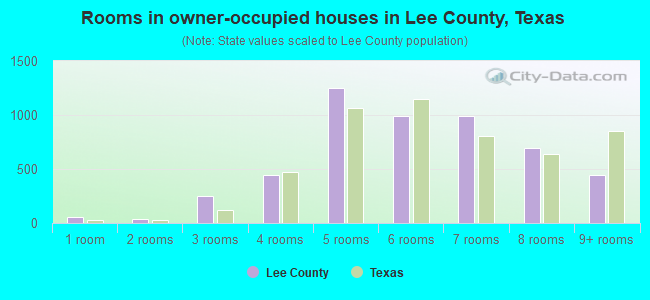
- Rooms in owner-occupied houses in Lee County, Texas
- 1211 room
- 522 rooms
- 1773 rooms
- 4234 rooms
- 1,2405 rooms
- 1,0656 rooms
- 9407 rooms
- 7488 rooms
- 4569+ rooms
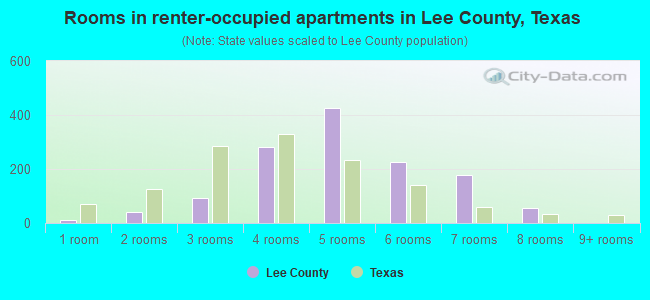
- Rooms in renter-occupied apartments in Lee County, Texas
- 111 room
- 542 rooms
- 1313 rooms
- 3074 rooms
- 3715 rooms
- 2856 rooms
- 2067 rooms
- 488 rooms
- 119+ rooms
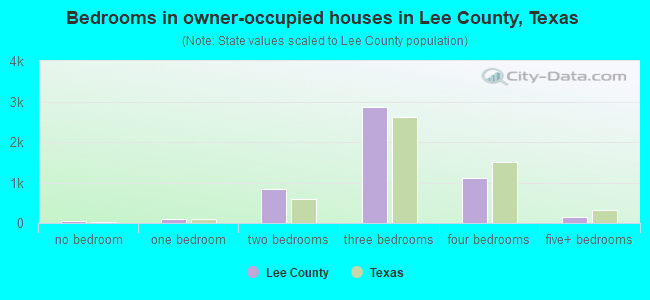
- Bedrooms in owner-occupied houses in Lee County, Texas
- 134no bedroom
- 1441 bedroom
- 7532 bedrooms
- 2,7943 bedrooms
- 1,2054 bedrooms
- 1905+ bedrooms
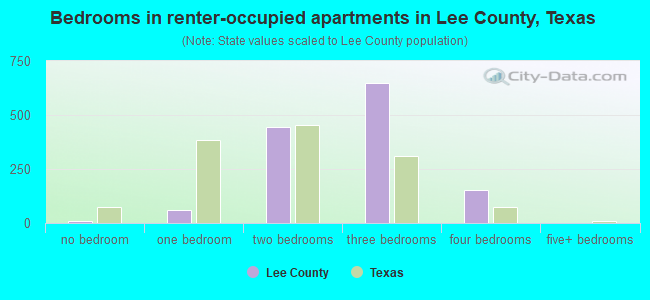
- Bedrooms in renter-occupied apartments in Lee County, Texas
- 11no bedroom
- 861 bedroom
- 5142 bedrooms
- 5933 bedrooms
- 2344 bedrooms
- 05+ bedrooms
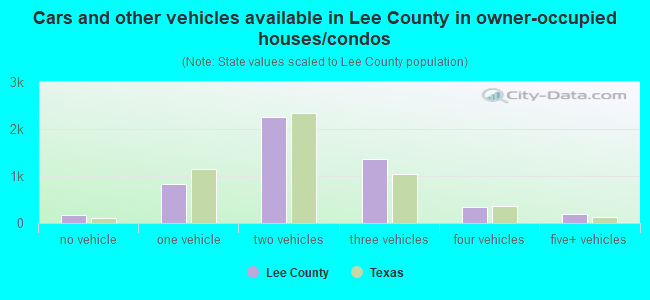
- Cars and other vehicles available in Lee County in owner-occupied houses/condos
- 193no vehicle
- 1,0261 vehicle
- 2,2832 vehicles
- 1,2773 vehicles
- 2804 vehicles
- 1555+ vehicles
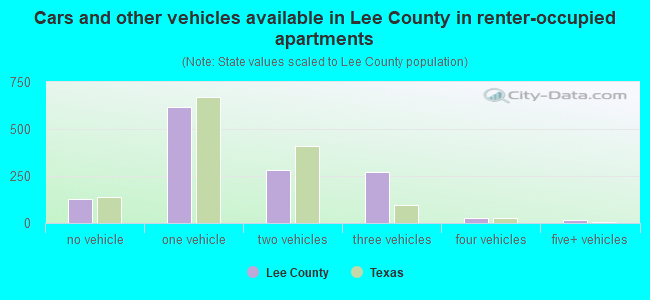
- Cars and other vehicles available in Lee County in renter-occupied apartments
- 133no vehicle
- 6631 vehicle
- 3332 vehicles
- 2993 vehicles
- 144 vehicles
- 115+ vehicles
91.1% of Lee County residents lived in the same house 1 years ago.
Out of people who lived in different houses, 27% lived in this county.
Out of people who lived in different counties, 92% lived in Texas.
| Lee County: | 91.1% |
| State average: | 85.7% |
Place of birth for U.S.-born residents:
- This state: 13,909
- Other state: 2,563
- Northeast: 160
- Midwest: 765
- South: 849
- West: 792
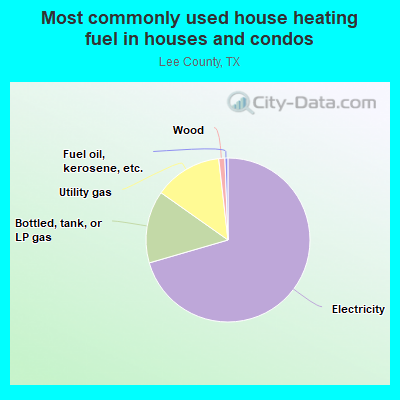
- 67.8%Electricity
- 16.3%Bottled, tank, or LP gas
- 14.0%Utility gas
- 1.2%Wood
- 0.3%Fuel oil, kerosene, etc.
- 0.3%Solar energy
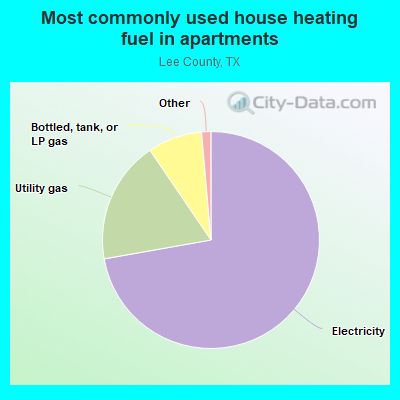
- 64.6%Electricity
- 25.3%Utility gas
- 7.4%Bottled, tank, or LP gas
- 2.7%No fuel used
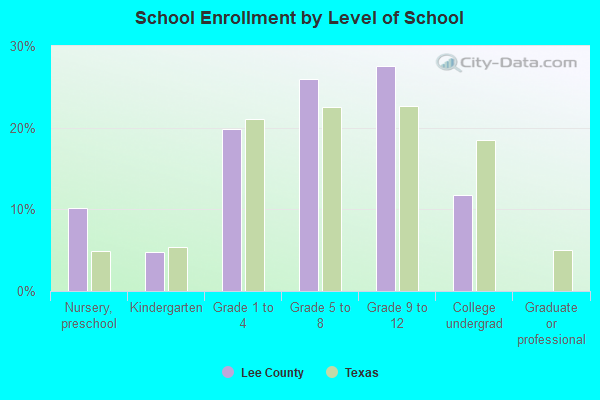
Private vs. public school enrollment:
| Here: | 16.6% |
| Texas: | 8.8% |
| Here: | 12.1% |
| Texas: | 8.0% |
| Here: | 2.1% |
| Texas: | 16.2% |
Lee County government finances - Expenditure in 2017:
- Charges - Other: $643,000
Solid Waste Management: $4,000
- Construction - General - Other: $1,017,000
- Current Operations - Regular Highways: $3,652,000
Police Protection: $1,869,000
Correctional Institutions: $1,733,000
General - Other: $1,672,000
Financial Administration: $1,436,000
Judicial and Legal Services: $1,263,000
Central Staff Services: $741,000
General Public Buildings: $479,000
Public Welfare, Vendor Payments for Medical Care: $367,000
Natural Resources - Other: $197,000
Health - Other: $183,000
Corrections - Other: $78,000
Public Welfare - Other: $64,000
Solid Waste Management: $20,000
- General - Interest on Debt: $402,000
- Long Term Debt - Beginning Outstanding - Unspecified Public Purpose: $8,925,000
Outstanding Unspecified Public Purpose: $8,550,000
Retired Unspecified Public Purpose: $375,000
- Miscellaneous - Fines and Forfeits: $359,000
Interest Earnings: $244,000
General Revenue - Other: $138,000
Sale of Property: $31,000
Royalties: $21,000
- Other Capital Outlay - Police Protection: $43,000
General - Other: $31,000
Natural Resources - Other: $10,000
Judicial and Legal Services: $6,000
Financial Administration: $6,000
Correctional Institutions: $2,000
General Public Building: $2,000
- Other Funds - Cash and Securities: $9,054,000
- Sinking Funds - Cash and Securities: $185,000
- State Intergovernmental - Other: $1,331,000
Highways: $28,000
Public Welfare: $14,000
General Local Government Support: $6,000
- Tax - Property: $10,421,000
General Sales and Gross Receipts: $1,136,000
Motor Vehicle License: $896,000
- Total Salaries and Wages: $3,643,000
Lee County government finances - Revenue in 2017:
- Charges - Other: $643,000
Solid Waste Management: $4,000
- Construction - General - Other: $1,017,000
- Current Operations - Regular Highways: $3,652,000
Police Protection: $1,869,000
Correctional Institutions: $1,733,000
General - Other: $1,672,000
Financial Administration: $1,436,000
Judicial and Legal Services: $1,263,000
Central Staff Services: $741,000
General Public Buildings: $479,000
Public Welfare, Vendor Payments for Medical Care: $367,000
Natural Resources - Other: $197,000
Health - Other: $183,000
Corrections - Other: $78,000
Public Welfare - Other: $64,000
Solid Waste Management: $20,000
- General - Interest on Debt: $402,000
- Long Term Debt - Beginning Outstanding - Unspecified Public Purpose: $8,925,000
Outstanding Unspecified Public Purpose: $8,550,000
Retired Unspecified Public Purpose: $375,000
- Miscellaneous - Fines and Forfeits: $359,000
Interest Earnings: $244,000
General Revenue - Other: $138,000
Sale of Property: $31,000
Royalties: $21,000
- Other Capital Outlay - Police Protection: $43,000
General - Other: $31,000
Natural Resources - Other: $10,000
Judicial and Legal Services: $6,000
Financial Administration: $6,000
Correctional Institutions: $2,000
General Public Building: $2,000
- Other Funds - Cash and Securities: $9,054,000
- Sinking Funds - Cash and Securities: $185,000
- State Intergovernmental - Other: $1,331,000
Highways: $28,000
Public Welfare: $14,000
General Local Government Support: $6,000
- Tax - Property: $10,421,000
General Sales and Gross Receipts: $1,136,000
Motor Vehicle License: $896,000
- Total Salaries and Wages: $3,643,000
Lee County government finances - Debt in 2017:
- Charges - Other: $643,000
Solid Waste Management: $4,000
- Construction - General - Other: $1,017,000
- Current Operations - Regular Highways: $3,652,000
Police Protection: $1,869,000
Correctional Institutions: $1,733,000
General - Other: $1,672,000
Financial Administration: $1,436,000
Judicial and Legal Services: $1,263,000
Central Staff Services: $741,000
General Public Buildings: $479,000
Public Welfare, Vendor Payments for Medical Care: $367,000
Natural Resources - Other: $197,000
Health - Other: $183,000
Corrections - Other: $78,000
Public Welfare - Other: $64,000
Solid Waste Management: $20,000
- General - Interest on Debt: $402,000
- Long Term Debt - Beginning Outstanding - Unspecified Public Purpose: $8,925,000
Outstanding Unspecified Public Purpose: $8,550,000
Retired Unspecified Public Purpose: $375,000
- Miscellaneous - Fines and Forfeits: $359,000
Interest Earnings: $244,000
General Revenue - Other: $138,000
Sale of Property: $31,000
Royalties: $21,000
- Other Capital Outlay - Police Protection: $43,000
General - Other: $31,000
Natural Resources - Other: $10,000
Judicial and Legal Services: $6,000
Financial Administration: $6,000
Correctional Institutions: $2,000
General Public Building: $2,000
- Other Funds - Cash and Securities: $9,054,000
- Sinking Funds - Cash and Securities: $185,000
- State Intergovernmental - Other: $1,331,000
Highways: $28,000
Public Welfare: $14,000
General Local Government Support: $6,000
- Tax - Property: $10,421,000
General Sales and Gross Receipts: $1,136,000
Motor Vehicle License: $896,000
- Total Salaries and Wages: $3,643,000
Lee County government finances - Cash and Securities in 2017:
- Charges - Other: $643,000
Solid Waste Management: $4,000
- Construction - General - Other: $1,017,000
- Current Operations - Regular Highways: $3,652,000
Police Protection: $1,869,000
Correctional Institutions: $1,733,000
General - Other: $1,672,000
Financial Administration: $1,436,000
Judicial and Legal Services: $1,263,000
Central Staff Services: $741,000
General Public Buildings: $479,000
Public Welfare, Vendor Payments for Medical Care: $367,000
Natural Resources - Other: $197,000
Health - Other: $183,000
Corrections - Other: $78,000
Public Welfare - Other: $64,000
Solid Waste Management: $20,000
- General - Interest on Debt: $402,000
- Long Term Debt - Beginning Outstanding - Unspecified Public Purpose: $8,925,000
Outstanding Unspecified Public Purpose: $8,550,000
Retired Unspecified Public Purpose: $375,000
- Miscellaneous - Fines and Forfeits: $359,000
Interest Earnings: $244,000
General Revenue - Other: $138,000
Sale of Property: $31,000
Royalties: $21,000
- Other Capital Outlay - Police Protection: $43,000
General - Other: $31,000
Natural Resources - Other: $10,000
Judicial and Legal Services: $6,000
Financial Administration: $6,000
Correctional Institutions: $2,000
General Public Building: $2,000
- Other Funds - Cash and Securities: $9,054,000
- Sinking Funds - Cash and Securities: $185,000
- State Intergovernmental - Other: $1,331,000
Highways: $28,000
Public Welfare: $14,000
General Local Government Support: $6,000
- Tax - Property: $10,421,000
General Sales and Gross Receipts: $1,136,000
Motor Vehicle License: $896,000
- Total Salaries and Wages: $3,643,000
Supplemental Security Income (SSI) in 2006:
- Total number of recipients: 298
- Number of aged recipients: 56
- Number of blind and disabled recipients: 242
- Number of recipients under 18: 37
- Number of recipients between 18 and 64: 160
- Number of recipients older than 64: 101
- Number of recipients also receiving OASDI: 139
- Amount of payments (thousands of dollars): 103
| Most common first names in Lee County, TX among deceased individuals | ||
| Name | Count | Lived (average) |
|---|---|---|
| John | 77 | 77.5 years |
| Mary | 50 | 83.5 years |
| James | 50 | 69.4 years |
| William | 47 | 77.7 years |
| Robert | 46 | 73.8 years |
| George | 35 | 76.7 years |
| Albert | 35 | 76.5 years |
| Walter | 34 | 79.8 years |
| Louise | 33 | 83.9 years |
| Clara | 32 | 83.3 years |
| Most common last names in Lee County, TX among deceased individuals | ||
| Last name | Count | Lived (average) |
|---|---|---|
| Davis | 30 | 75.6 years |
| Schulze | 29 | 75.0 years |
| Zoch | 28 | 79.8 years |
| Mitschke | 27 | 77.4 years |
| Fischer | 26 | 79.7 years |
| Smith | 25 | 72.1 years |
| Lehmann | 24 | 79.9 years |
| Brown | 23 | 78.8 years |
| Johnson | 21 | 74.2 years |
| Turner | 21 | 74.4 years |
| Businesses in Lee County, TX | ||||
| Name | Count | Name | Count | |
|---|---|---|---|---|
| AT&T | 2 | McDonald's | 1 | |
| Ace Hardware | 1 | Nike | 1 | |
| AutoZone | 1 | RadioShack | 1 | |
| Best Western | 1 | Ramada | 1 | |
| Curves | 1 | SONIC Drive-In | 1 | |
| FedEx | 1 | Subway | 2 | |
| H&R Block | 1 | Taco Bell | 1 | |
| Kincaid | 1 | U-Haul | 1 | |
| La-Z-Boy | 1 | UPS | 2 | |
| Lane Furniture | 1 | Walmart | 1 | |