Clay County, Florida (FL)
County owner-occupied free and clear houses and condos in 2010: 11,455
County owner-occupied houses and condos in 2000: 39,120
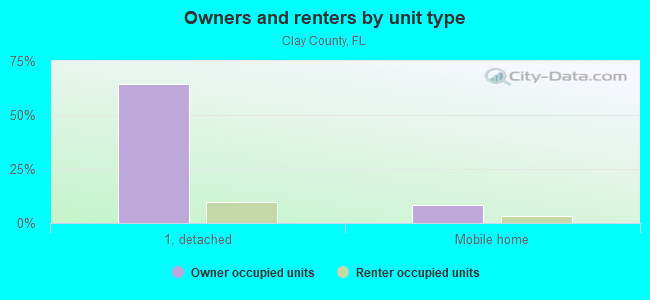
Renter-occupied apartments: 16,225 (it was 11,123 in 2000)
| % of renters here: | 22% |
| State: | 33% |
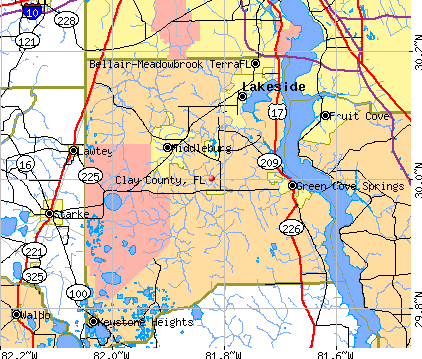
Land area: 601 sq. mi.
Water area: 42.6 sq. mi.
Population density: 377 people per square mile (high).
Industries providing employment: Educational, health and social services (22.6%), Retail trade (14.0%), Professional, scientific, management, administrative, and waste management services (12.3%).
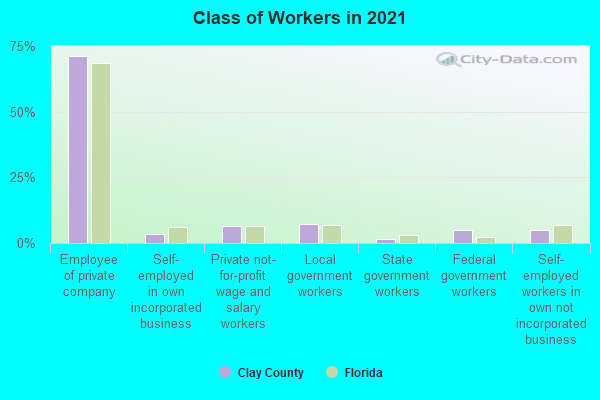
Type of workers:
- Private wage or salary: 80%
- Government: 15%
- Self-employed, not incorporated: 4%
- Unpaid family work: 0%
- OSM Map
- General Map
- Google Map
- MSN Map

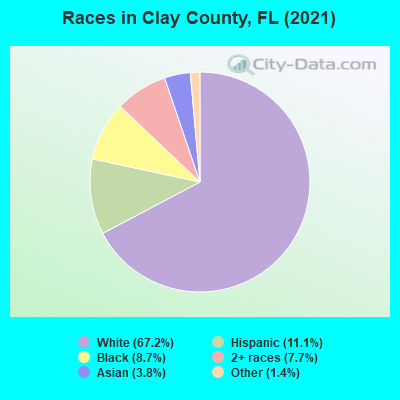
- 153,96868.0%White Non-Hispanic Alone
- 25,93511.4%Hispanic or Latino
- 23,25510.3%Black Non-Hispanic Alone
- 15,3776.8%Two or more races
- 5,0362.2%Asian alone
- 2,9091.3%Some other race alone
- 1090.05%American Indian and Alaska Native alone
| Median resident age: | 40.2 years |
| Florida median age: | 42.7 years |
| Males: 112,326 | |
| Females: 114,263 |

 | Clay county - Orange Port to Middleburg high crime? (6 replies) |
| PVB to Clay County commute (8 replies) |
| Oakleaf Clay County or St Johns County Homes (2 replies) |
| Is Orlando southern in culture? (85 replies) |
| confused between saint John and St Augustine (24 replies) |
| Does anyone live in (or near) Fleming Island, FL? (29 replies) |
| Clay County: | 2.0 people |
| Florida: | 2 people |
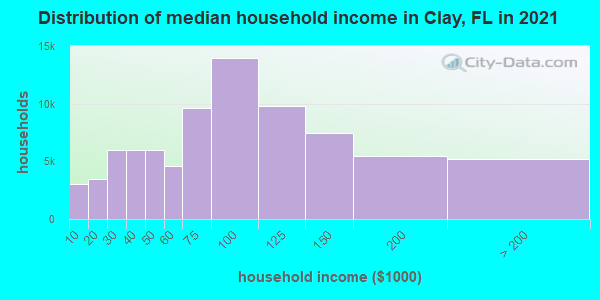
Estimated median household income in 2022: $85,594 ($48,854 in 1999)
| This county: | $85,594 |
| Florida: | $69,303 |
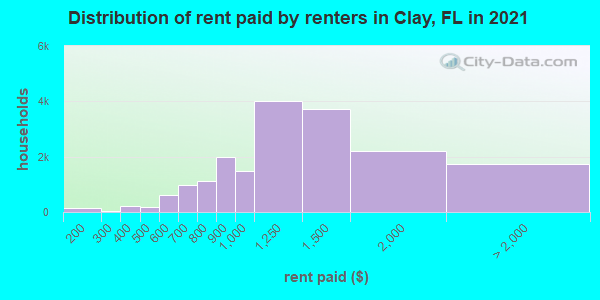
Median contract rent in 2022 for apartments: $1,366 (lower quartile is $963, upper quartile is $1,765)
| This county: | $1366 |
| State: | $1367 |
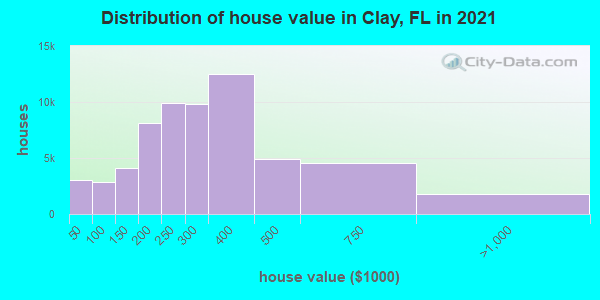
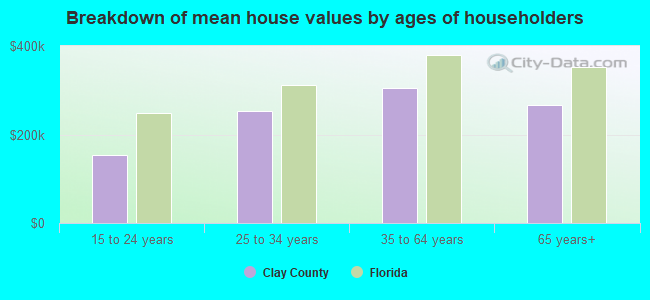
Estimated median house or condo value in 2022: $308,000 (it was $97,400 in 2000)
| Clay: | $308,000 |
| Florida: | $354,100 |
Mean price in 2022:
Median monthly housing costs for homes and condos with a mortgage: $1,527Detached houses: $333,748
Here: $333,748 State: $500,941 Townhouses or other attached units: $221,868
Here: $221,868 State: $370,869 In 5-or-more-unit structures: $358,094
Here: $358,094 State: $447,145 Mobile homes: $149,126
Here: $149,126 State: $113,202
Median monthly housing costs for units without a mortgage: $459
Institutionalized population: 1,147
Crime in 2020 (reported by the sheriff's office or county police, not the county total):
- Murders: 5
- Rapes: 81
- Robberies: 70
- Assaults: 335
- Burglaries: 314
- Thefts: 1928
- Auto thefts: 178
Crime in 2019 (reported by the sheriff's office or county police, not the county total):
- Murders: 4
- Rapes: 86
- Robberies: 64
- Assaults: 356
- Burglaries: 496
- Thefts: 2213
- Auto thefts: 167
Health of residents in Clay County based on CDC Behavioral Risk Factor Surveillance System Survey Questionnaires from 2013 to 2021:
General health status score of residents in this county from 1 (poor) to 5 (excellent) is 3.4. This is about average.69.2% of residents exercised in the past month. This is less than average.
46.4% of residents smoked 100+ cigarettes in their lives. This is about average.
52.3% of adult residents drank alcohol in the past 30 days. This is less than average.
64.1% of residents visited a dentist within the past year. This is less than average.
Average weight of males is 199 pounds. This is about average.
Average weight of females is 163 pounds. This is about average.
Health of residents in Clay County based on CDC Behavioral Risk Factor Surveillance System Survey Questionnaires from 2003 to 2012:
General health status score of residents in this county from 1 (poor) to 5 (excellent) is 3.5. This is about average.75.2% of residents exercised in the past month. This is about average.
53.0% of residents smoked 100+ cigarettes in their lives. This is more than average.
98.8% of adult residents drank alcohol in the past 30 days. This is more than average.
69.3% of residents visited a dentist within the past year. This is about average.
Average weight of males is 201 pounds. This is more than average.
Average weight of females is 159 pounds. This is about average.
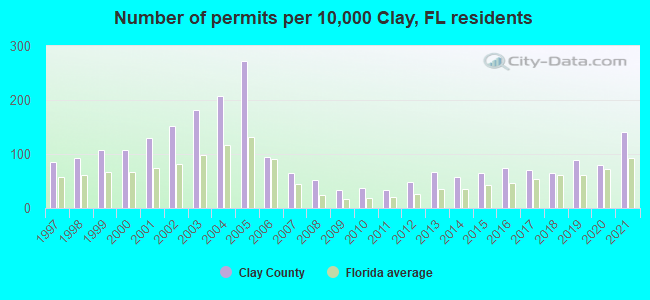
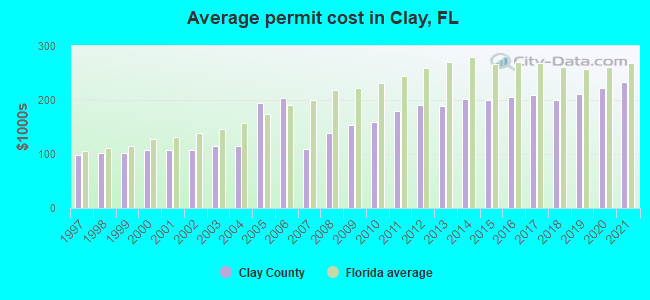
Single-family new house construction building permits:
- 2022: 1633 buildings, average cost: $251,200
- 2021: 1985 buildings, average cost: $233,900
- 2020: 1124 buildings, average cost: $222,500
- 2019: 1246 buildings, average cost: $212,000
- 2018: 900 buildings, average cost: $199,800
- 2017: 981 buildings, average cost: $208,900
- 2016: 1046 buildings, average cost: $205,200
- 2015: 902 buildings, average cost: $200,300
- 2014: 813 buildings, average cost: $202,000
- 2013: 948 buildings, average cost: $188,800
- 2012: 669 buildings, average cost: $190,700
- 2011: 468 buildings, average cost: $179,600
- 2010: 528 buildings, average cost: $159,800
- 2009: 459 buildings, average cost: $154,100
- 2008: 715 buildings, average cost: $138,200
- 2007: 920 buildings, average cost: $108,600
- 2006: 1336 buildings, average cost: $203,500
- 2005: 3831 buildings, average cost: $193,700
- 2004: 2935 buildings, average cost: $115,300
- 2003: 2547 buildings, average cost: $114,300
- 2002: 2131 buildings, average cost: $107,900
- 2001: 1821 buildings, average cost: $106,800
- 2000: 1520 buildings, average cost: $107,000
- 1999: 1518 buildings, average cost: $101,900
- 1998: 1302 buildings, average cost: $101,400
- 1997: 1208 buildings, average cost: $98,500
Median real estate property taxes paid for housing units with mortgages in 2022: $2,118 (0.7%)
Median real estate property taxes paid for housing units with no mortgage in 2022: $1,545 (0.6%)
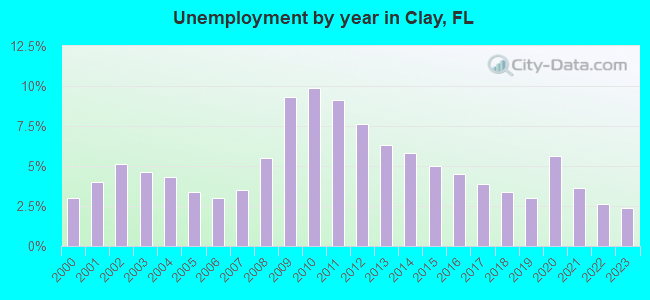
| Clay County: | 8.9% |
| Florida: | 12.7% |
Median age of residents in 2022: 40.2 years old
(Males: 38.7 years old, Females: 41.4 years old)
(Median age for: White residents: 43.5 years old, Black residents: 36.2 years old, American Indian residents: 40.6 years old, Asian residents: 45.8 years old, Hispanic or Latino residents: 33.6 years old, Other race residents: 46.1 years old)
Area name: Jacksonville, FL HUD Metro FMR Area
Fair market rent in 2006 for a 1-bedroom apartment in Clay County is $643 a month.
Fair market rent for a 2-bedroom apartment is $749 a month.
Fair market rent for a 3-bedroom apartment is $940 a month.
Cities in this county include: Lakeside, Middleburg-Clay Hill, Fleming Island, Oakleaf Plantation, Bellair-Meadowbrook Terrace, Middleburg, Orange Park, Green Cove Springs, Asbury Lake, Keystone Heights.
| Zip Code | City | Certified Residential Database | Mandatory Residential Database | Mandatory Non-Residential Database | |||
|---|---|---|---|---|---|---|---|
| Buildings Measured | Above 4 pCi/L (%) | Buildings Measured | Above 4 pCi/L (%) | Buildings Measured | Above 4 pCi/L (%) | ||
| 32043 | Green Cove Springs | 9 | 0 | - | - | - | - |
| 32065 | Orange Park | 31 | 0 | 1 | 0 | 1 | 0 |
| 32068 | Middleburg | 23 | 0 | 4 | 0 | 4 | 0 |
| 32073 | Orange Park | 61 | 0 | 1 | 0 | 1 | 0 |
| 32656 | Keystone Heights | 14 | 21 | 2 | 0 | 2 | 0 |
Neighboring counties: Iberville Parish, Louisiana  , Plaquemines Parish, Louisiana , St. Bernard Parish, Louisiana , Lee County, Texas , Waller County, Texas .
| Here: | 2.9% |
| Florida: | 2.9% |
Current college students: 6,892
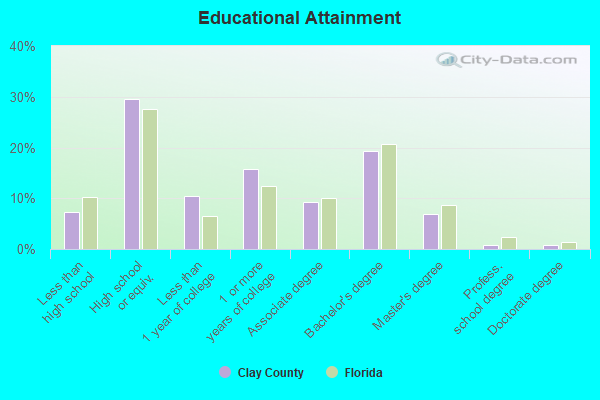
People 25 years of age or older with a high school degree or higher: 94.4%
People 25 years of age or older with a bachelor's degree or higher: 27.4%
Number of foreign born residents: 14,925 (67.7% naturalized citizens)
| Clay County: | 6.6% |
| Whole state: | 21.7% |
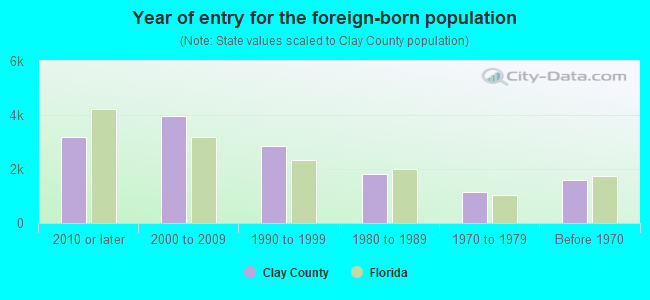
- Year of entry for the foreign-born population
- 4,5272010 or later
- 3,3472000 to 2009
- 3,0341990 to 1999
- 1,8091980 to 1989
- 1,1341970 to 1979
- 1,598Before 1970
Mean travel time to work (commute): minutes
Percentage of county residents living and working in this county: 99.3%
Housing units in structures:
- One, detached: 64,333
- One, attached: 3,438
- Two: 685
- 3 or 4: 2,642
- 5 to 9: 2,889
- 10 to 19: 1,720
- 20 to 49: 1,445
- 50 or more: 1,794
- Mobile homes: 9,862
- Boats, RVs, vans, etc.: 178
Housing units in Clay County with a mortgage: 45,241 (2,924 second mortgage, 181 home equity loan, 2,624 both second mortgage and home equity loan)
Houses without a mortgage: 806
| Here: | 5.3% with mortgage |
| State: | 97.6% with mortgage |
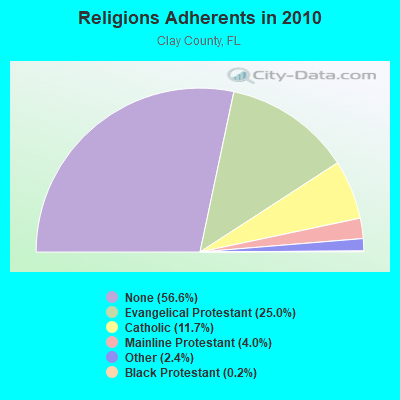
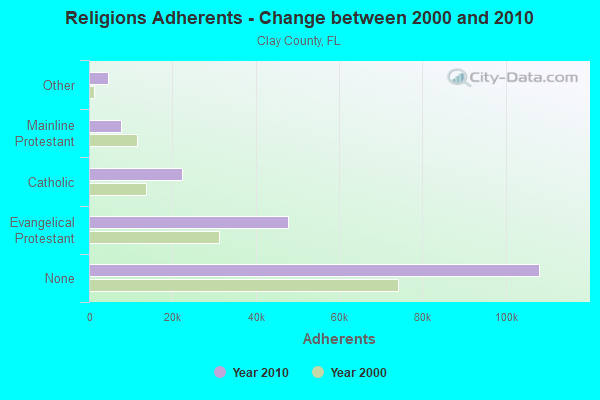
Religion statistics for Clay County
| Religion | Adherents | Congregations |
|---|---|---|
| Evangelical Protestant | 47,779 | 116 |
| Catholic | 22,260 | 4 |
| Mainline Protestant | 7,693 | 16 |
| Other | 4,622 | 11 |
| Black Protestant | 436 | 5 |
| None | 108,075 | - |
Source: Clifford Grammich, Kirk Hadaway, Richard Houseal, Dale E.Jones, Alexei Krindatch, Richie Stanley and Richard H.Taylor. 2012. 2010 U.S.Religion Census: Religious Congregations & Membership Study. Association of Statisticians of American Religious Bodies. Jones, Dale E., et al. 2002. Congregations and Membership in the United States 2000. Nashville, TN: Glenmary Research Center.
Food Environment Statistics:
| Clay County: | 1.60 / 10,000 pop. |
| State: | 2.04 / 10,000 pop. |
| Here: | 0.17 / 10,000 pop. |
| Florida: | 0.11 / 10,000 pop. |
| This county: | 0.55 / 10,000 pop. |
| Florida: | 1.28 / 10,000 pop. |
| Clay County: | 3.52 / 10,000 pop. |
| Florida: | 3.04 / 10,000 pop. |
| This county: | 5.34 / 10,000 pop. |
| State: | 7.45 / 10,000 pop. |
| Clay County: | 9.7% |
| Florida: | 9.2% |
| Clay County: | 27.0% |
| State: | 23.7% |
| Here: | 10.3% |
| State: | 14.0% |
Agriculture in Clay County:
Average size of farms: 231 acresAverage value of agricultural products sold per farm: $108,975
Average value of crops sold per acre for harvested cropland: $1305.93
The value of nursery, greenhouse, floriculture, and sod as a percentage of the total market value of agricultural products sold: 9.44%
The value of livestock, poultry, and their products as a percentage of the total market value of agricultural products sold: 89.76%
Average total farm production expenses per farm: $67,759
Harvested cropland as a percentage of land in farms: 3.70%
Irrigated harvested cropland as a percentage of land in farms: 17.25%
Average market value of all machinery and equipment per farm: $19,017
The percentage of farms operated by a family or individual: 92.65%
Average age of principal farm operators: 55 years
Average number of cattle and calves per 100 acres of all land in farms: 11.27
Vegetables: 25 harvested acres
Land in orchards: 20 acres
Earthquake activity:
Clay County-area historical earthquake activity is significantly above Florida state average. It is 83% smaller than the overall U.S. average.On 9/10/2006 at 14:56:08, a magnitude 5.9 (5.9 MB, 5.5 MS, 5.8 MW, Class: Moderate, Intensity: VI - VII) earthquake occurred 391.4 miles away from Clay County center
On 11/22/1974 at 05:25:55, a magnitude 4.7 (4.7 MB, Class: Light, Intensity: IV - V) earthquake occurred 223.7 miles away from the county center
On 8/2/1974 at 08:52:09, a magnitude 4.9 (4.3 MB, 4.9 LG) earthquake occurred 270.6 miles away from the county center
On 8/21/1992 at 16:31:55, a magnitude 4.4 (4.1 MB, 4.1 LG, 4.4 LG, Depth: 6.2 mi) earthquake occurred 233.7 miles away from the county center
On 10/24/1997 at 08:35:17, a magnitude 4.9 (4.8 MB, 4.2 MS, 4.9 LG, Depth: 6.2 mi) earthquake occurred 333.6 miles away from Clay County center
On 9/4/2016 at 18:29:29, a magnitude 3.8 (3.8 ML, Class: Light, Intensity: II - III) earthquake occurred 136.8 miles away from the county center
Magnitude types: regional Lg-wave magnitude (LG), body-wave magnitude (MB), local magnitude (ML), surface-wave magnitude (MS), moment magnitude (MW)
Most recent natural disasters:
- Florida Covid-19 Pandemic, Incident Period: January 20, 2020, FEMA Id: 4486, Natural disaster type: Other
- Florida Hurricane Irma, Incident Period: September 4, 2017 - October 18, 2017, FEMA Id: 4337, Natural disaster type: Hurricane
- Florida Hurricane Matthew, Incident Period: October 03, 2016 to October 19, 2016, Emergency Declared EM-3377: October 06, 2016, FEMA Id: 3377, Natural disaster type: Hurricane
- Florida Hurricane Matthew, Incident Period: October 03, 2016 to October 19, 2016, Major Disaster (Presidential) Declared DR-4283: October 08, 2016, FEMA Id: 4283, Natural disaster type: Hurricane
- Florida Tropical Storm Debby, Incident Period: June 23, 2012 to July 26, 2012, Major Disaster (Presidential) Declared DR-4068: July 03, 2012, FEMA Id: 4068, Natural disaster type: Tropical Storm
- Florida Severe Storms, Flooding, Tornadoes, and Straight-line Winds, Incident Period: May 17, 2009 to May 28, 2009, Major Disaster (Presidential) Declared DR-1840: May 27, 2009, FEMA Id: 1840, Natural disaster type: Storm, Tornado, Flood, Wind
- Florida Tropical Storm Fay, Incident Period: August 18, 2008 to September 12, 2008, Major Disaster (Presidential) Declared DR-1785: August 24, 2008, FEMA Id: 1785, Natural disaster type: Tropical Storm
- Florida Tropical Storm Fay, Incident Period: August 18, 2008 to September 12, 2008, Emergency Declared EM-3288: August 21, 2008, FEMA Id: 3288, Natural disaster type: Tropical Storm
- Florida Suwannee Fire Complex, Incident Period: May 07, 2007 to December 31, 1969, Fire Management Assistance Declared: May 07, 2007, FEMA Id: 2689, Natural disaster type: Fire
- Florida Hurricane Katrina Evacuation, Incident Period: August 29, 2005 to October 01, 2005, Emergency Declared EM-3220: September 05, 2005, FEMA Id: 3220, Natural disaster type: Hurricane
- 11 other natural disasters have been reported since 1953.
The number of natural disasters in Clay County (21) is greater than the US average (15).
Major Disasters (Presidential) Declared: 12
Emergencies Declared: 4
Causes of natural disasters: Hurricanes: 8, Fires: 5, Tropical Storms: 4, Floods: 3, Storms: 3, Tornadoes: 3, Wind: 1, Other: 1 (Note: some incidents may be assigned to more than one category).
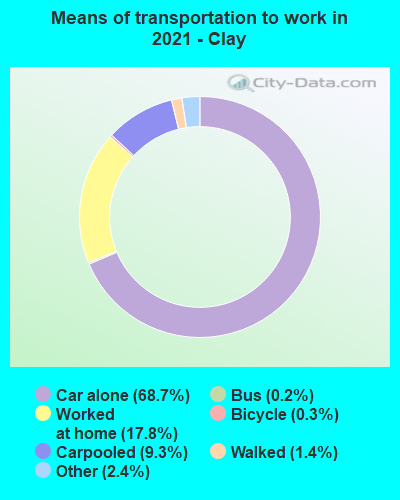
Means of transportation to work:
- Drove a car alone: 42,266 (62.4%)
- Carpooled: 5,980 (8.8%)
- Bus: 93 (0.1%)
- Taxicab, motorcycle, or other means: 1,611 (2.4%)
- Bicycle: 209 (0.3%)
- Walked: 1,175 (1.7%)
- Worked at home: 18,863 (27.9%)
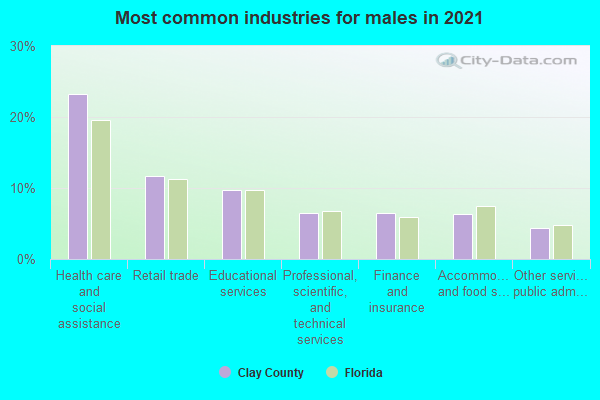
- Health care and social assistance (23%)
- Retail trade (13%)
- Finance and insurance (10%)
- Educational services (10%)
- Accommodation and food services (5%)
- Professional, scientific, and technical services (5%)
- Transportation and warehousing (4%)
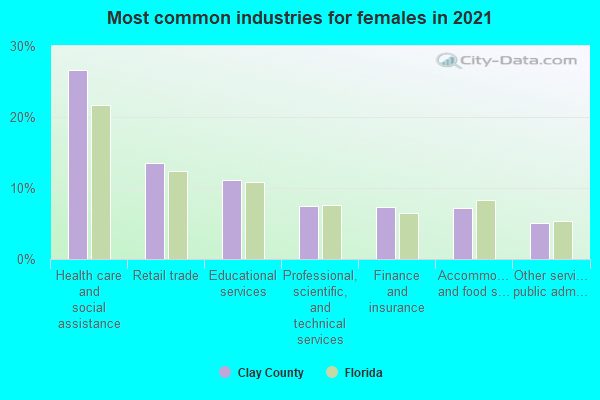
- Health care and social assistance (25%)
- Retail trade (15%)
- Finance and insurance (11%)
- Educational services (11%)
- Accommodation and food services (6%)
- Professional, scientific, and technical services (5%)
- Transportation and warehousing (5%)
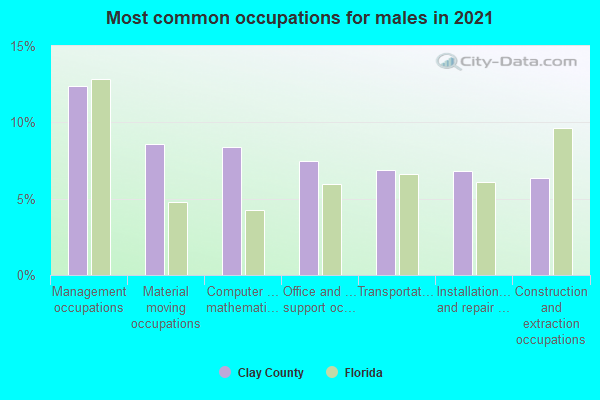
- Management occupations (13%)
- Transportation occupations (12%)
- Sales and related occupations (11%)
- Installation, maintenance, and repair occupations (9%)
- Construction and extraction occupations (8%)
- Food preparation and serving related occupations (5%)
- Office and administrative support occupations (5%)
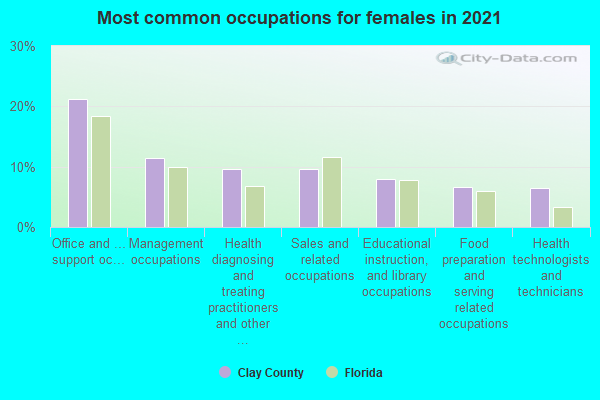
- Office and administrative support occupations (22%)
- Management occupations (13%)
- Sales and related occupations (12%)
- Educational instruction, and library occupations (9%)
- Business and financial operations occupations (8%)
- Health diagnosing and treating practitioners and other technical occupations (6%)
- Food preparation and serving related occupations (6%)
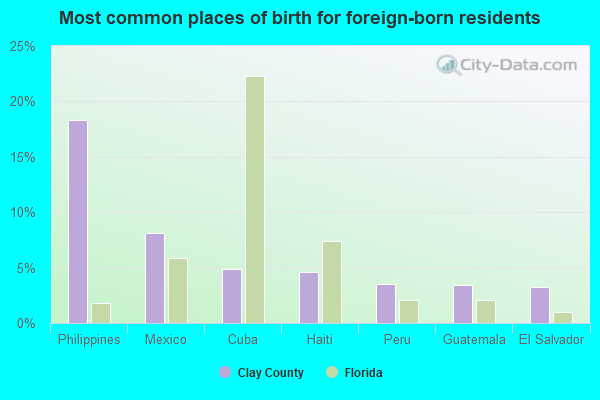
- Philippines (18%)
- Mexico (7%)
- Cuba (5%)
- Haiti (5%)
- El Salvador (4%)
- Guatemala (3%)
- Canada (3%)
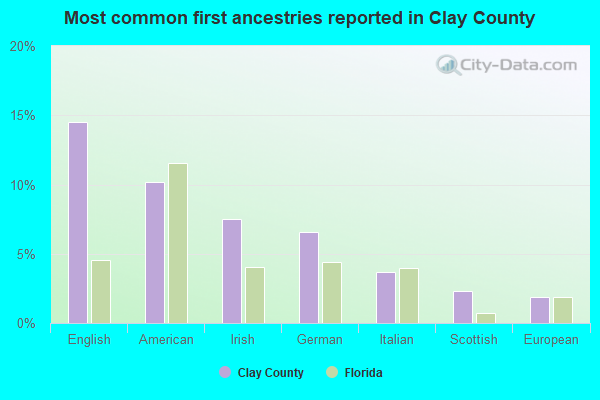
- English (15%)
- American (9%)
- Irish (7%)
- German (6%)
- Italian (4%)
- Scottish (2%)
- European (2%)
People in group quarters in Clay County, Florida in 2010:
- 596 people in nursing facilities/skilled-nursing facilities
- 468 people in local jails and other municipal confinement facilities
- 95 people in group homes intended for adults
- 52 people in group homes for juveniles (non-correctional)
- 28 people in residential treatment centers for juveniles (non-correctional)
- 6 people in residential treatment centers for adults
- 3 people in in-patient hospice facilities
- 3 people in other noninstitutional facilities
People in group quarters in Clay County, Florida in 2000:
- 691 people in nursing homes
- 494 people in other noninstitutional group quarters
- 245 people in local jails and other confinement facilities (including police lockups)
- 56 people in college dormitories (includes college quarters off campus)
- 53 people in hospitals/wards and hospices for chronically ill
- 53 people in other hospitals or wards for chronically ill
- 23 people in other nonhousehold living situations
- 4 people in military barracks, etc.
11.08% of this county's 2021 resident taxpayers lived in other counties in 2020 ($64,626 average adjusted gross income)
| Here: | 11.08% |
| Florida average: | 8.80% |
0.09% of residents moved from foreign countries ($578 average AGI)
Clay County: 0.09% Florida average: 0.05%
6.83% relocated from other counties in Florida ($35,655 average AGI)
4.15% relocated from other states ($28,392 average AGI)
Clay County: 4.15% Florida average: 4.38%
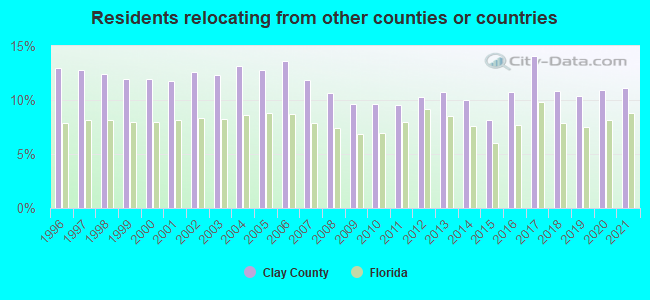
Top counties from which taxpayers relocated into this county between 2020 and 2021:
| from Duval County, FL | |
| from St. Johns County, FL | |
| from Alachua County, FL | |
| from Putnam County, FL | |
| from Broward County, FL | |
| from Orange County, FL | |
| from Bradford County, FL |
9.60% of this county's 2020 resident taxpayers moved to other counties in 2021 ($59,843 average adjusted gross income)
| Here: | 9.60% |
| Florida average: | 7.45% |
0.08% of residents moved to foreign countries ($483 average AGI)
Clay County: 0.08% Florida average: 0.04%
6.46% relocated to other counties in Florida ($38,348 average AGI)
3.07% relocated to other states ($21,012 average AGI)
Clay County: 3.07% Florida average: 2.97%
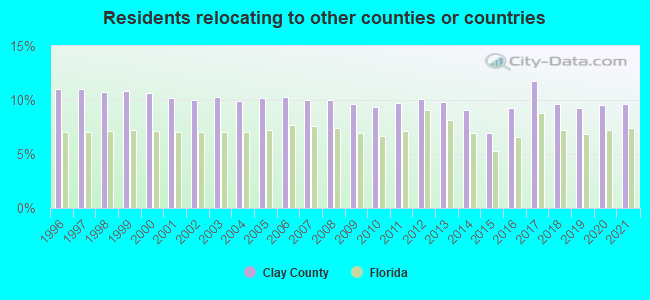
Top counties to which taxpayers relocated from this county between 2020 and 2021:
| to Duval County, FL | |
| to St. Johns County, FL | |
| to Putnam County, FL | |
| to Bradford County, FL | |
| to Alachua County, FL | |
| to Nassau County, FL | |
| to Hillsborough County, FL |
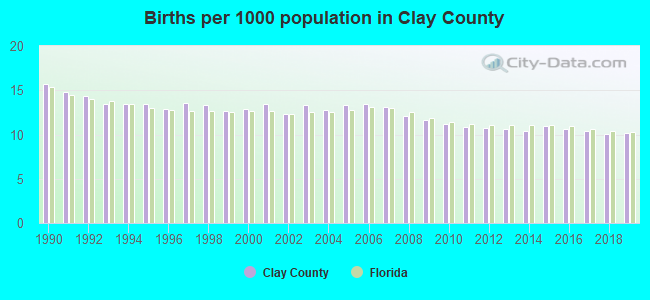
Births per 1000 population from 1990 to 1999: 13.8
Births per 1000 population from 2000 to 2009: 12.8
Births per 1000 population from 2010 to 2022: 8.9
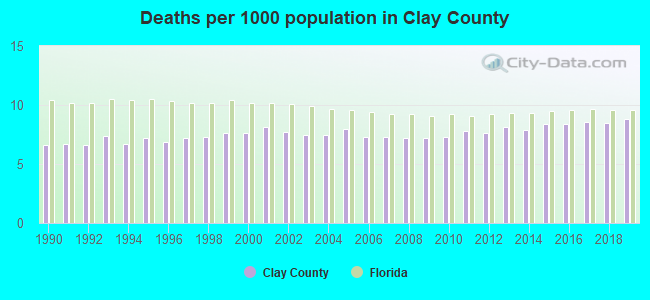
Deaths per 1000 population from 1990 to 1999: 7.0
Deaths per 1000 population from 2000 to 2009: 7.5
Deaths per 1000 population from 2010 to 2020: 8.3
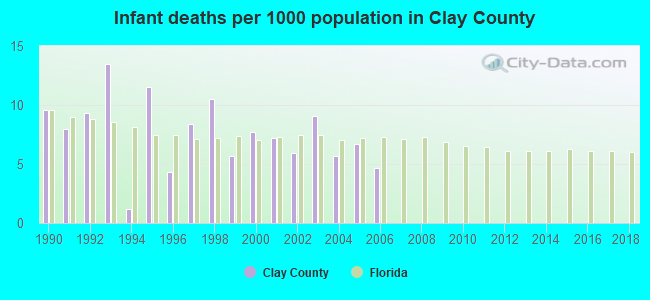
Infant deaths per 1000 live births from 1990 to 1999: 8.2
Infant deaths per 1000 live births from 2000 to 2006: 6.7
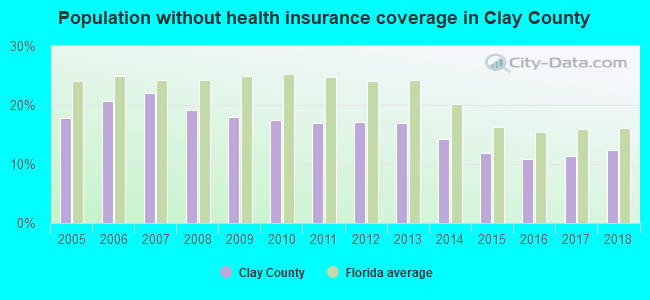
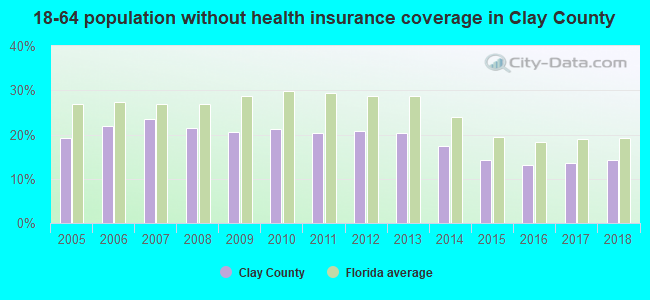
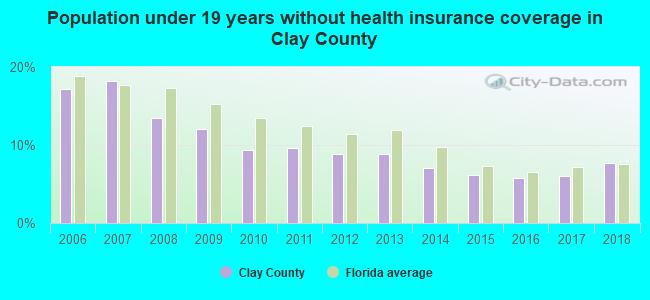
Persons under 19 years old without health insurance coverage in 2018: 7.7%
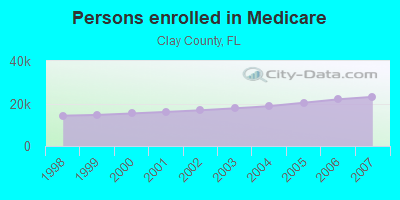
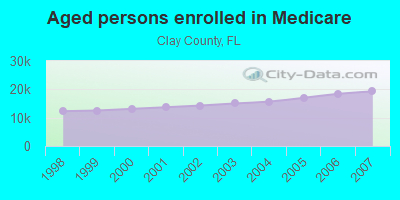
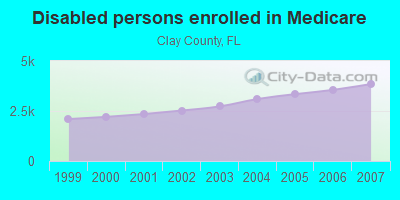
Persons enrolled in hospital insurance and/or supplemental medical insurance (Medicare) in July 1, 2007: 23,127 (19,279 aged, 3,848 disabled)
Children under 18 without health insurance coverage in 2007: 8,410 (18%)
Most common underlying causes of death in Clay County, Florida in 1999 - 2019:
- Bronchus or lung, unspecified - Malignant neoplasms (2,268)
- Atherosclerotic heart disease (1,981)
- Chronic obstructive pulmonary disease, unspecified (1,678)
- Acute myocardial infarction, unspecified (1,250)
- Unspecified dementia (1,030)
- Alzheimer disease, unspecified (848)
- Stroke, not specified as haemorrhage or infarction (768)
- Colon, unspecified - Malignant neoplasms (524)
- Generalized and unspecified atherosclerosis (518)
- Breast, unspecified - Malignant neoplasms (483)
Population without health insurance coverage in 2000: 12%
Children under 18 without health insurance coverage in 2000: 11%
Short term general hospital admissions per 100,000 population in 2004: 8,084
Short term general hospital beds per 100,000 population in 2004: 140
Emergency room visits per 100,000 population in 2004: 33,844
General practice office based MDs per 100,000 population in 2005: 1,305
Medical specialist MDs per 100,000 population in 2005: 763
Dentists per 100,000 population in 1998: 6
Total births per 100,000 population, July 2005 - July 2006 : 41
Total deaths per 100,000 population, July 2005 - July 2006: 70
Limited-service eating places per 100,000 population in 2005 : 13
Homicides per 1,000,000 population from 2000 to 2006: 41.8. This is less than state average.
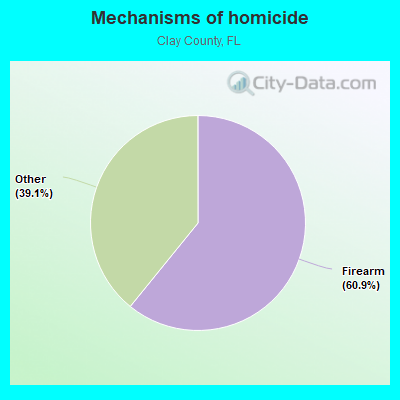
- Firearm - 25.5
- Other - 16.4
Suicides per 1,000,000 population from 2000 to 2006: 149.1. This is more than state average.
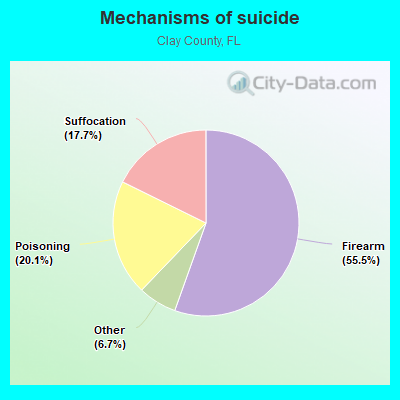
- Firearm - 82.7
- Poisoning - 30.0
- Suffocation - 26.4
- Other - 10.0
Household type by relationship:
Households: 226,589- Male householders: 42,891 (9,296 living alone), Female householders: 42,362 (9,067 living alone)
48,572 spouses (48,283 opposite-sex spouses), 6,495 unmarried partners, (6,218 opposite-sex unmarried partners), 65,006 children (59,798 natural, 1,019 adopted, 4,189 stepchildren), 2,982 grandchildren, 2,235 brothers or sisters, 4,496 parents, 103 foster children, 3,752 other relatives, 5,309 non-relatives
- In group quarters: 2,386
Size of family households: 26,896 2-persons, 14,848 3-persons, 12,792 4-persons, 4,356 5-persons, 2,250 6-persons, 1,334 7-or-more-persons.
Size of nonfamily households: 18,363 1-person, 3,585 2-persons, 252 3-persons, 545 4-persons, 32 5-persons.
34,239 married couples with children.
11,130 single-parent households (2,809 men, 8,321 women).
88.5% of residents of Clay speak English at home.
6.4% of residents speak Spanish at home (67% speak English very well, 14% speak English well, 13% speak English not well, 6% don't speak English at all).
2.1% of residents speak other Indo-European language at home (80% speak English very well, 16% speak English well, 3% speak English not well, 1% don't speak English at all).
1.9% of residents speak Asian or Pacific Island language at home (63% speak English very well, 24% speak English well, 11% speak English not well, 2% don't speak English at all).
0.5% of residents speak other language at home (67% speak English very well, 28% speak English well, 2% speak English not well, 3% don't speak English at all).
In fiscal year 2004:
Federal Government expenditure: $722,022,000 ($4,392 per capita)
Department of Defense expenditure: $198,212,000
Federal direct payments to individuals for retirement and disability: $533,362,000
Federal other direct payments to individuals: $107,454,000
Federal direct payments not to individuals: $112,000
Federal grants: $47,055,000
Federal procurement contracts: $10,369,000 ($6,757,000 Department of Defense)
Federal salaries and wages: $23,669,000 ($10,112,000 Department of Defense)
Federal Government direct loans: $2,727,000
Federal guaranteed/insured loans: $244,448,000
Federal Government insurance: $653,484,000
Population change from April 1, 2000 to July 1, 2005:
Births: 10,440| Here: | 61 per 1000 residents |
| State: | 63 per 1000 residents |
Deaths: 6,118
| Here: | 36 per 1000 residents |
| State: | 49 per 1000 residents |
Net international migration: +907
| Here: | +5 per 1000 residents |
| State: | +30 per 1000 residents |
Net internal migration: +25,384
| Here: | +148 per 1000 residents |
| State: | +59 per 1000 residents |
Total withdrawal of fresh water for public supply: 14.77 millions of gallons per day (all from ground)
| Here: | 6.6 |
| State: | 5.9 |
| Here: | 4.7 |
| State: | 4.2 |
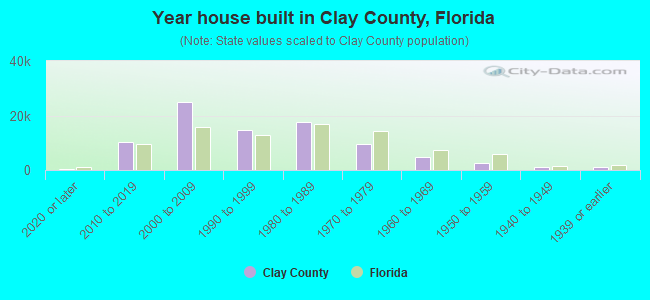
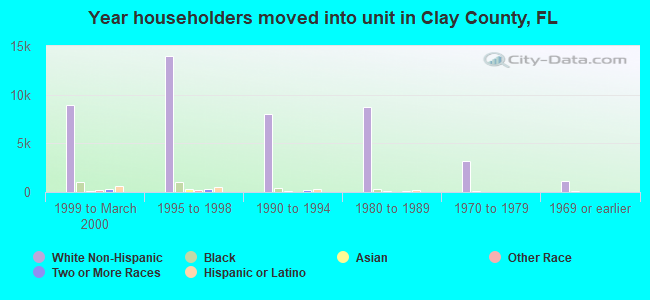
- Year house built in Clay County, Florida
- 3,6632020 or later
- 10,3942010 to 2019
- 24,6192000 to 2009
- 16,2111990 to 1999
- 14,4211980 to 1989
- 11,4101970 to 1979
- 4,9401960 to 1969
- 1,8551950 to 1959
- 9511940 to 1949
- 5221939 or earlier
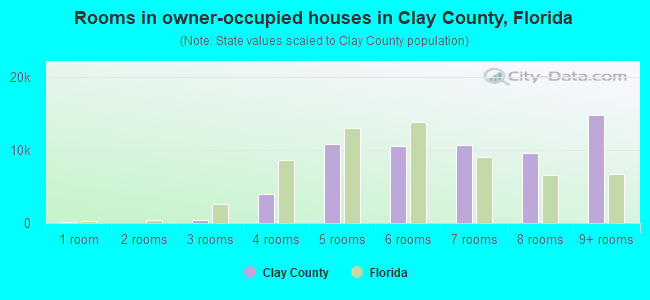
- Rooms in owner-occupied houses in Clay County, Florida
- 1771 room
- 1452 rooms
- 9233 rooms
- 7,0164 rooms
- 9,9835 rooms
- 12,6086 rooms
- 13,4637 rooms
- 10,1118 rooms
- 10,6639+ rooms
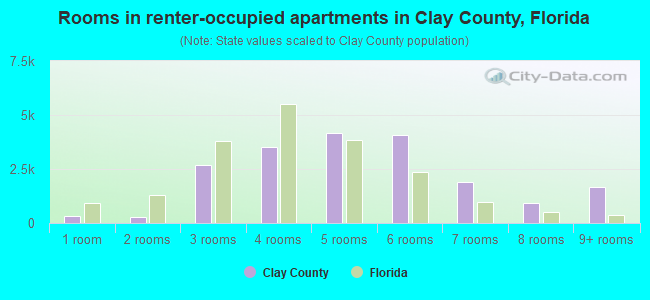
- Rooms in renter-occupied apartments in Clay County, Florida
- 3291 room
- 1,1252 rooms
- 2,2433 rooms
- 5,6244 rooms
- 4,5575 rooms
- 3,0246 rooms
- 1,2657 rooms
- 1,1108 rooms
- 8879+ rooms
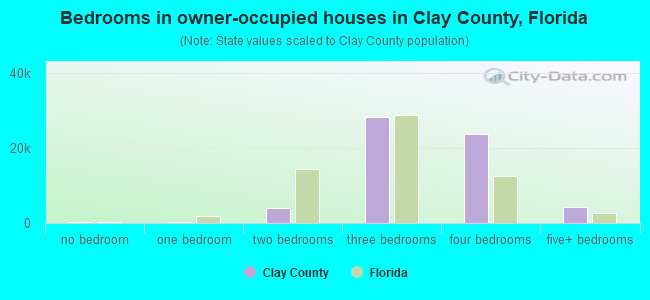
- Bedrooms in owner-occupied houses in Clay County, Florida
- 177no bedroom
- 8651 bedroom
- 5,6022 bedrooms
- 31,0503 bedrooms
- 22,5494 bedrooms
- 4,8465+ bedrooms
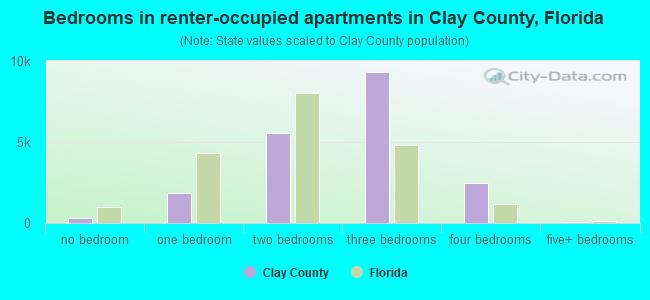
- Bedrooms in renter-occupied apartments in Clay County, Florida
- 329no bedroom
- 2,9111 bedroom
- 7,6122 bedrooms
- 6,1643 bedrooms
- 2,5984 bedrooms
- 5505+ bedrooms
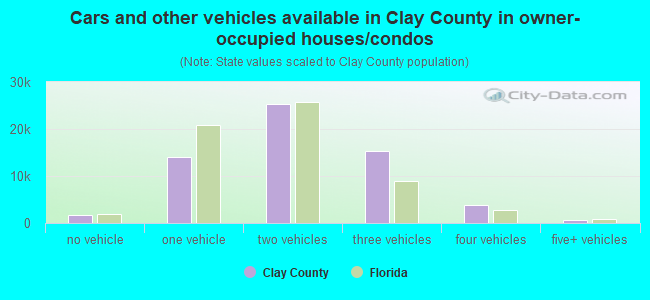
- Cars and other vehicles available in Clay County in owner-occupied houses/condos
- 1,759no vehicle
- 16,1751 vehicle
- 30,4872 vehicles
- 12,2813 vehicles
- 3,1904 vehicles
- 1,1975+ vehicles
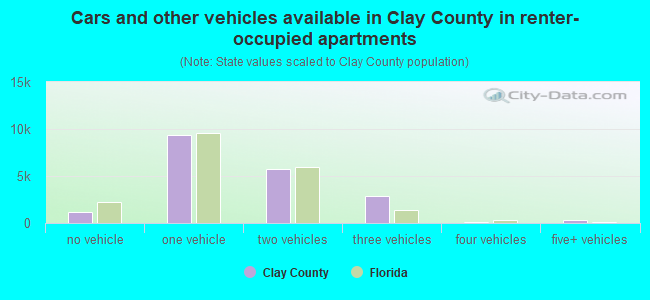
- Cars and other vehicles available in Clay County in renter-occupied apartments
- 1,353no vehicle
- 9,8621 vehicle
- 5,7402 vehicles
- 2,0813 vehicles
- 8664 vehicles
- 2625+ vehicles
87.5% of Clay County residents lived in the same house 1 years ago.
Out of people who lived in different houses, 31% lived in this county.
Out of people who lived in different counties, 66% lived in Florida.
| Clay County: | 87.5% |
| State average: | 86.3% |
Place of birth for U.S.-born residents:
- This state: 95,537
- Other state: 107,381
- Northeast: 30,060
- Midwest: 22,282
- South: 43,673
- West: 11,366
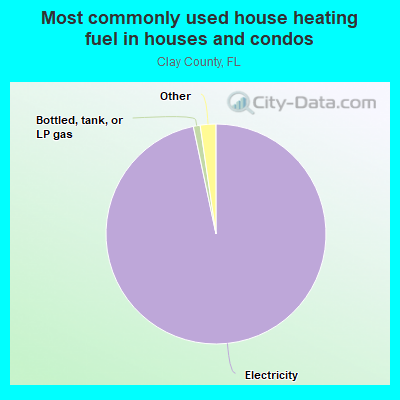
- 96.0%Electricity
- 1.4%Bottled, tank, or LP gas
- 1.2%Utility gas
- 0.9%No fuel used
- 0.2%Wood
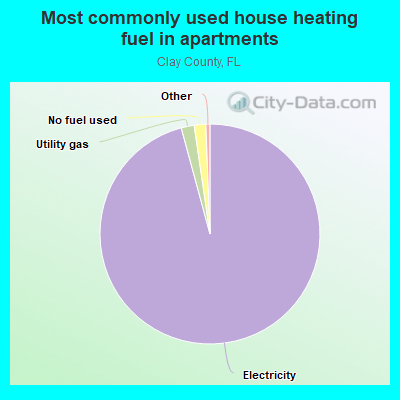
- 95.3%Electricity
- 2.6%Utility gas
- 1.4%No fuel used
- 0.4%Bottled, tank, or LP gas
- 0.1%Solar energy
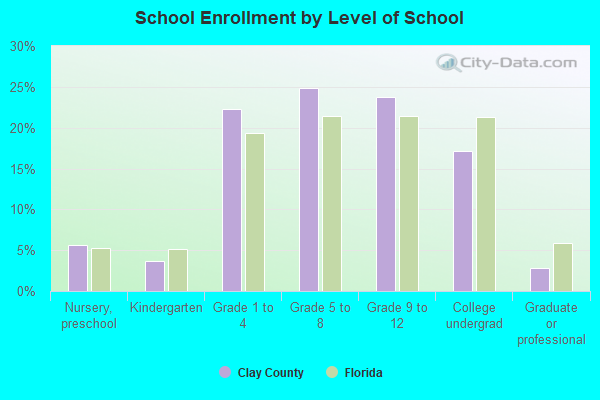
Private vs. public school enrollment:
| Here: | 10.0% |
| Florida: | 15.8% |
| Here: | 14.1% |
| Florida: | 12.9% |
| Here: | 14.4% |
| Florida: | 23.6% |
Clay County government finances - Expenditure in 2020:
- Charges - Solid Waste Management: $18,655,000
Other: $18,333,000
Solid Waste Management: $17,337,000
Other: $13,971,000
Housing and Community Development: $1,757,000
Housing and Community Development: $375,000
- Construction - Regular Highways: $24,982,000
Regular Highways: $11,715,000
General - Other: $252,000
General - Other: $192,000
- Current Operations - Police Protection: $41,057,000
Police Protection: $38,470,000
Financial Administration: $36,499,000
Financial Administration: $35,578,000
Solid Waste Management: $19,334,000
Solid Waste Management: $17,482,000
Health - Other: $16,086,000
Health - Other: $13,626,000
Correctional Institutions: $12,498,000
Correctional Institutions: $12,004,000
General - Other: $10,976,000
Regular Highways: $10,628,000
General - Other: $8,214,000
Regular Highways: $7,955,000
Judicial and Legal Services: $6,689,000
Judicial and Legal Services: $5,594,000
Central Staff Services: $5,293,000
Local Fire Protection: $5,258,000
Public Welfare - Other: $4,575,000
Central Staff Services: $4,421,000
Public Welfare - Other: $4,338,000
Local Fire Protection: $4,132,000
Libraries: $3,884,000
Parking Facilities: $2,353,000
Libraries: $2,349,000
Parks and Recreation: $2,120,000
Parking Facilities: $2,007,000
Parks and Recreation: $1,931,000
General Public Buildings: $1,490,000
Natural Resources - Other: $1,419,000
Natural Resources - Other: $1,372,000
General Public Buildings: $1,265,000
Housing and Community Development: $1,180,000
Housing and Community Development: $954,000
Transit Utilities: $74,000
Transit Utilities: $71,000
- Federal Intergovernmental - Other: $9,641,000
Other: $1,050,000
Public Welfare: $29,000
Public Welfare: $26,000
- General - Interest on Debt: $920,000
Interest on Debt: $13,000
- Intergovernmental to State - Health - Other: $2,100,000
Health - Other: $2,100,000
- Local Intergovernmental - General Local Government Support: $1,978,000
Other: $1,924,000
General Local Government Support: $1,859,000
Other: $451,000
- Long Term Debt - Beginning Outstanding - Unspecified Public Purpose: $17,611,000
Beginning Outstanding - Public Debt for Private Purpose: $12,194,000
Outstanding Nonguaranteed - Industrial Revenue: $12,094,000
Beginning Outstanding - Public Debt for Private Purpose: $11,994,000
Outstanding Nonguaranteed - Industrial Revenue: $11,894,000
Outstanding Unspecified Public Purpose: $8,990,000
Retired Unspecified Public Purpose: $8,621,000
Retired Nonguaranteed - Public Debt for Private Purpose: $100,000
Retired Nonguaranteed - Public Debt for Private Purpose: $100,000
- Miscellaneous - General Revenue - Other: $21,247,000
General Revenue - Other: $19,115,000
Special Assessments: $8,416,000
Interest Earnings: $3,530,000
Fines and Forfeits: $1,246,000
Interest Earnings: $1,144,000
Fines and Forfeits: $1,087,000
Sale of Property: $232,000
Rents: $220,000
Rents: $175,000
Special Assessments: $171,000
Donations From Private Sources: $26,000
Sale of Property: $14,000
Donations From Private Sources: $4,000
- Other Capital Outlay - Police Protection: $2,121,000
Natural Resources - Other: $1,340,000
Police Protection: $1,223,000
Parks and Recreation: $984,000
Health - Other: $494,000
Parks and Recreation: $391,000
Financial Administration: $386,000
Libraries: $231,000
Financial Administration: $230,000
Solid Waste Management: $170,000
Health - Other: $153,000
Judicial and Legal Services: $150,000
Judicial and Legal Services: $76,000
Correctional Institutions: $66,000
Correctional Institutions: $51,000
Natural Resources - Other: $50,000
Local Fire Protection: $31,000
Local Fire Protection: $17,000
Public Welfare - Other: $17,000
Central Staff Services: $12,000
Libraries: $6,000
Parking Facilities: $5,000
Solid Waste Management: $1,000
- Other Funds - Cash and Securities: $176,121,000
Cash and Securities: $146,670,000
- Sinking Funds - Cash and Securities: $20,444,000
Cash and Securities: $11,894,000
- State Intergovernmental - General Local Government Support: $17,455,000
General Local Government Support: $15,951,000
Highways: $3,865,000
Highways: $3,750,000
Other: $3,495,000
Other: $3,374,000
Health and Hospitals: $223,000
Health and Hospitals: $223,000
Public Welfare: $34,000
Public Welfare: $31,000
- Tax - Property: $80,469,000
Property: $70,426,000
General Sales and Gross Receipts: $22,871,000
General Sales and Gross Receipts: $18,195,000
Public Utilities Sales: $9,349,000
Public Utilities Sales: $9,286,000
Motor Fuels Sales: $5,183,000
Motor Fuels Sales: $5,046,000
Other License: $2,922,000
Other License: $2,730,000
Occupation and Business License - Other: $1,460,000
Occupation and Business License - Other: $1,392,000
Documentary and Stock Transfer: $1,284,000
Documentary and Stock Transfer: $1,222,000
Other Selective Sales: $1,215,000
Other Selective Sales: $604,000
Clay County government finances - Revenue in 2020:
- Charges - Solid Waste Management: $18,655,000
Other: $18,333,000
Solid Waste Management: $17,337,000
Other: $13,971,000
Housing and Community Development: $1,757,000
Housing and Community Development: $375,000
- Construction - Regular Highways: $24,982,000
Regular Highways: $11,715,000
General - Other: $252,000
General - Other: $192,000
- Current Operations - Police Protection: $41,057,000
Police Protection: $38,470,000
Financial Administration: $36,499,000
Financial Administration: $35,578,000
Solid Waste Management: $19,334,000
Solid Waste Management: $17,482,000
Health - Other: $16,086,000
Health - Other: $13,626,000
Correctional Institutions: $12,498,000
Correctional Institutions: $12,004,000
General - Other: $10,976,000
Regular Highways: $10,628,000
General - Other: $8,214,000
Regular Highways: $7,955,000
Judicial and Legal Services: $6,689,000
Judicial and Legal Services: $5,594,000
Central Staff Services: $5,293,000
Local Fire Protection: $5,258,000
Public Welfare - Other: $4,575,000
Central Staff Services: $4,421,000
Public Welfare - Other: $4,338,000
Local Fire Protection: $4,132,000
Libraries: $3,884,000
Parking Facilities: $2,353,000
Libraries: $2,349,000
Parks and Recreation: $2,120,000
Parking Facilities: $2,007,000
Parks and Recreation: $1,931,000
General Public Buildings: $1,490,000
Natural Resources - Other: $1,419,000
Natural Resources - Other: $1,372,000
General Public Buildings: $1,265,000
Housing and Community Development: $1,180,000
Housing and Community Development: $954,000
Transit Utilities: $74,000
Transit Utilities: $71,000
- Federal Intergovernmental - Other: $9,641,000
Other: $1,050,000
Public Welfare: $29,000
Public Welfare: $26,000
- General - Interest on Debt: $920,000
Interest on Debt: $13,000
- Intergovernmental to State - Health - Other: $2,100,000
Health - Other: $2,100,000
- Local Intergovernmental - General Local Government Support: $1,978,000
Other: $1,924,000
General Local Government Support: $1,859,000
Other: $451,000
- Long Term Debt - Beginning Outstanding - Unspecified Public Purpose: $17,611,000
Beginning Outstanding - Public Debt for Private Purpose: $12,194,000
Outstanding Nonguaranteed - Industrial Revenue: $12,094,000
Beginning Outstanding - Public Debt for Private Purpose: $11,994,000
Outstanding Nonguaranteed - Industrial Revenue: $11,894,000
Outstanding Unspecified Public Purpose: $8,990,000
Retired Unspecified Public Purpose: $8,621,000
Retired Nonguaranteed - Public Debt for Private Purpose: $100,000
Retired Nonguaranteed - Public Debt for Private Purpose: $100,000
- Miscellaneous - General Revenue - Other: $21,247,000
General Revenue - Other: $19,115,000
Special Assessments: $8,416,000
Interest Earnings: $3,530,000
Fines and Forfeits: $1,246,000
Interest Earnings: $1,144,000
Fines and Forfeits: $1,087,000
Sale of Property: $232,000
Rents: $220,000
Rents: $175,000
Special Assessments: $171,000
Donations From Private Sources: $26,000
Sale of Property: $14,000
Donations From Private Sources: $4,000
- Other Capital Outlay - Police Protection: $2,121,000
Natural Resources - Other: $1,340,000
Police Protection: $1,223,000
Parks and Recreation: $984,000
Health - Other: $494,000
Parks and Recreation: $391,000
Financial Administration: $386,000
Libraries: $231,000
Financial Administration: $230,000
Solid Waste Management: $170,000
Health - Other: $153,000
Judicial and Legal Services: $150,000
Judicial and Legal Services: $76,000
Correctional Institutions: $66,000
Correctional Institutions: $51,000
Natural Resources - Other: $50,000
Local Fire Protection: $31,000
Local Fire Protection: $17,000
Public Welfare - Other: $17,000
Central Staff Services: $12,000
Libraries: $6,000
Parking Facilities: $5,000
Solid Waste Management: $1,000
- Other Funds - Cash and Securities: $176,121,000
Cash and Securities: $146,670,000
- Sinking Funds - Cash and Securities: $20,444,000
Cash and Securities: $11,894,000
- State Intergovernmental - General Local Government Support: $17,455,000
General Local Government Support: $15,951,000
Highways: $3,865,000
Highways: $3,750,000
Other: $3,495,000
Other: $3,374,000
Health and Hospitals: $223,000
Health and Hospitals: $223,000
Public Welfare: $34,000
Public Welfare: $31,000
- Tax - Property: $80,469,000
Property: $70,426,000
General Sales and Gross Receipts: $22,871,000
General Sales and Gross Receipts: $18,195,000
Public Utilities Sales: $9,349,000
Public Utilities Sales: $9,286,000
Motor Fuels Sales: $5,183,000
Motor Fuels Sales: $5,046,000
Other License: $2,922,000
Other License: $2,730,000
Occupation and Business License - Other: $1,460,000
Occupation and Business License - Other: $1,392,000
Documentary and Stock Transfer: $1,284,000
Documentary and Stock Transfer: $1,222,000
Other Selective Sales: $1,215,000
Other Selective Sales: $604,000
Clay County government finances - Debt in 2020:
- Charges - Solid Waste Management: $18,655,000
Other: $18,333,000
Solid Waste Management: $17,337,000
Other: $13,971,000
Housing and Community Development: $1,757,000
Housing and Community Development: $375,000
- Construction - Regular Highways: $24,982,000
Regular Highways: $11,715,000
General - Other: $252,000
General - Other: $192,000
- Current Operations - Police Protection: $41,057,000
Police Protection: $38,470,000
Financial Administration: $36,499,000
Financial Administration: $35,578,000
Solid Waste Management: $19,334,000
Solid Waste Management: $17,482,000
Health - Other: $16,086,000
Health - Other: $13,626,000
Correctional Institutions: $12,498,000
Correctional Institutions: $12,004,000
General - Other: $10,976,000
Regular Highways: $10,628,000
General - Other: $8,214,000
Regular Highways: $7,955,000
Judicial and Legal Services: $6,689,000
Judicial and Legal Services: $5,594,000
Central Staff Services: $5,293,000
Local Fire Protection: $5,258,000
Public Welfare - Other: $4,575,000
Central Staff Services: $4,421,000
Public Welfare - Other: $4,338,000
Local Fire Protection: $4,132,000
Libraries: $3,884,000
Parking Facilities: $2,353,000
Libraries: $2,349,000
Parks and Recreation: $2,120,000
Parking Facilities: $2,007,000
Parks and Recreation: $1,931,000
General Public Buildings: $1,490,000
Natural Resources - Other: $1,419,000
Natural Resources - Other: $1,372,000
General Public Buildings: $1,265,000
Housing and Community Development: $1,180,000
Housing and Community Development: $954,000
Transit Utilities: $74,000
Transit Utilities: $71,000
- Federal Intergovernmental - Other: $9,641,000
Other: $1,050,000
Public Welfare: $29,000
Public Welfare: $26,000
- General - Interest on Debt: $920,000
Interest on Debt: $13,000
- Intergovernmental to State - Health - Other: $2,100,000
Health - Other: $2,100,000
- Local Intergovernmental - General Local Government Support: $1,978,000
Other: $1,924,000
General Local Government Support: $1,859,000
Other: $451,000
- Long Term Debt - Beginning Outstanding - Unspecified Public Purpose: $17,611,000
Beginning Outstanding - Public Debt for Private Purpose: $12,194,000
Outstanding Nonguaranteed - Industrial Revenue: $12,094,000
Beginning Outstanding - Public Debt for Private Purpose: $11,994,000
Outstanding Nonguaranteed - Industrial Revenue: $11,894,000
Outstanding Unspecified Public Purpose: $8,990,000
Retired Unspecified Public Purpose: $8,621,000
Retired Nonguaranteed - Public Debt for Private Purpose: $100,000
Retired Nonguaranteed - Public Debt for Private Purpose: $100,000
- Miscellaneous - General Revenue - Other: $21,247,000
General Revenue - Other: $19,115,000
Special Assessments: $8,416,000
Interest Earnings: $3,530,000
Fines and Forfeits: $1,246,000
Interest Earnings: $1,144,000
Fines and Forfeits: $1,087,000
Sale of Property: $232,000
Rents: $220,000
Rents: $175,000
Special Assessments: $171,000
Donations From Private Sources: $26,000
Sale of Property: $14,000
Donations From Private Sources: $4,000
- Other Capital Outlay - Police Protection: $2,121,000
Natural Resources - Other: $1,340,000
Police Protection: $1,223,000
Parks and Recreation: $984,000
Health - Other: $494,000
Parks and Recreation: $391,000
Financial Administration: $386,000
Libraries: $231,000
Financial Administration: $230,000
Solid Waste Management: $170,000
Health - Other: $153,000
Judicial and Legal Services: $150,000
Judicial and Legal Services: $76,000
Correctional Institutions: $66,000
Correctional Institutions: $51,000
Natural Resources - Other: $50,000
Local Fire Protection: $31,000
Local Fire Protection: $17,000
Public Welfare - Other: $17,000
Central Staff Services: $12,000
Libraries: $6,000
Parking Facilities: $5,000
Solid Waste Management: $1,000
- Other Funds - Cash and Securities: $176,121,000
Cash and Securities: $146,670,000
- Sinking Funds - Cash and Securities: $20,444,000
Cash and Securities: $11,894,000
- State Intergovernmental - General Local Government Support: $17,455,000
General Local Government Support: $15,951,000
Highways: $3,865,000
Highways: $3,750,000
Other: $3,495,000
Other: $3,374,000
Health and Hospitals: $223,000
Health and Hospitals: $223,000
Public Welfare: $34,000
Public Welfare: $31,000
- Tax - Property: $80,469,000
Property: $70,426,000
General Sales and Gross Receipts: $22,871,000
General Sales and Gross Receipts: $18,195,000
Public Utilities Sales: $9,349,000
Public Utilities Sales: $9,286,000
Motor Fuels Sales: $5,183,000
Motor Fuels Sales: $5,046,000
Other License: $2,922,000
Other License: $2,730,000
Occupation and Business License - Other: $1,460,000
Occupation and Business License - Other: $1,392,000
Documentary and Stock Transfer: $1,284,000
Documentary and Stock Transfer: $1,222,000
Other Selective Sales: $1,215,000
Other Selective Sales: $604,000
Clay County government finances - Cash and Securities in 2020:
- Charges - Solid Waste Management: $18,655,000
Other: $18,333,000
Solid Waste Management: $17,337,000
Other: $13,971,000
Housing and Community Development: $1,757,000
Housing and Community Development: $375,000
- Construction - Regular Highways: $24,982,000
Regular Highways: $11,715,000
General - Other: $252,000
General - Other: $192,000
- Current Operations - Police Protection: $41,057,000
Police Protection: $38,470,000
Financial Administration: $36,499,000
Financial Administration: $35,578,000
Solid Waste Management: $19,334,000
Solid Waste Management: $17,482,000
Health - Other: $16,086,000
Health - Other: $13,626,000
Correctional Institutions: $12,498,000
Correctional Institutions: $12,004,000
General - Other: $10,976,000
Regular Highways: $10,628,000
General - Other: $8,214,000
Regular Highways: $7,955,000
Judicial and Legal Services: $6,689,000
Judicial and Legal Services: $5,594,000
Central Staff Services: $5,293,000
Local Fire Protection: $5,258,000
Public Welfare - Other: $4,575,000
Central Staff Services: $4,421,000
Public Welfare - Other: $4,338,000
Local Fire Protection: $4,132,000
Libraries: $3,884,000
Parking Facilities: $2,353,000
Libraries: $2,349,000
Parks and Recreation: $2,120,000
Parking Facilities: $2,007,000
Parks and Recreation: $1,931,000
General Public Buildings: $1,490,000
Natural Resources - Other: $1,419,000
Natural Resources - Other: $1,372,000
General Public Buildings: $1,265,000
Housing and Community Development: $1,180,000
Housing and Community Development: $954,000
Transit Utilities: $74,000
Transit Utilities: $71,000
- Federal Intergovernmental - Other: $9,641,000
Other: $1,050,000
Public Welfare: $29,000
Public Welfare: $26,000
- General - Interest on Debt: $920,000
Interest on Debt: $13,000
- Intergovernmental to State - Health - Other: $2,100,000
Health - Other: $2,100,000
- Local Intergovernmental - General Local Government Support: $1,978,000
Other: $1,924,000
General Local Government Support: $1,859,000
Other: $451,000
- Long Term Debt - Beginning Outstanding - Unspecified Public Purpose: $17,611,000
Beginning Outstanding - Public Debt for Private Purpose: $12,194,000
Outstanding Nonguaranteed - Industrial Revenue: $12,094,000
Beginning Outstanding - Public Debt for Private Purpose: $11,994,000
Outstanding Nonguaranteed - Industrial Revenue: $11,894,000
Outstanding Unspecified Public Purpose: $8,990,000
Retired Unspecified Public Purpose: $8,621,000
Retired Nonguaranteed - Public Debt for Private Purpose: $100,000
Retired Nonguaranteed - Public Debt for Private Purpose: $100,000
- Miscellaneous - General Revenue - Other: $21,247,000
General Revenue - Other: $19,115,000
Special Assessments: $8,416,000
Interest Earnings: $3,530,000
Fines and Forfeits: $1,246,000
Interest Earnings: $1,144,000
Fines and Forfeits: $1,087,000
Sale of Property: $232,000
Rents: $220,000
Rents: $175,000
Special Assessments: $171,000
Donations From Private Sources: $26,000
Sale of Property: $14,000
Donations From Private Sources: $4,000
- Other Capital Outlay - Police Protection: $2,121,000
Natural Resources - Other: $1,340,000
Police Protection: $1,223,000
Parks and Recreation: $984,000
Health - Other: $494,000
Parks and Recreation: $391,000
Financial Administration: $386,000
Libraries: $231,000
Financial Administration: $230,000
Solid Waste Management: $170,000
Health - Other: $153,000
Judicial and Legal Services: $150,000
Judicial and Legal Services: $76,000
Correctional Institutions: $66,000
Correctional Institutions: $51,000
Natural Resources - Other: $50,000
Local Fire Protection: $31,000
Local Fire Protection: $17,000
Public Welfare - Other: $17,000
Central Staff Services: $12,000
Libraries: $6,000
Parking Facilities: $5,000
Solid Waste Management: $1,000
- Other Funds - Cash and Securities: $176,121,000
Cash and Securities: $146,670,000
- Sinking Funds - Cash and Securities: $20,444,000
Cash and Securities: $11,894,000
- State Intergovernmental - General Local Government Support: $17,455,000
General Local Government Support: $15,951,000
Highways: $3,865,000
Highways: $3,750,000
Other: $3,495,000
Other: $3,374,000
Health and Hospitals: $223,000
Health and Hospitals: $223,000
Public Welfare: $34,000
Public Welfare: $31,000
- Tax - Property: $80,469,000
Property: $70,426,000
General Sales and Gross Receipts: $22,871,000
General Sales and Gross Receipts: $18,195,000
Public Utilities Sales: $9,349,000
Public Utilities Sales: $9,286,000
Motor Fuels Sales: $5,183,000
Motor Fuels Sales: $5,046,000
Other License: $2,922,000
Other License: $2,730,000
Occupation and Business License - Other: $1,460,000
Occupation and Business License - Other: $1,392,000
Documentary and Stock Transfer: $1,284,000
Documentary and Stock Transfer: $1,222,000
Other Selective Sales: $1,215,000
Other Selective Sales: $604,000
Supplemental Security Income (SSI) in 2006:
- Total number of recipients: 1,989
- Number of aged recipients: 212
- Number of blind and disabled recipients: 1,777
- Number of recipients under 18: 462
- Number of recipients between 18 and 64: 1,183
- Number of recipients older than 64: 344
- Number of recipients also receiving OASDI: 600
- Amount of payments (thousands of dollars): 927
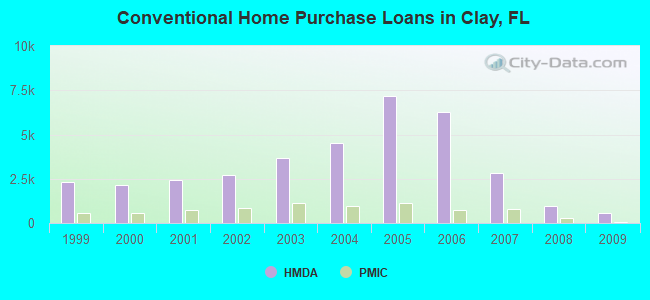
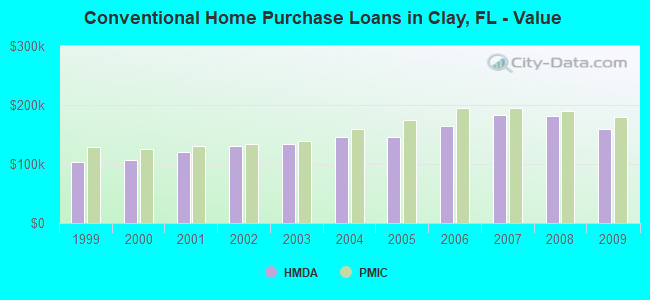
| Home Mortgage Disclosure Act Aggregated Statistics For Year 2009 (Based on 20 full tracts) | ||||||||||||||
| A) FHA, FSA/RHS & VA Home Purchase Loans | B) Conventional Home Purchase Loans | C) Refinancings | D) Home Improvement Loans | E) Loans on Dwellings For 5+ Families | F) Non-occupant Loans on < 5 Family Dwellings (A B C & D) | G) Loans On Manufactured Home Dwelling (A B C & D) | ||||||||
|---|---|---|---|---|---|---|---|---|---|---|---|---|---|---|
| Number | Average Value | Number | Average Value | Number | Average Value | Number | Average Value | Number | Average Value | Number | Average Value | Number | Average Value | |
| LOANS ORIGINATED | 1,408 | $172,693 | 559 | $160,114 | 3,005 | $169,398 | 196 | $68,658 | 1 | $8,575,000 | 180 | $137,261 | 164 | $90,890 |
| APPLICATIONS APPROVED, NOT ACCEPTED | 79 | $159,924 | 56 | $144,875 | 262 | $178,481 | 18 | $41,389 | 0 | $0 | 19 | $112,263 | 26 | $75,231 |
| APPLICATIONS DENIED | 264 | $158,568 | 154 | $141,344 | 1,389 | $171,730 | 170 | $46,100 | 0 | $0 | 124 | $131,000 | 148 | $76,351 |
| APPLICATIONS WITHDRAWN | 169 | $157,112 | 108 | $161,657 | 1,022 | $178,259 | 65 | $85,785 | 0 | $0 | 53 | $142,981 | 63 | $95,619 |
| FILES CLOSED FOR INCOMPLETENESS | 28 | $151,214 | 44 | $156,773 | 268 | $188,175 | 9 | $66,556 | 0 | $0 | 18 | $182,000 | 15 | $77,200 |
| Private Mortgage Insurance Companies Aggregated Statistics For Year 2009 (Based on 20 full tracts) | ||||||||
| A) Conventional Home Purchase Loans | B) Refinancings | C) Non-occupant Loans on < 5 Family Dwellings (A & B) | D) Loans On Manufactured Home Dwelling (A & B) | |||||
|---|---|---|---|---|---|---|---|---|
| Number | Average Value | Number | Average Value | Number | Average Value | Number | Average Value | |
| LOANS ORIGINATED | 60 | $180,500 | 40 | $194,750 | 0 | $0 | 1 | $99,000 |
| APPLICATIONS APPROVED, NOT ACCEPTED | 23 | $219,522 | 22 | $210,591 | 1 | $257,000 | 0 | $0 |
| APPLICATIONS DENIED | 5 | $225,200 | 4 | $211,250 | 0 | $0 | 0 | $0 |
| APPLICATIONS WITHDRAWN | 7 | $217,857 | 0 | $0 | 2 | $238,000 | 0 | $0 |
| FILES CLOSED FOR INCOMPLETENESS | 4 | $150,750 | 0 | $0 | 2 | $104,000 | 0 | $0 |
| Most common first names in Clay County, FL among deceased individuals | ||
| Name | Count | Lived (average) |
|---|---|---|
| John | 610 | 74.7 years |
| William | 575 | 73.5 years |
| James | 567 | 71.1 years |
| Mary | 469 | 79.5 years |
| Robert | 449 | 72.2 years |
| Charles | 363 | 76.1 years |
| George | 300 | 76.2 years |
| Joseph | 242 | 74.3 years |
| Dorothy | 204 | 77.6 years |
| Margaret | 198 | 79.5 years |
| Most common last names in Clay County, FL among deceased individuals | ||
| Last name | Count | Lived (average) |
|---|---|---|
| Smith | 236 | 74.5 years |
| Johnson | 173 | 75.4 years |
| Williams | 149 | 74.9 years |
| Brown | 142 | 73.8 years |
| Davis | 118 | 75.8 years |
| Jones | 113 | 75.8 years |
| Miller | 109 | 77.1 years |
| Thomas | 89 | 72.5 years |
| White | 85 | 73.7 years |
| Taylor | 84 | 74.7 years |
| Businesses in Clay County, FL | ||||
| Name | Count | Name | Count | |
|---|---|---|---|---|
| AT&T | 4 | Little Caesars Pizza | 2 | |
| Academy Sports + Outdoors | 1 | Lowe's | 2 | |
| Ace Hardware | 4 | Marriott | 2 | |
| Advance Auto Parts | 5 | Marshalls | 1 | |
| Aeropostale | 1 | MasterBrand Cabinets | 3 | |
| American Eagle Outfitters | 1 | Maurices | 1 | |
| Applebee's | 1 | McDonald's | 9 | |
| Arby's | 2 | Men's Wearhouse | 1 | |
| AutoZone | 2 | New Balance | 1 | |
| Baskin-Robbins | 1 | New York & Co | 1 | |
| Bath & Body Works | 1 | Nike | 17 | |
| Best Western | 1 | OfficeMax | 1 | |
| Blockbuster | 2 | Old Navy | 1 | |
| Budget Car Rental | 1 | Outback | 1 | |
| Burger King | 4 | Outback Steakhouse | 1 | |
| CVS | 6 | Pac Sun | 1 | |
| Casual Male XL | 1 | Panda Express | 2 | |
| Catherines | 1 | Panera Bread | 1 | |
| Charlotte Russe | 1 | Papa John's Pizza | 4 | |
| Chevrolet | 2 | Payless | 1 | |
| Chick-Fil-A | 3 | Penske | 1 | |
| ColorTyme | 1 | Pizza Hut | 4 | |
| Comfort Inn | 1 | Popeyes | 1 | |
| Cracker Barrel | 1 | Publix Super Markets | 6 | |
| Curves | 2 | Quiznos | 1 | |
| DHL | 1 | RadioShack | 4 | |
| Dairy Queen | 2 | Red Lobster | 1 | |
| Days Inn | 1 | Rodeway Inn | 1 | |
| Decora Cabinetry | 1 | Rooms To Go | 2 | |
| Discount Tire | 3 | Ruby Tuesday | 2 | |
| Domino's Pizza | 4 | Rue21 | 1 | |
| Dunkin Donuts | 4 | SONIC Drive-In | 5 | |
| Express | 1 | Sears | 3 | |
| FedEx | 17 | Sephora | 1 | |
| Finish Line | 1 | Shoe Carnival | 2 | |
| Firestone Complete Auto Care | 2 | Sleep Inn | 1 | |
| Foot Locker | 1 | Spencer Gifts | 1 | |
| Ford | 1 | Sprint Nextel | 6 | |
| Fredericks Of Hollywood | 1 | Staples | 1 | |
| GNC | 3 | Starbucks | 4 | |
| GameStop | 5 | Steak 'n Shake | 2 | |
| H&R Block | 9 | Suburban | 1 | |
| Hardee's | 4 | Subway | 13 | |
| Havertys Furniture | 1 | Super 8 | 1 | |
| Hilton | 1 | T-Mobile | 7 | |
| Holiday Inn | 1 | T.G.I. Driday's | 1 | |
| Hollister Co. | 1 | Taco Bell | 2 | |
| Home Depot | 3 | Target | 2 | |
| Hot Topic | 1 | Tire Kingdom | 5 | |
| IHOP | 2 | Toys"R"Us | 1 | |
| InTown Suites | 1 | True Value | 1 | |
| JCPenney | 1 | U-Haul | 12 | |
| Jimmy John's | 2 | UPS | 20 | |
| Jones New York | 2 | Vans | 2 | |
| Journeys | 1 | Verizon Wireless | 3 | |
| Justice | 1 | Victoria's Secret | 1 | |
| KFC | 2 | Waffle House | 1 | |
| Kmart | 1 | Walgreens | 6 | |
| Kohl's | 1 | Walmart | 3 | |
| Kroger | 1 | YMCA | 3 | |
| LensCrafters | 1 | |||
Clay County on our top lists:
- #67 on the list of "Top 101 counties with highest percentage of residents voting for Romney (Republican) in the 2012 Presidential Election (pop. 50,000+)"
- #73 on the list of "Top 101 counties with the highest percentage of residents relocating to other counties in 2011 (pop. 50,000+)"
- #75 on the list of "Top 101 counties with the highest percentage of residents relocating from foreign countries between 2010 and 2011 (pop. 50,000+)"
- #79 on the list of "Top 101 counties with the largest decrease in the number of births per 1000 residents 2000-2006 to 2007-2013 (pop 50,000+)"
- #80 on the list of "Top 101 counties with the highest percentage of residents relocating to foreign countries in 2011 (pop. 50,000+)"
- #96 on the list of "Top 101 counties with the highest percentage of residents relocating from other counties between 2010 and 2011 (pop. 50,000+)"