Estimated zip code population in 2022: 1,265 Zip code population in 2010: 1,766 Zip code population in 2000: 1,473
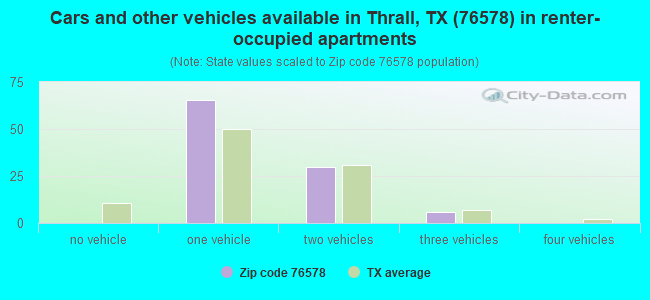
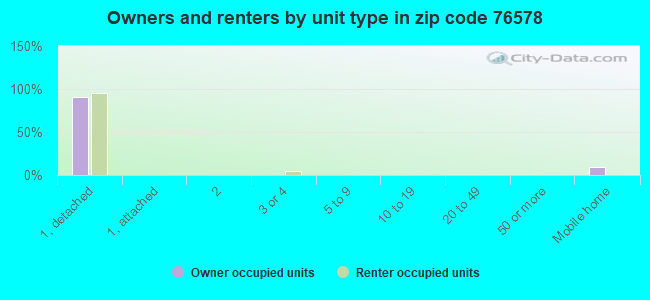
Houses and condos: 599 Renter-occupied apartments: 101
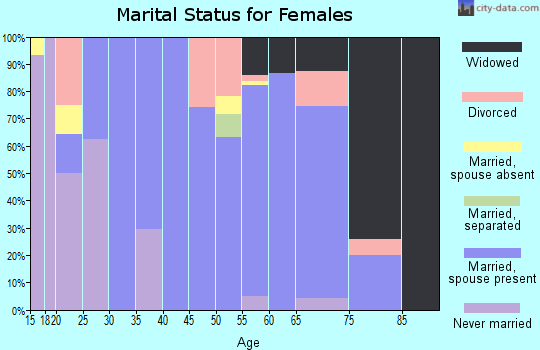
% of renters here:
21%
State:
38%
March 2022 cost of living index in zip code 76578: 80.0 (low, U.S. average is 100)
Land area: 75.1 sq. mi. Water area: 1.0 sq. mi.
Population density: 17 people per square mile
(very low).
OSM Map
General Map
Google Map
MSN Map
OSM Map
General Map
Google Map
MSN Map
OSM Map
General Map
Google Map
MSN Map
OSM Map
General Map
Google Map
MSN Map
Please wait while loading the map...
Real estate property taxes paid for housing units in 2022:
This zip code:
0.9% ($2,440)
Texas:
1.5% ($4,050)
Median real estate property taxes paid for housing units with mortgages in 2022: $2,650 (0.7%) Median real estate property taxes paid for housing units with no mortgage in 2022: $2,273 (1.1%)
Averages for the 2020 tax year for zip code 76578, filed in 2021:
Average Adjusted Gross Income (AGI) in 2020: $71,636 (Individual Income Tax Returns)
Here:
$71,636
State:
$77,054
Salary/wage: $63,447 (reported on 85.1% of returns)
Here:
$63,447
State:
$62,766
(% of AGI for various income ranges: 1115.3% for AGIs below $25k, 3678.4% for AGIs $25k-50k, 6460.0% for AGIs $50k-75k, 9660.0% for AGIs $75k-100k, 16438.0% for AGIs $100k-200k)
Taxable interest for individuals: $840 (reported on 28.7% of returns)
This zip code:
$840
Texas:
$2,665
(% of AGI for various income ranges: 7.9% for AGIs below $25k, 3.7% for AGIs $25k-50k, 18.9% for AGIs $50k-75k, 60.0% for AGIs $75k-100k, 102.0% for AGIs $100k-200k)
Ordinary dividends: $3,070 (reported on 11.5% of returns)
Here:
$3,070
State:
$10,044
(% of AGI for various income ranges: 14.7% for AGIs $25k-50k, 147.0% for AGIs $100k-200k)
Net capital gain/loss in AGI: +$15,055 (reported on 12.6% of returns)
Here:
+$15,055
State:
+$39,590
(% of AGI for various income ranges: 23.7% for AGIs $25k-50k, 491.0% for AGIs $100k-200k)
Profit/loss from business: +$15,600 (reported on 18.4% of returns)
Here:
+$15,600
State:
+$10,888
(% of AGI for various income ranges: 177.9% for AGIs below $25k, 223.7% for AGIs $25k-50k, 402.2% for AGIs $50k-75k, 1371.0% for AGIs $100k-200k)
Taxable individual retirement arrangement distribution: $12,267 (reported on 6.9% of returns)
76578:
$12,267
Texas:
$24,740
(% of AGI for various income ranges: 121.6% for AGIs $25k-50k, 841.7% for AGIs $75k-100k)
Total itemized deductions: $29,525 (reported on 4.6% of returns)
Here:
$29,525
State:
$40,428
(% of AGI for various income ranges: 1181.0% for AGIs $100k-200k)
Charity contributions: $5,300 (reported on 3.4% of returns)
Here:
$5,300
State:
$18,201
(% of AGI for various income ranges: 159.0% for AGIs $100k-200k)
Taxes paid: $6,875 (reported on 4.6% of returns)
76578:
$6,875
State:
$7,821
(% of AGI for various income ranges: 275.0% for AGIs $100k-200k)
Earned income credit: $2,327 (reported on 17.2% of returns)
Here:
$2,327
State:
$2,584
(% of AGI for various income ranges: 96.8% for AGIs below $25k, 86.8% for AGIs $25k-50k)
Percentage of individuals using paid preparers for their 2020 taxes: 92.0%
Here:
92%
State:
92%
(% for various income ranges: 92.0% for AGIs below $25k, 91.3% for AGIs $25k-50k, 91.7% for AGIs $50k-75k, 87.5% for AGIs $75k-100k, 93.3% for AGIs $100k-200k, 100.0% for AGIs over 200k)
Averages for the 2012 tax year for zip code 76578, filed in 2013:
Average Adjusted Gross Income (AGI) in 2012: $46,532 (Individual Income Tax Returns)
Here:
$46,532
State:
$65,384
Salary/wage: $43,098 (reported on 83.6% of returns)
Here:
$43,098
State:
$52,524
(% of AGI for various income ranges: 79.6% for AGIs below $25k, 77.3% for AGIs $25k-50k, 80.3% for AGIs $50k-75k, 80.0% for AGIs $75k-100k, 74.1% for AGIs $100k-200k)
Taxable interest for individuals: $785 (reported on 27.4% of returns)
This zip code:
$785
Texas:
$2,372
(% of AGI for various income ranges: 0.6% for AGIs below $25k, 0.5% for AGIs $25k-50k, 0.9% for AGIs $50k-75k, 0.4% for AGIs $100k-200k)
Ordinary dividends: $1,325 (reported on 11.0% of returns)
Here:
$1,325
State:
$9,721
Net capital gain/loss in AGI: +$4,757 (reported on 9.6% of returns)
Here:
+$4,757
State:
+$35,319
Profit/loss from business: +$9,000 (reported on 16.4% of returns)
Here:
+$9,000
State:
+$13,732
(% of AGI for various income ranges: 6.2% for AGIs below $25k, 12.0% for AGIs $25k-50k, 0.8% for AGIs $75k-100k)
Taxable individual retirement arrangement distribution: $10,286 (reported on 9.6% of returns)
76578:
$10,286
Texas:
$19,511
Total itemized deductions: $18,636 (20% of AGI, reported on 15.1% of returns)
Here:
$18,636
State:
$24,724
Here:
19.6% of AGI
State:
15.9% of AGI
(% of AGI for various income ranges: 8.3% for AGIs $25k-50k, 10.0% for AGIs $50k-75k, 7.2% for AGIs $100k-200k)
Charity contributions: $2,800 (reported on 11.0% of returns)
Here:
$2,800
State:
$6,808
Taxes paid: $4,627 (reported on 15.1% of returns)
76578:
$4,627
State:
$6,921
(% of AGI for various income ranges: 1.3% for AGIs $25k-50k, 2.3% for AGIs $50k-75k, 2.3% for AGIs $100k-200k)
Earned income credit: $2,656 (reported on 21.9% of returns)
Here:
$2,656
State:
$2,570
(% of AGI for various income ranges: 8.2% for AGIs below $25k, 1.5% for AGIs $25k-50k)
Percentage of individuals using paid preparers for their 2012 taxes: 45.2%
Here:
45%
State:
51%
(% for various income ranges: 41.9% for AGIs below $25k, 50.0% for AGIs $25k-50k, 40.0% for AGIs $50k-75k, 50.0% for AGIs $75k-100k, 50.0% for AGIs $100k-200k)
Averages for the 2004 tax year for zip code 76578, filed in 2005:
Average Adjusted Gross Income (AGI) in 2004: $36,687 (Individual Income Tax Returns)
Here:
$36,687
State:
$47,881
Salary/wage: $36,844 (reported on 85.2% of returns)
Here:
$36,844
State:
$41,947
(% of AGI for various income ranges: 99.7% for AGIs below $10k, 80.8% for AGIs $10k-25k, 87.1% for AGIs $25k-50k, 82.2% for AGIs $50k-75k, 90.1% for AGIs $75k-100k, 86.5% for AGIs over 100k)
Taxable interest for individuals: $603 (reported on 37.0% of returns)
This zip code:
$603
Texas:
$2,255
(% of AGI for various income ranges: 2.0% for AGIs below $10k, 1.5% for AGIs $10k-25k, 0.6% for AGIs $25k-50k, 0.5% for AGIs $50k-75k, 0.1% for AGIs $75k-100k, 0.3% for AGIs over 100k)
Taxable dividends: $478 (reported on 10.9% of returns)
Here:
$478
State:
$4,261
(% of AGI for various income ranges: 0.3% for AGIs $10k-25k, 0.0% for AGIs $25k-50k, 0.2% for AGIs $50k-75k, 0.3% for AGIs $75k-100k)
Net capital gain/loss: +$1,366 (reported on 11.2% of returns)
Here:
+$1,366
State:
+$16,110
(% of AGI for various income ranges: -0.2% for AGIs $10k-25k, 0.7% for AGIs $25k-50k, 0.9% for AGIs $50k-75k, 0.1% for AGIs over 100k)
Profit/loss from business: +$4,800 (reported on 11.8% of returns)
Here:
+$4,800
State:
+$11,013
(% of AGI for various income ranges: 8.6% for AGIs below $10k, 6.4% for AGIs $10k-25k, 0.2% for AGIs $25k-50k, 2.1% for AGIs $50k-75k, -0.5% for AGIs $75k-100k)
Total itemized deductions: $16,788 (24% of AGI, reported on 18.6% of returns)
Here:
$16,788
State:
$19,631
Here:
24.1% of AGI
State:
18.9% of AGI
(% of AGI for various income ranges: 5.1% for AGIs $10k-25k, 6.1% for AGIs $25k-50k, 13.0% for AGIs $50k-75k, 9.4% for AGIs $75k-100k, 9.3% for AGIs over 100k)
Charity contributions deductions: $2,512 (3% of AGI, reported on 13.3% of returns)
Here:
$2,512
State:
$4,753
Here:
3.4% of AGI
State:
4.2% of AGI
Total tax: $4,414 (reported on 72.2% of returns)
76578:
$4,414
State:
$9,058
(% of AGI for various income ranges: 2.8% for AGIs below $10k, 3.8% for AGIs $10k-25k, 6.6% for AGIs $25k-50k, 7.8% for AGIs $50k-75k, 10.7% for AGIs $75k-100k, 16.8% for AGIs over 100k)
Earned income credit: $1,815 (reported on 18.8% of returns)
Here:
$1,815
State:
$2,024
Percentage of individuals using paid preparers for their 2004 taxes: 55.8%
Here:
56%
State:
57%
(% for various income ranges: 48.2% for AGIs below $10k, 59.5% for AGIs $10k-25k, 53.6% for AGIs $25k-50k, 58.7% for AGIs $50k-75k, 58.3% for AGIs $75k-100k, 63.0% for AGIs over 100k)
Household received Food Stamps/SNAP in the past 12 months: 142 Household did not receive Food Stamps/SNAP in the past 12 months: 347
Women who had a birth in the past 12 months: 13 (13 now married, 0 unmarried) Women who did not have a birth in the past 12 months: 277 (95 now married, 182 unmarried)
Housing units in zip code 76578 with a mortgage: 228 (10 second mortgage, 9 home equity loan) Houses without a mortgage: 5
Median monthly owner costs for units with a mortgage: $1,594 Median monthly owner costs for units without a mortgage: $706
Residents with income below the poverty level in 2022:
This zip code:
4.4%
Whole state:
14.0%
Residents with income below 50% of the poverty level in 2022:
This zip code:
0.6%
Whole state:
7.4%
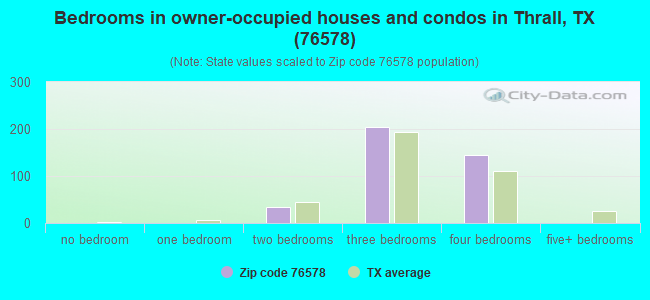
Median number of rooms in houses and condos:
Here:
6.0
State:
6.3
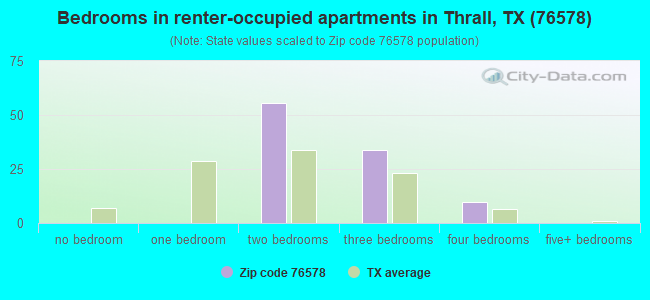
Median number of rooms in apartments:
Here:
4.9
State:
4.0
Notable locations in this zip code not listed on our city pages
Reservoirs: Winterrowd Lake (A), Brenni Lake (B), Site Number Seventeen (C), Site Number Twenty (D), Site Number Twentyone (E), Site Number Twentytwo (F), Site Number Twentythree (G), Soil Conservation Service Site 8 Reservoir (H). Display/hide their locations on the map
Size of family households: 168 2-persons, 134 3-persons, 38 4-persons, 38 5-persons, 7 7-or-more-persons
Size of nonfamily households: 80 1-person, 19 2-persons
122 married couples with children.
59 single-parent households (24 men, 35 women).
87.1% of residents of 76578 zip code speak English at home.
12.3% of residents speak Spanish at home (68% very well, 20% well, 13% not well).
0.3% of residents speak other Indo-European language at home (100% very well).
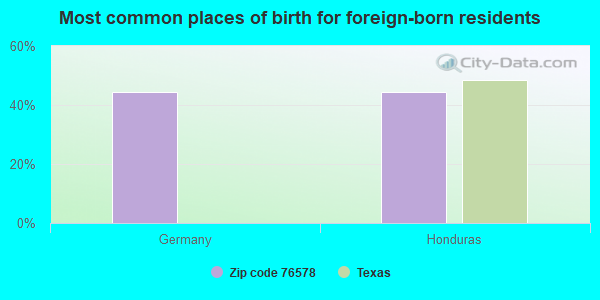
Foreign born population: 9 (0.8%) (79.6% of them are naturalized citizens)
This zip code:
0.8%
Whole state:
17.2%
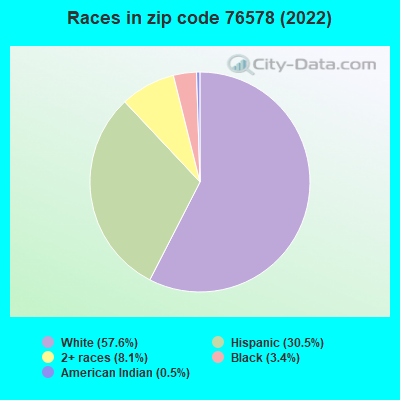
44%Germany
44%Honduras
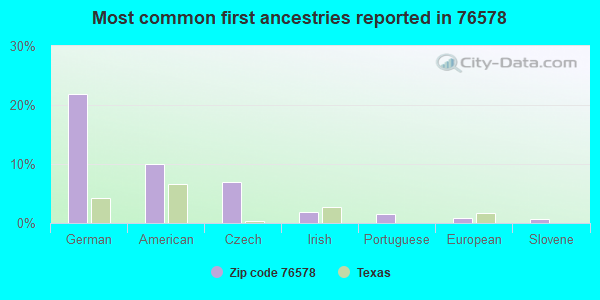
22%German
10%American
7%Czech
2%Irish
1%Portuguese
1%European
1%Slovene
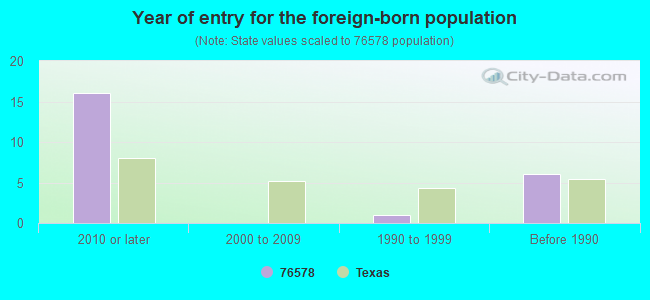
Year of entry for the foreign-born population
162010 or later
02000 to 2009
11990 to 1999
6Before 1990
Housing units lacking complete plumbing facilities: 4.0% Housing units lacking complete kitchen facilities: 0.9%
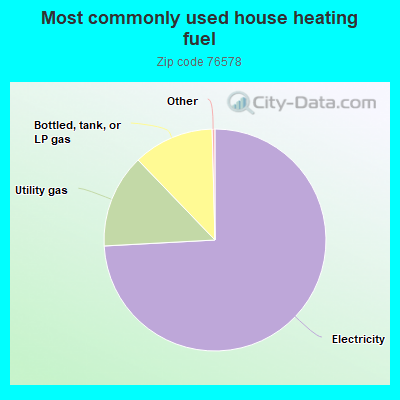
74.3%Electricity
13.7%Utility gas
11.8%Bottled, tank, or LP gas
Population in 1990: 852. Population change in the 1990s: +621 (+72.9%).
Place of birth for U.S.-born residents:
This state: 1,009
Northeast: 20
Midwest: 81
South: 33
West: 91
56% of the 76578 zip code residents lived in the same house 5 years ago. Out of people who lived in different houses, 53% lived in this county. Out of people who lived in different counties, 50% lived in Texas.
83% of the 76578 zip code residents lived in the same house 1 year ago. Out of people who lived in different houses, 7% moved from this county. Out of people who lived in different houses, 35% moved from different county within same state. Out of people who lived in different houses, 66% moved from different state.
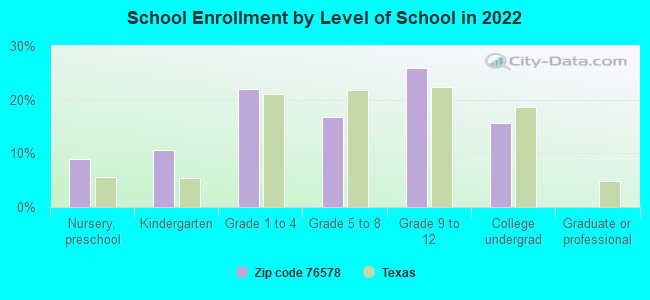
Private vs. public school enrollment:
Students in private schools in grades 1 to 8 (elementary and middle school): 1
Here:
2.8%
Texas:
8.8%
Students in private schools in grades 9 to 12 (high school):
Here:
0.0%
Texas:
8.0%
Students in private undergraduate colleges: 9
Here:
33.7%
Texas:
16.2%
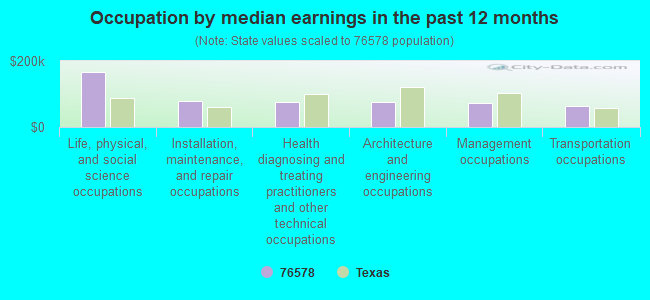
Occupation by median earnings in the past 12 months ($)
166,188Life, physical, and social science occupations
79,218Installation, maintenance, and repair occupations
76,126Health diagnosing and treating practitioners and other technical occupations
75,428Architecture and engineering occupations
71,286Management occupations
64,179Transportation occupations
Companies with federal contracts located in this zip code:
CONSTRUCTION RENT-A- FENCE INC (102 S MAIN in THRALL, TX; small business) : $8,211 in 5 contractsfrom 2003 to 2006
Contracts for Installation of Equipment -- Construction and Building Materials by Army Signed by year:2000: $0; 2001: $0; 2002: $0; 2003: $6,162; 2004: $2,875; 2005: $0; 2006: -$826.
Biggest contracts:
$3,287 with Army for Installation of Equipment -- Construction and Building Materials. Signed on 2003-03-19. Completion date: 2003-09-18.
$2,875, same as above.Signed on 2003-03-19. Completion date: 2003-09-18.
$2,396, same as above.Signed on 2004-07-20. Completion date: 2003-09-18.
$479, same as above.Signed on 2004-03-19. Completion date: 2003-09-18.
Top industries in this zip code by the number of employees in 2005:
Real Estate and Rental and Leasing: General Rental Centers (20-49 employees: 1 establishment)
Other Services (except Public Administration): Religious Organizations (1-4: 2)
Fatal accident statistics in 2013:
Fatal accident count: 1
Vehicles involved in fatal accidents: 1
Fatal accidents caused by drunken drivers: 1
Fatalities: 1
Persons involved in fatal accidents: 1
Pedestrians involved in fatal accidents: 0
Fatal accident statistics in 2011:
Fatal accident count: 1
Vehicles involved in fatal accidents: 1
Fatal accidents caused by drunken drivers: 1
Fatalities: 1
Persons involved in fatal accidents: 1
Pedestrians involved in fatal accidents: 0
Home Mortgage Disclosure Act Aggregated Statistics For Year 2009 (Based on 2 partial tracts)
A) FHA, FSA/RHS & VA Home Purchase Loans
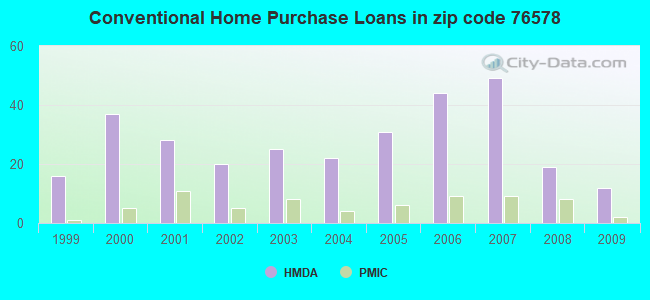
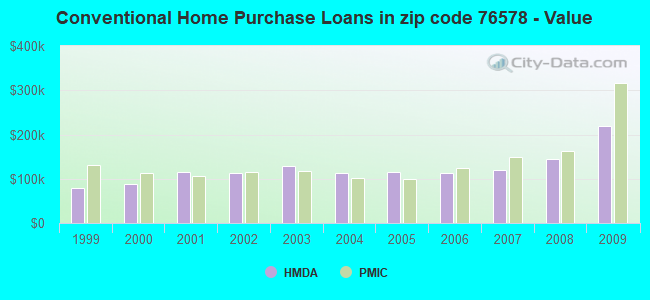
B) Conventional Home Purchase Loans
C) Refinancings
D) Home Improvement Loans
F) Non-occupant Loans on < 5 Family Dwellings (A B C & D)
G) Loans On Manufactured Home Dwelling (A B C & D)
Number
Average Value
Number
Average Value
Number
Average Value
Number
Average Value
Number
Average Value
Number
Average Value
LOANS ORIGINATED
7
$167,213
12
$220,198
24
$149,436
9
$39,572
2
$75,350
3
$88,303
APPLICATIONS APPROVED, NOT ACCEPTED
2
$144,285
1
$248,690
5
$98,938
1
$142,590
0
$0
3
$40,773
APPLICATIONS DENIED
1
$80,420
4
$101,032
15
$153,046
1
$30,410
0
$0
4
$73,155
APPLICATIONS WITHDRAWN
3
$158,587
2
$95,965
9
$186,971
1
$24,330
1
$24,330
1
$108,800
FILES CLOSED FOR INCOMPLETENESS
0
$0
1
$37,840
3
$219,410
1
$67,580
0
$0
1
$37,840
Aggregated Statistics For Year 2008 (Based on 2 partial tracts)
A) FHA, FSA/RHS & VA Home Purchase Loans
B) Conventional Home Purchase Loans
C) Refinancings
D) Home Improvement Loans
F) Non-occupant Loans on < 5 Family Dwellings (A B C & D)
G) Loans On Manufactured Home Dwelling (A B C & D)
Number
Average Value
Number
Average Value
Number
Average Value
Number
Average Value
Number
Average Value
Number
Average Value
LOANS ORIGINATED
3
$174,807
19
$145,724
24
$112,352
9
$63,450
5
$120,022
6
$118,828
APPLICATIONS APPROVED, NOT ACCEPTED
1
$88,530
3
$54,967
2
$138,540
0
$0
0
$0
1
$37,170
APPLICATIONS DENIED
2
$125,360
5
$132,998
18
$123,033
9
$44,903
0
$0
5
$97,450
APPLICATIONS WITHDRAWN
1
$200,040
0
$0
9
$148,601
3
$23,653
0
$0
1
$236,530
FILES CLOSED FOR INCOMPLETENESS
0
$0
1
$281,810
1
$226,390
1
$57,440
0
$0
0
$0
Aggregated Statistics For Year 2007 (Based on 2 partial tracts)
A) FHA, FSA/RHS & VA Home Purchase Loans
B) Conventional Home Purchase Loans
C) Refinancings
D) Home Improvement Loans
F) Non-occupant Loans on < 5 Family Dwellings (A B C & D)
G) Loans On Manufactured Home Dwelling (A B C & D)
Number
Average Value
Number
Average Value
Number
Average Value
Number
Average Value
Number
Average Value
Number
Average Value
LOANS ORIGINATED
16
$134,442
49
$118,968
23
$117,883
6
$80,082
9
$128,327
8
$101,624
APPLICATIONS APPROVED, NOT ACCEPTED
1
$94,610
5
$59,200
7
$131,106
2
$51,025
1
$33,110
3
$42,350
APPLICATIONS DENIED
7
$115,369
9
$104,299
25
$95,369
18
$53,276
2
$53,390
8
$71,128
APPLICATIONS WITHDRAWN
1
$178,410
8
$143,270
14
$103,011
2
$55,415
1
$335,200
1
$86,500
FILES CLOSED FOR INCOMPLETENESS
0
$0
2
$168,610
5
$127,726
0
$0
1
$77,720
0
$0
Aggregated Statistics For Year 2006 (Based on 2 partial tracts)
A) FHA, FSA/RHS & VA Home Purchase Loans
B) Conventional Home Purchase Loans
C) Refinancings
D) Home Improvement Loans
F) Non-occupant Loans on < 5 Family Dwellings (A B C & D)
G) Loans On Manufactured Home Dwelling (A B C & D)
Number
Average Value
Number
Average Value
Number
Average Value
Number
Average Value
Number
Average Value
Number
Average Value
LOANS ORIGINATED
7
$106,487
44
$113,319
27
$134,484
14
$22,301
8
$81,771
7
$86,310
APPLICATIONS APPROVED, NOT ACCEPTED
0
$0
5
$85,016
4
$72,310
1
$27,710
1
$76,370
3
$43,703
APPLICATIONS DENIED
4
$103,735
5
$121,914
38
$114,655
12
$52,149
5
$115,426
3
$85,827
APPLICATIONS WITHDRAWN
4
$124,010
5
$96,640
20
$110,966
3
$69,833
2
$81,435
1
$172,330
FILES CLOSED FOR INCOMPLETENESS
0
$0
3
$72,087
4
$145,465
0
$0
1
$40,550
0
$0
Aggregated Statistics For Year 2005 (Based on 2 partial tracts)
A) FHA, FSA/RHS & VA Home Purchase Loans
B) Conventional Home Purchase Loans
C) Refinancings
D) Home Improvement Loans
F) Non-occupant Loans on < 5 Family Dwellings (A B C & D)
G) Loans On Manufactured Home Dwelling (A B C & D)
Number
Average Value
Number
Average Value
Number
Average Value
Number
Average Value
Number
Average Value
Number
Average Value
LOANS ORIGINATED
7
$117,686
31
$114,341
36
$104,749
6
$48,320
5
$121,508
7
$101,660
APPLICATIONS APPROVED, NOT ACCEPTED
1
$48,660
7
$105,231
7
$87,950
4
$71,635
0
$0
4
$76,702
APPLICATIONS DENIED
9
$105,800
10
$76,838
31
$90,186
5
$37,710
1
$158,140
7
$60,243
APPLICATIONS WITHDRAWN
1
$67,580
3
$64,877
22
$120,108
6
$174,807
0
$0
1
$104,070
FILES CLOSED FOR INCOMPLETENESS
0
$0
1
$32,440
7
$122,899
0
$0
1
$7,430
0
$0
Aggregated Statistics For Year 2004 (Based on 2 partial tracts)
A) FHA, FSA/RHS & VA Home Purchase Loans
B) Conventional Home Purchase Loans
C) Refinancings
D) Home Improvement Loans
F) Non-occupant Loans on < 5 Family Dwellings (A B C & D)
G) Loans On Manufactured Home Dwelling (A B C & D)
Number
Average Value
Number
Average Value
Number
Average Value
Number
Average Value
Number
Average Value
Number
Average Value
LOANS ORIGINATED
7
$92,584
22
$112,766
43
$116,175
13
$42,212
3
$35,593
7
$75,690
APPLICATIONS APPROVED, NOT ACCEPTED
1
$83,800
5
$42,710
9
$122,020
3
$94,160
1
$109,480
7
$47,596
APPLICATIONS DENIED
1
$66,230
13
$64,201
34
$101,688
7
$41,127
3
$86,277
6
$52,375
APPLICATIONS WITHDRAWN
1
$131,110
3
$115,337
27
$98,266
1
$50,680
2
$116,575
3
$60,597
FILES CLOSED FOR INCOMPLETENESS
0
$0
0
$0
5
$159,354
0
$0
0
$0
0
$0
Aggregated Statistics For Year 2003 (Based on 2 partial tracts)
A) FHA, FSA/RHS & VA Home Purchase Loans
B) Conventional Home Purchase Loans
C) Refinancings
D) Home Improvement Loans
F) Non-occupant Loans on < 5 Family Dwellings (A B C & D)
Number
Average Value
Number
Average Value
Number
Average Value
Number
Average Value
Number
Average Value
LOANS ORIGINATED
11
$109,234
25
$127,970
101
$119,429
3
$14,417
6
$116,688
APPLICATIONS APPROVED, NOT ACCEPTED
1
$35,820
5
$119,616
12
$102,383
1
$44,600
1
$66,900
APPLICATIONS DENIED
1
$25,000
7
$65,166
46
$91,380
5
$16,624
1
$16,900
APPLICATIONS WITHDRAWN
2
$93,260
1
$90,560
22
$101,124
1
$30,410
1
$109,480
FILES CLOSED FOR INCOMPLETENESS
1
$77,040
1
$64,200
7
$113,149
0
$0
0
$0
Aggregated Statistics For Year 2002 (Based on 2 partial tracts)
A) FHA, FSA/RHS & VA Home Purchase Loans
B) Conventional Home Purchase Loans
C) Refinancings
D) Home Improvement Loans
F) Non-occupant Loans on < 5 Family Dwellings (A B C & D)
Number
Average Value
Number
Average Value
Number
Average Value
Number
Average Value
Number
Average Value
LOANS ORIGINATED
9
$94,988
20
$112,453
57
$115,657
11
$18,308
2
$51,360
APPLICATIONS APPROVED, NOT ACCEPTED
1
$47,980
5
$115,426
11
$88,038
1
$30,410
1
$33,110
APPLICATIONS DENIED
4
$73,325
12
$82,053
18
$94,762
4
$27,708
2
$38,185
APPLICATIONS WITHDRAWN
2
$103,395
2
$73,325
21
$92,199
1
$30,410
0
$0
FILES CLOSED FOR INCOMPLETENESS
1
$54,740
2
$38,860
6
$132,682
0
$0
0
$0
Aggregated Statistics For Year 2001 (Based on 2 partial tracts)
A) FHA, FSA/RHS & VA Home Purchase Loans
B) Conventional Home Purchase Loans
C) Refinancings
D) Home Improvement Loans
F) Non-occupant Loans on < 5 Family Dwellings (A B C & D)
Number
Average Value
Number
Average Value
Number
Average Value
Number
Average Value
Number
Average Value
LOANS ORIGINATED
11
$93,137
28
$114,620
51
$109,665
10
$22,572
9
$150,102
APPLICATIONS APPROVED, NOT ACCEPTED
1
$118,940
9
$59,546
8
$97,400
1
$16,900
1
$21,630
APPLICATIONS DENIED
1
$108,800
22
$68,993
16
$96,978
3
$12,613
3
$56,767
APPLICATIONS WITHDRAWN
1
$110,830
3
$59,020
10
$142,797
1
$43,930
1
$254,100
FILES CLOSED FOR INCOMPLETENESS
0
$0
1
$324,380
3
$28,157
0
$0
1
$33,790
Aggregated Statistics For Year 2000 (Based on 2 partial tracts)
A) FHA, FSA/RHS & VA Home Purchase Loans
B) Conventional Home Purchase Loans
C) Refinancings
D) Home Improvement Loans
F) Non-occupant Loans on < 5 Family Dwellings (A B C & D)
Number
Average Value
Number
Average Value
Number
Average Value
Number
Average Value
Number
Average Value
LOANS ORIGINATED
7
$111,217
37
$88,859
14
$88,095
9
$19,523
3
$89,207
APPLICATIONS APPROVED, NOT ACCEPTED
2
$75,690
5
$92,990
3
$150,253
2
$26,355
0
$0
APPLICATIONS DENIED
2
$89,880
17
$60,345
9
$64,427
5
$17,842
1
$39,200
APPLICATIONS WITHDRAWN
1
$99,340
2
$80,080
3
$161,290
0
$0
0
$0
FILES CLOSED FOR INCOMPLETENESS
2
$85,825
3
$62,400
4
$64,540
0
$0
0
$0
Aggregated Statistics For Year 1999 (Based on 1 partial tract)
A) FHA, FSA/RHS & VA Home Purchase Loans
B) Conventional Home Purchase Loans
C) Refinancings
D) Home Improvement Loans
F) Non-occupant Loans on < 5 Family Dwellings (A B C & D)


 Nearest zip codes: 76577, 76574, 78615, 78947, 78650, 78621.
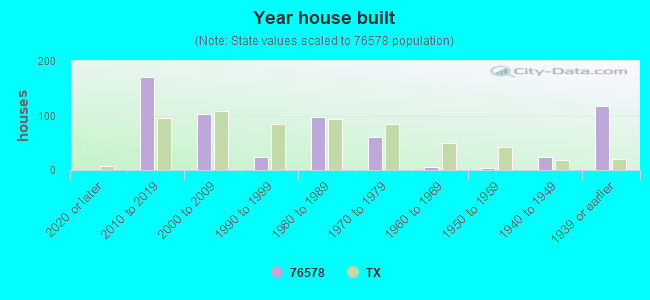


 : $8,211 in 5 contracts from 2003 to 2006